Article

Comparison of Different Electrochemical Methodologies for Electrode Reactions: A Case Study of Paracetamol

by
Zaheer Masood
1,2,*,
Haji Muhammad
2 and
Iftikhar Ahmed Tahiri
2
1
School of Sustainable Chemical, Biological, and Material Engineering, University of Oklahoma, Norman, OK 73019, USA
2
Department of Chemistry, Federal Urdu University of Arts, Sciences and Technology, Gulshan-e-Iqbal, Science Campus, Karachi 75300, Pakistan
*
Author to whom correspondence should be addressed.
Electrochem 2024, 5(1), 57-69; https://doi.org/10.3390/electrochem5010004
Submission received: 27 December 2023 / Revised: 16 January 2024 / Accepted: 26 January 2024 / Published: 31 January 2024

Abstract

:
Understanding electrochemical reactions at the surface of electrodes requires the accurate calculation of key parameters—the transfer coefficient (α), diffusion coefficient (D0), and heterogeneous electron transfer rate constant (k0). The choice of method to calculate these parameters requires careful consideration based on the nature of the electrochemical reaction. In this study, we conducted the cyclic voltammetry of paracetamol to calculate the values of these parameters using different methods and present a comparative analysis. Our results demonstrate that the EpEp/2 equation for α and the modified Randles–Ševčík equation for D0 is particularly effective for the calculations of these two parameters. The Kochi and Gileadi methods are reliable alternatives for the calculation of k0. Nicholson and Shain’s method using the equation k0 = Ψ(πnD0/RT)1/2 gives the overestimated values of k0. However, the value of k0 calculated using the plot of ν−1/2 versus Ψ (from the Nicholson and Shain equation, where ν is scan rate) agrees well with the values calculated from the Kochi and Gilaedi methods. This study not only identifies optimal methodologies for quasi-reversible reactions but also contributes to a deeper understanding of electrochemical reactions involving complex electron transfer and coupled chemical reactions, which can be broadly applicable in various electrochemical studies.

1. Introduction

A deep insight into electrochemical reactions on the surface of electrodes is essential to understanding the processes in catalysis, electrolysis, batteries, sensors, and fuel cells [1,2,3,4,5,6,7,8,9,10,11,12,13,14]. Cyclic voltammetry—a simple, easy, and common technique—is a front-line tool to investigate reactions on electrode surfaces. Cyclic voltammetry is generally the first choice to test any material with potential application in these research areas for the determination of redox potentials and rates (for heterogeneous electron transfer and coupled chemical reactions) [15,16,17,18,19,20,21]. However, the selection of a feasible method to explore reactions at the electrode surface is essential because of the complex nature of these reactions, i.e., electron transfer with chemically coupled reactions [22,23]. No method is universal that works well for all kinds of reactions, hence requiring a careful choice of method depending on the nature of the reaction.
In electrochemical studies, the number of electrons transferred (n), the transfer coefficient (α), diffusion coefficient (D0), and heterogeneous electron transfer rate constant (k0) are essential parameters to explore reactions on the electrode surface. The transfer coefficient is the symmetry factor that affects the activation energy at the electrode surface, hence affecting the direction of the reaction. The diffusion coefficient is a transport parameter that is related to the transport of species toward and away from the surface of the electrode. The heterogeneous electron transfer rate constant indicates how fast or slow electron transfer happens. Overall, the electrode process depends on the transfer coefficient, diffusion coefficient, and rate of electron transfer [20,22,24,25,26,27].
Electrochemical reactions are classified into three broad categories, reversible, quasi-reversible, and irreversible, based on the value of the heterogeneous electron transfer rate constant (k0). The value of k0 defines the boundaries for these categories as follows: reversible k0 > 2 × 10⁻² cm/s, quasi-reversible k0 ranges from 2 × 10⁻² cm/s to 3 × 10⁻⁵ cm/s, and irreversible k0 is < 3 × 10⁻⁵ cm/s. In reversible reactions, oxidized/reduced species are stable enough at the time scale of the scan rate; in quasi-reversible reactions, these species generally undergo chemical reactions, but their rate is not fast enough to consume these species completely at the time scale of the scan rate. In irreversible reactions, these species undergo fast chemical reactions and completely transform into another chemical species, or these species are stable but do not transfer electrons (to or from the electrode) on the reverse potential scan. However, the reliability of the value of k0 depends on the accuracy of n, α, and D0. [20,27,28,29]
Here, in this study, we investigated paracetamol as an electroactive species using various electrochemical methods. We chose paracetamol due to its complexity of electron transfer and coupled chemical reactions during electrochemical processes [30,31]. We employed different methodologies to determine the values of α, D0, and k0, and calculated values were compared. Two different methods were employed to determine the values of α and D0. The Nicholson and Shain and Kochi and Gileadi methods were used to determine the k0. Furthermore, these parameters were validated using the digital simulation of cyclic voltammograms, and calculated values were compared.

2. Materials and Methods

LiClO4 bought from Merck (Darmstadt, Germany) and paracetamol from Glaxo Smith Klein Pharmaceuticals (PVT) Ltd. (Karachi, Pakistan). In total, 10 mL of 1 × 10⁻⁶ M of the paracetamol solution with 0.1 M of LiClO4 as a supporting electrolyte in deionized water was prepared and used. The working electrode was polished using 0.2 µm of aluminum powder provided by CHI Instruments. All solutions were purged with nitrogen gas for 15 min before running cyclic voltammetry.
Cyclic voltammetry was carried out at room temperature using a CHI 760D Electrochemical Workstation, operated by an Intel Core 2 Quad-Supported IBM computer with a Windows XP operating system. All the electrochemical experiments were performed in a conventional three-electrode cell. The following electrodes were used: glassy carbon (GC) as the working electrode, platinum as the counter electrode, and the saturated calomel electrode (SCE) as the reference electrode. The digital simulation was carried out through DigiSim software built into the CHI 760D electrochemical workstation. The working electrode was polished with aluminum powder before use. The surface area of the working electrode was 0.0706 cm2, as provided by CHI Instruments (Austin, TX, USA; Model No. CHI 104). All reported potentials are referenced to the SCE potential.

3. Results

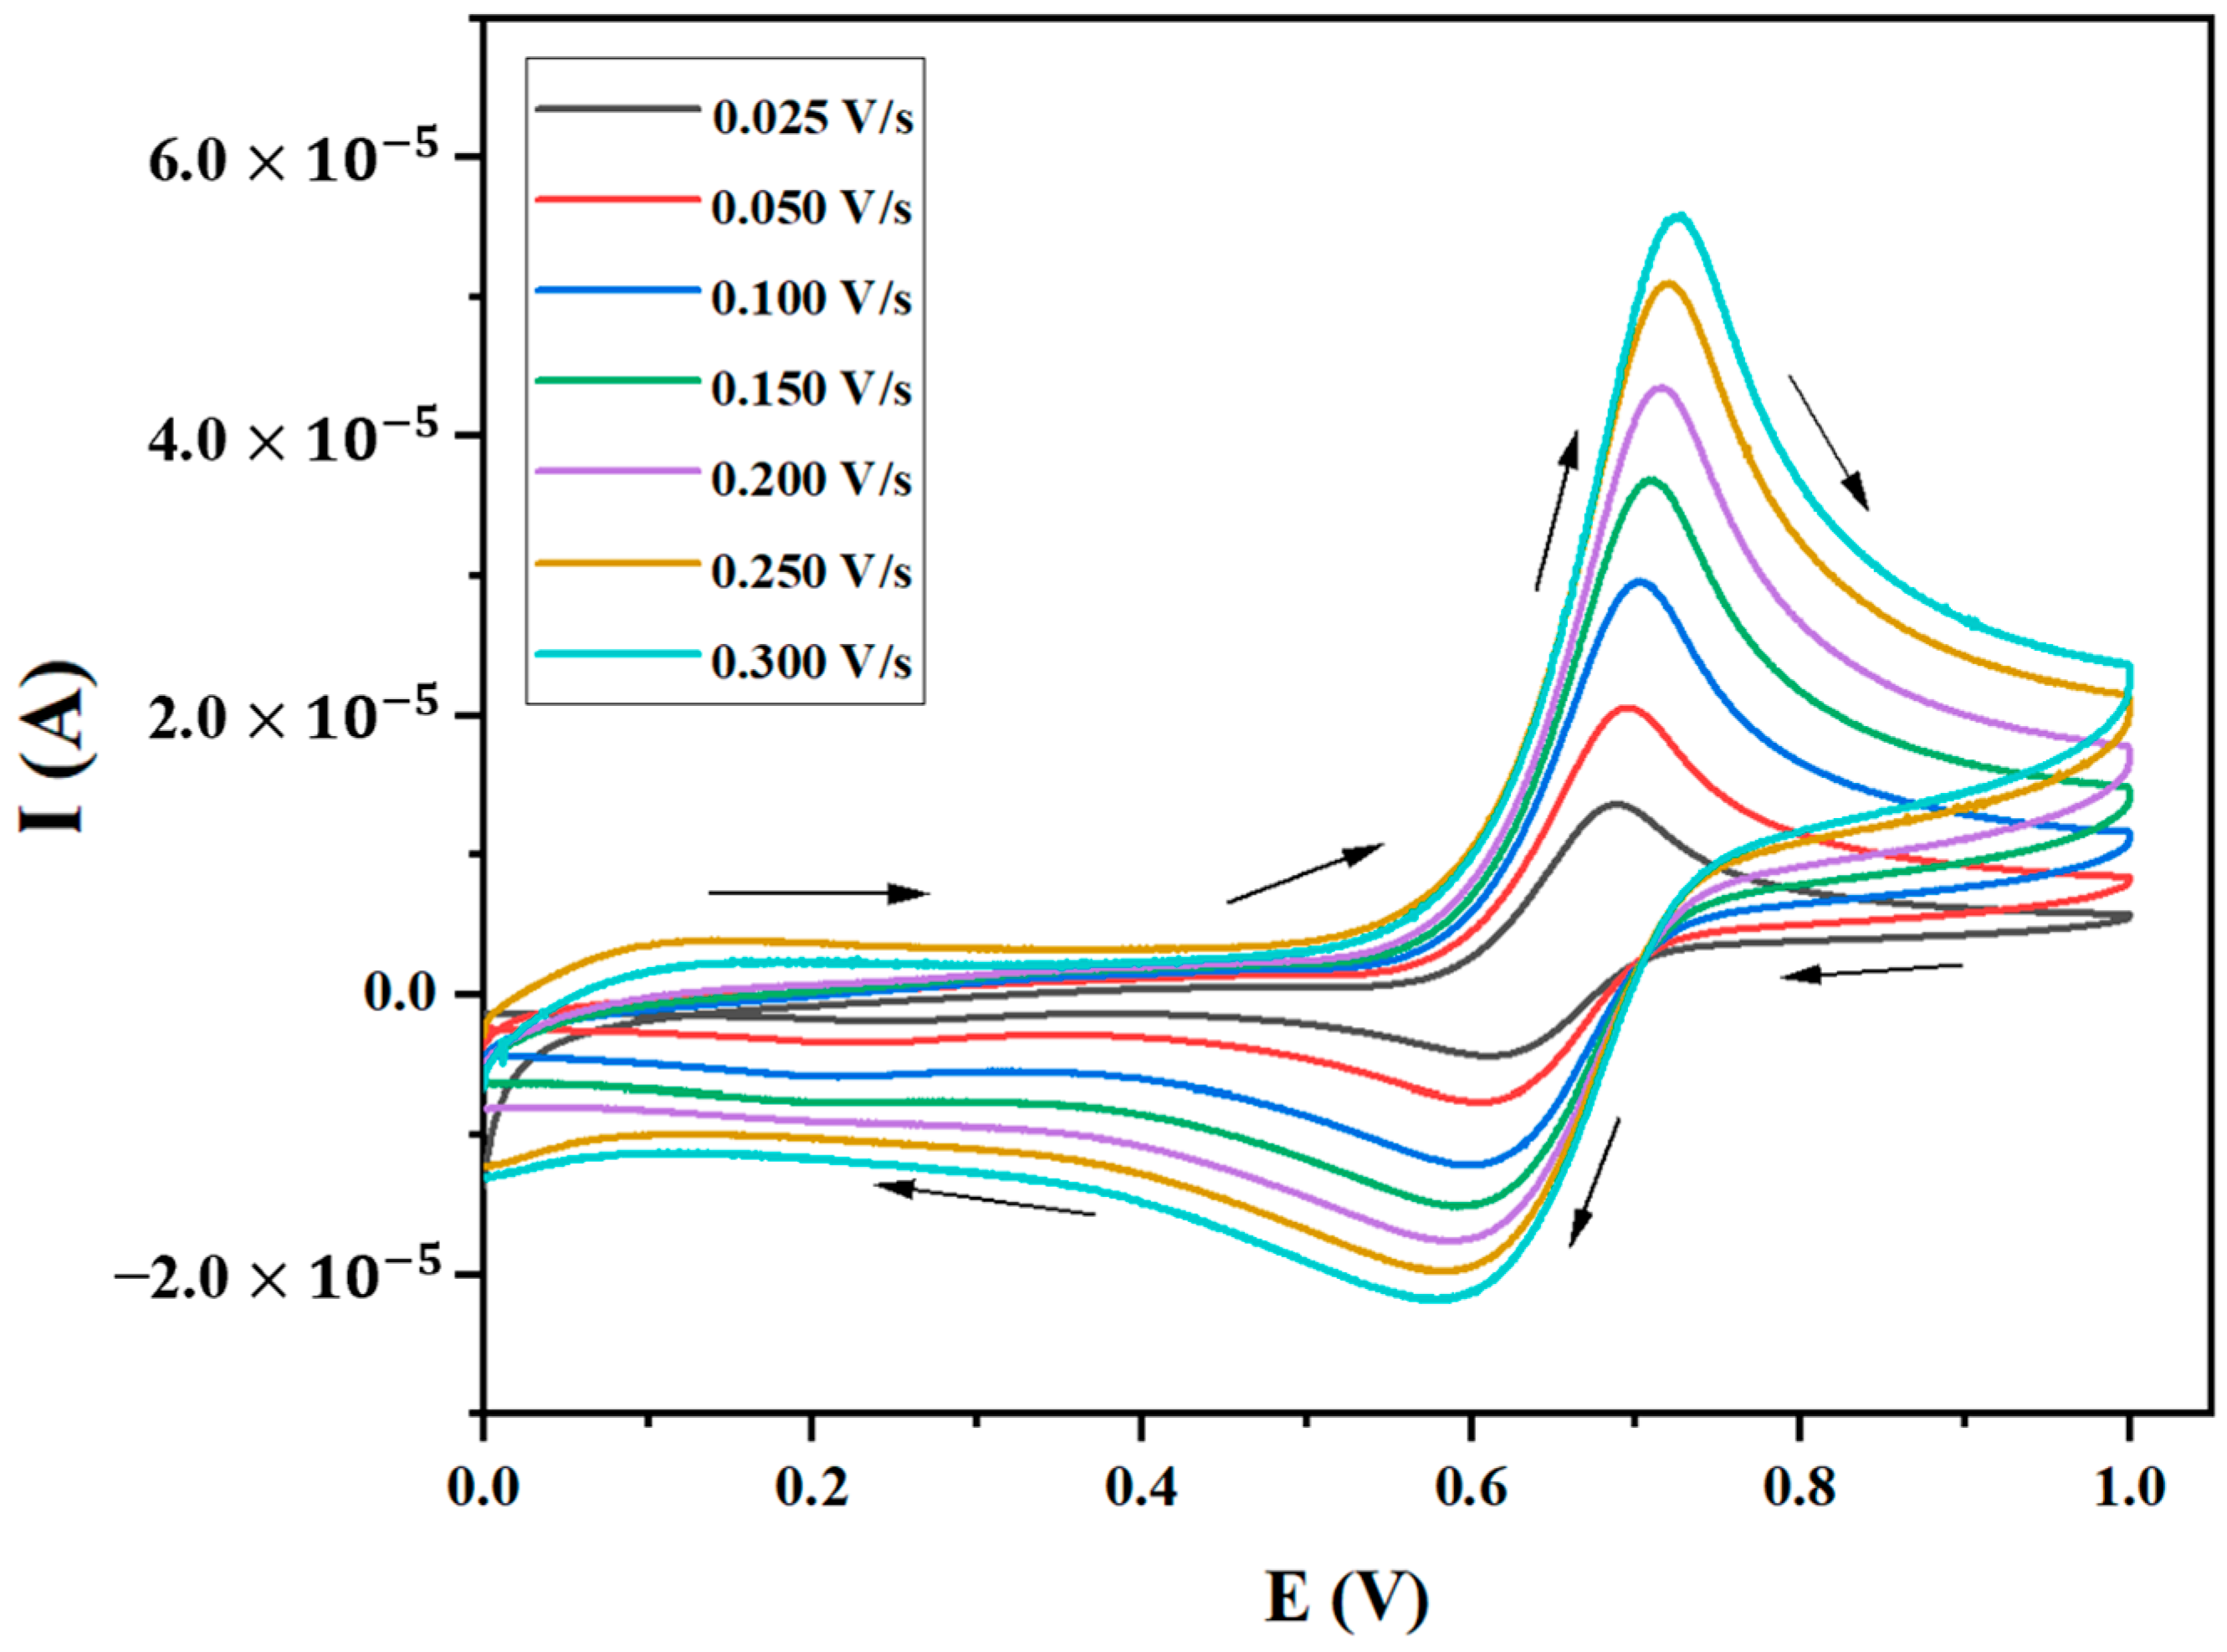
3.1. Cyclic Voltammetry of Paracetamol

Before starting with the results, it is essential to understand the basic parameters that can be directly obtained from a cyclic voltammogram. These basic parameters include the peak potentials for anodic (Epa) and cathodic (Epc) reactions, as well as the corresponding peak currents for anodic (Ipa) and cathodic (Ipc) processes. From these four foundational parameters, several kinetic and thermodynamic parameters are derived. (1) Formal potential (E1/2) is calculated as the absolute difference between Epc and Epa, divided by two (E1/2 = |EpcEpa|/2). The formal potential is also called standard reduction potential. (2) Peak separation (ΔEp), defined as the absolute difference between Epc and EpaEp = |EpcEpa|), is a parameter that is an immediate measure and shows the nature of the electron transfer process, distinguishing between reversible, quasi-reversible, or irreversible reactions. (3) The ratio of peak currents (Ipc/Ipa), the ratio between the anodic and cathodic peak currents that provide insights into chemically coupled reactions, is also an important criterion to evaluate the nature of electron transfer. A value near unity indicates that reduced/oxidized species are stable and there are no chemically coupled reactions. In contrast, a value less than unity indicates the presence of chemically coupled reactions, resulting in the consumption of reduced/oxidized species. Utilizing Epa, Epc, Ipa, Ipc, and E1/2, one can calculate the transfer coefficient and the diffusion coefficient. These coefficients are instrumental in determining the heterogeneous electron transfer rate constants. Such calculations are pivotal in understanding the electron transfer kinetics and the overall electrochemical behavior of the analyte under study.
Cyclic voltammograms of the paracetamol solution were taken at the scan rate of 0.025 V/s to 0.300 V/s with an incremental change of 0.025 V/s and are presented in Figure 1. The scan rate, Epa, Epc, Ipa, Ipc, ΔEp, E1/2, and (Ipc/Ipa), is presented in Table S1 of the Supplementary Information. The Epa was observed at 0.705 V at 0.025 V/s, which was shifted to 0.750 V at 0.300 V/s. The Epc shifted from 0.577 V to 0.564 V with the increase in the scan rate. The ΔEp increased from 0.128 V to 0.186 V as the scan rate was increased from 0.025 V/s to 0.300 V/s. An increase in ΔEp and a shift in peak potentials indicated the quasi-reversible nature of the electron transfer or higher uncompensated IR resistance. To check whether quasi-reversibility is attributed to slow electron transfer and not from higher uncompensated IR resistance, we plotted ΔEp vs. the sq. root of the scan rate as presented in Figure S1 of the Supplementary Information. A good regression with a linear trend indicates that ohmic resistance is negligible, and slow electron transfer is responsible for the quasi-reversibility of this process. Additionally, ΔEp is significantly higher than the peak separation of the reversible peak, i.e., 0.029 V for n = 2, (n = number of electron(s)), which shows the quasi-reversible nature of processes. Furthermore, Figure 1 clearly shows that the reverse peak is smaller than the forward peak. The ratio of Ipc/Ipa remains almost constant at 0.59 ± 0.03. The ratio of Ipc/Ipa has less than unity and a smaller reverse peak, both indicating the presence of chemically coupled reactions followed by the first electron transfer [32,33].
The first criterion we need to know is whether the reaction is adsorption-controlled or diffusion-controlled because both processes require different forms of electrochemistry. Generally, Ip correlates with the scan rate raised to some power, which is supposedly b here. If the reaction is adsorption-controlled, the Ip vs. scan rate is linear (b = 1); if diffusion-controlled, the Ip vs. sq. root of the scan rate is linear (b = 0.5). We plotted Ip vs. the scan rate and Ip vs. the sq. root of the scan rate in Figure 2a,b, respectively. Comparatively, the best fit for Ip vs. the sq. root of the scan rate (Figure 2b) shows that the process is diffusion-controlled. However, R2 for Figure 2a is 0.984 and 0.964, and Figure 2b is 0.997 (for both lines), indicating a very small difference in the values of R2. We adapted an alternate approach to confirm the nature of processes in which the log of the scan rate vs. the log of the peak current is plotted. The slope of this plot shows the nature of the process: a slope near unity indicates adsorption-controlled, and near 0.5 indicates a diffusion-controlled reaction [32,34]. We plotted the log of a scan rate vs. the log of a peak current in Figure 2c. Figure 2c shows the slope close to ~0.5, which indicates that the reaction is diffusion-controlled. In the following sections, we calculated the transfer coefficient, diffusion coefficient, and electron transfer rate constant.

3.1.1. Transfer Coefficient

The transfer coefficient, a critical parameter in electrochemical studies, significantly affects the activation energy of the electron transfer rate. The transfer coefficient typically ranges from 0.3 to 0.7, with a general assumption of 0.5 in calculations of the electron transfer rate constant. However, for accurate measurements of the heterogeneous electron transfer rate constant, the precise quantification of the transfer coefficient is essential. In this study, we determined the transfer coefficient using the following two methods: the Tafel plot and another method referred to as Equation (1).
The Tafel plot method involves plotting the logarithm of the current against potential. For our measurements, we selected the current and potential values from the cyclic voltammograms of paracetamol at scan rates of 0.025 V/s and 0.300 V/s, focusing on the potential range of 0.62 V to 0.75 V, where the oxidation peaks are prominent as shown in Figure 3. In these Tafel plots, we observed slopes of −22.69 at 0.025 V/s and −14.65 at 0.300 V/s, corresponding to transfer coefficient values of 0.34 and 0.57, respectively. These values were calculated using the following relation: slope = −(1 − α)nF/2.3RT. It is crucial to carefully select the points for slope measurement in the Tafel plot, aiming for the descending straight part of the curve that is close to the horizontal current line. The lines used to calculate slopes are shown in Figure S2 in the Supplementary Information. This careful selection is important because even a minor error in identifying the slope points can lead to significant deviations in the transfer coefficient value.
To validate the transfer coefficient values obtained from the Tafel plot, we also employed another method, referred to as Equation (1) [34,35]. This method requires only two electrochemical parameters as follows: Ep and Ep/2, as shown in Equation (1), and values calculated from Equation (1) are presented in Table 1.
EpEp/2 = 48/(αn)
Here, α is the transfer coefficient, n is the number of electrons involved (n = 2) [31,33], and Ep and Ep/2 are in mV. We found the values of the transfer coefficient between 0.62 and 0.36 at scan rates ranging from 0.025 V/s to 0.300 V/s, respectively, as shown in Table 1. The average value is 0.43. Table 1 shows that the value of α depends on the scan rate; as the scan rate increases, α decreases, as previously reported [36]. Here, the values of transfer coefficients are in close agreement with the values calculated using the Tafel plots. Additionally, this method is easy compared to the Tafel plot method, which requires a very careful selection of points for calculating the slope.

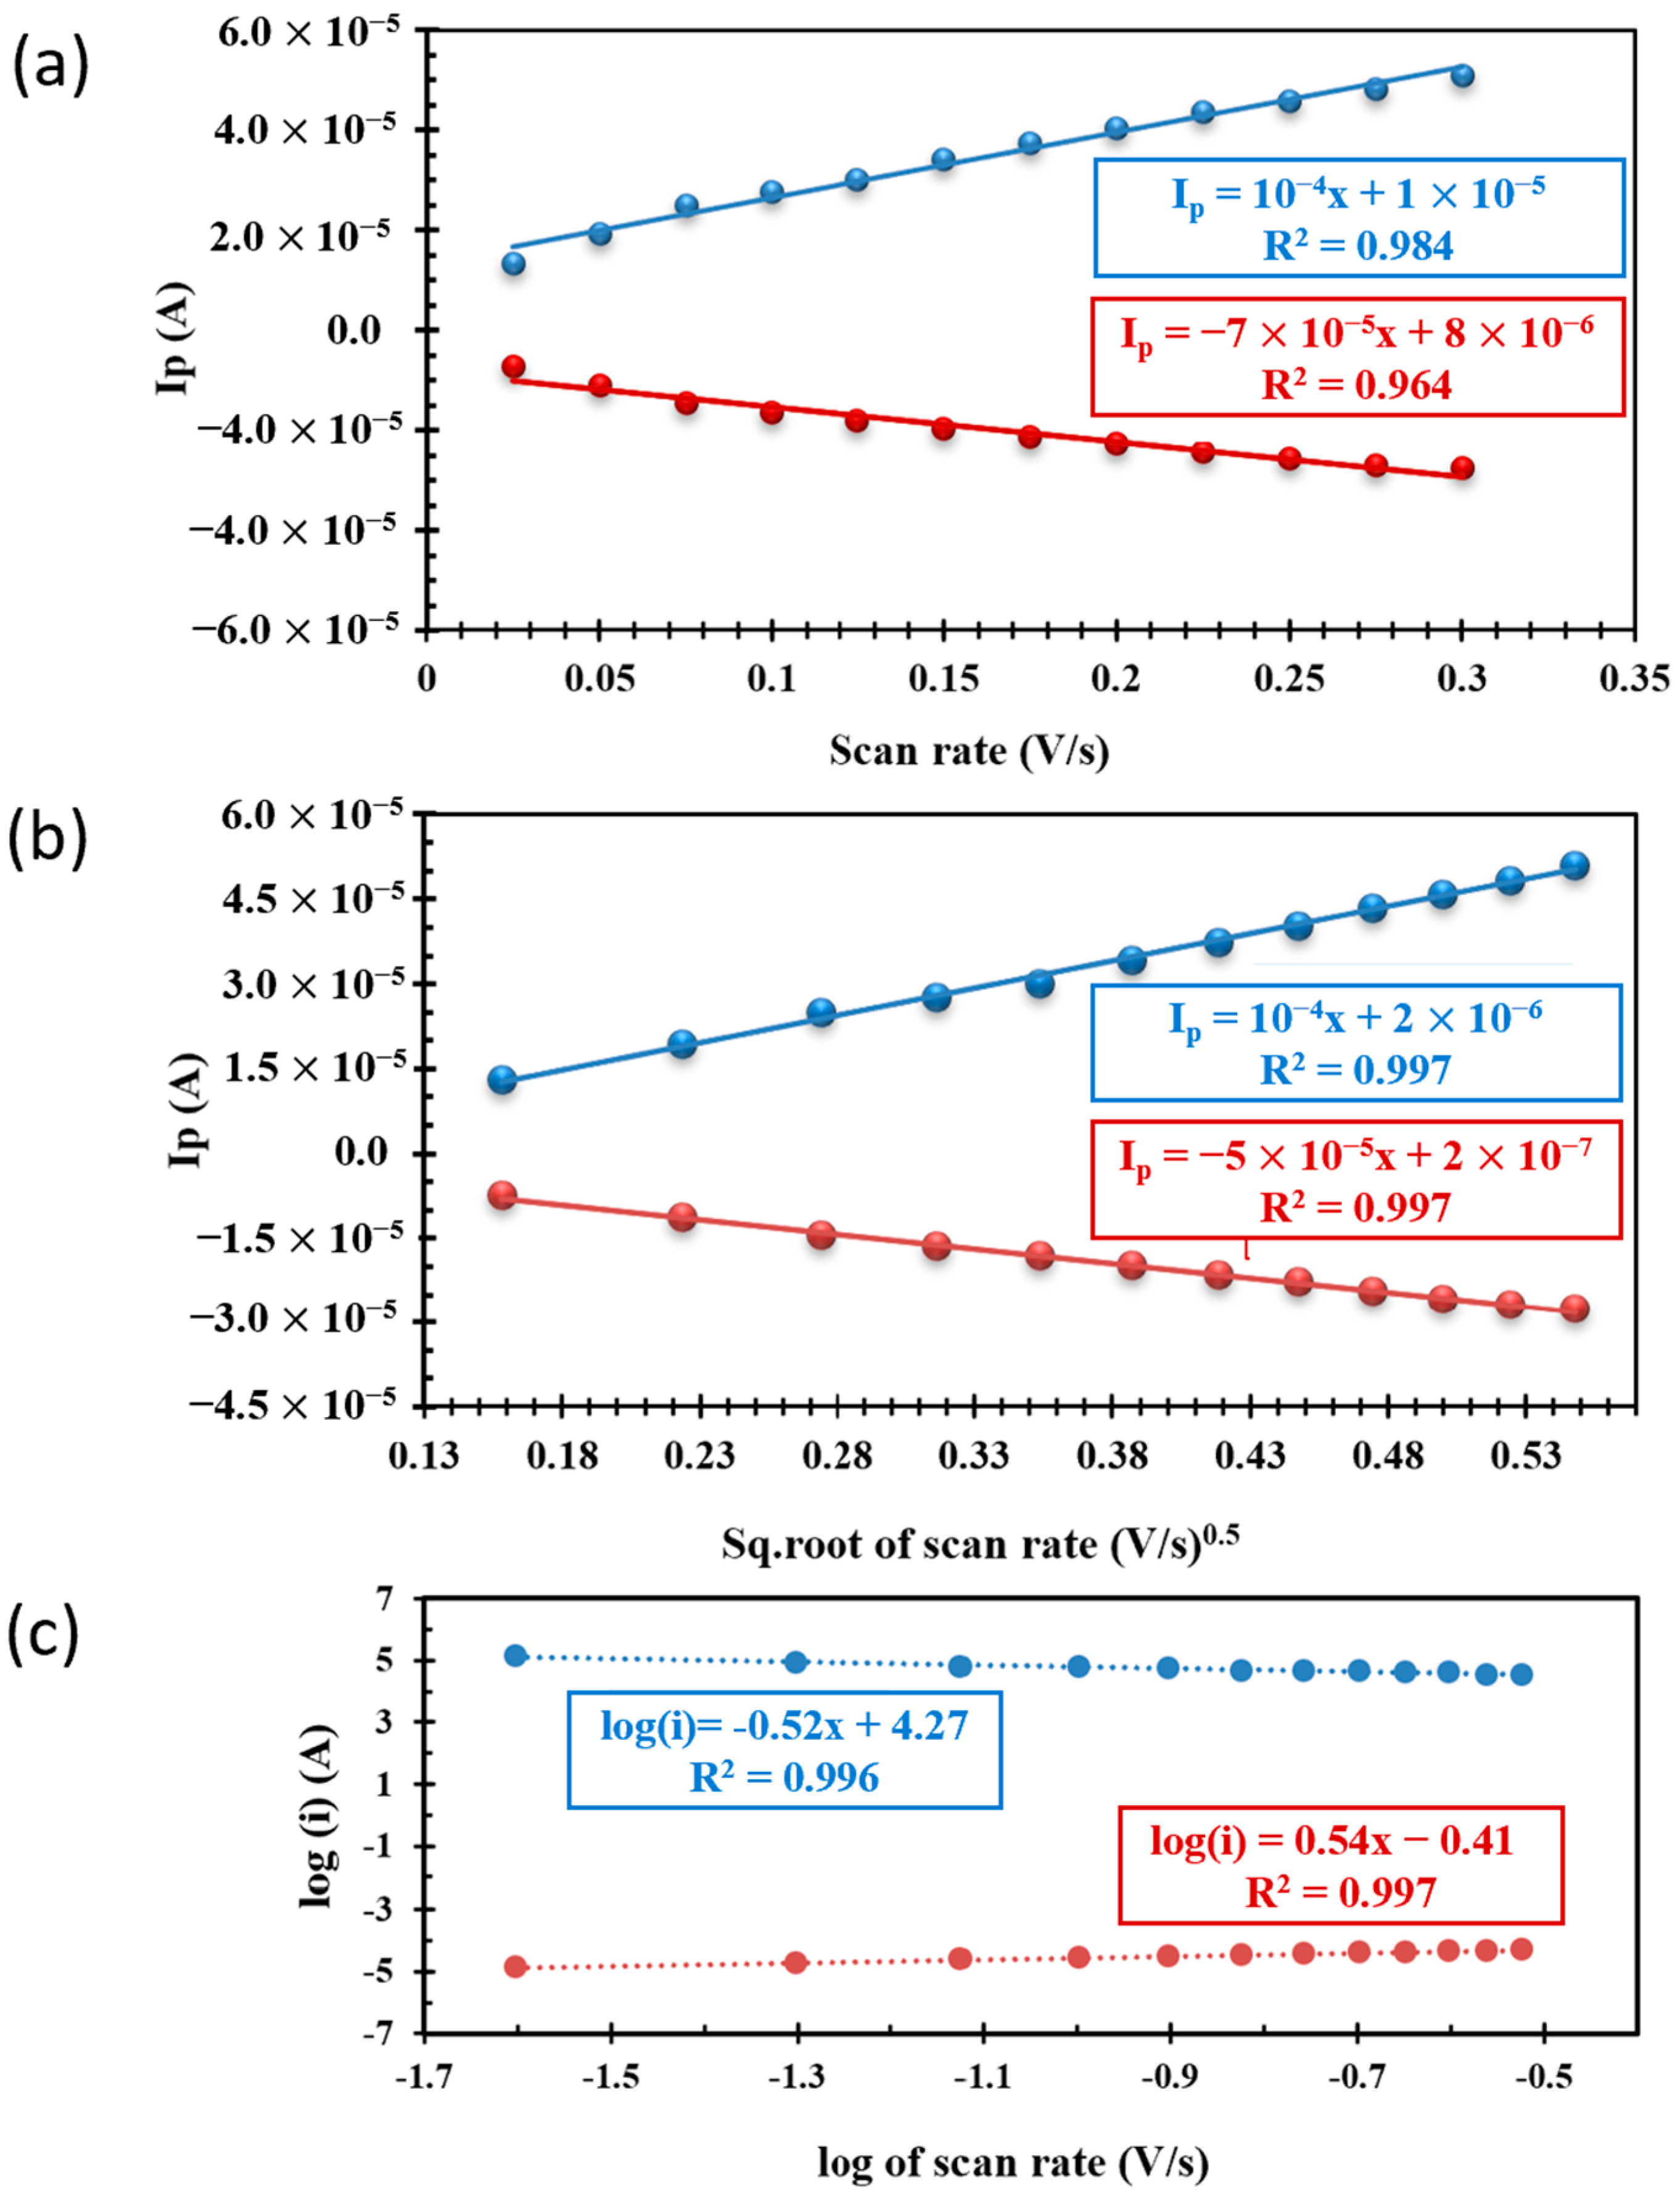
3.1.2. Diffusion Coefficient

The diffusion coefficient was determined using the modified Randles–Ševčík equation for a quasi-reversible process, as presented in Equation (2) [37]
Ip = 2.99 × 10⁵ ACn(αnD0ν)1/2
Here, Ip is the peak current, A is the area of the working electrode in cm2, C is the concentration in mmol/cm3, n is the number of electrons involved (n = 2) [31], ν is the scan rate in V/s, D0 is the diffusion constant in cm2/s, and α is the transfer coefficient. The calculated values using Equation (2) are presented in Table 2. These values are averaged to 2.19 × 10⁻⁵ cm2/s with the smallest value of 1.25 × 10⁻⁵ cm2/s and the largest value of 3.10 × 10⁻⁵ cm2/s at a scan rate of 0.025 and 0.300 V/s, respectively.
Additionally, D0 can be determined using the slope of Ip vs. the sq. root of the scan rate (from Figure 2b) according to Equation (3). This method gives the value of 2.42 × 10⁻⁵ cm2/s, which is in close agreement with the average value determined from Equation (2).
D0 = (slope/(2.99 × 105 ACn(αnD0ν)1/2)/)2
This value from the slop method had an added advantage of background subtraction due to uncompensated resistance and contribution from the capacitive current.

3.1.3. Heterogeneous Electron Transfer Rate Constant

The determination of the heterogeneous electron transfer rate constant (k0) is a pivotal aspect of characterizing any new electrochemical system. This parameter is integral to understanding the kinetics of electron transfer processes at the electrode–electrolyte interface. In our study, we employed three different methods to calculate k0, each contributing to a comprehensive understanding of the electrochemical behavior of the system. The first method utilized was the Nicholson and Shain method [7]: a widely recognized approach in electrochemical kinetics. This method, based on the analysis of cyclic voltammograms, allows for the estimation of k0 by examining the relationship between peak separation and scan rates using a dimensionless parameter Ψ. In addition to the Nicholson and Shain method, we also employed Kochi’s method [14]. Kochi’s approach offers a different perspective on determining k0, focusing on the relationship between the electron transfer rate, overpotential and transfer coefficient. Lastly, the Gileadi method [38] was applied. This method is renowned for its robustness in analyzing the heterogeneous electron transfer processes, particularly in systems where electron transfer is coupled with other chemical reactions, i.e., for irreversible reactions.

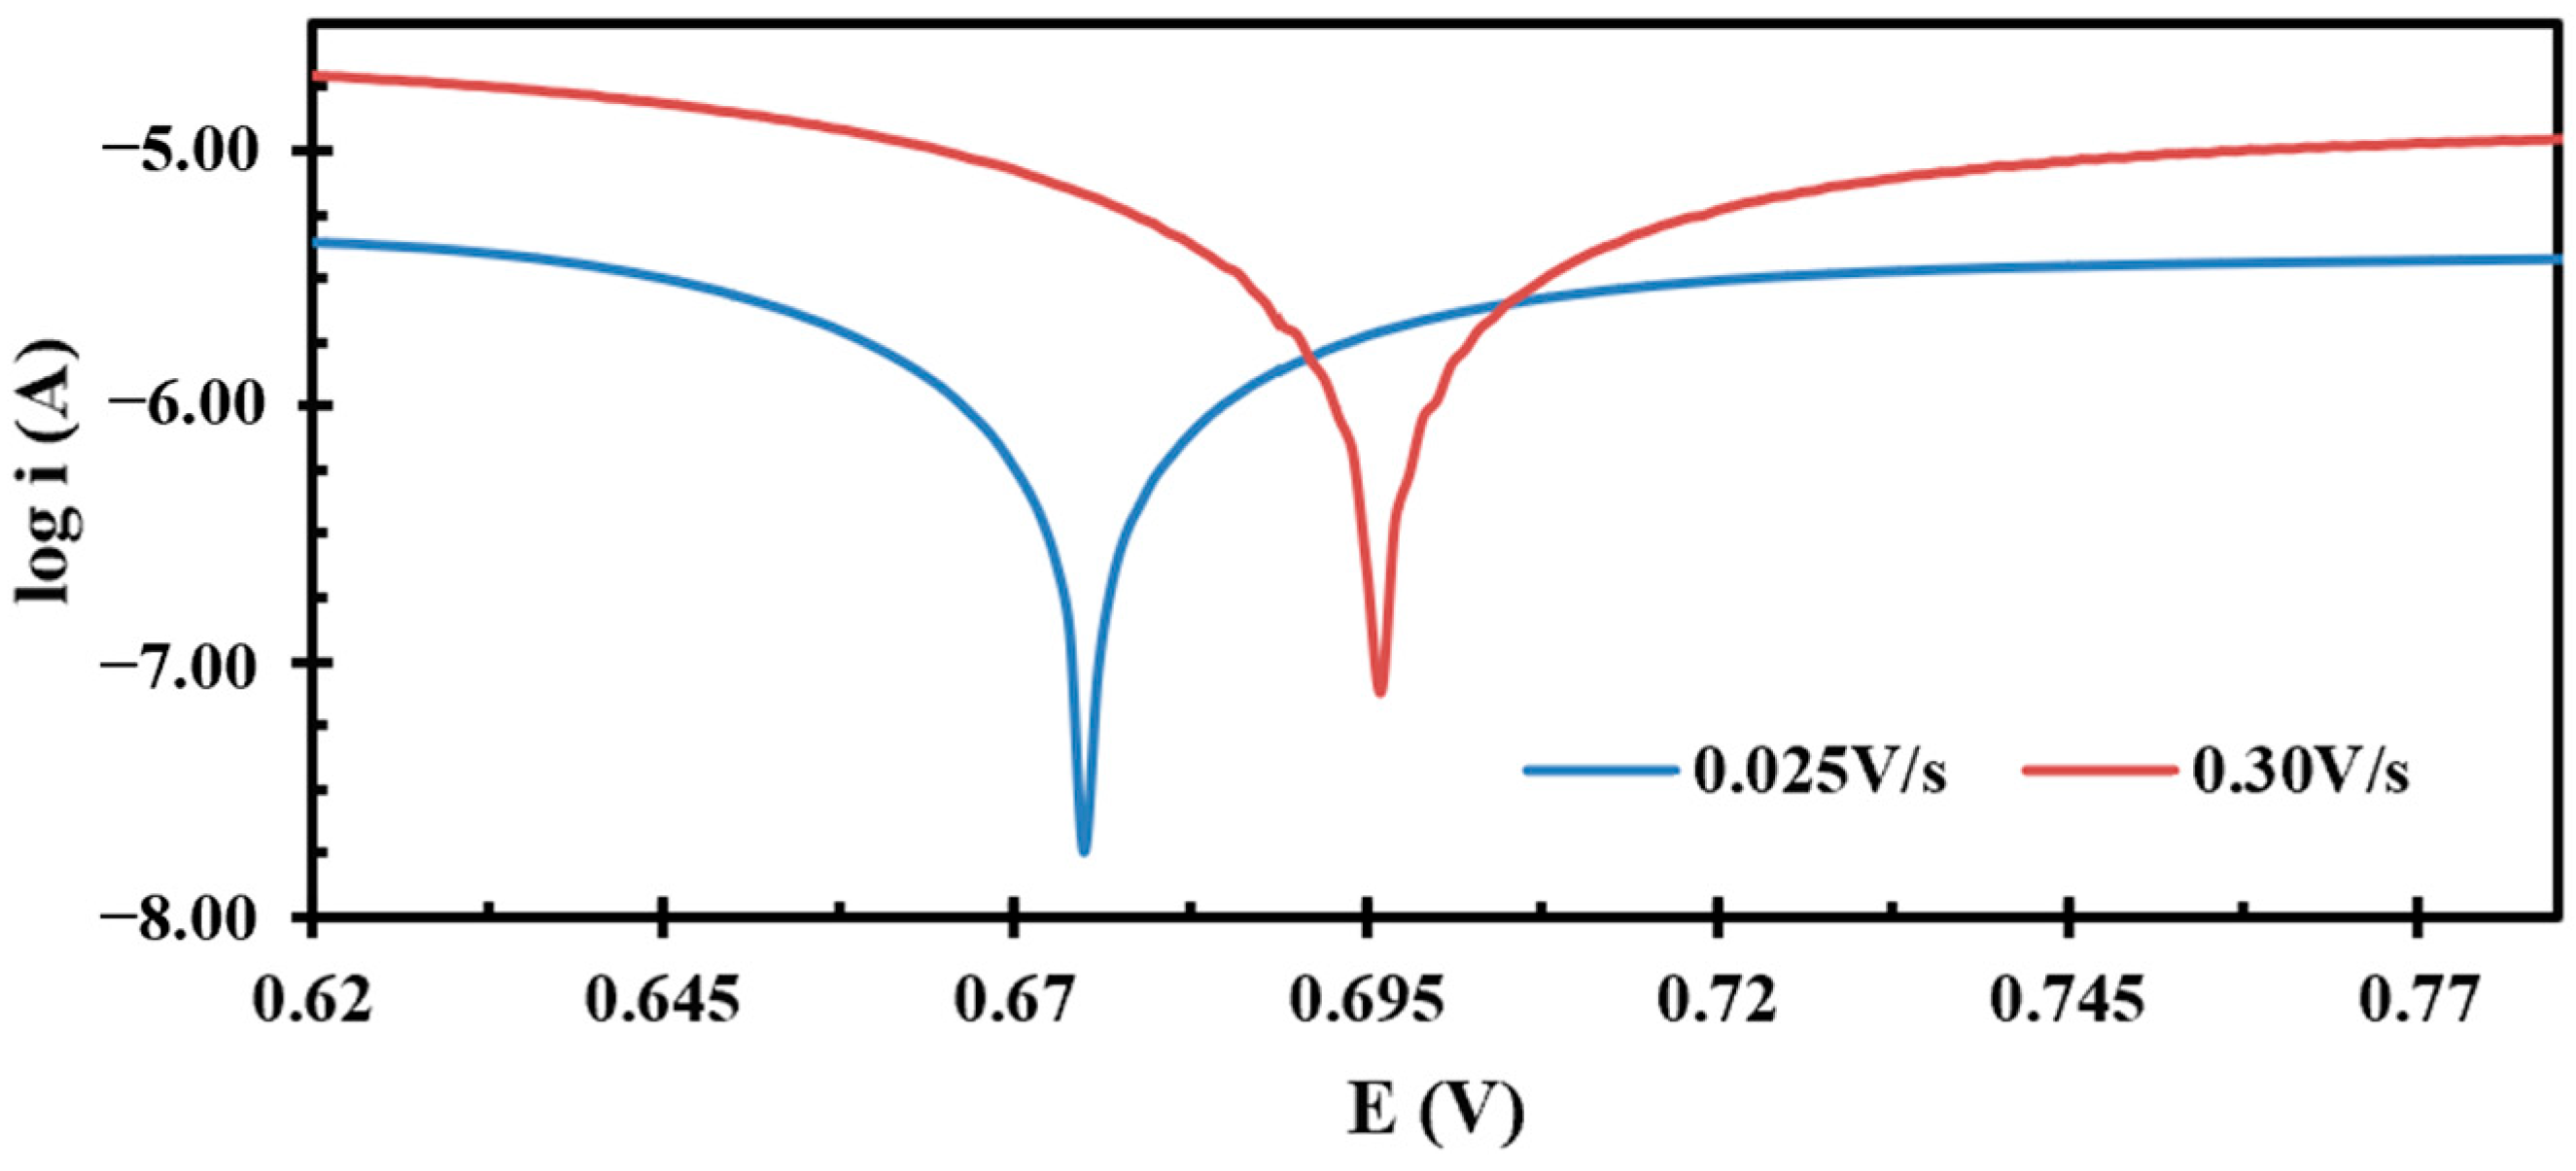
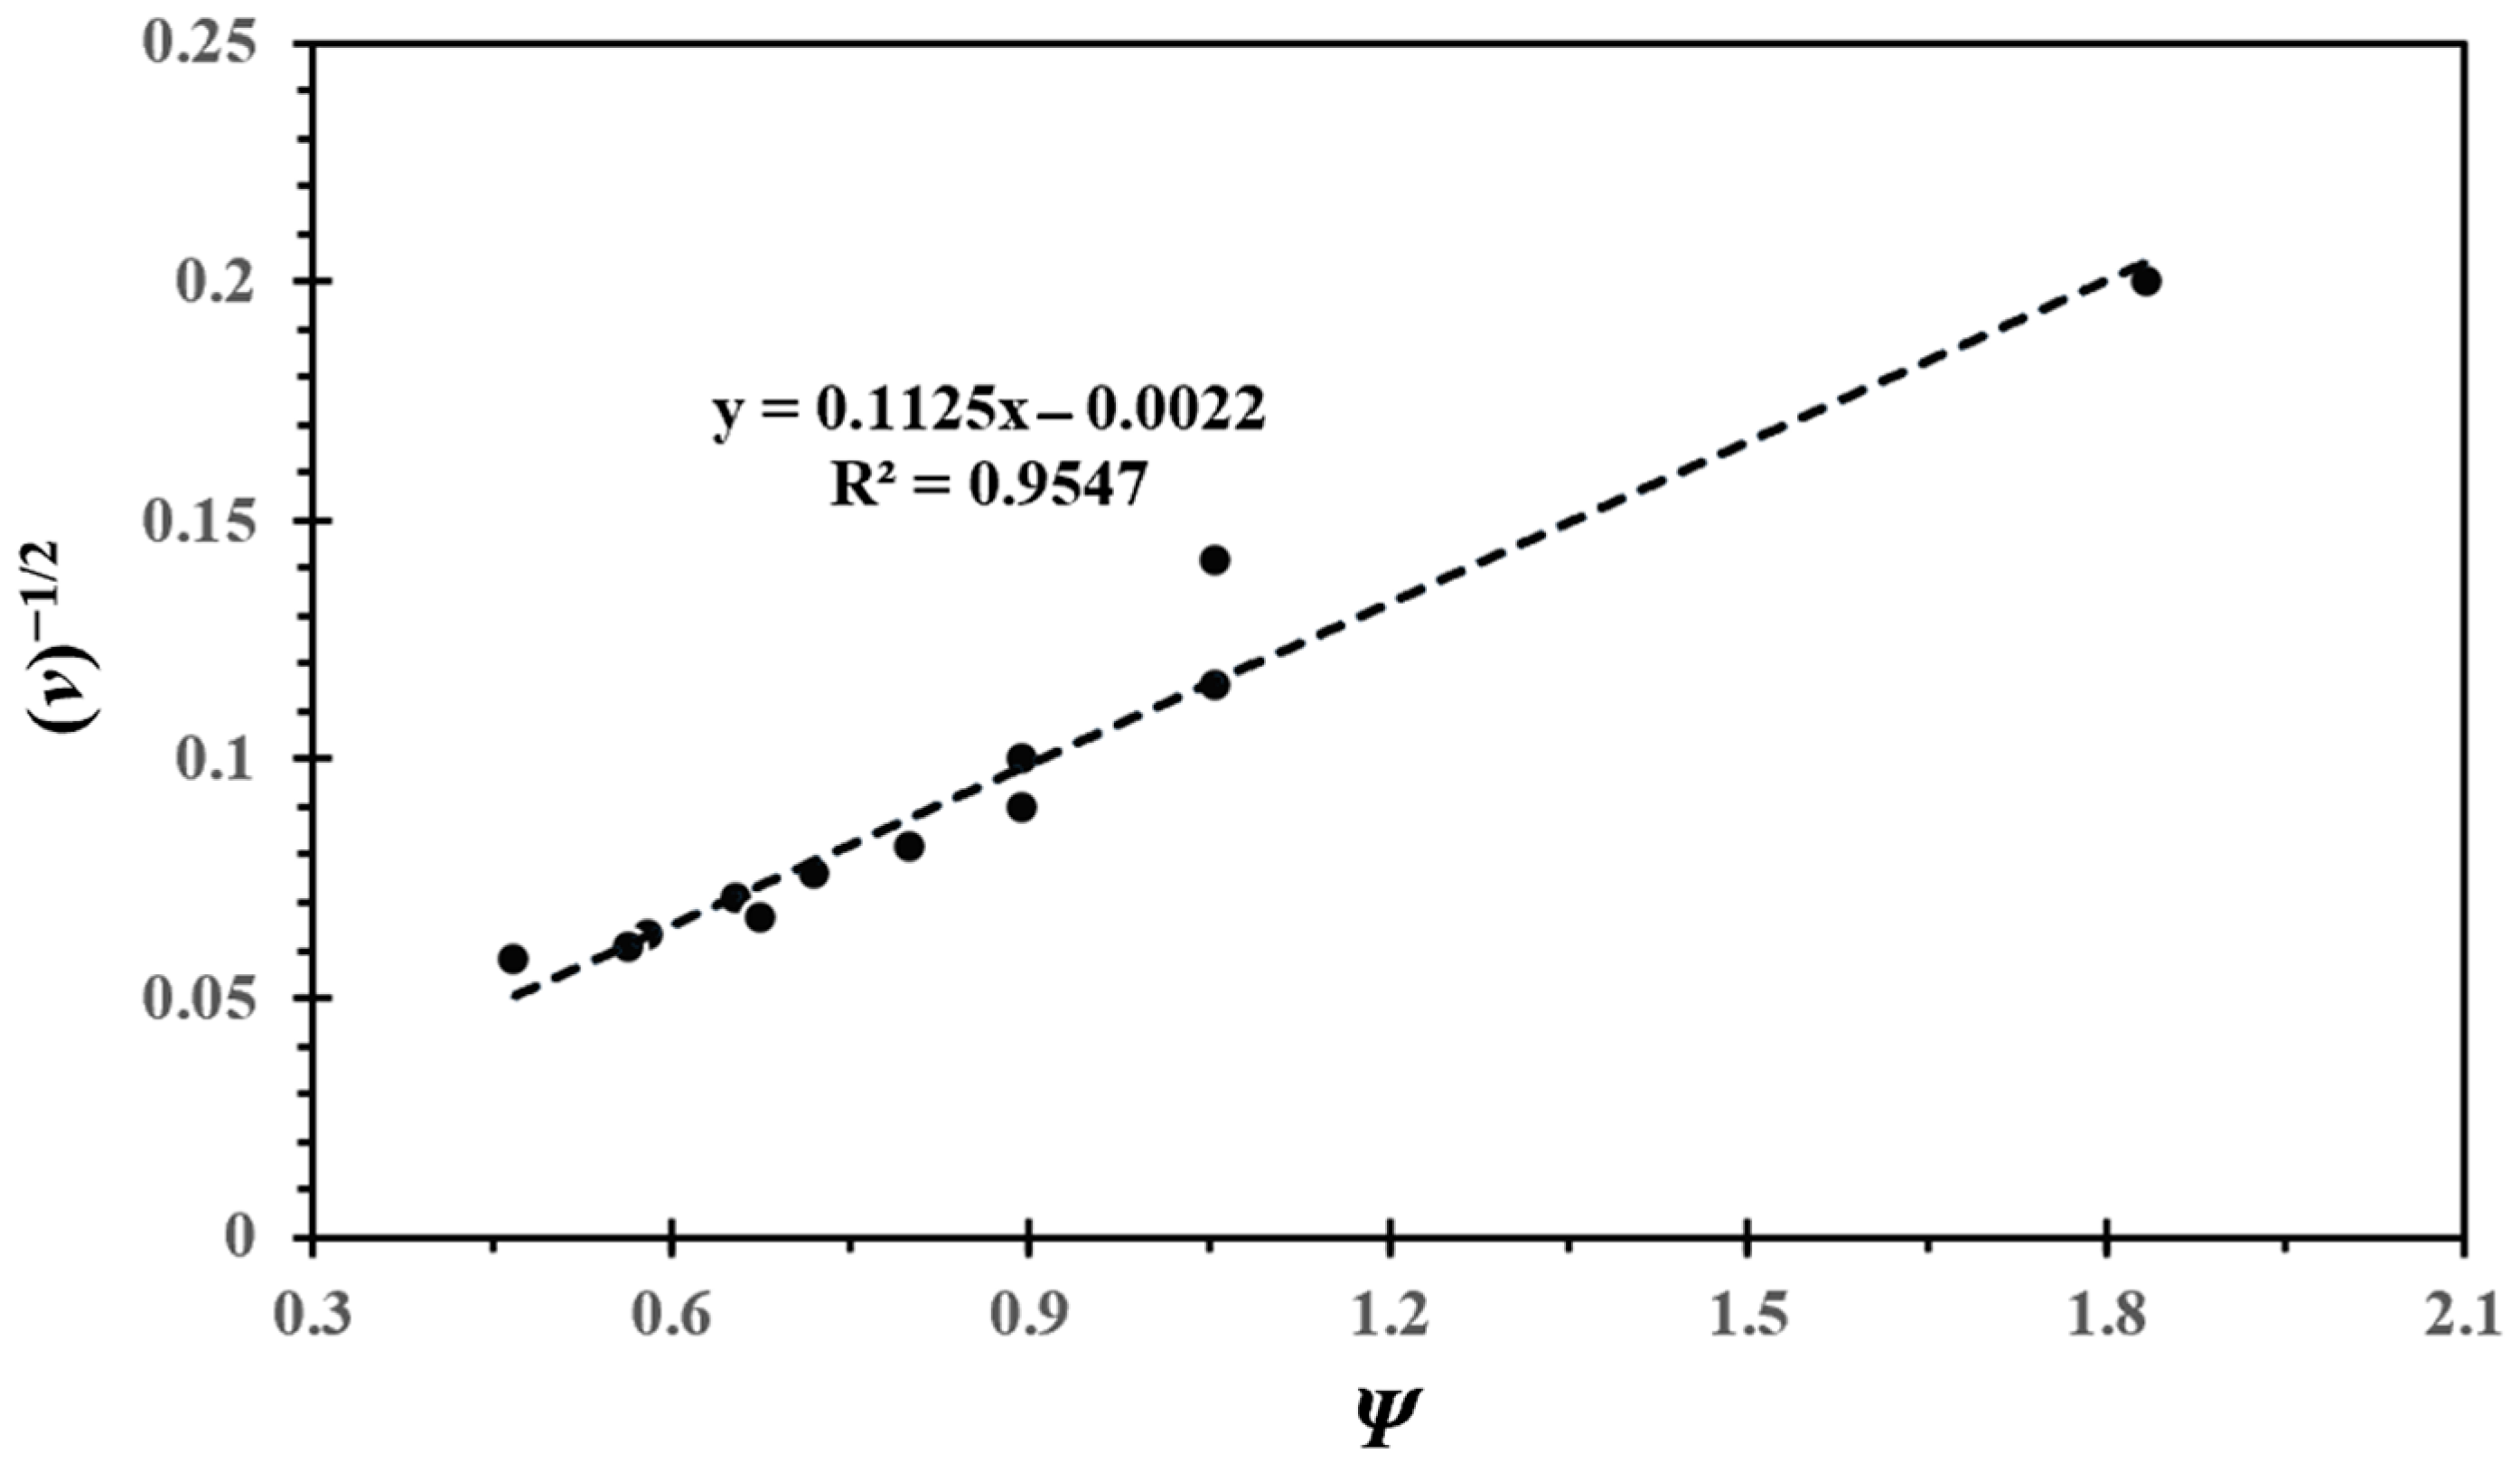
Nicholson and Shain Method

Nicholson and Shain provided a simple and elegant method to determine k0, as shown in Equation (4) [30]
k0 = Ψ(πnD0/RT)1/2
Here, Ψ is a dimensionless kinetic parameter that depends on peak separation. All other symbols have their usual meaning, as discussed earlier in Equations (1)–(3). Later, Lavagnini et al. provided a quantitative relationship between Ψ and peak separation according to Equation (5) [39]
Ψ = (– 0.6288 + 0.0021 ΔEp)(1 − 0.017 ΔEp)
Here, ΔEp is the peak separation in mV. The values of ΔEp in (mv), Ψ, and k0 are provided in Table 3. The average value of k0 was found to be 0.022 cm/s.
Alternatively, Equation (5) can be rearranged into Equation (6).
Ψ = k0(RT/πnD0F)1/2 (ν)−1/2
Here, the value of k0 can be calculated using the slope of the plot of Ψ versus (ν)−1/2. The slope is equal to the expression k0(RT/πnD0F)1/2. We present the plot of Ψ vs. (ν)−1/2 in Figure 4. The value calculated for k0 from the trend line from Figure 4 was found to be 0.010 cm/s, which is smaller than the values calculated for the values of k0 from those calculated from Equation (4) (Table 3).

Kochi Method

In order to compare the value of k0 with another method, we used the Kochi method to calculate the value of k0. Kochi and Klinger formulated this correlation between k0 and peak separation. They developed this formula using the Nicholson and Shain expressions [40,41]
k0 = 2.18(αnD0/RT)1/2 e[α2nFΔEp/RT]
In this expression, all symbols have their usual meanings. In this expression, the value of the transfer coefficient is retained, which is not in the Nicholson and Shain equation. The values of calculated k0 using Equation (7) are presented in Table 4. The values of k0 range from 0.001 to 0.013 cm/s, with an average value of 0.07 cm/s. This value could be more reliable because it considers the value of the transfer coefficient.

Gileadi Method

The Gileadi method is relatively simple and does not require peak separation. This method works well for the system where a reversible peak is absent [32,38].
logk0 = −4.8α + 0.52 + log (αnD0FVc/2.303RT)1/2
Here, all symbols have their usual meaning. Vc is the critical scan rate where the system undergoes a transition from a quasi-reversible to an irreversible system. Vc is determined using the plot of peak potential versus the log of the scan rate, as shown in Figure 5. Two straight trends were found at lower and higher scan rates with different slopes, and their intersection provided the value of Vc. Figure 5 shows that the log of the scan rate value is about −0.72, which corresponds to the 0.190 V/s scan rate (indicated by pink arrow). At the 0.190 V/s scan rate, Equation (8) produces the value of 0.017 cm/s.

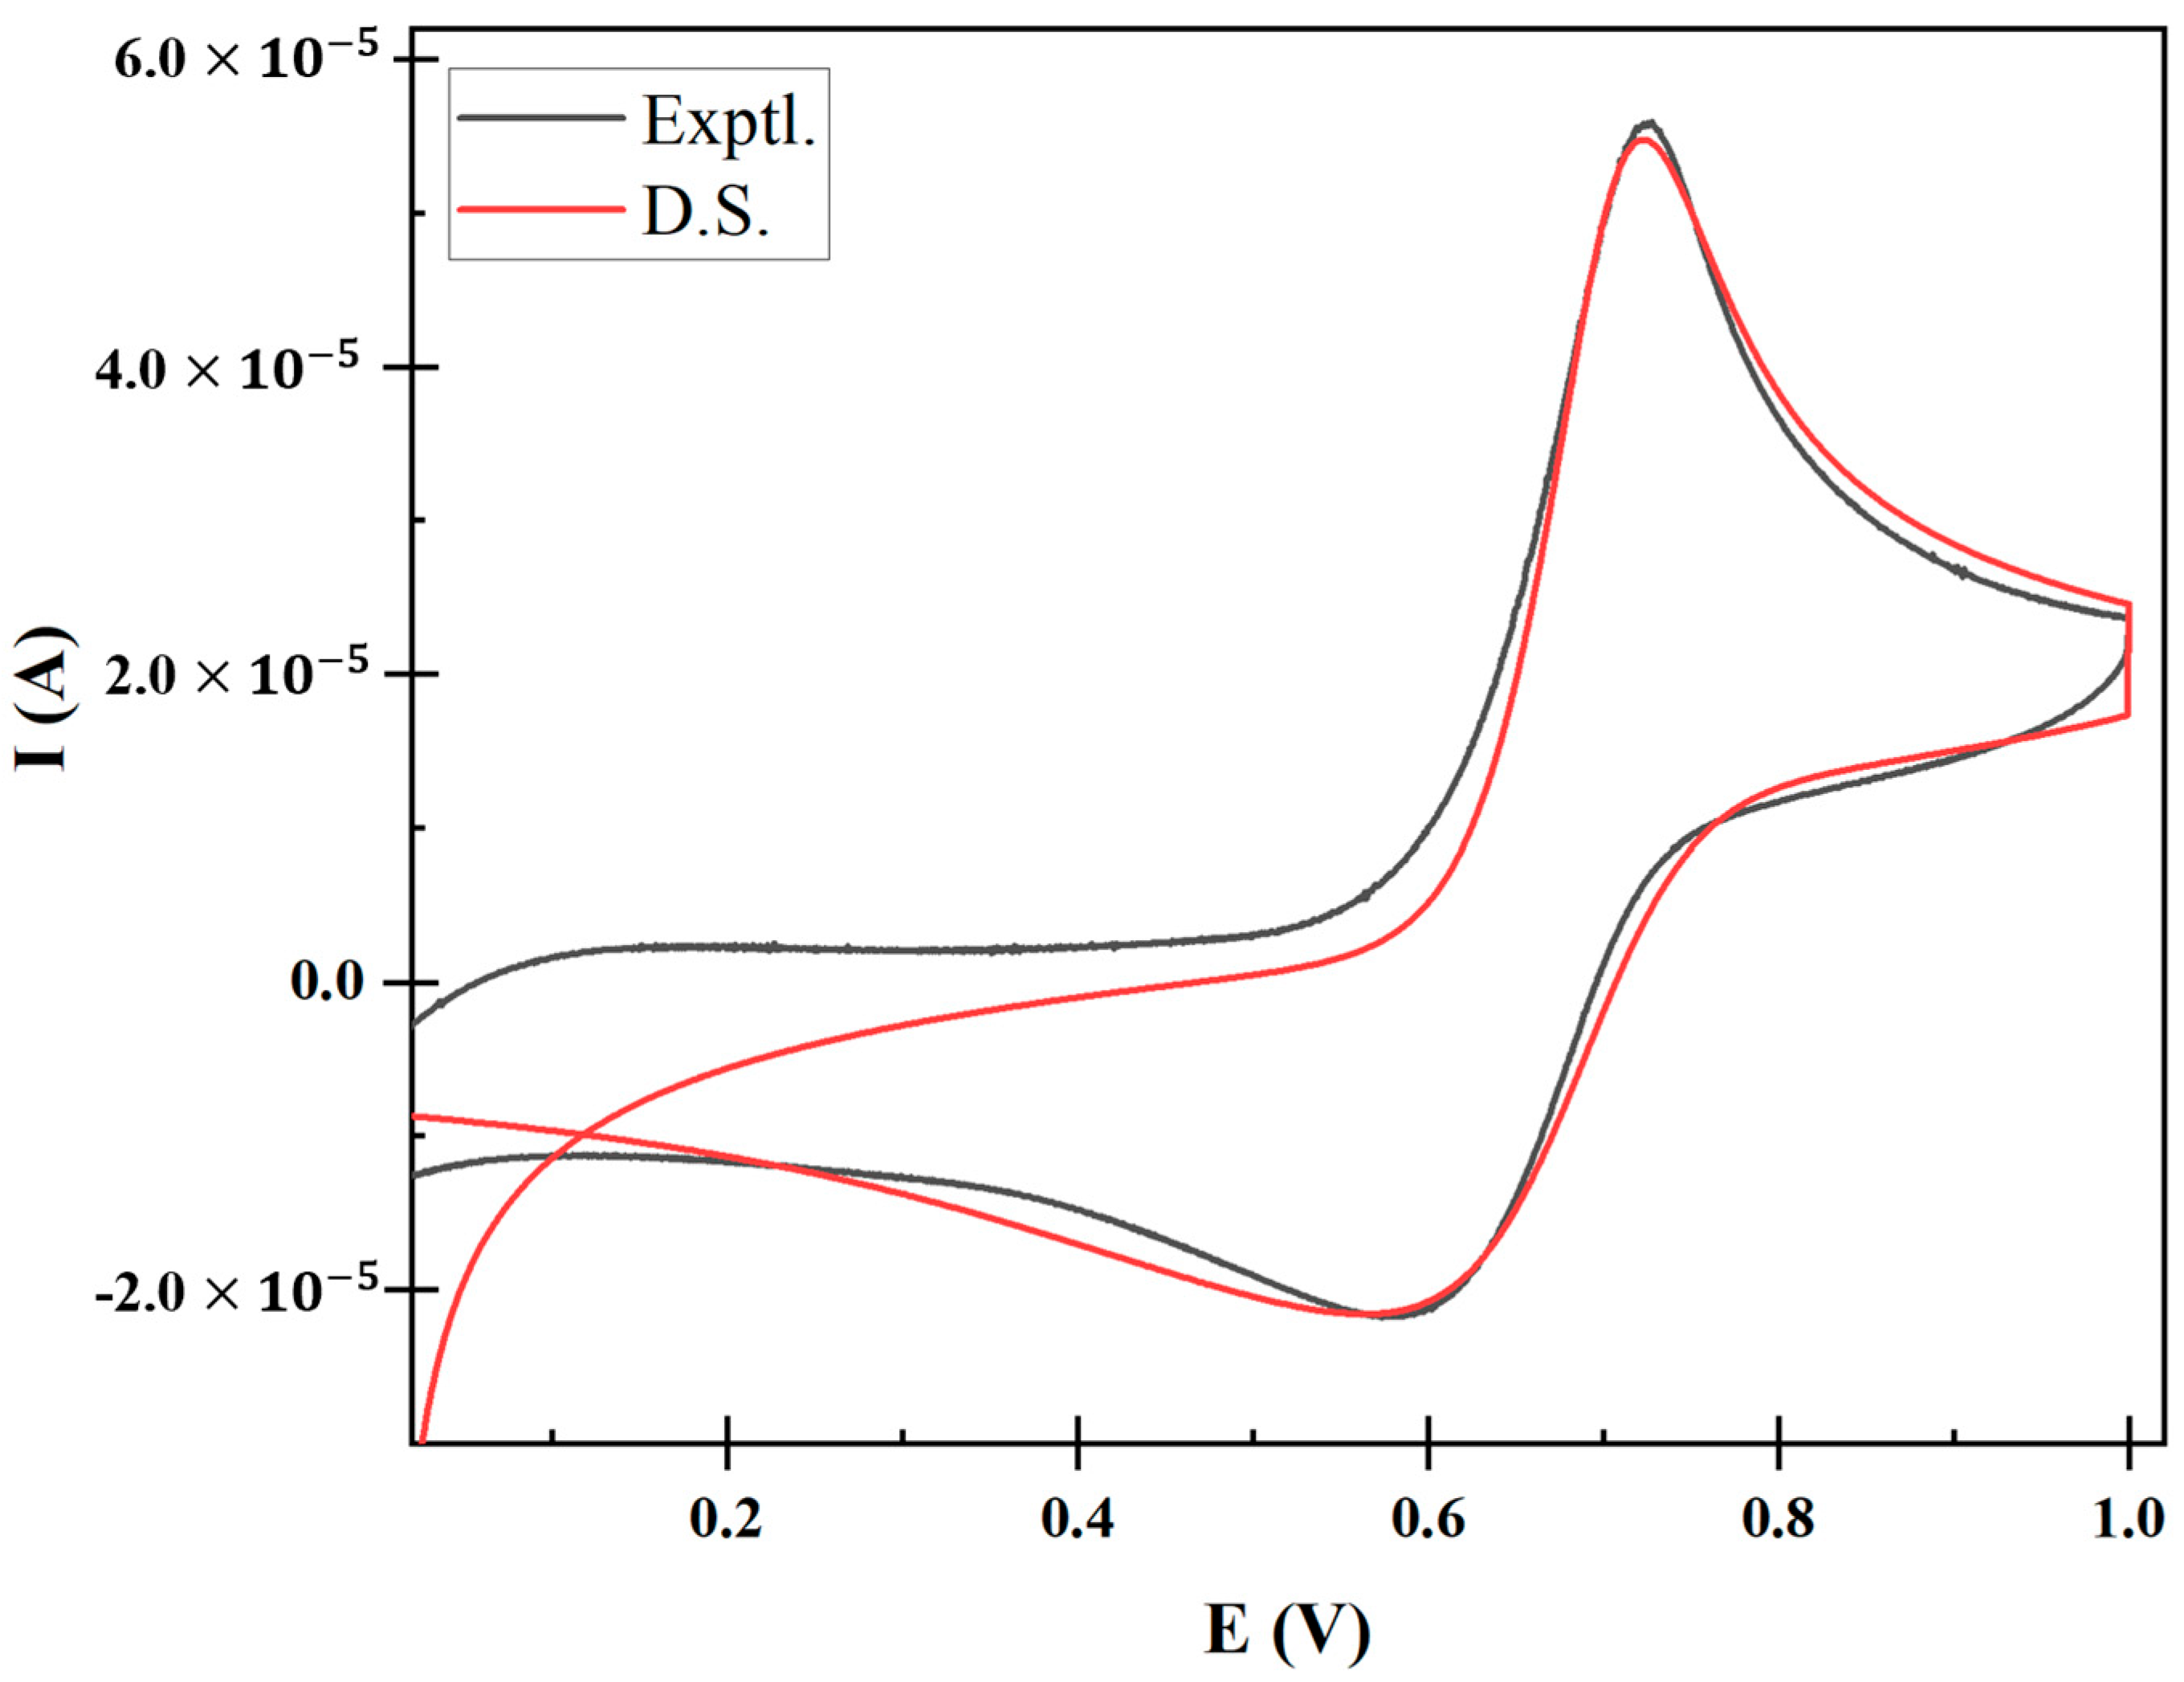
3.2. Digital Simulation

The digital simulation of the cyclic voltammogram is a method to validate the transfer coefficient, diffusion coefficient, and heterogeneous electron transfer rate constant using all these parameters together. In a digital simulation, input data from experiments were fed into simulation software, which generated a cyclic voltammogram using theoretical equations involving second or higher-order chemical reactions coupled with electron transfer. This method can be particularly used to calculate the rate constants for homogeneous chemical reactions and coupled reactions with electron transfer.
We used the reaction mechanism shown in Scheme 1 to simulate the cyclic voltammogram. A simple representation is shown in the lower part of Scheme 1. Paracetamol undergoes two electron transfers and forms acetic acid and p-Benzoquinone imine in the aqueous solution.
The best fit of the simulated voltammogram at 0.300 V/s is presented in Figure 6. The best fit of CV was achieved using the following parameters: E1/2 = 0.645 V; α = 0.28; D0 = 2.45 × 10⁻⁵ cm2/s; k0 0.017 cm/s; Kf = 9 × 10⁻⁶ M−1s−1 and Kb = 850 M−1s−1. The reproduction of a fitted cyclic voltammogram using these parameters validates the accuracy of the methodologies used in this study.

4. Discussion

In this study, we investigated the electrochemical oxidation of paracetamol in an aqueous medium using cyclic voltammetry and a digital simulation. We determined the transfer coefficient using the following two different methods: the Tafel plot and Equation (1). The diffusion coefficient was determined for the individual scan rate, average value, and slope method using the modified Randles–Ševčík equation. The heterogeneous electron transfer rate constant was determined using the following three different methods: the Nicholson and Shain method and the Kochi and Gileadi method. Then, all parameters were used to simulate the voltammogram with the built-in feature of the CHI 760D electrochemical workstation, which reproduced sufficiently with the experimental cyclic voltammogram (Figure 5).
These results show that the value of α depends on the scan rate for paracetamol, even in the narrow range of the scan rate. The value of α varied from 0.62 to 0.31 at 0.025 V/s to a 0.300 V/s scan rate, respectively. Additionally, Equation (1) is an easy approach to determine α compared to the Tafel plot method. While taking points for the slop, a slop needs to be taken as near as possible to the horizontal line, as shown in Figure S2 in the Supplementary Information.
The value of D0 using the modified Randles–Ševčík equation ranges from 1.25 to 3.10 × 10⁻⁵ cm2/s with an average value of 2.19 × 10⁻⁵ cm2/s. Moreover, the value of D0 calculated from the slope of the plot of Ip versus (ν)1/2 was found to be 2.42 × 10⁻⁵ cm2/s, which is closer to the average value. The slop method is considered feasible because of the cancellation of the capacitive current contribution in Ip.
The value of k0 from Nicholson and Shain using Equation (4) lies between 0.018 and 0.025 cm/s with an average value of 0.022 cm/s. However, the value of k0 calculated from the linear plot of (ν)−1/2 versus Ψ is 0.010 cm/s, which is lower than the values calculated from Equation (4). The value of k0 from the Kochi method lies in the range of 0.001 to 0.013 cm2/s with an average value of 0.070 cm2/s. The value of k0 using the Gileadi method is 0.017 cm/s. Nicholson and Shain’s method calculated from the plot of (ν)−1/2 versus Ψ is closer to the value calculated from Kochi and Gileadi’s methods. Additionally, Kochi and Gileadi’s methods are a better choice for an electron transfer followed by a coupled chemical reaction, as in the case of paracetamol here. The value of k0 from the Nicholson and Shain method is slightly different, as noted in previous studies [28,32]. We also note that the Kochi method shows that the value of k0 varies with the change in the scan rate, which is possibly due to the change in the transfer coefficient. In Nicholson and Shain’s method, the value of 0.5 was assumed while calculating the kinetic parameter Ψ, hence reproducing a constant value. At last, the digital simulation shows that the values calculated from these methods have reasonable accuracy, which reproduces a cyclic voltammogram with very good fitting.

5. Conclusions

This study presents a comprehensive analysis of the various methods used for calculating key electrochemical parameters, with a particular focus on paracetamol. Through meticulous experiments and comparisons, we demonstrated that the combined application of the EpEp/2 equation, Randles–Ševčík equation, and Kochi and Gileadi method approaches were particularly effective for accurately determining the transfer coefficient, diffusion coefficient, and heterogeneous electron transfer rate constant, respectively. These findings reveal that the Kochi and Gileadi methods are reliable alternatives for calculating the heterogeneous electron transfer rate constant for chemically coupled electron transfer processes. Moreover, our study successfully employed digital simulation as a tool to validate these electrochemical parameters, ensuring their accuracy and reliability. This approach also unraveled the kinetics of chemically coupled reactions, offering deeper insights into the complex interplay of reactions in electrochemical systems. The methodologies validated and the insights gained can be applied to a wide range of electrochemical studies, particularly those involving complex electron transfer and coupled chemical reactions.

Supplementary Materials

The following supporting information can be downloaded at: https://www.mdpi.com/article/10.3390/electrochem5010004/s1, Table S1: Electrochemical parameters for 1 × 10⁻⁶ M of paracetamol solution with 0.1 M of LiClO4 as a supporting electrolyte; Figure S1: A plot of ΔEp (V) vs. sq.root of scan rate (V/s)0.5; Figure S2: Tafel plots at 0.025 V/s and 0.300 V/s with tangent lines to calculate Tafel slope.

Author Contributions

Conceptualization, Z.M. and I.A.T.; methodology and investigation, H.M. and Z.M.; writing—original draft preparation, Z.M.; supervision, I.A.T.; writing—review and editing Z.M., I.A.T. and H.M. All authors have read and agreed to the published version of the manuscript.

Funding

This research received no external funding.

Institutional Review Board Statement

Not applicable.

Informed Consent Statement

Not applicable.

Data Availability Statement

Data are contained within the article and Supplementary Material.

Conflicts of Interest

The authors declare no conflicts of interest.

References

  1. Chahma, M.H. Doped Polythiophene Chiral Electrodes as Electrochemical Biosensors. Electrochem 2021, 2, 677–688. [Google Scholar] [CrossRef]
  2. Miao, J. Review on Electrode Degradation at Fast Charging of Li-Ion and Li Metal Batteries from a Kinetic Perspective. Electrochem 2023, 4, 156–180. [Google Scholar] [CrossRef]
  3. Macchi, S.; Denmark, I.; Le, T.; Forson, M.; Bashiru, M.; Jalihal, A.; Siraj, N. Recent Advancements in the Synthesis and Application of Carbon-Based Catalysts in the ORR. Electrochem 2022, 3, 1–27. [Google Scholar] [CrossRef]
  4. Tomas, M.; Gholami, F.; Gholami, Z.; Sedlacek, J. Catalysts for Oxygen Reduction Reaction in the Polymer Electrolyte Membrane Fuel Cells: A Brief Review. Electrochem 2021, 2, 590–603. [Google Scholar] [CrossRef]
  5. Zhou, C.; Tao, L.; Yang, F.; Wang, B.; Wan, X.; Jin, Y.; Yu, H.; Yang, Y. Application of electrochemical methods in heterogeneous catalysis. Curr. Opin. Chem. Eng. 2019, 26, 88–95. [Google Scholar] [CrossRef]
  6. Santos, E.; Schmickler, W. Catalysis in Electrochemistry: From Fundamental Aspects to Strategies for Fuel Cell Development; John Wiley & Sons: Hoboken, NJ, USA, 2011; Volume 3. [Google Scholar]
  7. Tyszczuk-Rotko, K.; Kozak, J.; Czech, B. Screen-Printed Voltammetric Sensors&mdash;Tools for Environmental Water Monitoring of Painkillers. Sensors 2022, 22, 2437. [Google Scholar] [PubMed]
  8. Zhang, S.; Xue, S.; Wang, Y.; Zhang, G.; Arif, N.; Li, P.; Zeng, Y.-J. Three-Dimensional Printing, an Emerging Advanced Technique in Electrochemical Energy Storage and Conversion. Batteries 2023, 9, 546. [Google Scholar] [CrossRef]
  9. Masood, Z.; Ge, Q. Electrochemical reduction of CO2 at the earth-abundant transition metal-oxides/copper interfaces. Catal. Today 2023, 409, 53–62. [Google Scholar] [CrossRef]
  10. Masood, Z.; Ge, Q. Comparative Study of Computational Hydrogen Electrodes and Constant Electrode Potential Models Applied to Electrochemical Reduction of CO2 and Oxygen Evolution Reaction on Metal Oxides/Copper Catalysts. J. Phys. Chem. C 2023, 127, 23170–23179. [Google Scholar] [CrossRef]
  11. Lu, B.; Liu, Q.; Wang, C.; Masood, Z.; Morris, D.J.; Nichols, F.; Mercado, R.; Zhang, P.; Ge, Q.; Xin, H.L.; et al. Ultrafast Preparation of Nonequilibrium FeNi Spinels by Magnetic Induction Heating for Unprecedented Oxygen Evolution Electrocatalysis. Research 2022, 2022, 9756983. [Google Scholar] [CrossRef]
  12. Yang, Y.; Hao, J.; Xue, J.; Liu, S.; Chi, C.; Zhao, J.; Xu, Y.; Li, Y. Morphology regulation of Ga particles from ionic liquids and their lithium storage properties. New J. Chem. 2021, 45, 4408–4413. [Google Scholar] [CrossRef]
  13. Adil, O.; Shamsi, M.H. Electrochemical Impedance Immunoassay for ALS-Associated Neurofilament Protein: Matrix Effect on the Immunoplatform. Biosensors 2023, 13, 247. [Google Scholar] [CrossRef] [PubMed]
  14. Weinberg, D.R.; Gagliardi, C.J.; Hull, J.F.; Murphy, C.F.; Kent, C.A.; Westlake, B.C.; Paul, A.; Ess, D.H.; McCafferty, D.G.; Meyer, T.J. Proton-Coupled Electron Transfer. Chem. Rev. 2012, 112, 4016–4093. [Google Scholar] [CrossRef] [PubMed]
  15. Asefifeyzabadi, N.; Holland, T.E.; Sivakumar, P.; Talapatra, S.; Senanayake, I.M.; Goodson, B.M.; Shamsi, M.H. Sequence-Independent DNA Adsorption on Few-Layered Oxygen-Functionalized Graphene Electrodes: An Electrochemical Study for Biosensing Application. Biosensors 2021, 11, 273. [Google Scholar] [CrossRef] [PubMed]
  16. Elgrishi, N.; Rountree, K.J.; McCarthy, B.D.; Rountree, E.S.; Eisenhart, T.T.; Dempsey, J.L. A Practical Beginner’s Guide to Cyclic Voltammetry. J. Chem. Educ. 2018, 95, 197–206. [Google Scholar] [CrossRef]
  17. Naróg, D.; Sobkowiak, A. Electrochemistry of Flavonoids. Molecules 2023, 28, 7618. [Google Scholar] [CrossRef] [PubMed]
  18. Rajendrachari, S.; Basavegowda, N.; Adimule, V.M.; Avar, B.; Somu, P.; RM, S.K.; Baek, K.H. Assessing the Food Quality Using Carbon Nanomaterial Based Electrodes by Voltammetric Techniques. Biosensors 2022, 12, 1173. [Google Scholar] [CrossRef] [PubMed]
  19. Grinevich, V.P.; Zakirov, A.N.; Berseneva, U.V.; Gerasimova, E.V.; Gainetdinov, R.R.; Budygin, E.A. Applying a Fast-Scan Cyclic Voltammetry to Explore Dopamine Dynamics in Animal Models of Neuropsychiatric Disorders. Cells 2022, 11, 1533. [Google Scholar] [CrossRef]
  20. Aristov, N.; Habekost, A. Cyclic voltammetry-A versatile electrochemical method investigating electron transfer processes. World J. Chem. Educ. 2015, 3, 115–119. [Google Scholar]
  21. Tonle, I.; Ngameni, E. Voltammetric analysis of pesticides. In Pesticides in the Modern World-Trends in Pesticides Analysis; InTech: Rijeka, Croatia, 2011; pp. 465–488. [Google Scholar]
  22. Andrieux, C.P.; Blocman, C.; Dumas-Bouchiat, J.M.; Saveant, J.M. Heterogeneous and homogeneous electron transfers to aromatic halides. An electrochemical redox catalysis study in the halobenzene and halopyridine series. J. Am. Chem. Soc. 1979, 101, 3431–3441. [Google Scholar] [CrossRef]
  23. Ahmed, S.; Khan, A.Y. Mechanistic study of quinone-polyalcohol interaction through cyclic voltammetry. Russ. J. Electrochem. 2013, 49, 336–343. [Google Scholar] [CrossRef]
  24. Bard, A.J.; Faulkner, L.R.; Leddy, J.; Zoski, C.G. Electrochemical Methods: Fundamentals and Applications; Wiley New York: New York, NY, USA, 1980; Volume 2. [Google Scholar]
  25. Bard, A.J.; Faulkner, L.R. Fundamentals and applications. Electrochem. Methods 2001, 2, 580–632. [Google Scholar]
  26. Cassidy, J.F.; de Carvalho, R.C.; Betts, A.J. Use of Inner/Outer Sphere Terminology in Electrochemistry—A Hexacyanoferrate II/III Case Study. Electrochem 2023, 4, 313–349. [Google Scholar] [CrossRef]
  27. Bhatti, N.K.; Subhani, M.S.; Khan, A.Y.; Qureshi, R.; Rahman, A. Heterogeneous electron transfer rate constants of viologen at a platinum disk electrode. Turk. J. Chem. 2005, 29, 659–668. [Google Scholar]
  28. Bhatti, N.K.; Subhani, M.S.; Khan, A.Y.; Qureshi, R.; Rahman, A. Heterogeneous electron transfer rate constants of viologen monocations at a platinum disk electrode. Turk. J. Chem. 2006, 30, 165–180. [Google Scholar]
  29. Zoski, C.G. Handbook of Electrochemistry; Elsevier: Amsterdam, The Netherlands, 2006. [Google Scholar]
  30. Nicholson, R.S. Theory and application of cyclic voltammetry for measurement of electrode reaction kinetics. Anal. Chem. 1965, 37, 1351–1355. [Google Scholar] [CrossRef]
  31. ShangGuan, X.; Zhang, H.; Zheng, J. Electrochemical behavior and differential pulse voltammetric determination of paracetamol at a carbon ionic liquid electrode. Anal. Bioanal. Chem. 2008, 391, 1049–1055. [Google Scholar] [CrossRef]
  32. Muhammad, H.; Tahiri, I.A.; Muhammad, M.; Masood, Z.; Versiani, M.A.; Khaliq, O.; Latif, M.; Hanif, M. A comprehensive heterogeneous electron transfer rate constant evaluation of dissolved oxygen in DMSO at glassy carbon electrode measured by different electrochemical methods. J. Electroanal. Chem. 2016, 775, 157–162. [Google Scholar] [CrossRef]
  33. Nematollahi, D.; Shayani-Jam, H.; Alimoradi, M.; Niroomand, S. Electrochemical oxidation of acetaminophen in aqueous solutions: Kinetic evaluation of hydrolysis, hydroxylation and dimerization processes. Electrochim. Acta 2009, 54, 7407–7415. [Google Scholar] [CrossRef]
  34. Laviron, E.; Roullier, L.; Degrand, C. A multilayer model for the study of space distributed redox modified electrodes: Part II. Theory and application of linear potential sweep voltammetry for a simple reaction. J. Electroanal. Chem. Interf. Electrochem. 1980, 112, 11–23. [Google Scholar] [CrossRef]
  35. Bard, A.J.; Faulkner, L.R.; White, H.S. Electrochemical Methods: Fundamentals and Applications; John Wiley & Sons: Hoboken, NJ, USA, 2022. [Google Scholar]
  36. Savéant, J.-M.; Tessier, D. Variation of the electrochemical transfer coefficient with potential. Faraday Discuss. Chem. Soc. 1982, 74, 57–72. [Google Scholar] [CrossRef]
  37. Wang, J.; Schultze, J. Analytical electrochemistry. Angew. Chem.-Engl. Ed. 1996, 35, 1998. [Google Scholar]
  38. Eisner, U.; Gileadi, E. Anodic oxidation of hydrazine and its derivatives: Part I. The oxidation of hydrazine on gold electrodes in acid solutions. J. Electroanal. Chem. Interf. Electrochem. 1970, 28, 81–92. [Google Scholar] [CrossRef]
  39. Lavagnini, I.; Antiochia, R.; Magno, F. An extended method for the practical evaluation of the standard rate constant from cyclic voltammetric data. Electroanal. Int. J. Devoted Fundam. Pract. Asp. Electroanal. 2004, 16, 505–506. [Google Scholar] [CrossRef]
  40. Klingler, R.; Kochi, J. Electron-transfer kinetics from cyclic voltammetry. Quantitative description of electrochemical reversibility. J. Phys. Chem. 1981, 85, 1731–1741. [Google Scholar] [CrossRef]
  41. Klingler, R.; Kochi, J. Heterogeneous rates of electron transfer. Application of cyclic voltammetric techniques to irreversible electrochemical processes. J. Am. Chem. Soc. 1980, 102, 4790–4798. [Google Scholar] [CrossRef]
Figure 1. Cyclic voltammograms of 1 × 10⁻⁶ M of the paracetamol solution with 0.1 M of LiClO4 as the supporting electrolyte in the aqueous solution at different scan rates. Arrows show the direction of potential scan.
Electrochem 05 00004 g001
Figure 2. The plot of the (a) peak current versus scan rate and (b) peak current versus the sq. root of the scan rate. (c) The log of peak current versus the log of the scan rate (blue, anodic; red, cathodic).
Electrochem 05 00004 g002
Figure 3. Tafel plots drawn at 0.025 V/s and 0.300 V/s for the anodic peak.
Electrochem 05 00004 g003
Figure 4. The plot of (ν)−1/2 versus Ψ to calculate the value of k0.
Electrochem 05 00004 g004
Figure 5. The plot of peak potential versus the log of the scan rate (Vc corresponds to 0.190 V/s as indicated by pink vertical arrow).
Electrochem 05 00004 g005
Scheme 1. The reaction mechanism used to simulate the cyclic voltammogram.
Electrochem 05 00004 sch001
Figure 6. Overlay of the experimental (Exptl.) and digitally simulated (D.S.) cyclic voltammogram at a scan rate of 0.300 V/s.
Electrochem 05 00004 g006
Table 1. The value of transfer coefficients calculated from Equation (1) at different scan rates.
Scan Rate (V/s)α
0.0250.62
0.0500.55
0.0750.48
0.1000.46
0.1250.44
0.1500.41
0.1750.39
0.2000.38
0.2250.37
0.2500.35
0.2750.36
0.3000.31
Table 2. The values of the diffusion coefficient calculated from Equation (2) at different scan rates.
Scan Rate (V/s)D0 (×10−5 cm2/s)
0.0251.25
0.0501.51
0.0751.95
0.1001.86
0.1251.83
0.1502.12
0.1752.31
0.2002.42
0.2252.56
0.2502.67
0.2752.67
0.3003.01
Table 3. The scan rate, peak separation, and calculated value of Ψ (from Equation (5)) and k0 (from Equation (4)).
Scan Rate (V/s)ΔEp (mV)Ψk0 (cm/s)
0.025741.830.022
0.050841.060.018
0.075841.060.022
0.100880.890.022
0.125880.890.024
0.150910.800.024
0.175940.720.023
0.200970.650.023
0.225960.680.025
0.2501010.580.022
0.2751020.560.023
0.3001090.470.020
Table 4. Calculated values of k0 using the Kochi and Klinger method.
Scan Rate (V/s)k0 (cm/s)
0.0250.001
0.0500.002
0.0750.004
0.1000.005
0.1250.006
0.1500.007
0.1750.008
0.2000.009
0.2250.010
0.2500.010
0.2750.011
0.3000.013
Disclaimer/Publisher’s Note: The statements, opinions and data contained in all publications are solely those of the individual author(s) and contributor(s) and not of MDPI and/or the editor(s). MDPI and/or the editor(s) disclaim responsibility for any injury to people or property resulting from any ideas, methods, instructions or products referred to in the content.

