Article

A Novel Online State of Health Estimation Method for Electric Vehicle Pouch Cells Using Magnetic Field Imaging and Convolution Neural Networks

School of Electronic Engineering and Computer Science, Queen Mary University of London, Mile End Road, London E1 4NS, UK
*
Author to whom correspondence should be addressed.
Electrochem 2022, 3(4), 769-788; https://doi.org/10.3390/electrochem3040051
Submission received: 15 September 2022 / Revised: 31 October 2022 / Accepted: 9 November 2022 / Published: 18 November 2022
(This article belongs to the Special Issue Advances in Electrochemical Energy Storage Systems)

Abstract

:
Lithium-ion batteries (LiBs) are used as the main power source in electric vehicles (EVs). Despite their high energy density and commercial availability, LiBs chronically suffer from non-uniform cell ageing, leading to early capacity fade in the battery packs. In this paper, a non-invasive, online characterisation method based on deep learning models is proposed for cell-level SoH estimation. For an accurate measurement of the state of health (SoH), we need to characterize electrochemical capacity fade scenarios carefully. Then, with the help of real-time monitoring, the control systems can reduce the LiB’s degradation. The proposed method, which is based on convolutional neural networks (CNN), characterises the changes in current density distributions originating from the positive electrodes in different SoH states. For training and classification by the deep learning model, current density images (CDIs) were experimentally acquired in different ageing conditions. The results confirm the efficiency of the proposed approach in online SoH estimation and the prediction of the capacity fade scenarios.

1. Introduction

The share of electric vehicles (EVs) is increasing in the global transportation system thanks to the continuous reduction of the manufacturing costs of the lithium-ion battery (LiB) cells/packs (LiB pack costs reduced from USD 1183/kWh in 2010 to USD 156/kWh in 2019 [1]). LiBs for EVs offer a range of benefits over other battery types including higher specific energy, higher energy density, and longer life cycles. The EV markets demand higher cell capacities to eliminate the range of "anxiety" problems and accelerate the uptake of EVs according to government plans. However, it is well-known that high-capacity battery cells are subject to non-uniform early ageing, especially due to fast charging [2]. Predicting the lifetime of LiBs is a critical challenge that causes limitations on integrating battery electric vehicles (BEVs) into the market. Moreover, LiB life performance cycles are inextricably tied to the underlying mechanisms of their ageing [3].
The EV battery pack is composed of cells and modules. In a module, LiB cells can be arranged in series/parallel based on their form factors, e.g., pouch, cylindrical, and prismatic [4]. During their lifetimes, LiBs exhibit gradual decreases in their available capacities, manifested as a loss of autonomy for the powered device. This is observed both during charge/discharge cycling and in storage, which is often known as calendar ageing [5]. Non-uniform ageing in the LiB cells makes the task of a battery management system (BMS) complex, especially during the charging/discharging process, as the cells operate under different conditions depending on their state of health (SoH) and state of charge (SoC). In a battery pack, as shown in Figure 1, the BMS monitors parameters that are affected by SoC and SoH in each module, including temperature, voltage, and magnetic field data captured from each cell in a module. Non-uniform ageing can be rooted in manufacturing inconsistencies, e.g., new pouch cells with slight differences in capacity, impedance, and self-discharge rate. This causes significant energy imbalance among cells leading to the overall degradation of the battery pack. Therefore, accurate calculations of the SoH in individual cells will enhance the BMS functionality in SoX (SoH, SoC, SoF (state of function), and SoP (state of power)) monitoring, prolonging the battery cycle/calendar life, and ensuring higher power reliability [4,6,7].
The SoH is an important parameter for a LiB cell indicating the degradation level [2], and it is normally determined as the percentage of the cell’s full charge capacity C f u l l c h a r g e to its designed capacity level C d e s i g n [8]. For the reasons mentioned above, cells show nonlinear complex behaviors, making the SoH estimation in real time a challenging task. Online monitoring is an important function in an EV since it provides important information for a BMS to optimize the charging trajectories, distribute the charge, and heat across the cells uniformly, preventing hazardous conditions, such as thermal runaway [9]. To date, non-invasive SoH estimation has not been adopted by the EV industry and OEM manufacturers due to the challenges in designing sensory devices, and/or implementing an effective estimation algorithm that operates in real time. Accurate SoH estimation further allows predicting the calendar ageing, timely maintenance, and replacement schedules for battery packs, saving significant costs for EV manufacturers [10]. Some conventional SOH estimation methods include direct experimental methods, using adaptive filters in model-based approaches, and data-driven, and machine learning techniques.
The experimental methods, e.g., measuring the internal resistances using the spectroscopy technique, are normally not well suited for online monitoring and require considerable time for data collection in lab conditions. These methods are used to evaluate the battery ageing behavior based on measurements and data collection [11]. Two of the most common approaches are measuring internal resistance/impedance and measuring the energy level [10]. To measure internal resistance in LiBs, the authors of [12] used the current pulse method to study the internal resistance and heat generation of LiBs during charging and discharging. Using experimental techniques to measure the battery’s internal resistance leads to accurate results, yet onboard measurements are challenging. However, the internal impedance of a battery tends to increase with age [10], leading to error accumulation in the results. To overcome this problem, the authors of [13] suggested combining short-term relaxation effects and fractional order impedance modelling with electrochemical impedance spectroscopy (EIS) characterisation. Their approach involved a non-destructive method of measuring battery impedance that offered extensive information on the battery’s status. Using EIS as part of a BMS, however, presents numerous obstacles, including establishing the operational circumstances under which the sensitive EIS measurement may be done. Furthermore, many hours of rest are necessary in laboratory conditions to maintain the battery’s consistent reaction; however, such rest times are inefficient for BMS applications.
In the industry, direct measurements of the current, voltage, and temperature using sensors have made accurate SoH estimations feasible in battery packs. The authors of [14] proposed a comprehensively optimised framework for the LiB SOH estimation with the local Coulomb counting curve (LCCC), aiming to enhance the estimation for data-driven estimators. Moreover, in a recent project, a UK-based company, DukosiTM, developed a revolutionary battery management solution that uses wireless communications protocols to send data on the state of individual battery cells throughout the battery pack. According to [15], the BMS chipset combines near-field communication technology with a single antenna to monitor and analyse data directly on individual battery cells using machine learning algorithms, and wirelessly transmit these data to the central BMS.
The model-based and adaptive filtering methods, also called soft approaches, e.g., Kalman filtering, can better suit the onboard applications using a simple battery model, e.g., an equivalent circuit model (ECM). Model-based methods are widely used to model the battery behaviors for SoH and SoC estimations. In the literature, several adaptive algorithms are highlighted to identify the parameters of various types of ECMs. Kalman filter-based methods are frequently applied for achieving more accurate estimations [16,17]. For example, in [18], the authors use battery polynomial models with the dual extended Kalman filter (DEKF) method to estimate SoC and SoH simultaneously. Other popular adaptive filtering algorithms are least square-based algorithms [19,20]. To reduce the estimation processing time, the authors of [19] suggest a battery model based on least-square support vector regression (LS-SVR).
Overall, adaptive algorithms are rather robust with simple structures. In [21], the authors proposed a new robust method entitled the extendable range multi-model estimator (ERMES) for accurate SoC and SoH estimations. In this method, a finite number of models, based on the Thévenin model of the battery, are considered in the form of state-space models. Then, an iterated extended Kalman filter (EKF) is applied to each model for SoH estimation. In another study, the authors of [22] used CNN to conduct a robust SoH estimation method by extracting indicators for changes in the level of SOH between two charge/discharge cycles. Then, the random forest algorithm was applied to the final SOH estimation by exploiting the indicators from the CNNs. Through a comparison, the robust estimation methods demonstrated improved estimation accuracy and robustness. However, to achieve the desired accuracy, the algorithm can become complex, demanding high processing power, which is out of reach on the EV’s onboard processors. Models are then needed for describing the complete behavior of a battery cell, such as a physics model. Achieving a reduced-order electrochemical (physics) model for faster processing is still under research. Using the pseudo-2-dimensional (P2D) physics model, the cell’s partial differential equation can represent the battery’s electrochemical reactions and heat transfer [10]. Another advantage of physics models is the accurate representation of the changes in a magnetic field and the produced current density distribution across electrodes and the electrolyte.
To achieve high-fidelity models for LiBs, data-driven, and machine learning methods [23,24] are used with successful results. However, these approaches face two main challenges: (1) They need a large volume of training data for building an accurate model. This means a significant charge/discharge cycle testing. (2) The training data set must be large enough to include all the online physical and dynamic changes resulting in the early capacity fade. A data-driven approach can become really useful in collecting historical degradation data, and understanding the ageing process, which is why deep learning methods are applied for SoH estimation in EV battery systems [25,26,27]. In another valuable work, the authors of [28] used machine learning methods for characterisation of the critical cell parameters, i.e., voltage, current, and temperature, which affect ageing. On the other hand, in our paper, the unique ageing monitoring method using direct measurements of the magnetic field is presented; it demonstrates that the current density distribution pattern is linked to battery ageing. Moreover, a novel SoH estimation method based on the captured current density images is utilised for training the CNN model.
Deep learning methods are generally known as improvements for existing multi-layer perceptron models since they are designed to eliminate former limitations. Among deep learning methods, the convolutional neural network (CNN) has a strong capability of performing feature distillation and representation with the main application in image recognition [22,29,30]. To summarise, some of the mentioned SoH estimation methods, as well as their characterisations, are presented in Table 1.
In this paper, we propose a hybrid approach based on both experimental and model data. A highly accurate Newman model of the test cell is developed to improve the data set library by studying the LiB pouch cell in different ageing scenarios. A CNN algorithm is then used to characterise the current density distribution collected as a series of images from the model under different ageing scenarios during the charging process. Finally, our designed CNN-based method for SoH estimation is used as a part of the condition monitoring system (CMS) in the battery pack to accurately detect and predict the percentage of SoH for each pouch cell in every module. Current density imaging in LiBs, as studied fundamentally in our previous research [31] and in [32], is an online, non-destructive method that uses an array of magnetic sensors to capture the current density distribution of an individual cell. The suggested CNN algorithm establishes a relationship between LiB parameters and SoH in a multi-parameter cell model, and is particularly useful in fast-charging scenarios as a major source of battery degradation and overheating. Our contributions can be summarised as follows:
  • A novel SoH estimation approach based on current density images (CDIs) is proposed. This method uses the convolutional neural network (CNN) algorithm to classify and characterise a collection of captured CDIs, from a highly accurate Newman model of the NMC graphite cells of the battery pack and calculates the accurate SoH based on the cell parameters.
  • Fast, online readings using an Arduino board connected to a 4 × 8 array of magnetic sensors were carried out for capturing the current density distributions across the positive electrode of a Li-ion pouch cell.
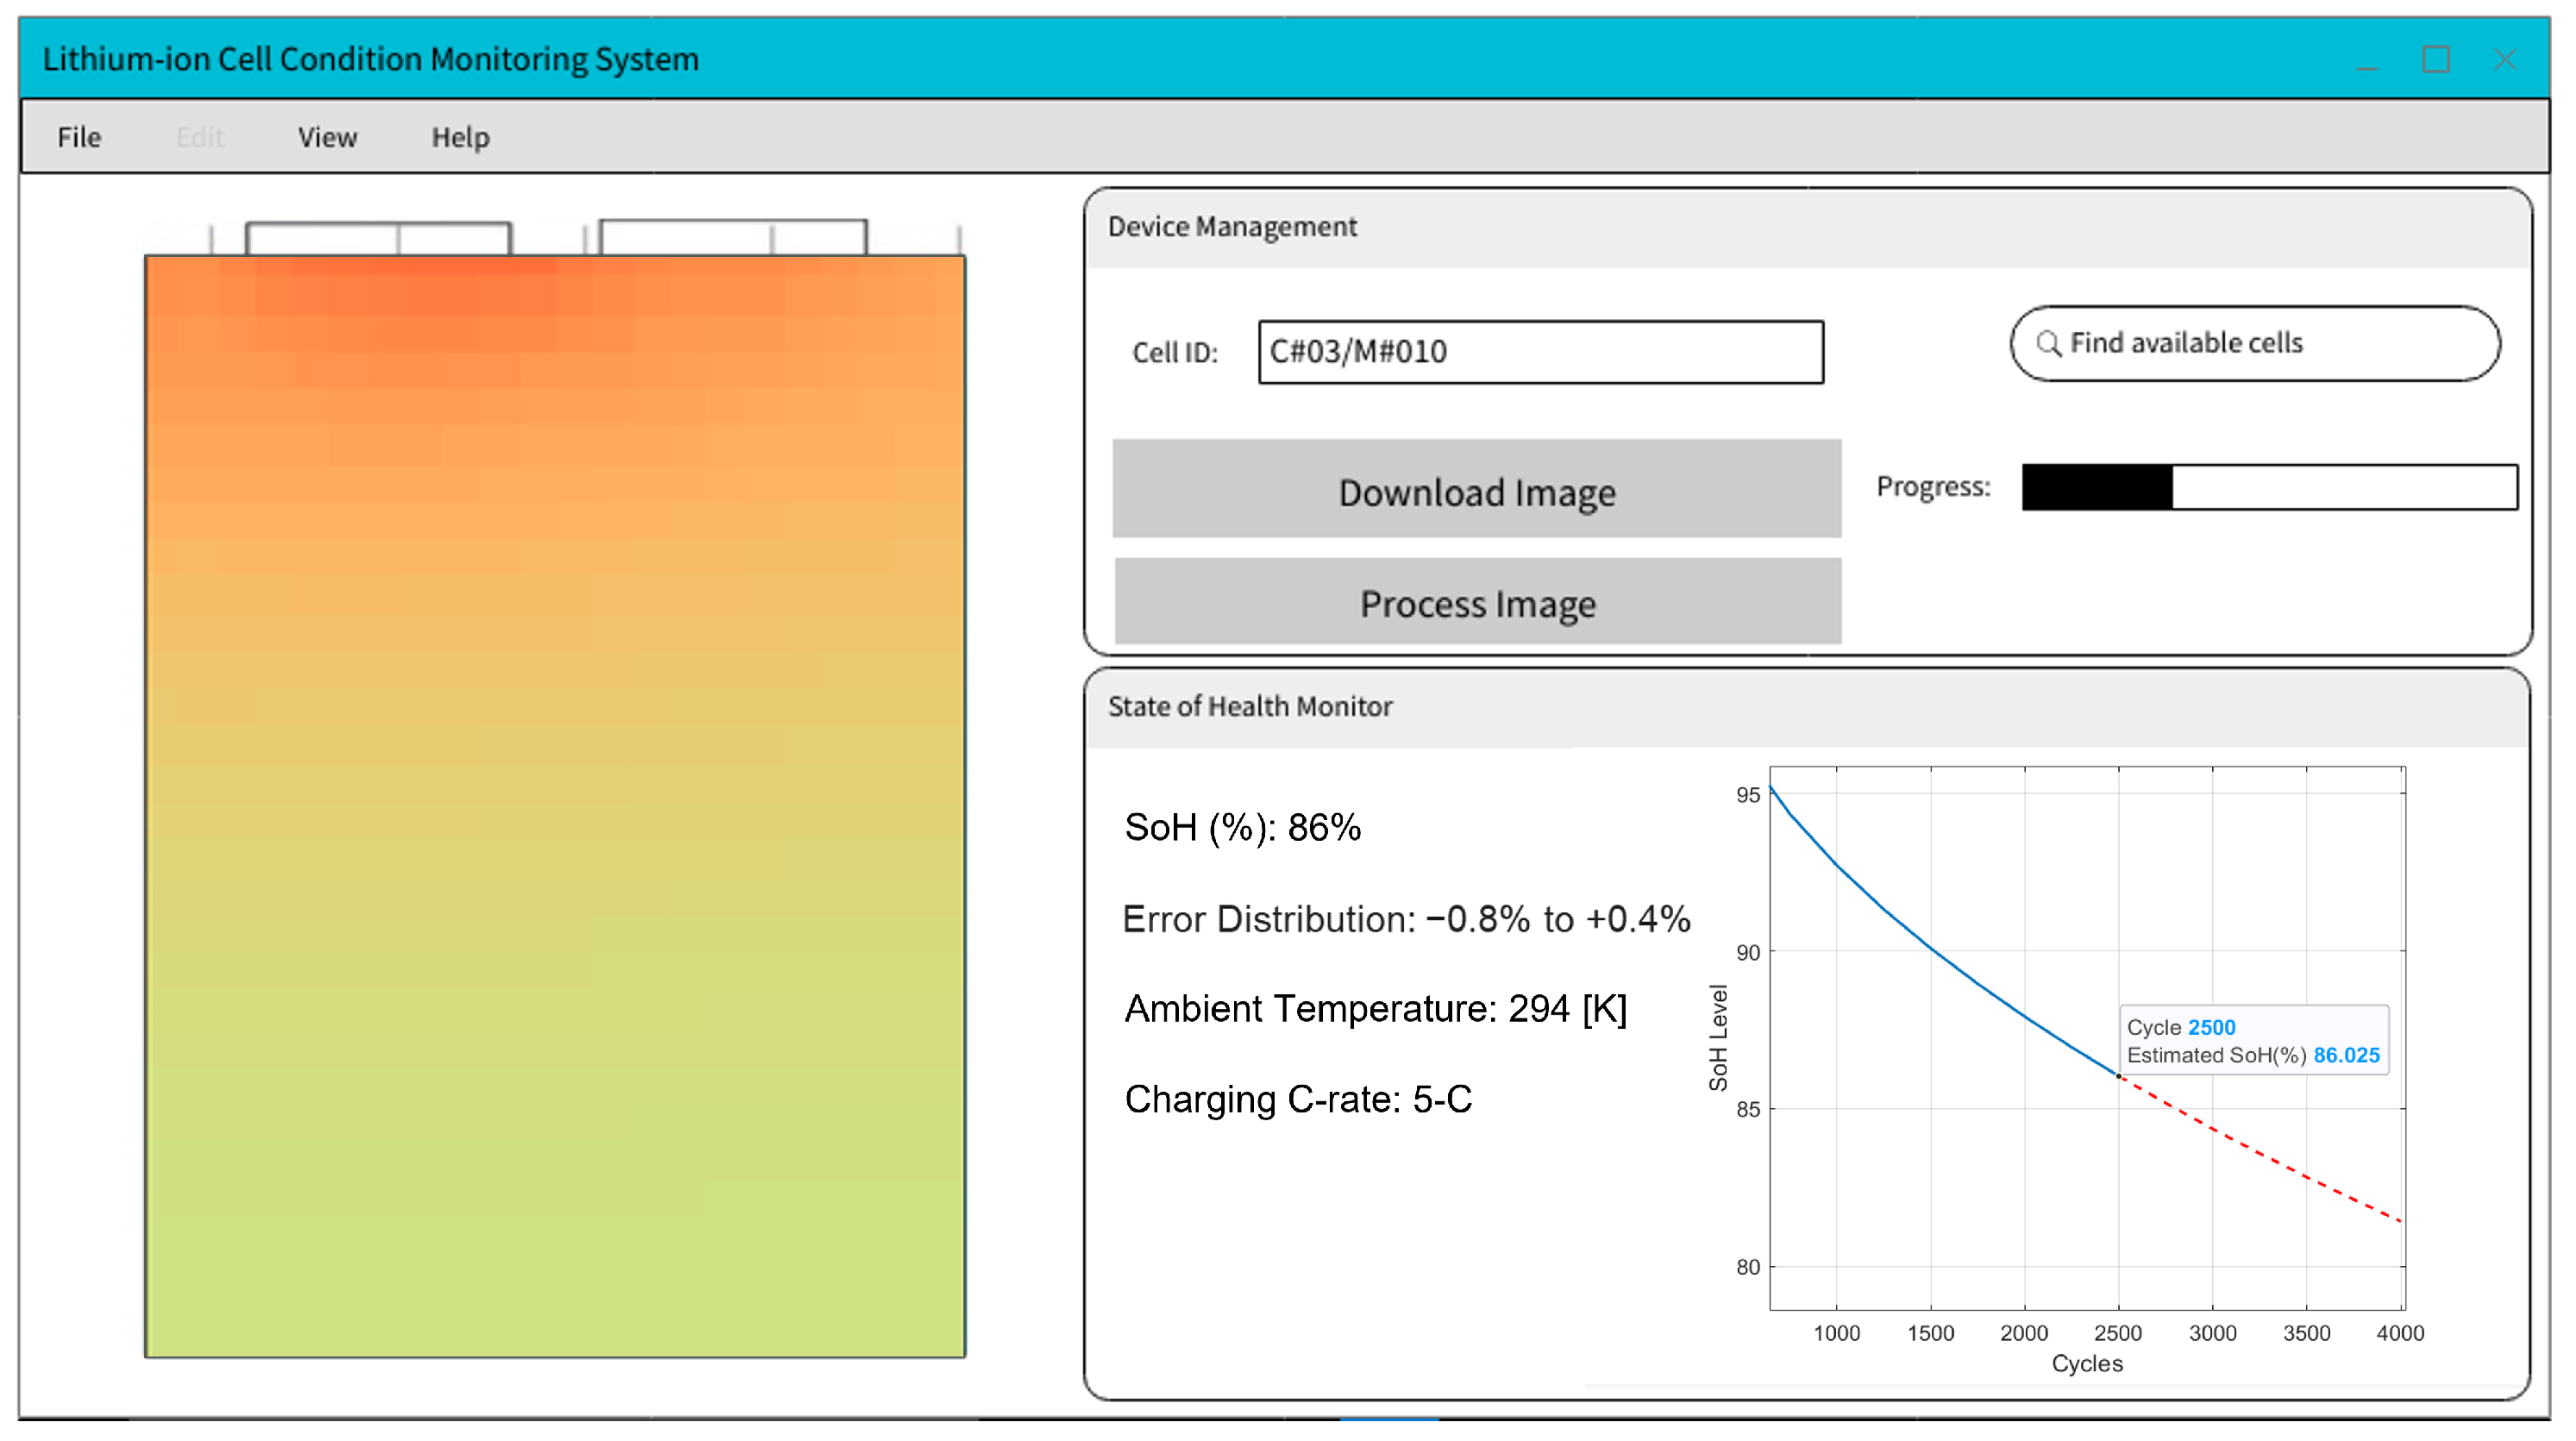
  • As a part of a condition monitoring system (CMS), a Python-based user interface with an embedded inference model was designed to monitor the remaining SoH of the selected cells, based on the recorded current density images.
The rest of the paper is organised as follows. In Section 2, the advantages of monitoring magnetic field, as well as preliminaries of the Newman model are described. In Section 3, the CNN model is proposed to classify CDIs captured from the positive electrode in different SoH conditions. Validation and discussion of results are then provided in Section 4. We used a Doyle–Fuller–Newman (DFN) model of Nissan Leaf pouch cells based on the experimental data to study different ageing scenarios using the vehicle data to better understand the behavior of LiB pouch cells in a pack arrangement. We measured the current density distribution, i.e., current density images, acquired by quantum-based fluxgate magnetometers, placed on the cell. The experimental test bench and the validation of the 3D DFN model are also demonstrated in this section. Finally, the paper is concluded in Section 5.

2. Magnetic Field Monitoring in LiBs

Measurements of small changes in induced magnetic field maps are used to diagnose mechanical degradation in LiBs [33]. This technique is further found useful for assessing the level of lithium incorporation in the electrode. SoH estimation is not a trivial task among BMS functions, since the ageing process of LiBs naturally takes several cycles over a long period. In [34], magnetic field monitoring is also used as a non-destructive approach for measuring mechanical degradation and the ensuing capacity fade. The approach was found to be effective for testing post-manufacturing faults; however, it cannot be used for online monitoring. Another study shows that the cell’s produced magnetic field can provide useful information for the estimation of the cell temperature [35]. The magnetic field data (and the current density distribution) can provide promising measurements of internal cell parameters. However, an advanced method is required to characterise ageing using the cell’s current density distribution. For this purpose, a DFN model (or simply, the Newman model) is used to describe the internal states of the battery. Moreover, the developed Newman model based on the experimental data is used to study current densities in a cell.

2.1. Preliminaries of the DFN Model

A physics-based electrochemical model of the cell used in lab experiments was required for further studies of BMS functionalities, such as SoC and SoH estimation and fast charging. The DFN model of the LiB cell used in the experimental part of this paper is developed based on electrochemistry laws and is described by a set of partial differential equations (PDEs). In this section, we briefly demonstrate and formulate the Newman model used in this paper.
The Nissan Leaf third-gen LiB cell consists of positive and negative electrodes, a separator, and two current collectors. The negative electrode, separator, and positive electrode are shown in the x dimension as demonstrated in Figure 2, where the cell is modelled during charging. In Figure 2, the thickness of the negative and positive electrodes are shown as δ and δ + , respectively, and the solid-phase materials are represented by spheres with a radius of R s ; it is shown how intercalated Lithium-ions in the positive electrode (i.e., x L δ + , L ) exit the solid particles, pass through the separator in the electrolyte phase, and enter the solid particles in the negative electrode (i.e., x 0 , δ ).
The governing equations of the Newman model are summarized in Table 2. Moreover, key parameters and their values used in the developed model of the Nissan Leaf’s cell are provided in Table 3 [36,37]. According to Fick’s law of diffusion, the Li-ion concentration in the solid phase (shown as c s in equations) in both positive and negative electrodes is given in (1a), where t denotes time, R s is the radius of particles, and r 0 , R S . Similarly, the Li-ion concentration in the electrolyte phase (shown as c e in equations) is given in (1b), based on the electrolyte volume fraction (also known as porosity), the diffusion coefficient of Lithium-ion in the electrolyte phase and the transport number of ions. Moreover, the volume-specific rate of the electrochemical reaction is shown as J L i and F denotes Faraday’s constant. Symbols used in (1b) are further described in Table 3.
Boundary conditions for Li-ion concentration in both solid and electrolyte phases are given in (2a), (2b), respectively. In (2a), D s denotes the diffusion coefficient in the solid phase and j L i is the volumetric electrochemical reaction rate, which is calculated based on the active material volume fraction. Symbols used in (2a) are defined in more detail in Table 3.
The solid phase potential, ϕ s , which is formulated based on Ohm’s law, as well as the electrolyte phase potential, ϕ e , and their boundary conditions are all defined in more detail in [36,37]. The exchange current density described in (3a) is formulated based on the PDEs of Li-ion concentration and potential in both solid and electrolyte phases. Finally, as given in (3b), the terminal voltage is calculated based on ϕ s , the film resistance of the current collector, the area of the electrode plate, and the applied current through the cell. More description of the symbols used in (3a), (3b) is provided in Table 3.

2.2. Sources of Magnetic Fields Produced by a LiB Cell

Primarily, there are two major sources of magnetic fields produced by a LiB cell; the first source includes surface currents in the electrode, and the second source includes charge transfer currents, which mainly occur in the electrolyte. In this paper, we focus on current density originating from the positive electrode, where the electron conduction in an electrode can be formulated in a similar way to Ohm’s law:
· i s = 0 ,
where i s is the current density vector in the electrode, and described as:
i s = σ s ϕ s ,
where σ s is the electrical conductivity (SI unit: S/m) and ϕ s is the electric potential in the electrode. The changes in the value and direction of the mentioned currents will determine the rate of the cell’s produced magnetic field [35]. Furthermore, preliminaries of current density estimations are described in detail in our previous work [31].

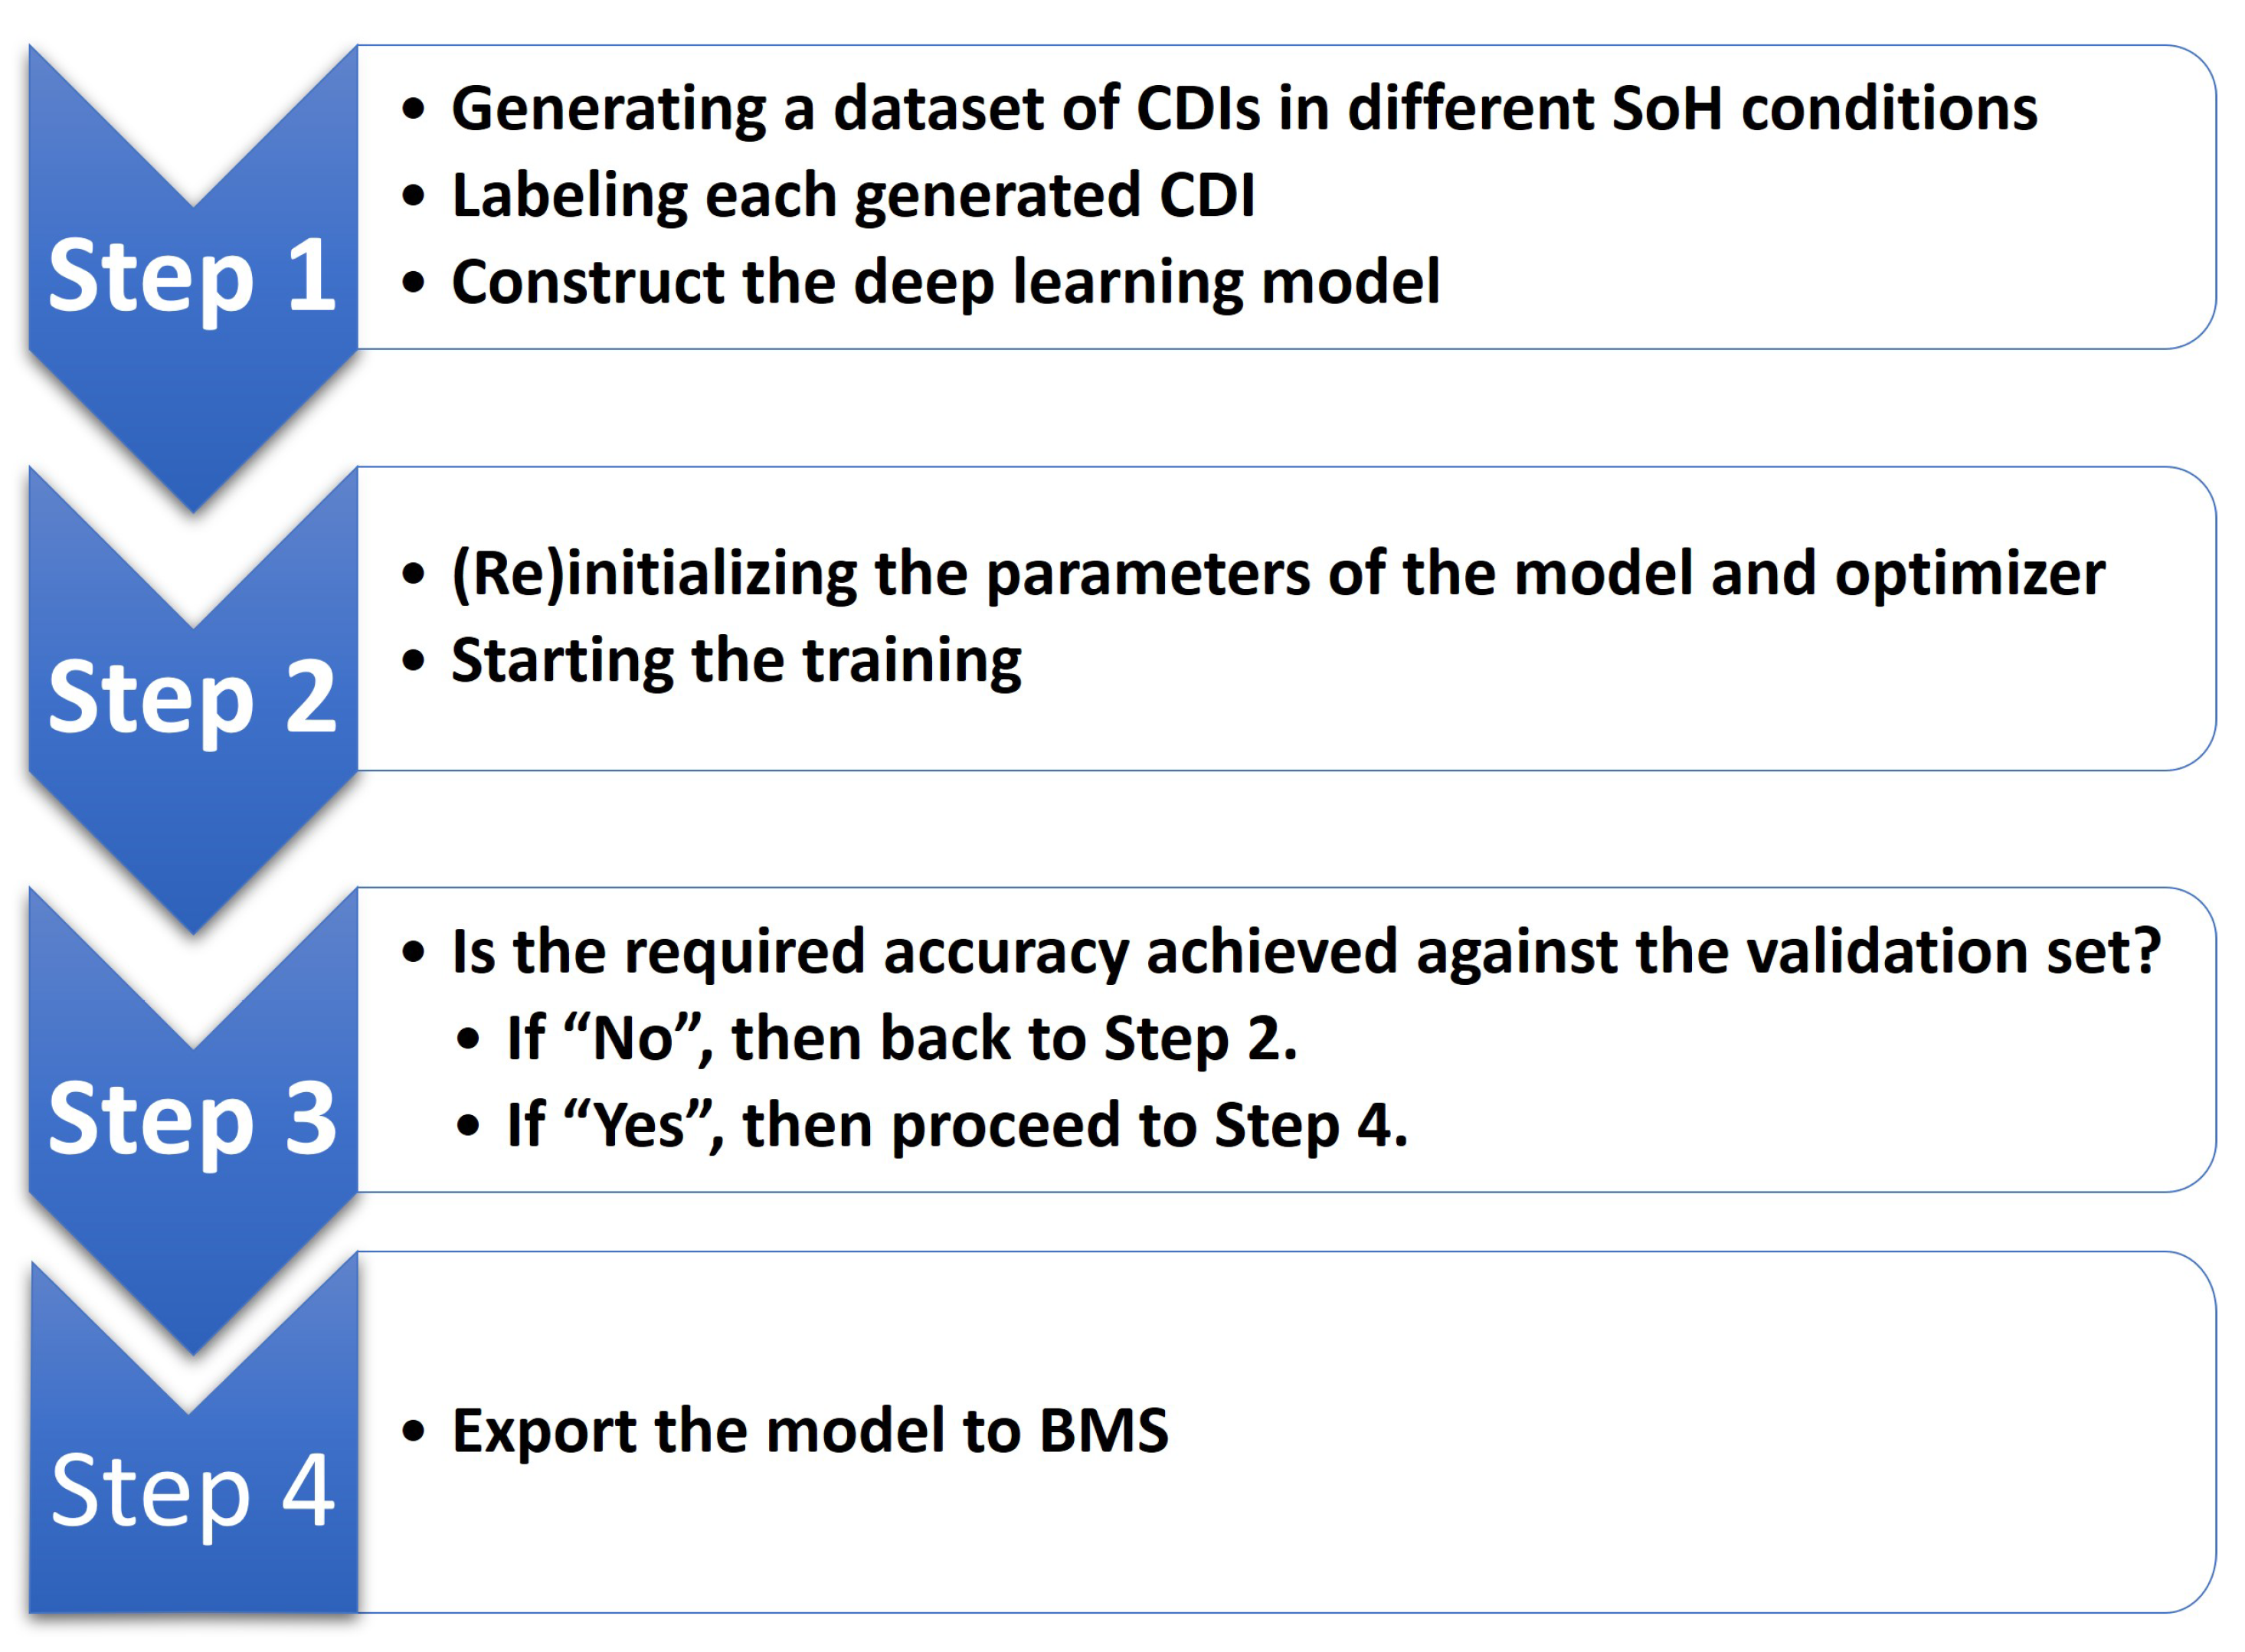
3. Characterisation of Current Density Images Using Deep Learning

Measurements of the current densities on the surfaces of the electrodes provide the required data to produce CDIs [31]. Developing closed-form equations to translate the CDI parameters to SoH values is difficult due to the complicated dynamics. This includes conducting data normalisation in the first place and processing the signals before feeding them to the network, to prevent delaying the training process and lowering estimation accuracy. For this purpose, the application of deep learning is suitable for the characterisation and classification of CDIs. CNNs are powerful methods for extracting characteristics from different types of high-dimensional data, such as images, and they have been employed in a variety of applications including image processing, speech recognition, and text categorisation. High temporal correlations between nearby variables are common in these high-dimensional signals, which may be successfully retrieved via convolution processes.
CNN, as a deep learning algorithm originally designed for image processing, has a strong capability of feature distillation, and feature extraction in CDIs, generated from the DFN model. CNN is basically a layered neural network model composed of connected layers of feature mapping and pooling. These series of layers determine the number of parameters involved in training the neural network. For feature map r th in layer l, the node C r , l a , t at a th row and t th column can be computed as
C r , l a , t = f v i = 0 m l 1 j = 0 n l 1 x v , l a · s l + i , t · d l + j ω v , r , l i , j + b r , l ,
where x v , l R p × q × v is layer l th input with depth (number of channels) v, with p × q channel size. For the next connected layer input, v denotes feature maps count in the layer ( l 1 ) th . ω v , r , l R m l × n l is v th channel of the filter r th in layer l, with size m l × n l and stride set to s l , d l . Bias of r th feature map is modeled as b r , l . f ( . ) denotes the activation function, which is rectified linear unit (ReLU), given by
f ( x ) = 0 for x < 0 x for x 0
The pooling layer is a downsampling technique that minimises the number of feature maps generated in a convolution layer by using the maximum pooling approach, which is modelled as:
P r , l + 1 a , t = max 0 i m ( l + 1 ) 1 , 0 j n ( l + 1 ) 1 C r , l a · s ( l + 1 ) + i , t · d ( l + 1 ) + j ,
or an average pooling strategy represented by
P r , l + 1 a , t = i = 0 m ( l + 1 ) 1 j = 0 n ( l + 1 ) 1 C r , l a · s ( l + 1 ) + i , t · d ( l + 1 ) + j m ( l + 1 ) × n ( l + 1 ) ,
where s ( l + 1 ) , d ( l + 1 ) is the strides of the pooling filter in layer l + 1 and m ( l + 1 ) , n ( l + 1 ) is pooling area size [29]. Subsequently, by adding fully connected layers of convolution, pooling, and flattening, the final output is derived as follows:
O = f j = 1 z x ( j ) ω ( j ) + b
where x is the previous layer inputs, ω and b denotes the weights and biases connecting to x and final output, respectively. Finally, O is the estimated battery SoH on the output of CNN.
The proposed approach in the CDI image classification is illustrated in Figure 3 where the CDIs are the input layer of the CNN with several layers of convolution and sub-sampling (pooling) for image classification.
The proposed deep learning model consists of a deep CNN model along with a fully connected single output layer to provide the regression results. The training and validation dataset is collected from the experimental and the DFN model results. In fact, the addition of CDIs achieved from the physics-based model into the training dataset has considerably improved the accuracy of the classifier. As a result, different parametric variations, i.e., current and voltage distribution across the electrodes, can be evaluated with high accuracy. The optimizer in the TensorFlow library chosen in this work is “Adam” with a mean squared error loss function.
After providing the dataset, the collected CDIs are labelled with LiB parameters, and the model is trained using the TensorFlow library. See the step diagram of Figure 4 for the complete process of data extraction and learning process. To avoid over-fitting during the training and to utilize the CNN model to generalize and make accurate predictions for new entries, the cross-validation technique is applied to the model. Hence, CDIs captured from the DFN model are used as the training set to train the CNN model, as well as a validation set including CDIs collected from the experimental results to evaluate the performance of the CNN model.
The first layer has four two-dimensional convolution filters (aka conv2D in TensorFlow) with 3 × 3 filter kernel sizes and 30 × 22 input dimensions. The input layer is structured into 30 × 22 fixed point values as the input magnetic field images to the CNN model have this resolution. Furthermore, as the model inference process was designed to run in real time on low-power embedded CPUs for battery condition monitoring systems, the smallest filter size was desired that provides an acceptable accuracy, and the 3 × 3 kernel size was found to be a good trade-off between the inference time and accuracy.

4. Experimental Validation and Discussion of Results

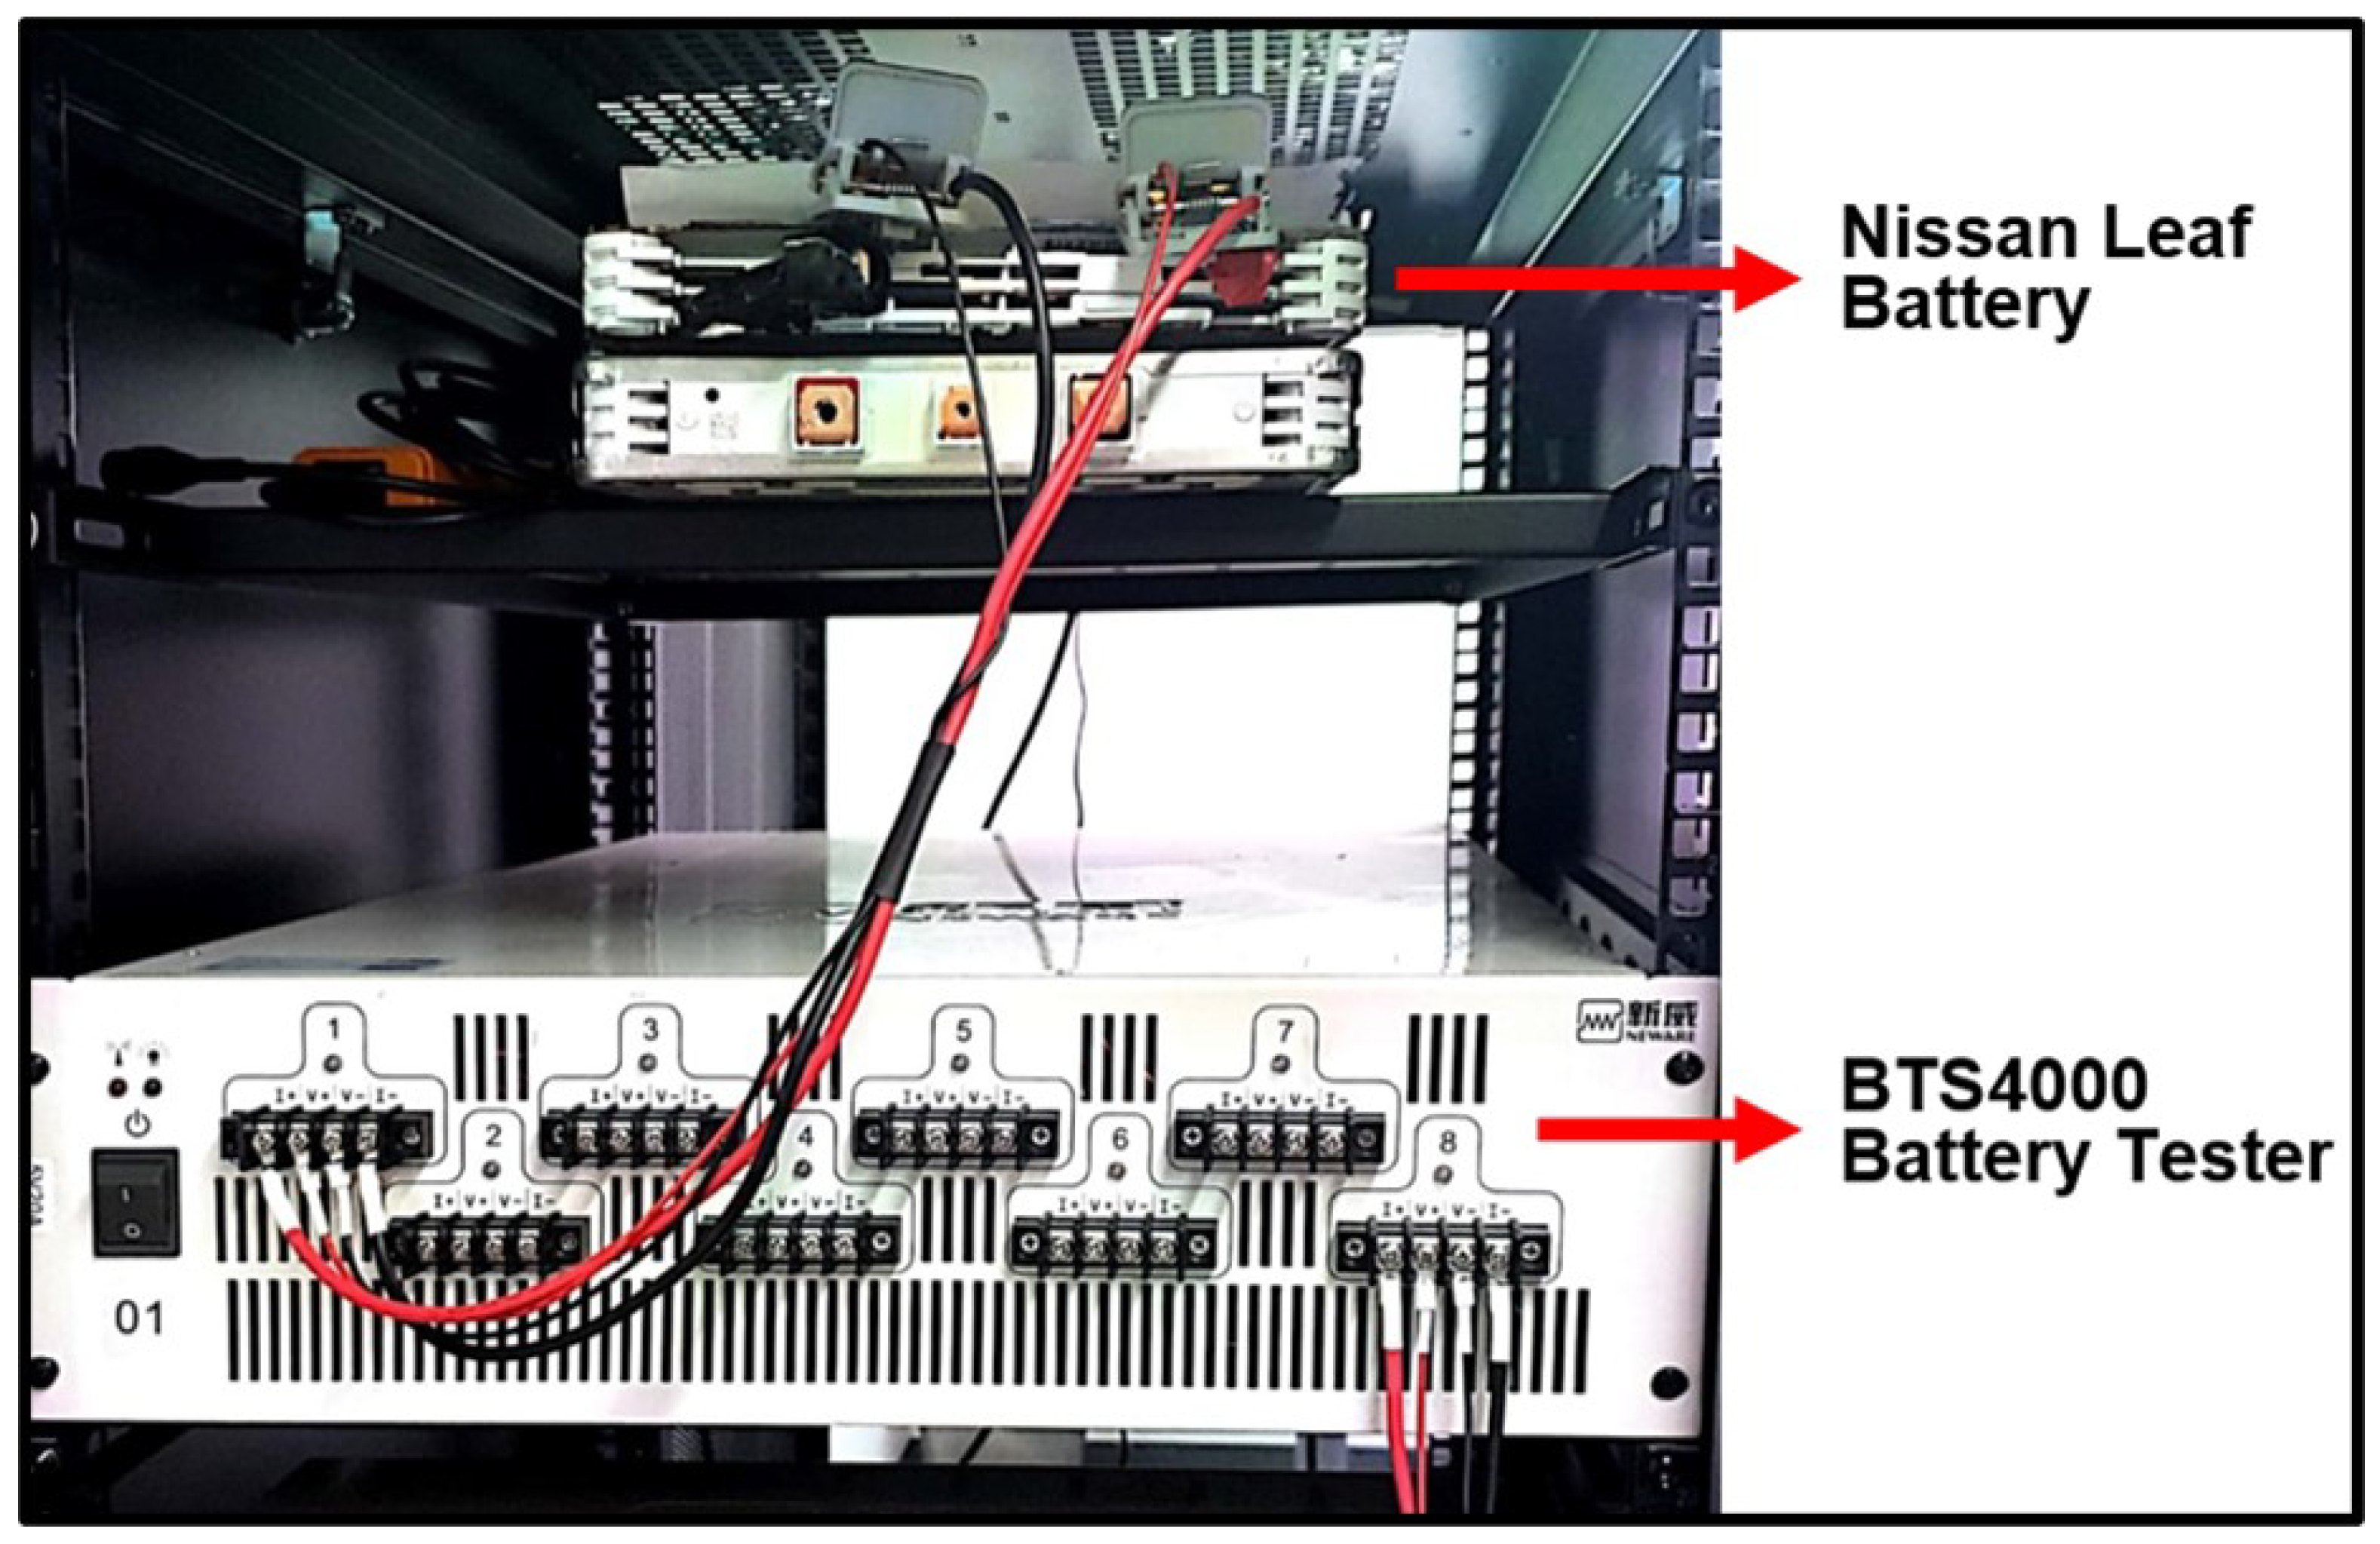
4.1. Experimental Test-Bench and Model Validation

In the experimental setup, the Nissan Leaf 3rd-Gen pouch cell used for testing is connected to the eight-channel Neware BTS-4000 battery cycler (25A per channel) for charging, as shown in Figure 5. The current collectors of the LiB pouch cell are made of Copper and Aluminium. The positive electrode is Li Ni 1 / 3 Mn 1 / 3 Co 1 / 3 O 2 (NMC) and the negative electrode is made of graphite. Moreover, the electrolyte in this cell is LiPF6 in 3:7 EC:EMC. Using a 4 × 8 array of fluxgate magnetic sensor devices, connected to an Arduino board via an analog connection, the magnetic field images (MFIs) are captured and sent to the computer for further data processing using MATLAB. The area of each magnetic field sensor used in this paper is 16 mm 2 . Compared to Hall-effect sensors, which are conventional methods of sensing magnetic fields, fluxgate sensors offer considerably higher accuracy and sensitivity, lower noise and drift, and high linearity with a sensing range of ±2 milliteslas (mTs). To test the sensor’s resolution, it was placed on a PCB trace to measure the magnetic field on the top of a wire carrying 50 mA current. It was observed that with each 50 mA change in current, the sensor detected a change of 10.2 μ T in the magnetic field as the output.
Furthermore, a DFN model of the pouch cells was developed using the Python Battery Mathematical Modelling (PyBAMM) tool and validated against the original experimental data. A comparison between the practical work and the model is shown in Figure 6, with the values of the output cell voltage during the charging/discharging cycle process. The experiment consists of a cycle of constant current (C/10) discharge, a 1 h rest, and a constant current (1 A) charge until the voltage reaches 4.1 volts.
The MFIs and corresponding CDIs (according to Maxwell’s original circuital law, the magnetic field and current density are directly proportional to each other. Hence, the CDIs will have the same patterns as magnetic field readings) were monitored during the charging process. Using an embedded microcontroller on the sensor array, an inversion calculation along with a noise cancellation algorithm was applied to convert the magnetic field profile to the current density profile. The experimental CDIs are compared with the CDIs acquired from the cell 3D model, generated in COMSOL, as explained in our previous paper [31]; for further validation and processing to calculate the SoH values, see Figure 4.

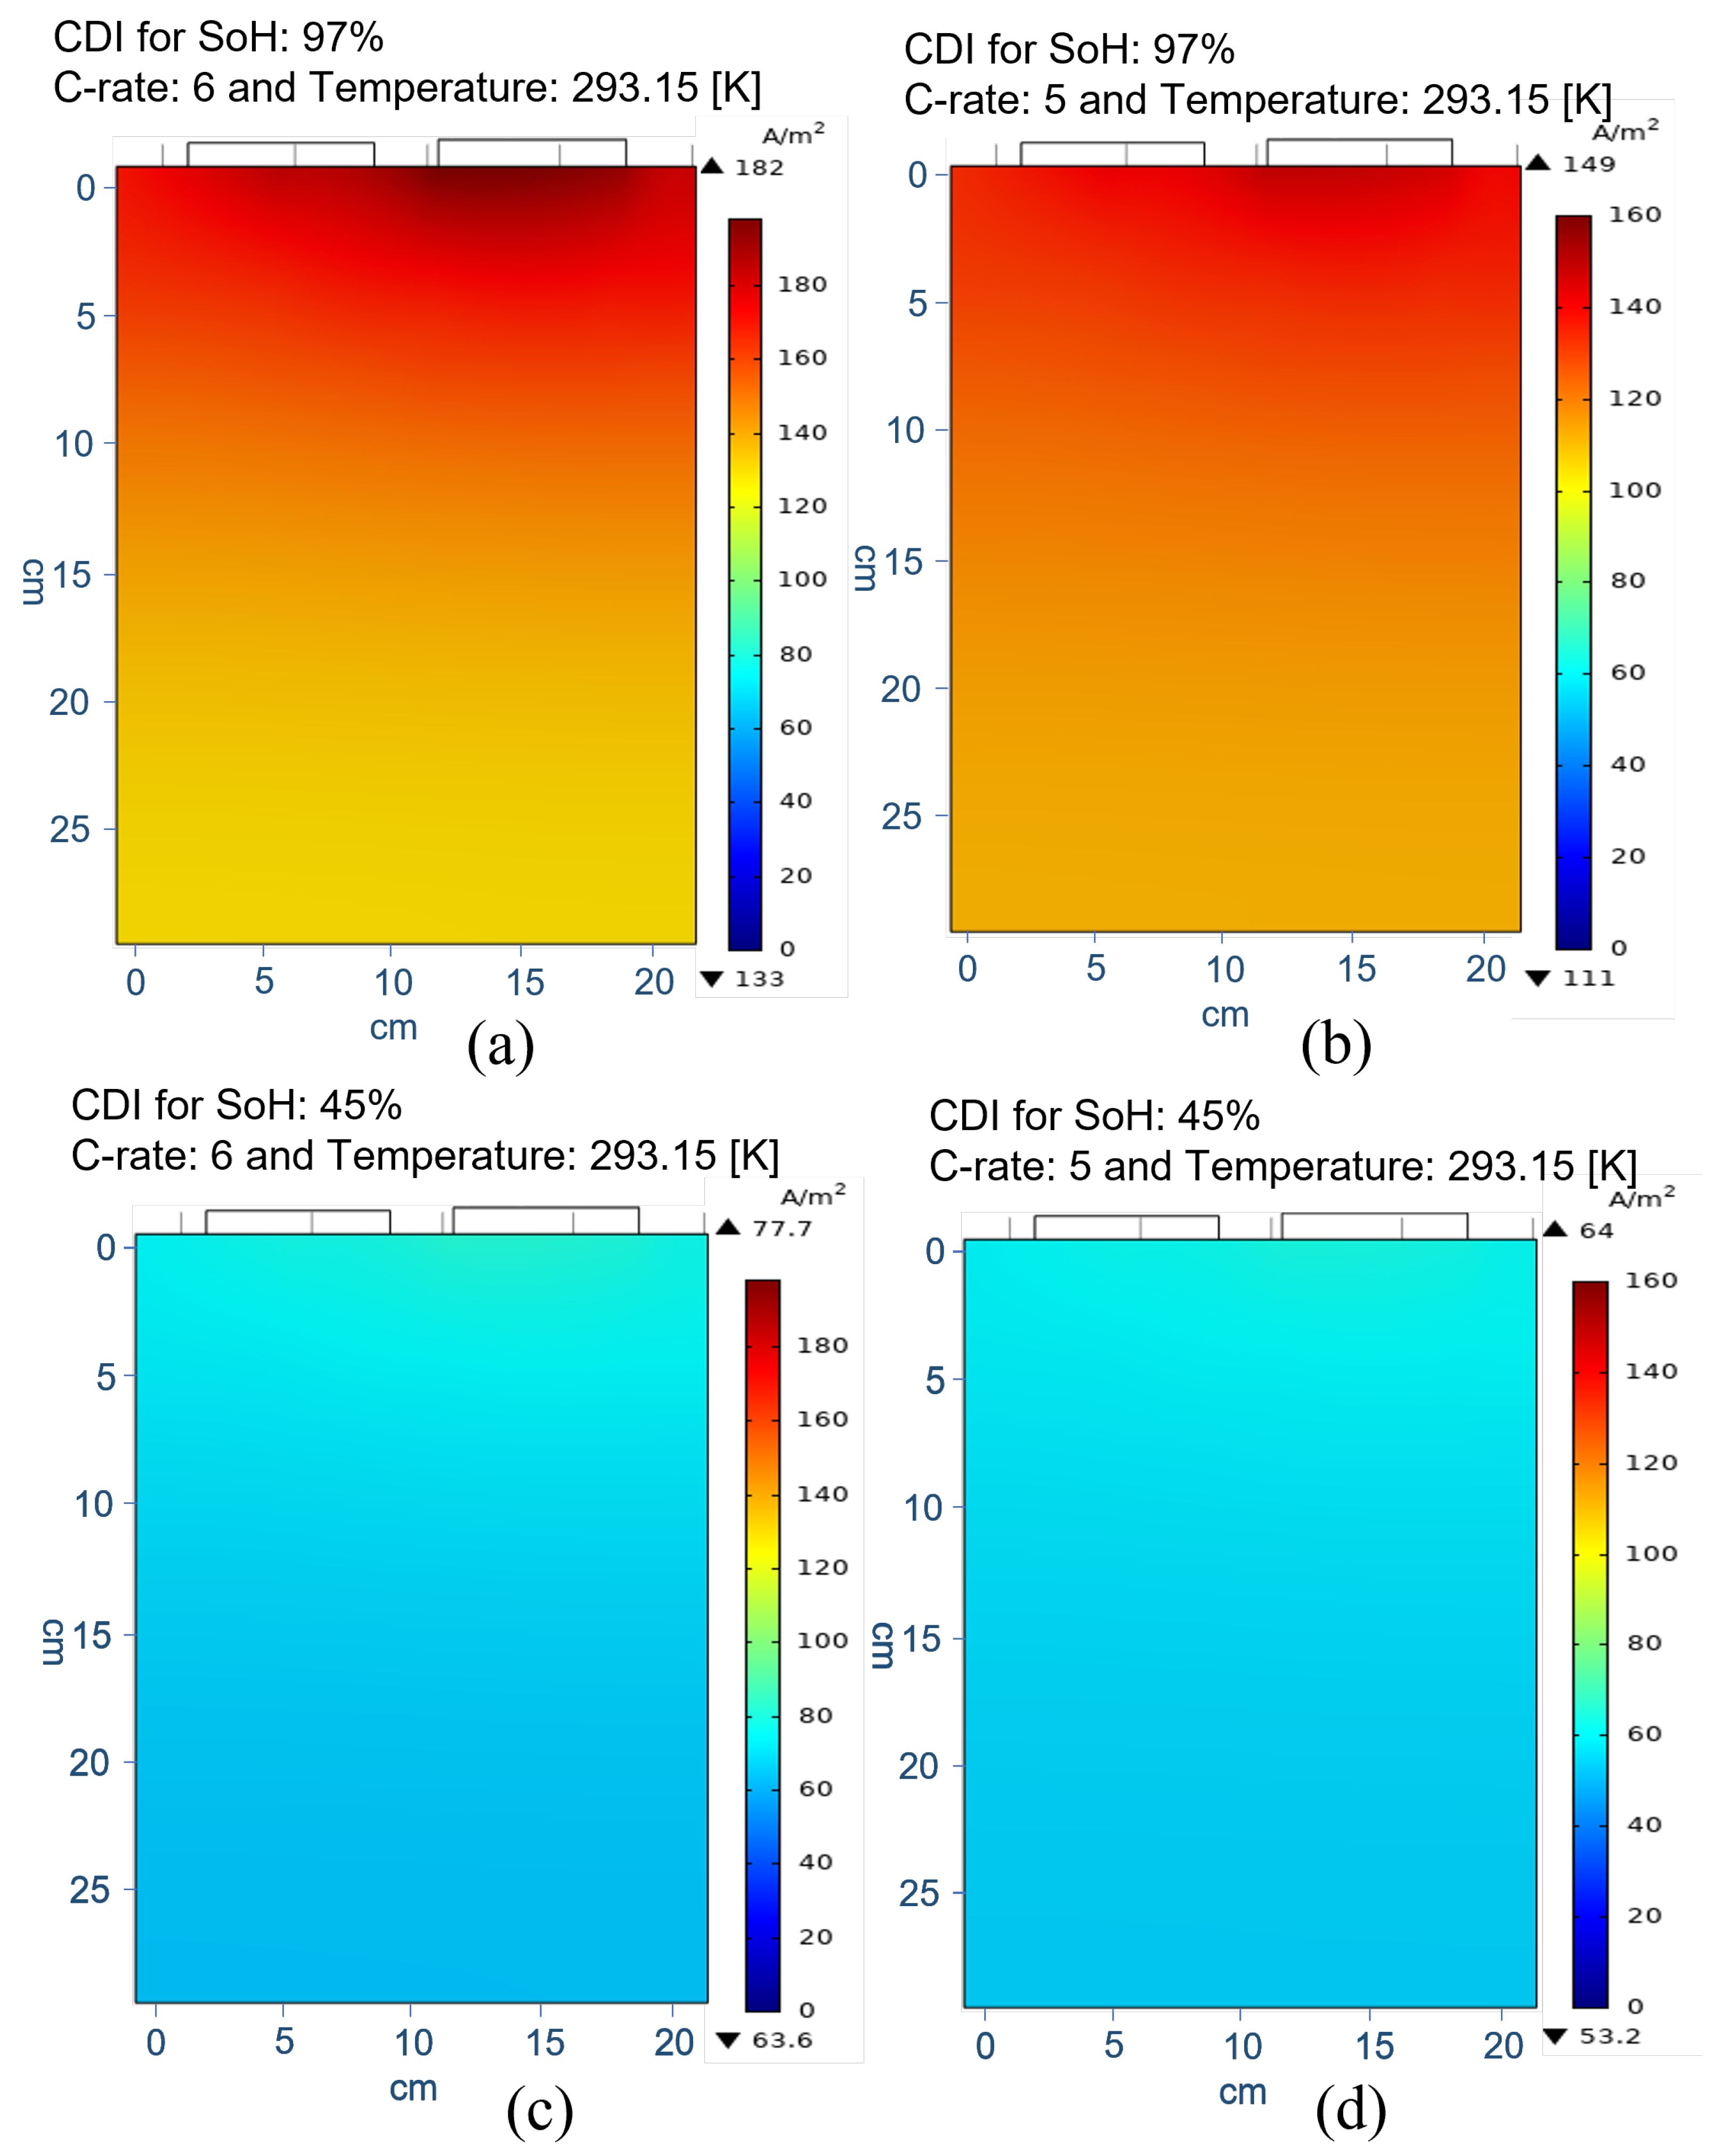
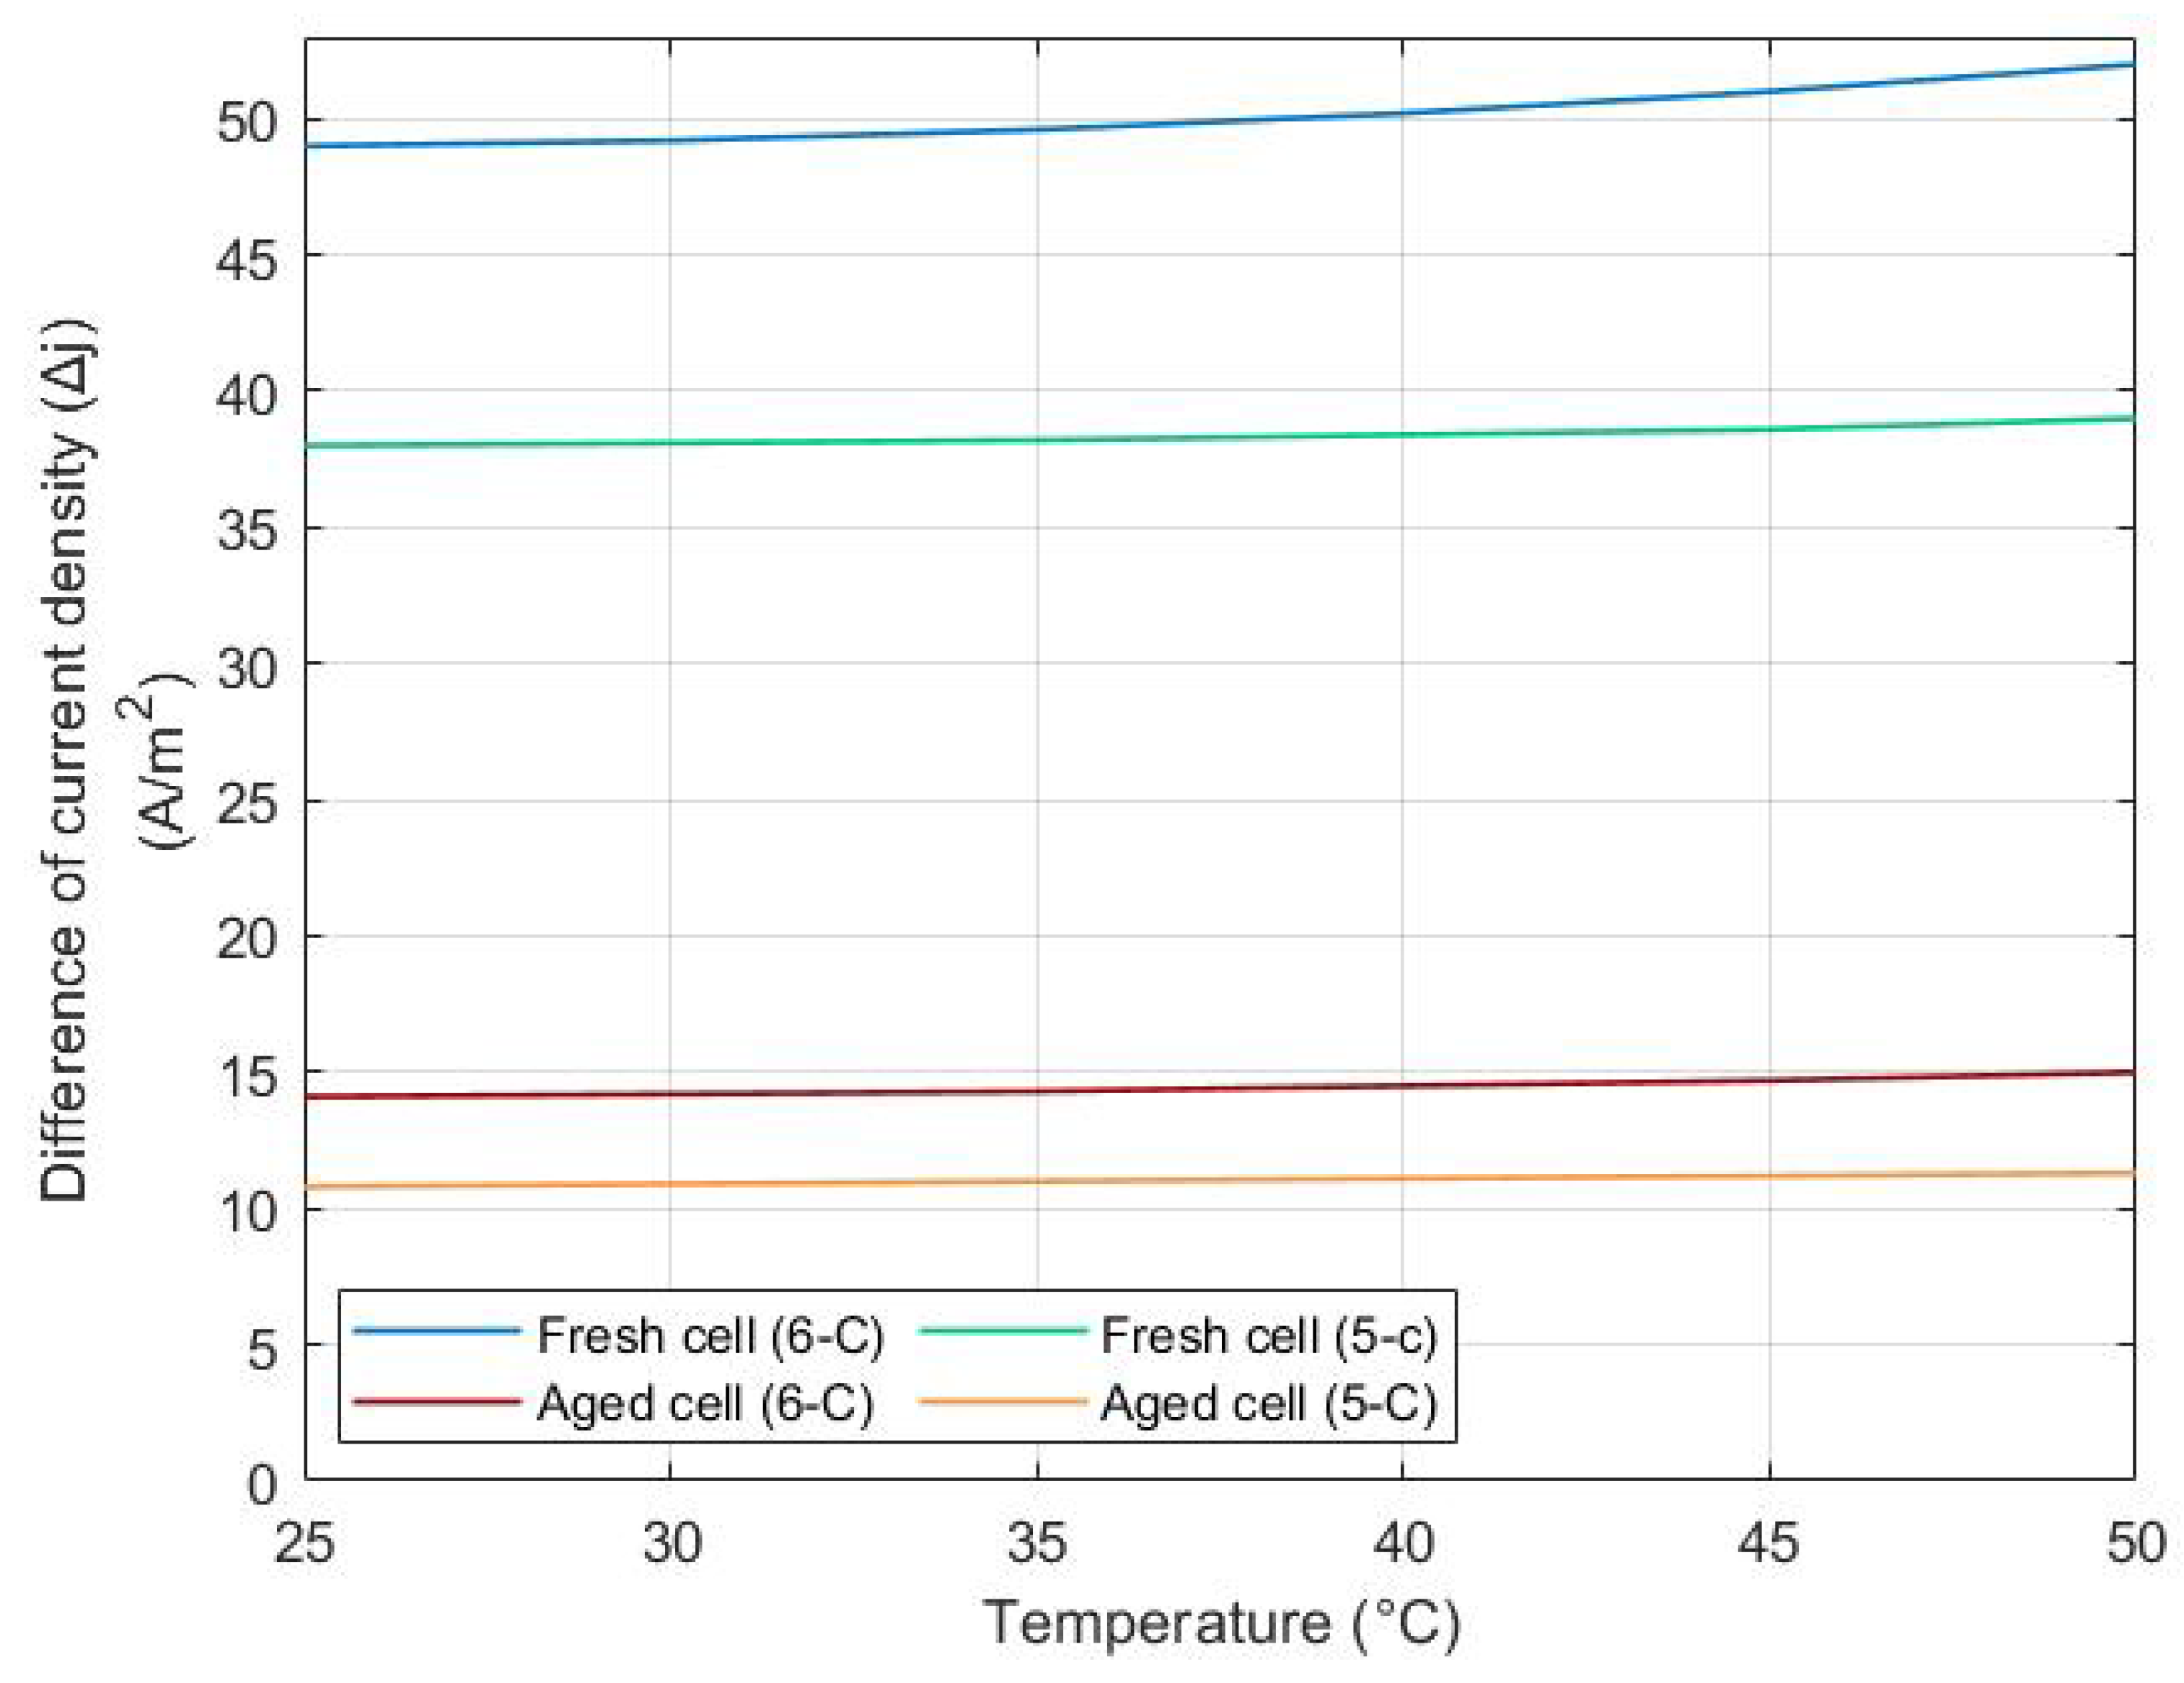
4.2. The Effect of Fast-Charging and High Ambient Temperature on CDIs

To improve the dataset used for training the CNN, cells must be studied in different ageing scenarios under fast charging at different ambient temperatures. As observed, the pattern of current density distribution changes with different levels of capacity fade. In Figure 7, one can see the CDIs captured at a charging process and C-rates, starting from a fresh cell and ending in an aged cell.
As noticed by comparing Figure 7a,b, the current density in a fresh NMC/graphite cell is as high as 182 A/m 2 and 149 A/m 2 in C-rates of 6C (i.e., a theoretical 10-min charge) and 5C (i.e., a theoretical 12-min charge), respectively. Naturally, charging cells with higher C-rates will provide higher current densities in the positive electrode. Moreover, the distribution of current density in the positive electrode is less homogeneous when the cell is charged at a higher C-rate. This is based on the provided CDIs, where the difference between the highest and the lowest values of current density measured in Figure 7a is 49 A/m 2 , whereas in Figure 7b, this value is 38 A/m 2 .
Similarly, in Figure 7c,d, CDIs captured from the aged version of the formerly studied NMC/graphite cells are illustrated. As studied here, the highest measured current density originating from the positive electrode of an aged cell is 57% lower than the highest measured current density in a fresh cell, proving that ageing will affect the intensity of current density in a LiB cell.
To better understand the effect of ambient temperature, cells are studied during the fast-charging process in different ambient temperatures up to 323.15 [K] (50 C). It is known that high temperatures in LiBs will increase the ionic conductivity in the electrode, as well as the rate of chemical reactions, with expected higher current densities around the tab [38]. As shown in Figure 8, the difference between the maximum and minimum measured current density in captured CDIs is calculated to show the current density distribution rate, while cells are under fast charging in different ambient temperatures.
As observed, rising temperature from 25 C to 50 C affects the intensity of current density around the tab (up to 1.09%) and left the measured current densities in the rest of the positive electrode nearly unchanged.

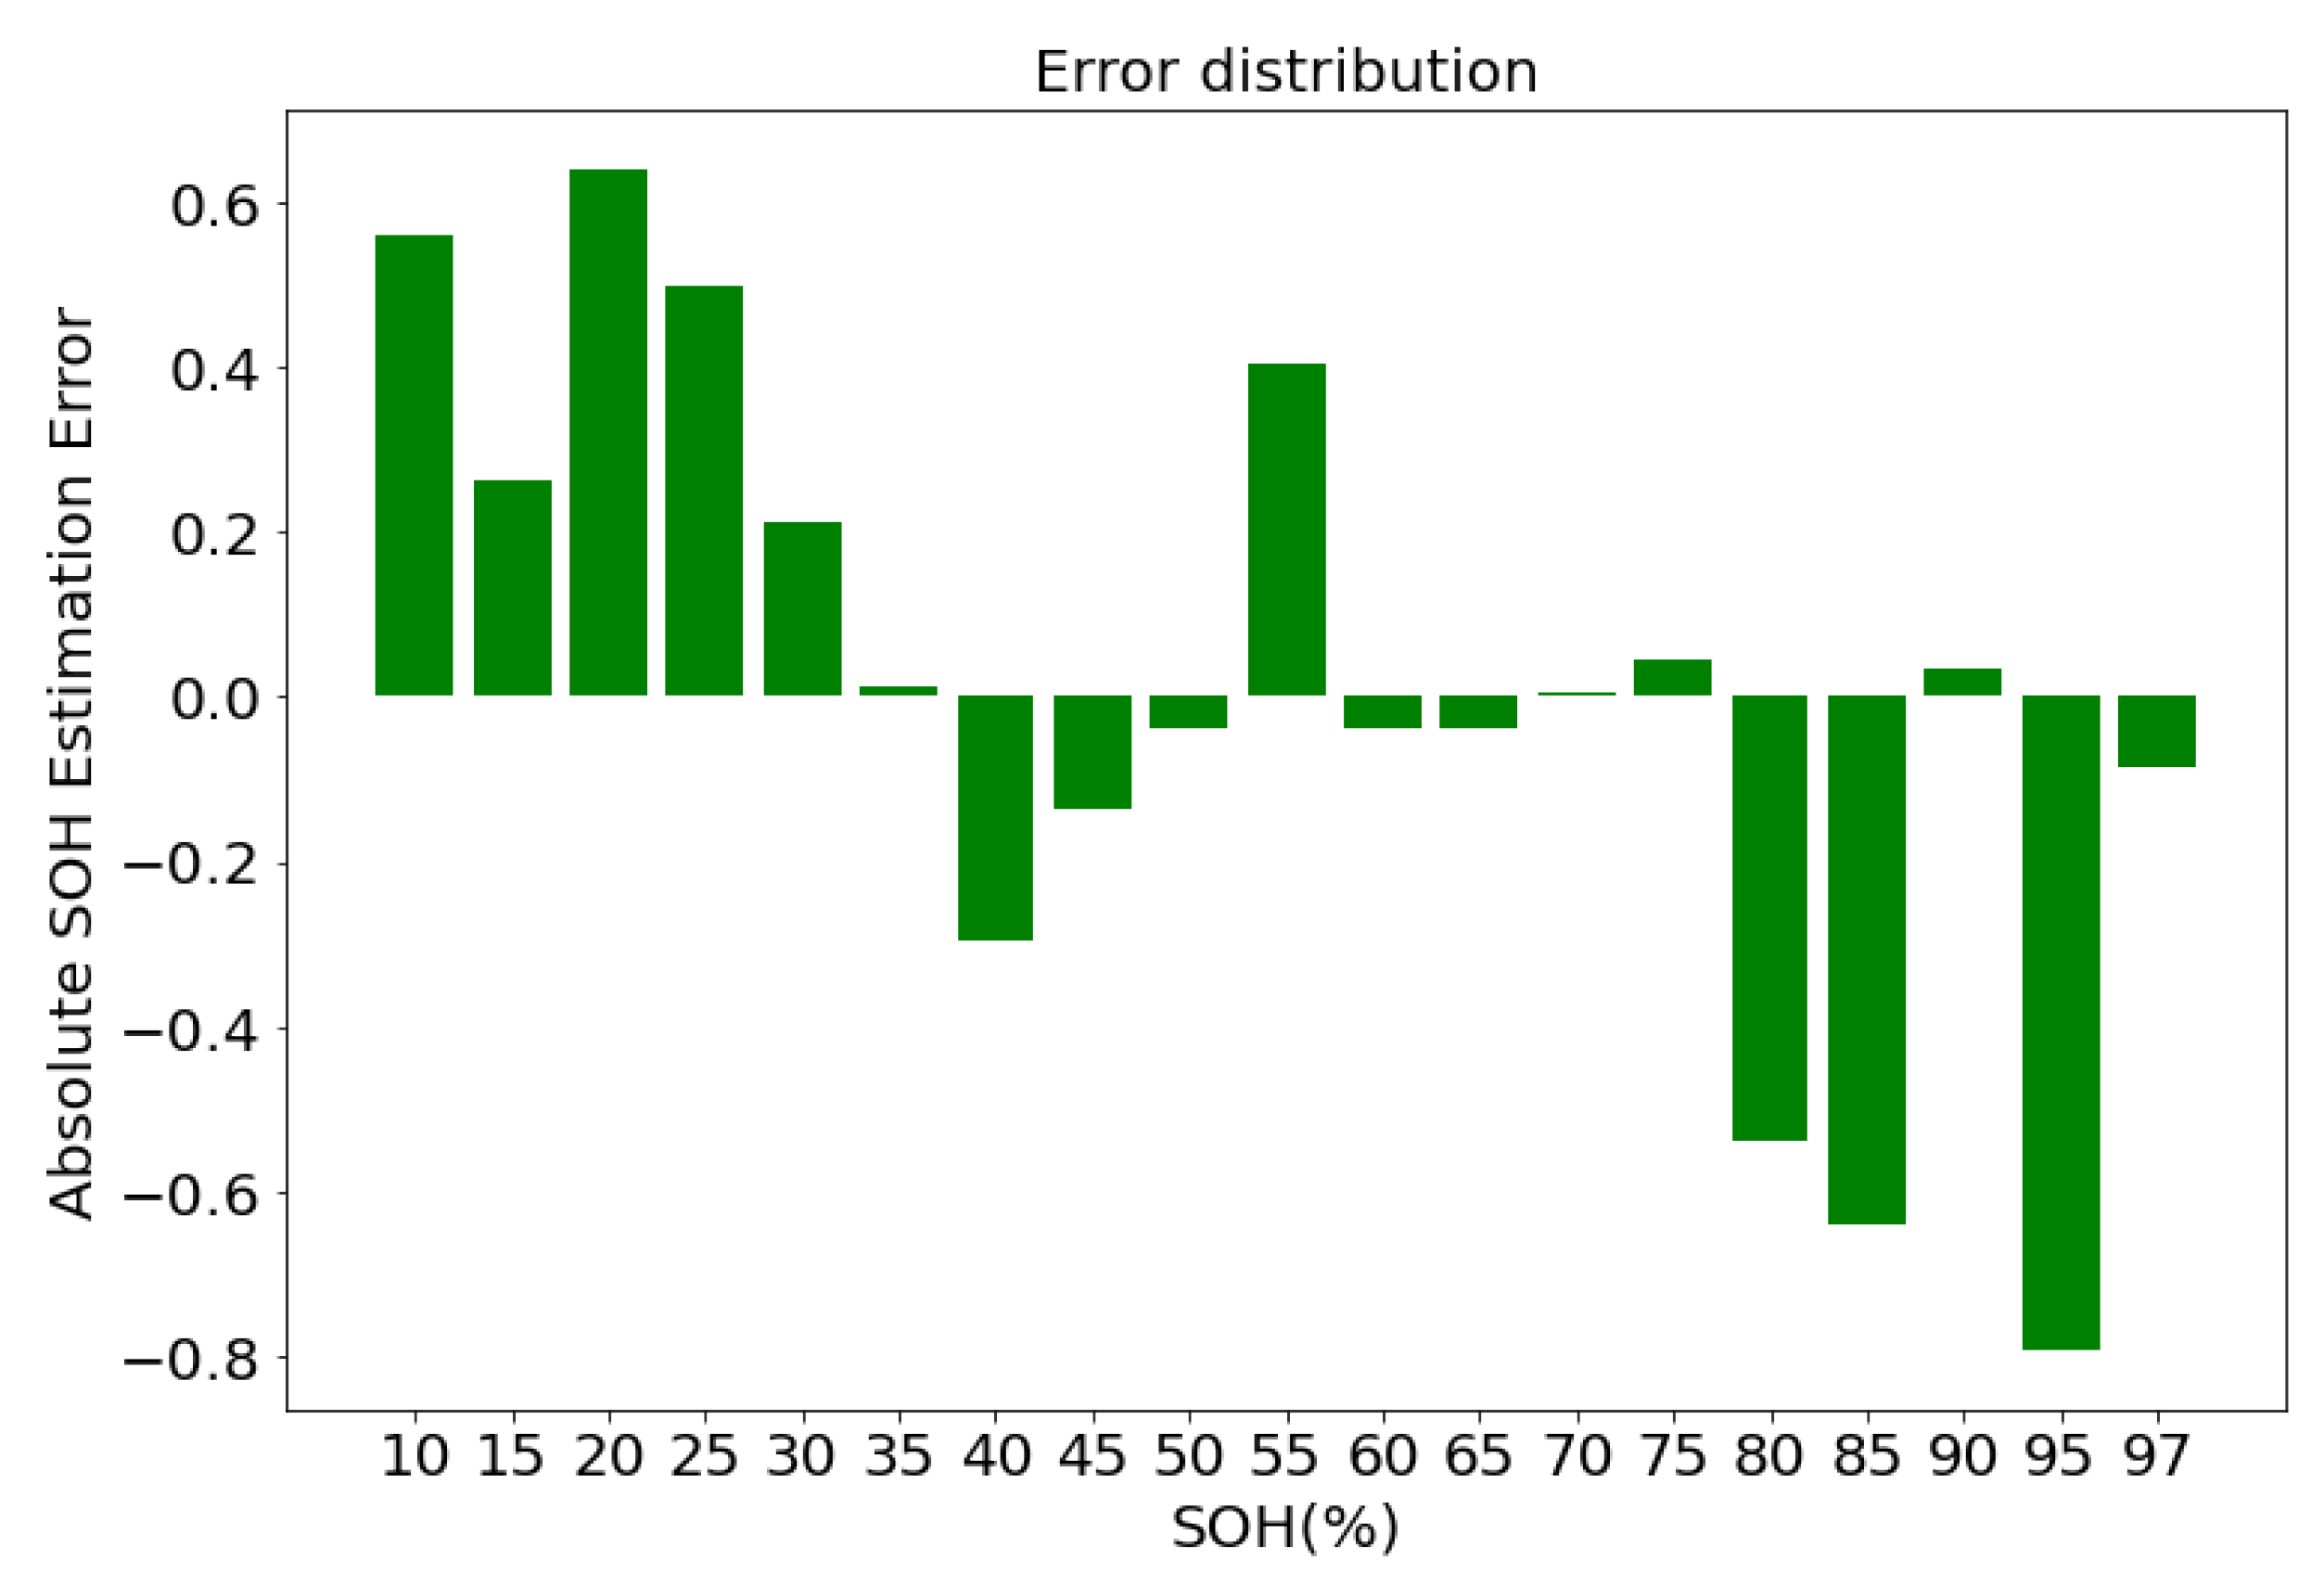
4.3. Classification of CDIs and CNN Training Accuracy

For training the CNN used for SoH estimation, a comprehensive dataset of CDIs representing different ageing states is needed. For better training, the datasets are taken at different points of the cycle. Once the training phase of the CNN classifier and the regression layer is done, the estimator can find the relation between the CDIs and the corresponding SoH value, as different SoH values correspond to the different distribution of current density across the electrode [31].
In this paper, training the CNN models used for image classification is carried out with great precision, as shown in Figure 9, to achieve high-accuracy SoH estimation. Figure 9 shows the mean squared error of the CNN prediction during the training phase. As evident, after 100 epochs, the training is nearly completed, with a minor error of 0.01%. The error distribution among the training set is further shown in Figure 10 for SoH values from 5% to 97%, and for validation of the trained model, 20% of the training dataset is used. The error figures show that the model is able to extract the required features from the CDIs with high accuracy, and estimate the SoH value of the experimental test cell that is charging.
Finally, our designed CNN-based method for SoH estimation is applied to experimental datasets, related to NMC-Graphite pouch cells in three different ageing scenarios, during 4000 full cycles. As shown in Figure 11a and Figure 12a, the estimated SoH values are compared with reference SoH values for a brand-new and an aged cell (after 4000 cycles), respectively. In Figure 11 and Figure 12, the grey region represents the 2% error range of the actual SoH values, which also confirms that the estimation is within the 2% error margin to show high accuracy. In fact, the calculated validation error for a brand-new cell is 0.6%, and for an aged cell is 1.2%. Moreover, samples of CDIs captured from the brand-new and the aged cells are shown in Figure 11b and Figure 12b, respectively.
Studying the cell model proves that the intensity of current density will be consistently reduced when the cell ages and the current density distribution will become increasingly homogeneous across the electrode. In Figure 13b, samples of CDIs captured from a very old cell (cycled more than 2 years) are demonstrated, showing a small difference between the states. This will lead to a minor increase in the validation error, causing the estimation accuracy of 97.10% when studying a very old cell. As shown in Figure 13a, this error will not exceed the dark grey boundaries of 5% error.
As the CNN model is validated using the real-time HIL setup, the CNN model can be easily exported to the standard embedded BMS processor for online SoH condition monitoring.
For better integration in an EV setup, an online monitoring system for the battery pack and a user interface were designed with Python programming language as part of a condition monitoring system Figure 14. In this user interface, the user can easily view the cell status in a pack along with the recorded CDIs. The UI is designed for the user to select the cell or the module in operation and monitor the health and internal temperature information.

5. Conclusions

In this paper, we proposed a non-invasive method for the online estimation of SoH in EV battery cells. The proposed method uses experimental images of the current density distribution (CDI) across the positive electrode, and a CNN deep learning model to classify the unnoticeable changes in the magnetic field, i.e., magnetic susceptibility, and the different patterns in CDIs.
The CDIs collected were validated using the developed DFN cell model and experimental Nissan Leaf pouch cells in different ageing scenarios (from SoH of 95% to 10%). The experimental results demonstrate the efficacy of the trained model in the accurate estimation of the SoH values (1.5% error). Once trained, the CNN-based approach can be comfortably used for online cell monitoring, as the algorithm can be run with the processing power with the capability of the current embedded processors. In summary, this paper has established, analytically and experimentally, a novel non-invasive method for the condition monitoring of battery cells by capturing magnetic field images from low-cost accurate magnetic field sensor arrays. For future research, the proposed approach can be extended to the learning models of all LiB form factors, especially the cylindrical cells. In this respect, the CNN architecture can be enhanced in terms of the number of inputs, and the use of transfer learning for high-resolution CDI images.

Author Contributions

Conceptualisation, M.J., S.A.A. and K.M.; methodology, M.J. and S.A.A.; software, M.J.; validation, M.J., S.A.A., T.W. and K.M.; formal analysis, M.J.; investigation, M.J.; resources, M.J. and K.M.; data curation, M.J. and S.A.A.; writing—original draft preparation, M.J.; writing—review and editing, M.J., T.W., S.A.A. and K.M.; visualisation, M.J. and S.A.A.; supervision, K.M.; project administration, K.M.; funding acquisition, K.M. All authors have read and agreed to the published version of the manuscript.

Funding

This research received no external funding.

Institutional Review Board Statement

Not applicable.

Informed Consent Statement

Not applicable.

Data Availability Statement

Not applicable.

Conflicts of Interest

The authors declare no conflict of interest.

References

  1. Thies, C.; Kieckhäfer, K.; Spengler, T.S.; Sodhi, M.S. Assessment of social sustainability hotspots in the supply chain of lithium-ion batteries. Procedia CIRP 2019, 80, 292–297. [Google Scholar] [CrossRef]
  2. Liu, K.; Hu, X.; Yang, Z.; Xie, Y.; Feng, S. Lithium-ion battery charging management considering economic costs of electrical energy loss and battery degradation. Energy Convers. Manag. 2019, 195, 167–179. [Google Scholar] [CrossRef]
  3. Atalay, S.; Sheikh, M.; Mariani, A.; Merla, Y.; Bower, E.; Widanage, W.D. Theory of battery ageing in a lithium-ion battery: Capacity fade, nonlinear ageing and lifetime prediction. J. Power Sources 2020, 478, 229026. [Google Scholar] [CrossRef]
  4. Hemavathi, S. Overview of cell balancing methods for Li-ion battery technology. Energy Storage 2021, 3, e203. [Google Scholar] [CrossRef]
  5. Palacín, M.R. Understanding ageing in Li-ion batteries: A chemical issue. Chem. Soc. Rev. 2018, 47, 4924–4933. [Google Scholar] [CrossRef] [PubMed]
  6. Probstl, A.; Park, S.; Narayanaswamy, S.; Steinhorst, S.; Chakraborty, S. Soh-Aware active cell balancing strategy for high power battery packs. In Proceedings of the 2018 Design, Automation and Test in Europe Conference and Exhibition, DATE 2018, Dresden, Germany, 19–23 March 2018; pp. 431–436. [Google Scholar] [CrossRef] [Green Version]
  7. Thiruvonasundari, D.; Deepa, K. Evaluation and Comparative Study of Cell Balancing Methods for Lithium-Ion Batteries Used in Electric Vehicles. Int. J. Renew. Energy Dev. 2021, 10, 471–479. [Google Scholar] [CrossRef]
  8. Venugopal, P.; Vigneswaran, T. State-of-Health Estimation of Li-ion Batteries in Electric Vehicle Using IndRNN under Variable Load Condition. Energies 2019, 12, 4338. [Google Scholar] [CrossRef] [Green Version]
  9. Hu, X.; Zheng, Y.; Lin, X.; Xie, Y. Optimal Multistage Charging of NCA/Graphite Lithium-Ion Batteries Based on Electrothermal-Aging Dynamics. IEEE Trans. Transp. Electrif. 2020, 6, 427–438. [Google Scholar] [CrossRef]
  10. Noura, N.; Boulon, L.; Jemeï, S. A Review of Battery State of Health Estimation Methods: Hybrid Electric Vehicle Challenges. World Electr. Veh. J. 2020, 11, 66. [Google Scholar] [CrossRef]
  11. Wang, Z.; Feng, G.; Zhen, D.; Gu, F.; Ball, A. A review on online state of charge and state of health estimation for lithium-ion batteries in electric vehicles. Energy Rep. 2021, 7, 5141–5161. [Google Scholar] [CrossRef]
  12. Wang, K.; Gao, F.; Zhu, Y.; Liu, H.; Qi, C.; Yang, K.; Jiao, Q. Internal resistance and heat generation of soft package Li4Ti5O12 battery during charge and discharge. Energy 2018, 149, 364–374. [Google Scholar] [CrossRef]
  13. Messing, M.; Shoa, T.; Habibi, S. Estimating battery state of health using electrochemical impedance spectroscopy and the relaxation effect. J. Energy Storage 2021, 43, 103210. [Google Scholar] [CrossRef]
  14. Huang, H.; Meng, J.; Wang, Y.; Feng, F.; Cai, L.; Peng, J.; Liu, T. A comprehensively optimized lithium-ion battery state-of-health estimator based on Local Coulomb Counting Curve. Appl. Energy 2022, 322, 119469. [Google Scholar] [CrossRef]
  15. Flaherty, N. GlobalFoundries Teams for Wireless Battery Management Chip-eeNews Europe. Technical Report. Available online: https://www.eenewseurope.com/ (accessed on 16 January 2022).
  16. Zhu, Q.; Xu, M.; Liu, W.; Zheng, M. A state of charge estimation method for lithium-ion batteries based on fractional order adaptive extended kalman filter. Energy 2019, 187, 115880. [Google Scholar] [CrossRef]
  17. Omariba, Z.B.; Zhang, L.; Kang, H.; Sun, D. Parameter Identification and State Estimation of Lithium-Ion Batteries for Electric Vehicles with Vibration and Temperature Dynamics. World Electr. Veh. J. 2020, 11, 50. [Google Scholar] [CrossRef]
  18. Azis, N.A.; Joelianto, E.; Widyotriatmo, A. State of Charge (SoC) and State of Health (SoH) Estimation of Lithium-Ion Battery Using Dual Extended Kalman Filter Based on Polynomial Battery Model. In Proceedings of the 2019 6th International Conference on Instrumentation, Control, and Automation, ICA 2019, Bandung, Indonesia, 31 July–2 August 2019; pp. 88–93. [Google Scholar] [CrossRef]
  19. Xiao, B.; Xiao, B.; Liu, L. Rapid measurement method for lithium-ion battery state of health estimation based on least squares support vector regression. Int. J. Energy Res. 2021, 45, 5695–5709. [Google Scholar] [CrossRef]
  20. Qiao, J.; Wang, S.; Yu, C.; Shi, W.; Fernandez, C. A novel bias compensation recursive least square-multiple weighted dual extended Kalman filtering method for accurate state-of-charge and state-of-health co-estimation of lithium-ion batteries. Int. J. Circuit Theory Appl. 2021, 49, 3879–3893. [Google Scholar] [CrossRef]
  21. Guida, G.; Faverato, D.; Colabella, M.; Buonomo, G. Robust state of charge and state of health estimation for batteries using a novel multi model approach. Control Theory Technol. 2022, 20, 418–438. [Google Scholar] [CrossRef]
  22. Yang, N.; Song, Z.; Hofmann, H.; Sun, J. Robust State of Health estimation of lithium-ion batteries using convolutional neural network and random forest. J. Energy Storage 2022, 48, 103857. [Google Scholar] [CrossRef]
  23. Pan, H.; Lü, Z.; Wang, H.; Wei, H.; Chen, L. Novel battery state-of-health online estimation method using multiple health indicators and an extreme learning machine. Energy 2018, 160, 466–477. [Google Scholar] [CrossRef]
  24. Li, P.; Zhang, Z.; Xiong, Q.; Ding, B.; Hou, J.; Luo, D.; Rong, Y.; Li, S. State-of-health estimation and remaining useful life prediction for the lithium-ion battery based on a variant long short term memory neural network. J. Power Sources 2020, 459, 228069. [Google Scholar] [CrossRef]
  25. Rastegarpanah, A.; Hathaway, J.; Ahmeid, M.; Lambert, S.; Walton, A.; Stolkin, R. A rapid neural network—Based state of health estimation scheme for screening of end of life electric vehicle batteries. J. Syst. Control Eng. 2020, 235, 330–346. [Google Scholar] [CrossRef]
  26. Kim, J.; Yu, J.; Kim, M.; Kim, K.; Han, S. Estimation of Li-ion Battery State of Health based on Multilayer Perceptron: As an EV Application. IFAC-Papersonline 2018, 51, 392–397. [Google Scholar] [CrossRef]
  27. Roman, D.; Saxena, S.; Robu, V.; Pecht, M.; Flynn, D. Machine learning pipeline for battery state-of-health estimation. Nat. Mach. Intell. 2021, 3, 447–456. [Google Scholar] [CrossRef]
  28. Li, Y.; Li, K.; Liu, X.; Zhang, L. Fast battery capacity estimation using convolutional neural networks. Trans. Inst. Meas. Control 2020, 0142331220966425. [Google Scholar] [CrossRef]
  29. Li, Y.; Tao, J. CNN and transfer learning based online SOH estimation for lithium-ion battery. In Proceedings of the 32nd Chinese Control and Decision Conference, CCDC 2020, Hefei, China, 22–24 August 2020; Institute of Electrical and Electronics Engineers Inc.: Interlaken, Switzerland, 2020; pp. 5489–5494. [Google Scholar] [CrossRef]
  30. Shen, S.; Chen, X.; Hu, C.; Sadoughi, M.K.; Hong, M. Online Estimation of Lithium-Ion Battery Capacity Using Deep Convolutional Neural Networks. In International Design Engineering Technical Conferences and Computers and Information in Engineering Conference; American Society of Mechanical Engineers: New York, NY, USA, 2018; Volume 2A-2018. [Google Scholar] [CrossRef]
  31. Javadipour, M.; Mehran, K. Analysis of current density in the electrode and electrolyte of lithium-ion cells for ageing estimation applications. IET Smart Grid 2021, 4, 176–189. [Google Scholar] [CrossRef]
  32. Bason, M.G.; Coussens, T.; Withers, M.; Abel, C.; Kendall, G.; Krüger, P. Non-invasive current density imaging of lithium-ion batteries. J. Power Sources 2022, 533, 231312. [Google Scholar] [CrossRef]
  33. Tsai, P.C.; Wen, B.; Wolfman, M.; Choe, M.J.; Pan, M.S.; Su, L.; Thornton, K.; Cabana, J.; Chiang, Y.M. Single-particle measurements of electrochemical kinetics in NMC and NCA cathodes for Li-ion batteries. Energy Environ. Sci. 2018, 11, 860–871. [Google Scholar] [CrossRef] [Green Version]
  34. Ilott, A.J.; Mohammadi, M.; Schauerman, C.M.; Ganter, M.J.; Jerschow, A. Rechargeable lithium-ion cell state of charge and defect detection by in-situ inside-out magnetic resonance imaging. Nat. Commun. 2018, 9, 1776. [Google Scholar] [CrossRef]
  35. Zou, D.; Li, M.; Wang, D.; Li, N.; Su, R.; Zhang, P.; Gan, Y.; Cheng, J. Temperature Estimation of Lithium-Ion Battery Based on an Improved Magnetic Nanoparticle Thermometer. IEEE Access 2020, 8, 135491–135498. [Google Scholar] [CrossRef]
  36. Khalik, Z.; Donkers, M.C.; Bergveld, H.J. Model simplifications and their impact on computational complexity for an electrochemistry-based battery modeling toolbox. J. Power Sources 2021, 488, 229427. [Google Scholar] [CrossRef]
  37. Xia, L.; Najafi, E.; Li, Z.; Bergveld, H.J.; Donkers, M.C. A computationally efficient implementation of a full and reduced-order electrochemistry-based model for Li-ion batteries. Appl. Energy 2017, 208, 1285–1296. [Google Scholar] [CrossRef]
  38. Ma, S.; Jiang, M.; Tao, P.; Song, C.; Wu, J.; Wang, J.; Deng, T.; Shang, W. Temperature effect and thermal impact in lithium-ion batteries: A review. Prog. Nat. Sci. Mater. Int. 2018, 28, 653–666. [Google Scholar] [CrossRef]
Figure 1. Overview of an EV battery pack. In each module, key parameters, including the magnetic field, are measured for each cell, and the generated data are then fed to the BMS.
Electrochem 03 00051 g001
Figure 2. Schematic of the LiB model during charging.
Electrochem 03 00051 g002
Figure 3. The designed CNN architecture for SoH estimation. The captured CDI from a Li-ion cell is fed into the input layer of the neural network and the final output is the percentage of SoH, presenting the state of health in the corresponding cell.
Electrochem 03 00051 g003
Figure 4. This step diagram shows the process of how a CNN model is trained to characterise the CDIs for the SoH estimation.
Electrochem 03 00051 g004
Figure 5. Nissan leaf pouch cell connected to the Neware BTS4000 battery cycler, with magnetic sensor array module placed on top of the cell.
Electrochem 03 00051 g005
Figure 6. Comparison of charging/discharging cycle curves in the experiment and the DFN model of the cell.
Electrochem 03 00051 g006
Figure 7. CDIs from the positive electrode at room temperature (293.15 [K]). (a,b) A fresh cell was charged with C-rates of 6C and 5C, respectively. (c,d) An aged cell was charged with C-rates of 6C and 5C, respectively.
Electrochem 03 00051 g007
Figure 8. The effect of high ambient temperature on current density distribution during fast charging scenarios for fresh and aged cells.
Electrochem 03 00051 g008
Figure 9. Mean squared error of the model output during training against the validation set.
Electrochem 03 00051 g009
Figure 10. Error distributions on the validation set for different values of SoH and the corresponding CDIs.
Electrochem 03 00051 g010
Figure 11. (a) SoH(%) estimation results for a new cell. (b) Captured CDIs from the new cell.
Electrochem 03 00051 g011
Figure 12. (a) SoH(%) estimation results for an aged cell. (b) Captured CDIs from the aged cell.
Electrochem 03 00051 g012
Figure 13. (a) SoH(%) estimation results for the aged cell. (b) Captured CDIs from the aged cell.
Electrochem 03 00051 g013
Figure 14. User Interface (UI) design for the condition monitoring system (CMS)—Cell ID is identified, as well as the related SoH% and SoH estimation graph.
Electrochem 03 00051 g014
Table 1. A summary of the main studied SoH estimation methods, including their categories, benefits, drawbacks, and errors%.
Estimation CategoryApproachBenefitsDrawbacksSoH
Error%
Experimental methodsMeasuring internal resistance and internal impedance [10,12]+ Easy implementation
+ Widely used in
automotive profiles
- Operating off-line
- Possibility of error accumulation
- High time consumption
<3%
Experimental methodsElectrochemical Impedance Spectroscopy (EIS) [13]+ Low time consumption
+ Very good accuracy
- Required hardware is complex and costly<2%
Model-based methods
(Adaptive filtering) [16,17]
Kalman filter-based method [18]
Robust estimation method [21,22]
+ Operating onboard
+ Low time consumption
+ High accuracy
- Accuracy depends on parameters of battery
- High computational cost
<2%
Model-based methodsLeast square-based method [19]+ Operating onboard
+ Widely used in automotive profiles
- High computational complexity<5%
Machine Learning methods [23,24]Convolutional Neural Network(CNN) method [22,28,29]+ Operating Online
+ Effectively capturing LiB’s non-linear characteristics
- Requires large dataset to train the network
- The precision of the method is conditional *
<1.5%
* It depends on how much the model applied to the experimental dataset is accurate.
Table 2. Governing equations of the DFN model.
Li-ion concentrationSolid phase ( c s ) c s t = D s r 2 r r 2 c s r (1a)
Electrolyte phase ( c e ) ε e c e t = x ε e p D e c e x + 1 t + 0 F j Li (1b)
Boundary condition for
Li-ion concentration
Solid phase c s r r = 0 = 0 , D s c s r r = R S = j Li a s F (2a)
Electrolyte phase c e x x = 0 = c e x x = L = 0 (2b)
Exchange current density i 0 = k 0 c e α a c s , max c s , e α a c s , e α c (3a)
Measurable terminal voltage V ( t ) = ϕ s ( L , t ) ϕ s ( 0 , t ) R f A surf i app ( t ) (3b)
Table 3. Key parameters and their values used in the DFN model of the cell [36,37].
SymbolDescriptionValue
A s u r f Area of electrode plate6.264 [cm 2 ]
α a Anodic transfer coefficient0.5 [1]
α c Anodic transfer coefficient0.5 [1]
a s The specific inter-facial surface area 3 ε s / R s
c s , m a x p o s Maximum solid-phase concentration in positive electrode49,000 [mol/m 3 ]
c s , m a x n e g Maximum solid-phase concentration in negative electrode31,507 [mol/m 3 ]
c s , e Solid-phase concentration at the solid–electrolyte interface c s , e ( x , t ) = c s R s , x , t
δ p Positive electrode thickness60 [ μ m]
δ s e p Separator thickness30 [ μ m]
δ n Negative electrode thickness60 [ μ m]
D s Li-ion diffusion coefficient in the solid phase 5 × 10 13 [m 2 /s]
D e Li-ion diffusion coefficient in the electrolyte 7.5 × 10 11 [m 2 /s]
ϵ s , p o s Volume fraction of active particles in positive electrode0.35
ϵ s , n e g Volume fraction of active particles in negative electrode0.68
ϵ e Electrolyte volume fraction0.65
i a p p Applied current through the cell(variable)
K 0 p o s Kinetic rate constant in positive electrode 1.38 × 10 5
FFaraday’s constant 9.65 × 10 4 [C/mol]
K 0 n e g Kinetic rate constant in negative electrode 0.64 × 10 5
LCell thickness160 [ μ m]
pBruggeman porosity exponent1.5
R f Film resistance 2 × 10 3 [ Ω · m 2 ]
R s , p o s t + 0 Transport number0.363
xPosition across the cell(variable)
Publisher’s Note: MDPI stays neutral with regard to jurisdictional claims in published maps and institutional affiliations.

