Abstract
Reliability of proton exchange membrane fuel cells (PEMFCs) is a major issue for large industrialization and commercialization. Indeed, performance can be degraded due to abnormal operating conditions, namely, faults, which lead either to a transient decay of the fuel cell performance or to permanent damage that cannot be recovered. The literature shows that long-time exposure to faults leads to fuel cell degradation. Therefore, it is necessary to use tools that can not only diagnose these faulty conditions, but also modify the fuel cell operations to recover a healthy operating point. For that purpose, one approach is the Active Fault Tolerant Control (AFTC) strategy which is composed of three functions. First, a diagnosis part allows fault detection and identification. Then a decision part, which is an algorithm aiming at finding a new operating point that mitigates the occurring fault. Finally, a control part applies the mitigation strategy established by the decision algorithm. The present work focuses on the decision part. and aims to bring a new contribution to PEMFCs reliability improvement and address water management issues, namely, the cell flooding and membrane drying out with the developed AFTC tool. The strategy is tested and validated on a single PEMFC cell and results are presented, analyzed, and discussed.
1. Introduction
Fuel cell systems suffer from a lack of reliability and can be subjected to different faulty operating modes, as detailed in a previous literature review [1]. Faults can be classified according to some criteria, such as effects, response time, character (reversible or irreversible), or location. The most recurrent faults appearing during the operation of the proton exchange membrane fuel cells (PEMFCs) are those related to water management [2,3,4,5,6,7,8,9]: flooding of the supply channels or electrodes, and drying out of the membrane. Flooding is defined as an accumulation of liquid water in the feed line or gas diffusion layer (GdL) of the electrodes, limiting the access of the reactants to the active areas, and, thus, decreasing the reaction rates. Membrane drying out is defined as insufficient hydration of the ion exchange membrane (IEM), which reduces its proton conductivity. Indeed, the commercial IEM Nafion is composed of hydrophobic backbone and hydrophilic sulfonic acid groups; only when hydrated, the hydrophobic–hydrophilic phase separation leads to the effective proton transfer paths for Nafion. When the membrane is dry, the proton cannot pass through the membrane effectively [10]. Their occurrence can lead to a temporary decrease in PEMFC performance. However, in the case of a too long-time exposure, some irreversible degradation can appear and reduce the PEMFC lifetime. Indeed, in [11], the authors conduct some PEMFC tests to understand their chemical degradation under a humidity cycle protocol. The authors perform tests for flooding with 100% of relative humidity with water condensation and a dry input gas at 0% during more than 500 h and 5000 cycles. Their study allows them to conclude that a chemical degradation of the fuel cell with a post-mortem analysis of the MEA. Indeed, the Pt catalyst at the cathode electrode was investigated, and the results suggested carbon corrosion and Pt dissolution. This study, therefore, highlights the importance of the fuel cell’s normal operating condition to mitigate, as much as possible, the catalyst degradation.
Therefore, fault occurrences must be reduced as much as possible to avoid degradation. For this purpose, Fault Tolerant Control (FTC) can be used to manage the fuel cell operation and mitigate the occurring fault without jeopardizing the service continuity. The literature shows some works dealing with fault mitigation strategies. In a previous literature review [1], two kinds of FTC strategies were depicted: Active FTC and Passive FTC. Indeed, it has been explained that FTC is the ability of the system to deliver the required performance even during an unexpected event. Passive strategies allow to be robust in a small range of predefined faulty conditions and avoid the use of diagnostic tools. However, they require robust control laws which could be hard to implement. Indeed, the overall robust strategy lies in the implementation of a robust controller for a few faults, whereas the active strategies do not incorporate robust controllers but need diagnosis tools such as fault sensors. Therefore, it is because the AFTC approach manages to bring several types of relevant responses to several faults’ occurrence that this paper only focuses on the Active strategy.
AFTC strategies are constituted of a fault detection and isolation (FDI) tool coupled with a control strategy to mitigate the occurred faults. For instance, the authors of [12,13] have proposed the application of the strategy. Their goal is to address the water management issue by coupling an FDI algorithm, a reconfiguration mechanism, and an adjusting controller. The FDI process is based on a neural network; then, a self-tuning PID is used as the control tool. The authors of [12] also highlight that self-tuning PID shows robustness against noise and model uncertainties. The approach explained in [14,15,16] consists of a development of a three-module strategy to diagnose a fault occurrence, decide on a mitigation action, and apply the dimming strategy. The asset of the method lies in the distribution of the complexity into the three modules, which drastically simplifies its implementation. Another work [5] proposed a model-based AFTC strategy for fuel cell temperature sensor failure. Indeed, the authors use an FDI process for real-time fault diagnosis and a sliding mode controller for fuel cell thermal management.
All these works show that fault-tolerant strategies already exist and few of them meet the PEMFC fault issues, such as the water management. For instance, in [17], the authors considered that a fault occurrence disturbs the fuel cell operation by modifying its physical behavior. In their work, it is the fuel cell water management issue at the cathode which is considered. They stated that the observable quantities, such as pressure drop in case of flooding, are not a reliable approach since an abnormal sensor operation could lead to a wrong diagnosis. For that reason, the authors focus on other parameters, including the stack voltage and cell voltage monitoring. They extract the diagnosis result through a support vector machine classifier. In this way, they manage to minimize the number of extra sensors and increase the accuracy of their diagnosis process by reducing possible errors between the measurement and the diagnosis tool. Based on this reliable and lower-cost diagnosis process, the proposed tool could be integrated into an AFTC strategy. To avoid the problem of sensor sensitivity, another study [18] focusses on a reinforcement deep learning controller, which aims to drive the fuel cell output pressure. The goal of the tool lies in its ability to be released from the sensor’s low reliability regarding faults and other disturbances. The drawback of this adaptive approach is the erasure of fault symptoms. However, in [19], the authors work on a fault diagnosis based on an ultra-local model. The asset of the approach lies in its ability to observe the fuel cell state of health modification through the modification of its setting point.
In this paper, a three-module AFTC strategy and its validation on an experimental setup are proposed. Several protocols of fault mitigation processes are applied to flooding and membrane drying out. Metrics are defined to quantify the asset of the proposed AFTC process.
The paper is divided into five sections. First, a presentation of the AFTC strategy and some metrics are defined to quantify the strategy’s strength. Then, the experimental setup is described and the faults’ generation process is explained. After these presentations, the experimental validation of strategy is conducted for each generated fault. An analysis and a discussion are proposed to highlight the best AFTC strategies. Finally, the paper ends with a conclusion of the study.
2. Design of Active Fault Tolerant Control Strategies for PEMFC Water Management Issues and Metrics for Their Performance Analysis
Before designing a fault mitigation strategy, it is relevant to understand what faults are being considered and how they disturb the normal operation of a PEMFC. This section is, thus, dedicated to the presentation of two faults selected for the present study.
2.1. Faults Related to PEMFC Water Management
Flooding
In [2], the authors identify flooding as the most recurrent fault for PEMFCs and point out that the cathode—being the place of water production—is particularly affected. In addition, the probability of flooding increases for high current densities or when the vapor partial pressure is higher than the vapor saturation pressure. The gas flow rate is also a major factor for flooding occurrence due to under–over stoichiometry conditions; the lower the gas flow rate, the lower the amount of water discharged, and the higher the flooding severity.
Some researchers [2,20] highlight that the flooding issue is water disruption along the gas flow channel. This water accumulation clogs the gas flow in the channels and leads to a decrease in the reactant flow at the catalyst layer. Moreover, the water accumulation also clogs the gas diffusion layer (GdL) which diffuses the reactant to the catalyst.
Membrane drying out
Membrane drying out occurs when the membrane is not sufficiently hydrated, increasing its proton resistivity. Drying out occurs especially when the vapor partial pressure inside the PEMFC is too low [21]. Indeed, the membrane water content results from a mass balance transfer between two phenomena. The chemical reaction between hydrogen and oxygen produces water that participates in the membrane moisturization, just like the hydrated input gas flows.
Among the methods referenced in the literature to address cause and effect problems, Fault Tree Analysis (FTA) is a suitable approach to characterize the events causing flooding and membrane drying out. The next section, therefore, deals with literature flooding and membrane drying out FTA.
The next step is to set an AFTC strategy to diagnose faults and mitigate their impact.
Active Fault Tolerant Control Strategy
The chosen AFTC architecture is a three-module structure composed of a diagnosis module, a decision module, and a control module based on [14]. In this AFTC architecture, the diagnosis module is considered a “fault sensor” module. Indeed, the identification of a fault triggers the decision module in charge of computing a new setpoint to mitigate the fault. This setpoint is then applied to the PEMFC through the control module, which is composed of a set of controllers. This strategy is executed in an iterative process until complete mitigation of the occurred fault.
2.1.1. Diagnosis Module
The diagnosis module is composed of a residual-based diagnosis tool using an artificial neural network (ANN) depicted in [22]. Based on the Matlab toolbox nnarx, an ANN model is used to estimate the pressure drop ΔPcath and cathode voltage. The cathode pressure drop is the pressure difference between inlet and output cathode pressure. These estimations are then compared to the measured values to generate two residuals (Residual 1 and Residual 2). Each residual is compared to a threshold (respectively, Threshold 1 for ΔPcath and Threshold 2 for Vfc), selected before the test process and formally dependent on the PEMFC configuration and test bench features.
The diagnostic module concludes with flooding if both ΔPcath and Vfc thresholds are crossed, or drying out if only the threshold Vfc is crossed. The fault diagnosis process is represented in Figure 1.
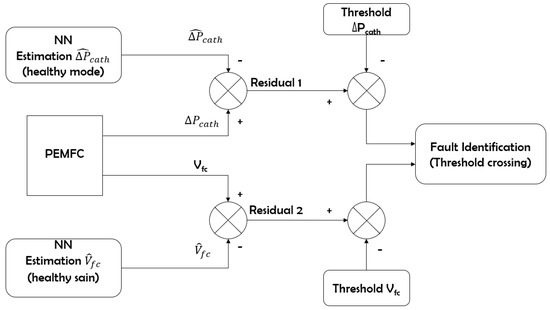
Figure 1.
Fault diagnosis process.
Figure 1 shows that the diagnosis process is divided into two parts that identify both flooding and membrane drying out. The first one performs the calculation of a residual (Residual 1) between a measured pressure drop and an estimated value. The second residual (Residual 2) is computed from the measured fuel cell voltage value and the estimated value. Then, two thresholds are set for fault identification. Indeed, when both are crossed by residuals 1 and 2, flooding is identified. This means that there is an accumulation of water inside the gas feed channels which induces an increasing pressure drop and a decrease in fuel cell voltage. Regarding the membrane drying out identification, since there is no accumulation of water in the supply channels, only the fuel cell voltage decreases. Therefore, the crossing of a single residual (the voltage threshold) makes it possible to identify the membrane drying out.
2.1.2. Decision Module
After the diagnosis process and in case of fault identification, a decision algorithm is used to select a mitigation strategy. The decision consists of the modification of the operating setpoint from a faulty state to a healthy state. Indeed, the decision algorithm changes the setpoint for fault mitigation at each faulty diagnosis period. The goal is to find a new setpoint that is an antagonist to the detected fault and that does not induce other types of faults. Therefore, the decision process needs relevant control variables and a decision algorithm to perform fault mitigation.
2.1.3. Fault Tree Analysis (FTA)
In [23], an FTA highlights the combination of events that lead to PEMFC flooding and membrane drying out. It aims to highlight the relationships between a fault occurrence and, thus, to understand which variables are involved in their occurrence. The authors point out that flooding and membrane drying out can be caused by inappropriate operating settings of the following variables: PEMFC temperature (Tfc); input flow rate (qx_in); PEMFC current (Ifc); output flow rate (qx_out); pressure (PH2O and PH2Osat); and relative humidity (RH%). These above-mentioned parameters are very relevant for the AFTC design because it allows the selection of control variables for fault mitigation. However, PEMFCs are strongly coupled systems and the change of a parameter can lead to their destabilization. FTA only allows us to understand the fault formation mechanism from the combination of basic events. However, in the case of a fault mitigation strategy, these same variables (the basic events) should be used to mitigate their occurrence. However, while these variables may indeed have the fault, they can also disrupt other system operations. For this reason, the literature provides some structural analyses as Fault Structural Analysis (FSA), which highlights the coupling [24] in PEMFC. Indeed, the FSA approach synthesizes the knowledge about PEMFC fault water management and highlights through a graphical representation the interactions between the internal system variables and the fault.
The choice of the mitigation variables should be based on the previous FTA. However, if the FTA brings enough information about fault generation, it is not necessarily sufficient to set up a mitigation strategy for all faults, as some faults may not be characterized.
To enhance the FTA information, a structural analysis should be carried out as proposed in the Fault Structural Analysis tool (FSA). By providing a way to identify the variables that influence a system, the FSA makes it possible to highlight its coupling effects [24].
FTA, thus, provides four control variables that can be used in the AFTC strategy: inlet gas pressure (Ptot_in), inlet gas flow (qO2_in), inlet gas relative humidity (qO2hum), and the fuel cell temperature (Tfc). To complete the FTA, the FSA approach highlights the effects of control variables on the fuel cell operating point as depicted in [24]. The FSA shows that temperature influences several functionalities of the PEMFC. A change in the fuel cell temperature could modify other fuel cell functionalities such as the thermodynamic equilibrium between the gas diffusion layer water content and the membrane water content. Therefore, the modification of Tfc can lead to fuel cell functionalities disturbance.
Regarding the membrane drying out, the FSA shows that it only influences the membrane water content. The only control variable which can have a direct influence on the membrane water content is the PEMFC temperature.
The FSA highlights five control variables for flooding and membrane drying out mitigation: Ptot_in, qO2_in, qO2hum, and Tfc. Pressure variables are not considered control variables because they are assigned to the diagnosis tool. Flow rate variables and temperature are considered to control variables for fault mitigation in the decision algorithm.
Decision Algorithm
The decision algorithm connects diagnosis and control tools. Its objective is to define the best mitigation decision for each detected fault, by merging two types of decisions: transient decisions and deferred decisions. The goal of the transient decision is to alleviate fugitive faults by punctually modifying the fuel setting point. However, in case of a non-fugitive fault, the PEMFC setting point should be modified permanently, and this is the aim of the deferred decision.
A transient decision results in a non-permanent setpoint change, which allows reaching a two-fold aim: first, to target a fast corrective action after the occurrence of a fault; and second, to eliminate a fleeting fault condition (such as local condensation, for example, the occurrence of which does not necessarily require a change in the PEMFC operating point). Control variables that can be changed quickly by the system actuators and the system have a short time response to this change, the mitigation of the fault can occur quickly by reducing the time exposure of the fuel cell to a degrading condition, which gives time to slow down the dynamics of decision and adjustment action or by completely deleting it, transient decisions also allow the fuel cell setpoint being temporarily changed to mitigate the occurrence of a fleeting fault; the modified variable is then reset at the end of the fault mitigation process.
All other decisions that are not classified as transient decisions are defined as deferred decisions for which the mitigation variables are used regardless of their dynamic time scale. This kind of decision implies a non-fleeting fault occurrence that cannot be mitigated with a transient decision. This means that the PEMFC operating point is no longer suitable for healthy operations. Therefore, the deferred decision changes the operating point of the PEMFC by adjusting the controller set point to a value antagonistic to the fault occurrence to mitigate it.
Both decision processes (transient and deferred) modify each controller set point and find iteratively an adjusted one without the fault occurrence. It is assumed that the speed of the iterative process depends on the fault severity so that the adjusted set point can be found rapidly for a low level of severity, whereas it could be longer to find for a high level of severity. Therefore, if the occurred fault is assessed to have low severity by the diagnosis algorithm, decisions will modify the operating point with small increments. In case of higher severity, increments would be more important.
2.1.4. Decision Protocols
The test protocols consist of several decision case strategies, each decision case corresponding to a method in which the decision algorithm triggers the control variables for fault mitigation. The number of decision cases depends on the number of available control variables. The scheduling of each triggering has also to be considered and leads to five decision cases. Each case provides the hierarchy of the actions. All cases are considered possible paths toward fault mitigation.
Figure 2 is a representation of each possible case for fault mitigation.
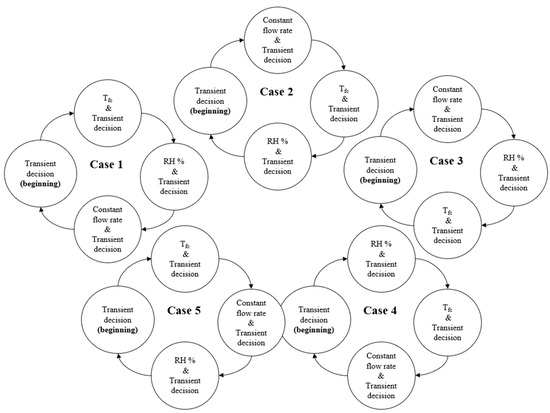
Figure 2.
Representation of each possible case for fault mitigation.
In Figure 2, each circle represents the action to take after a fault occurrence. There are four possible actions: modifying the input gas flow rate, going back to the initial value (transient decision), modifying the fuel cell temperature, modifying the input gas flow rate and keeping it, or modifying the input gas relative humidity (the three of them are considered as deferred decision).
Each control variable is sequentially modified and the decision process transition from one variable to another is represented by the arrows. The cases also show that the transient decision is triggered along with the control variables because this produces the fastest effect on fault mitigation. Therefore, triggering a transient decision is systematic when a fault is identified, while the deferred decision is only triggered if the transient decision does not allow sustainable fault mitigation. Figure 2 is a representation of this process. In all cases, a transient decision is always triggered because it always has an antagonistic influence on the occurred fault.
However, regarding each case, it appears that only the first one is relevant for fault mitigation and is considered in the mitigation strategy. Indeed, for cases 2 and 3, the second mitigation variable is the same as the transient decision.
2.2. Control Module
For seeking a simplified system, the control module consists of regulators which are already available on the system, so that only set points are changed according to the decision algorithm. However, these set points modifications do not take into consideration the PEMFC State of Health (SoH), which could lead to system destabilization. Indeed, a too high or too low change of the set points could lead to a transient response which degrades the PEMFC SoH. As it is not suitable for online SoH determination tools, a “near-blind” reconfiguration of the controller’s set point is operated. This kind of manipulation leads to adjusting the PEMFC operating point toward a more suitable point, which no longer allows faults occurrence. It is, therefore, possible to find iteratively a suitable point for healthy operation.
Metrics for AFTC analysis
Metrics are used to compare a system’s performance in several environments and for different operating modes. Regarding the AFTC experimental process on a PEMFC, appropriate metrics should be specified to quantify the faults mitigation quality, such as (i) the number of mitigation actions, (ii) the duration of the actions, (iii) the time to return to healthy conditions, (iv) the number of sensors used for the mitigation process, and (vi) the levels of increments (LoI) of the control variables. LoI is the way a control variable is modified for fault mitigation.
A combination of metrics is used to determine the best AFTC process for fault mitigation. The next section is dedicated to experimental validation of the AFTC strategy on PEMFC flooding and membrane drying out, it quantifies the level of actions that mitigates a fault once diagnosed.
3. Experimental Validation of the AFTC Strategy
3.1. Experimental Setup
The AFTC strategy is applied on a test bench of the FCT brand [25] which can supply a fuel cell with hydrogen at the anode and either pure oxygen or air at the cathode. In this work, all experimentations are carried out with pure oxygen. The tested fuel cell is a 50 W N117 Fuel Cell Store single-cell of 50 cm2 [26]. The used cell is a five layers MEA composed of carbon paper as a diffusion layer and with a platinum load of 0.5 mg/cm2 at the electrodes. The normal operating conditions recommended by the supplier are 20 A with 1.5 and 2 for H2 and O2 stoichiometries, respectively. The fuel cell temperature (Tfc) is fixed at 70 °C and oxygen relative humidity (RHO2) at 70%. The test bench is equipped with two flow rate controllers to manage the input reactant flows. A humification system is placed on the O2 and H2 line feeders and their relative humidity is regulated by the gas temperature controllers. Two back pressure controllers are placed at the event of the anode and cathode lines to manage the internal fuel pressures. During the fuel operation, the backpressure setpoint is fixed to 50 kPa, whereas the input pressure is not regulated. The pressure drop is then computed by the difference between the output and input pressure. An electronic load connected to the FC terminals can absorb the power of 1800 W. The whole system is monitored with a Labview virtual instrument.
3.2. Fault Generation
The objective of the following subsections is to present the changes in the operating conditions of the PEMFC to provoke intentional flooding and membrane drying out.
3.2.1. Flooding Generation at the PEMFC Cathode
As shown in Figure 3—the test bench feeds the PEMFC with reactants through a humidifier and a temperature-controlled canalization. Indeed, constant input flow (qO2_in) crosses the humidifier (qO2_hum) and emerges at the same temperature of the humidifier (Thum), which is the dew point temperature and at a hundred percent of relative humidity. The gas temperatures are then modified by the canalization temperature controller (Tcanal) to allow water to condense inside the pipe. Higher canalization temperatures lead to a decrease in the relative humidification rate and a lower temperature leads to water condensation.
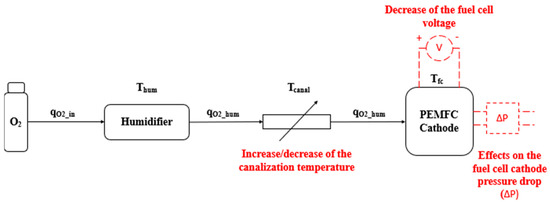
Figure 3.
Cathode line gas feeding with water condensation to provoke a fuel cell flooding.
It is, thus, through this latter process that liquid water is produced inside the cathode gas feeding line upstream of the PEMFC. The condensed water is then pushed into the PEMFC causing flooding. This way of generating the fault guarantees the presence of liquid water in the canalization and then the introduction of liquid water inside the cell. Figure 3 shows the variations in the operational conditions and the flooding generation.
3.2.2. Drying out Generation
Membrane drying out occurs when the membrane water content decreases too substantially. Therefore, to provoke the membrane drying out, the input cathode gas flow rate (qO2_in) is increased to drain as much water as possible, which leads to limit the membrane hydration. Then, the amount of steam injected into the gas feeding is reduced by increasing the canalization temperature of the cathode gas feeding (Tcanal), which also limits the PEMFC membrane hydration. Finally, increasing the PEMFC temperature (Tfc) is also performed to decrease the vapor partial pressure.
Table 1 summarizes the operating conditions for fault generation (flooding and drying out).

Table 1.
Operating conditions for faults generation.
In Table 1 λO2 and λH2 represent the oxygen and hydrogen stoichiometries, respectively, and describe the oxygen stoichiometry as:
3.3. Fault Mitigation: Validation of the AFTC
To validate the proposed AFTC strategy, the following sequences have been implemented on the test bench following faults generation as described above.
3.4. Flooding Mitigation Strategy
To validate the proposed AFTC strategy for flooding mitigation, we applied the first case protocol described in Figure 2 (case 1). The diagnosis algorithm is launched periodically with a period T. After the period 2T a diagnosis process is applied (Fault diagnosis 1) and triggers the next transient decision, which increases the input gas flow (qO2_in) as well as a deferred decision to Tfc of ±5 °C. This Tfc increase must be set low enough to prevent the MEA thermal stress and high enough to allow fast evaporation of clogged water with decreasing vapor pressure.
At the end of Diagnosis 1 and after a period T, Diagnosis 2 is triggered. If the same fault is re-diagnosed a transition decision is triggered (namely qO_2in), as well as a deferred one: this time, RH% is modified by ±10%.
Both decision processes (transient and deferred) modify each controller set point and find iteratively an adjusted one without the fault occurrence. The increments which are considered in the mitigation algorithm for two levels of fault severity are given in Table 2.

Table 2.
Increments of the input gas flow thanks to flooding severity (transient decisions).
The next step consists in validating the proposed AFTC strategy on a PEMFC regarding flooding and membrane drying out faults. The next section is, therefore, dedicated to the experimental validation of the proposed AFTC strategy.
3.5. Flooding AFTC Results
For the following flooding experiments, the fault mitigation processes are modified with the tunning of two parameters of the AFTC strategy. First, the diagnosis triggering period T is set to 30 s. Then to 15 s and, finally, to 60 s. The level of incrementation (LoI) is set at a low level for these three periods. In this way, it is possible to quantify the effect of the triggering period on flooding mitigation.
The second step of the experiment consists of repeating the same process with the three diagnosis triggering periods and modifying the LoI to the medium level. This step allows quantification of the effect of LoI on flooding mitigation.
3.5.1. Diagnosis Period of 30 s and for a Low Level of Increment (LoI)
Figure 4 shows flooding mitigation with a diagnosis triggering period Tdiag = 30 s. The fault is mitigated with a low level of increment of a variable for the transient decision.
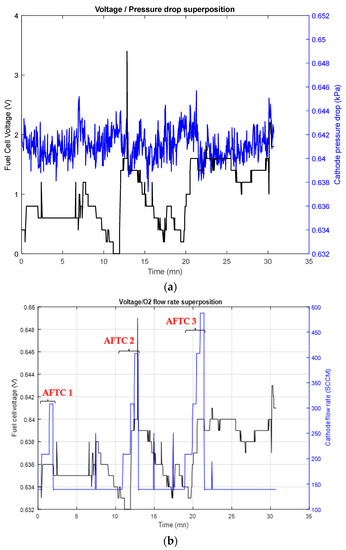
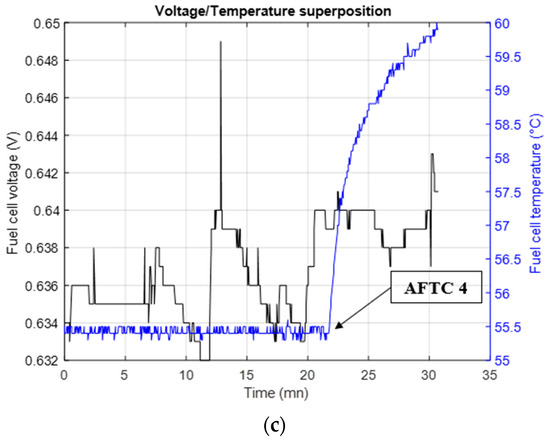
Figure 4.
Pressure drop, oxygen flow rate, and temperature superposition with the fuel cell voltage for T = 30 s. (a) Fuel cell voltage and cathode pressure drop superposition; (b) Fuel cell voltage and input gas flow superposition; (c) Fuel cell voltage and temperature superposition.
Figure 4a associates the evolution of the fuel cell voltage with the cathode pressure drop. As explained on Figure 1, the diagnosis tool managed to identify flooding based on the monitoring of these two variables, used as the 2 flooding fault indicators.
If flooding is identified, an increase in the cathode flow rate is performed to drain as much liquid water as possible. This is the transient decision for flooding mitigation. When the periodically-launched diagnosis tool indicates that there is no longer a fault, the flow rate value is reset to its initial setpoint. Three transient decisions are marked AFTC 1 to 3. Each change in cathode flow rate is plotted in Figure 4b.
Figure 4c shows the fuel cell voltage and temperature evolutions The change of temperature setpoint is a deferred decision (AFTC 4) that has been triggered by the reoccurrence of flooding after the third transient decision mitigation AFTC 3 on the Figure 4b.
Figure 4c shows that fuel cell temperature is incrementally increased by 5 °C. After this temperature increase, the fuel cell voltage recovers while the O2 relative humidity remains unchanged. Following these decisions, the flooding is no longer present. The PEMFC operating conditions, therefore, allow a healthy fuel cell operation.
In this experiment, the flooding fault is permanently mitigated about 25 min after its 1st detection. Three incrementations of the O2 flow rate value and one of temperature were needed. This first experiment shows that the fuel cell temperature variable and the level of increments influence the fault mitigation speed. These two actions are thus full of interest for further study.
3.5.2. Diagnosis Period of 15 s and for a Low Level of Increment
Figure 5 represents a flooding mitigation process with a diagnosis triggering period T = 15 s. The fault is also mitigated with a low level of command magnitude.
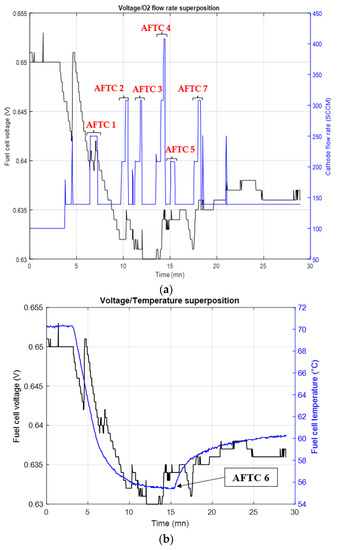
Figure 5.
Pressure drop, oxygen flow rate, and temperature superposition with the fuel cell voltage for T = 15 s. (a) Fuel cell voltage and input gas flow superposition; (b) Fuel cell voltage and temperature superposition.
In this experiment, the flooding is permanently mitigated after about 15 min. Six O2 flow rate increments have been performed (AFTC 1 to 5 and AFTC 7) and the fuel cell temperature has been increased by 5 °C after 11 min (AFTC 6).
3.5.3. Diagnosis Period of 60 s and for a Low Level of Increment
Figure 6 represents a flooding mitigation process with a diagnosis triggering period T = 60 s. The fault is also mitigated with a low level of increment.
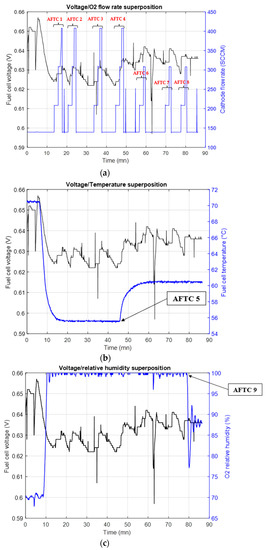
Figure 6.
Pressure drop, oxygen flow rate, relative humidity, and temperature superposition with the fuel cell voltage for T = the 60 s. (a) Fuel cell voltage and input gas flow superposition; (b) Fuel cell voltage and temperature superposition; (c) Fuel cell voltage and relative humidity superposition.
In this experiment, the flooding is permanently mitigated in about 70 min. Seven flow rate increments (AFTC 1 to AFTC 7) have been performed and the fuel cell temperature has been increased to 5 °C after 45 min. The cathode gas relative humidity has been decreased by 10% after 65 min.
The flooding AFTC mitigation has also been tested for the medium level of transient increments and three periods of diagnosis triggering. Results are presented in Table 3.

Table 3.
Flooding mitigation experimentation synthesis.
Table 3 summarized the number of transient decisions and deferred decisions triggered for each test. It also gives the trigger time for deferred decisions and the fault mitigation times.
The next step of the experimental validation of the fault mitigation strategy consists of applying it to a membrane drying-out occurrence.
3.6. Drying out Mitigation Strategy
As for the flooding mitigation, the AFTC strategy manages to mitigate the membrane drying out by iteratively changing the PEMFC operating point. For clarity on Figure 7, the pressure drop is not given as it is not meaningful in the membrane drying out a diagnosis. The increases considered in the mitigation algorithm for two levels of fault severity are given in Table 4.
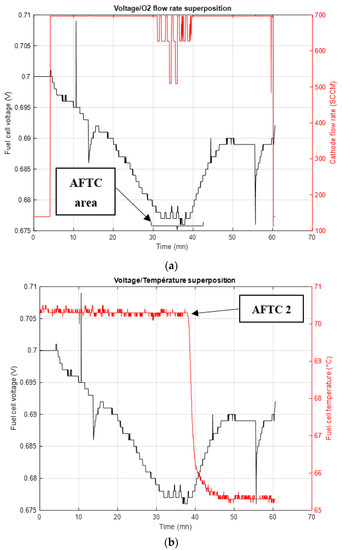
Figure 7.
Oxygen flow rate and temperature superposition with the fuel cell voltage and T = 30 s for membrane drying out. (a) Input cathode flow and fuel cell voltage superposition; (b) Fuel cell temperature and voltage superposition.

Table 4.
Increments of the input gas flow thanks to drying out severity (transient decisions).
3.6.1. Drying out AFTC Results
For the following membrane drying out experiments, the fault mitigation process is modified with the tunning of two parameters of the AFTC strategy. First, the diagnosis triggering period Tag is set to 30 s, then to 15 s, and finally to 60 s. The LoI is set at a low level for these three periods. In this way, it is possible to quantify the effect of the triggering period on the membrane drying out mitigation.
The second step of the experiment consists of repeating the same process with the three diagnosis triggering periods and modifying the LoI to the medium level. This step allows quantification of the effect of LoI on the membrane drying out mitigation.
3.6.2. Diagnosis Period of 30 s and for a Low Level of Increment
Figure 7 presents the membrane drying out mitigation with Tdiag = 30 s as the diagnosis triggering period. The fault is mitigated with a low LoI.
If a drying out is identified by the diagnosis tool, a rapid decrease in the cathode flow rate is carried out to reduce the amount of drained water. Each change in cathode flow rate is plotted on Figure 7. When the diagnosis tool notifies that there is no longer fault identified, the flow rate value is reset to its initial setpoint. As for flooding, the first mitigation process is set through the transient decision phase.
Figure 7b shows the fuel cell voltage evolution plotted with the fuel cell temperature (AFTC 2). The change of temperature setpoint is due to a membrane drying out reoccurrence after the third mitigation process. The graph shows that fuel cell temperature is decreased by 5 °C. This temperature modification should allow reduction of the saturation vapor pressure which leads to an increase in the PEMFC water content. This kind of decision corresponds to the deferred decision phase because it changes permanently the PEMFC operating point.
After this temperature modification, the fuel cell voltage rises again. The O2 relative humidity remains unchanged. After these decisions, the membrane drying out is no longer present. The PEMFC operating conditions, therefore, allow a healthy operation.
In this experiment, the fault is permanently mitigated after about 16 min after the first drying out occurrence. Three flow rate decreases have been necessary, and the fuel cell temperature has been reduced by 5 °C after 8 min since the first fault identification.
The membrane drying out mitigation has also been tested for the medium level of transient increments and three periods of diagnosis triggering.
Results are presented in Table 5.

Table 5.
Membrane drying out mitigation experimentation synthesis.
The next section aims to proceed to the experiment’s discussion and analysis.
4. Discussion
In this part, we will discuss the results of the flooding and membrane drying out mitigation process.
4.1. Flooding Mitigation Analysis
The influence of three diagnosis periods and two levels of increments have been studied and several metrics used to compare each AFTC strategy performance after flooding. Indeed, five metrics have been defined to quantify flooding mitigation and only three of them are relevant metrics for flooding: number of transient decisions; fault mitigation time; and deferred decision triggering time. The number of used sensors and deferred decisions is a useless metric for this experiment due to the strong positive effects of the first deferred decision which is the temperature. It is, therefore, possible to place the result of the metrics on three radar graphs to determine the best mitigation option as represented on Figure 8.
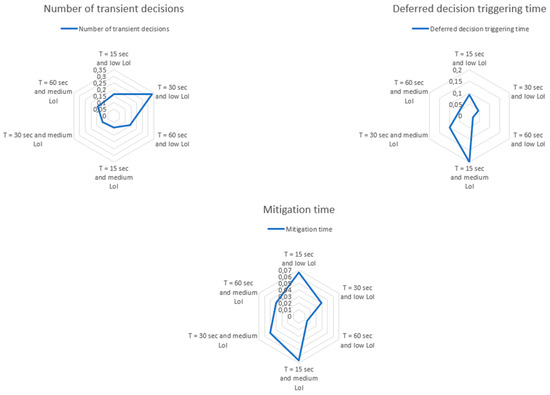
Figure 8.
Radar graphs for the three relevant metrics regarding the flooding mitigation.
The analysis of Figure 8 allows the following interpretations:
- The major criterion is to minimize the number of transient decisions. In this case, the choice of a low LoI with 30 s of triggering diagnosis period is the most relevant;
- The major criterion is to minimize the triggering time of the deferred decisions. In this case, the choice of a medium LoI with 15 s of triggering diagnosis period is the most relevant;
- The major criterion is the fault mitigation time, the choice of 15 s of triggering diagnosis period is the most relevant choice independently to the LoI.
4.2. Membrane Drying Out Mitigation Analysis
As for flooding, the membrane drying out fault has been tested. The two LoI and the three diagnosis triggering periods considered are the same as for flooding. The three relevant metrics are also considered and plotted in Figure 9.
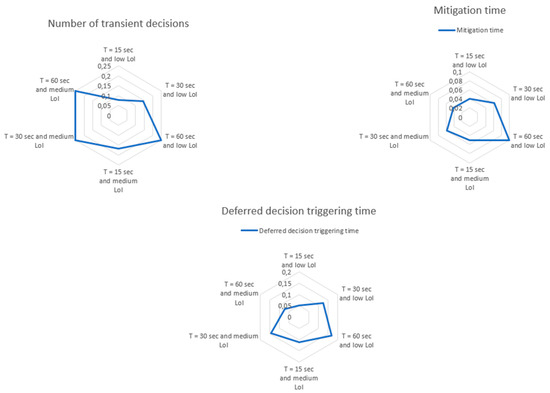
Figure 9.
Radar graphs for the three relevant metrics regarding the membrane drying out mitigation.
Radar graphs are, therefore, plotted to determine the best mitigations ways:
The analysis of Figure 9 allows the following interpretations:
- The major criterion is to minimize the number of transient decisions. In this case, medium LoI or long-lasting decisions for 60 s of diagnosis triggering period are the most relevant actions;
- The major criterion is to minimize the triggering time of the deferred decisions. In this case, the choice of a medium LoI with 60 s of triggering diagnosis period is the most relevant;
- The major criteria are the fault mitigation time, the choices of 15 and 60 s of diagnosis triggering periods for respectively medium and low LoI are the most relevant.
It is possible to observe for the membrane drying out mitigation that it is always a long-lasting action or an upper LoI which are the most relevant actions. These observations of the effects of the trigger period and the LoI are corroborated in [27], which indicates that the membrane electrode assembly hydration is carried out after 100 s. Therefore, by a strong reduction in the cathode input gas flow and by maintaining it for a sufficiently long time, the fault can be mitigated more efficiently.
5. Conclusions
An active fault tolerant control is proposed in this paper to mitigate the fuel cell water management fault issues. For this purpose, a three-module architecture is proposed with a diagnosis part, a decision part, and a control part. The diagnosis part is chosen based on a previous work which manages to identify flooding and a membrane drying out.
This mitigation strategy has been tested on a single-cell proton exchange membrane fuel cell. The tested protocol aims to evaluate the effect of two-parameter (namely, diagnostic frequency and level of corrective parameters increments) on the mitigation strategy performances.
Regarding flooding mitigation, results show that the best settings of the two parameters depend on the target fixed by the metrics. Indeed, fast fault mitigation implies a more recurrent fuel cell diagnosis triggering than slower mitigation with fewer actions on the fuel cell.
For the membrane drying out, experiments show that higher more the level of corrective parameters are (and they last), the more the fault is mitigated.
In the proposed AFTC approach, the decision module appears as a milestone of the designed strategy. It relies on the fuel cell FSA study and information given by the diagnosis tool to adapt to the new operating parameters. The used architecture is, thus, limited by each module’s response time, reliability, and accuracy. Another design as a parallel or serial-parallel of the decision module with the diagnosis could be most suitable for the fault mitigation process. Indeed, the present work only focuses on a serial mode strategy with all limitations exposed above. By parallelizing some modules, the limiting effect of a full serial architecture would be reduced and a gain in response time and better genericity of architecture could be raised. Finally, the strategy has been tested on single-cell fuel cells and should be validated on a PEMFC stack. This stack validation constitutes the next step of our work.
Author Contributions
Conceptualization, E.D., N.Y.S., M.B., M.-C.P. and B.G.-P.; methodology, E.D., N.Y.S., M.B., M.-C.P. and B.G.-P.; software, E.D., N.Y.S. and M.-C.P.; validation, E.D., N.Y.S., M.B., M.-C.P.and B.G.-P.; formal analysis, E.D., N.Y.S. and M.-C.P.; investigation, E.D., N.Y.S. and M.-C.P.; resources, E.D.; data curation, E.D.; writing—original draft preparation, E.D.; writing—review and editing, E.D., N.Y.S. and M.-C.P.; visualization, E.D.; supervision, N.Y.S., M.B., M.-C.P. and B.G.-P.; project administration, N.Y.S., M.B., M.-C.P. and B.G.-P.; funding acquisition, N.Y.S., M.B., M.-C.P. and B.G.-P. All authors have read and agreed to the published version of the manuscript.
Funding
This work has been supported by the Région Réunion, the Région Bourgogne Franche-Comté, and by the EIPHI Graduate School (contract ANR-17-EURE-0002).
Institutional Review Board Statement
Not applicable.
Informed Consent Statement
Not applicable.
Data Availability Statement
Not applicable.
Conflicts of Interest
The authors declare no conflict of interest.
References
- Dijoux, E.; Steiner, N.Y.; Benne, M.; Péra, M.-C.; Pérez, B.G. A review of fault tolerant control strategies applied to proton exchange membrane fuel cell systems. J. Power Sources 2017, 359, 119–133. [Google Scholar] [CrossRef]
- Li, H.; Tang, Y.; Wang, Z.; Shi, Z.; Wu, S.; Song, D.; Zhang, J.; Fatih, K.; Zhang, J.; Wang, H.; et al. A review of water flooding issues in the proton exchange membrane fuel cell. J. Power Sources 2008, 178, 103–117. [Google Scholar] [CrossRef]
- Yousfi-Steiner, N.; Moçotéguy, P.; Candusso, D.; Hissel, D. A review on polymer electrolyte membrane fuel cell catalyst degradation and starvation issues: Causes, consequences and diagnostic for mitigation. J. Power Sources 2009, 194, 130–145. [Google Scholar] [CrossRef]
- Abbaspour, A.; Yen, K.K.; Forouzannezhad, P.; Sargolzaei, A. Active Adaptive Fault-Tolerant Control Design for PEM Fuel Cells. In 2018 IEEE Energy Conversion Congress and Exposition, ECCE 2018; IEEE: Piscataway, NJ, USA, 2018; pp. 3616–3622. [Google Scholar]
- Yan, C.; Chen, J.; Liu, H.; Lu, H. Model-Based Fault Tolerant Control for the Thermal Management of PEMFC Systems. IEEE Trans. Ind. Electron. 2020, 67, 2875–2884. [Google Scholar] [CrossRef]
- Yang, D.; Wang, Y.; Chen, Z. Robust fault diagnosis and fault tolerant control for PEMFC system based on an augmented LPV observer. Int. J. Hydrog. Energy 2020, 45, 13508–13522. [Google Scholar] [CrossRef]
- Luo, L.; Huang, B.; Cheng, Z.; Jian, Q. Improved water management by alternating air flow directions in a proton exchange membrane fuel cell stack. J. Power Sources 2020, 466, 228311. [Google Scholar] [CrossRef]
- Talukdar, K.; Ripan, M.A.; Jahnke, T.; Gazdzicki, P.; Morawietz, T.; Friedrich, K.A. Experimental and numerical study on catalyst layer of polymer electrolyte membrane fuel cell prepared with diverse drying methods. J. Power Sources 2020, 461, 228169. [Google Scholar] [CrossRef]
- Yuan, W.; Zhang, X.; Hou, C.; Zhang, Y.; Wang, H.; Liu, X. Enhanced water management via the optimization of cathode microporous layer using 3D graphene frameworks for direct methanol fuel cell. J. Power Sources 2020, 451, 227800. [Google Scholar] [CrossRef]
- Sun, C.Y.; Zhang, H.; Luo, X.D.; Chen, N. A comparative study of Nafion and sulfonated poly(ether ether ketone) membrane performance for iron-chromium redox flow battery. Ionics 2019, 25, 4219–4229. [Google Scholar] [CrossRef]
- Choi, S.R.; Kim, D.Y.; An, W.Y.; Choi, S.; Park, K.; Yim, S.D.; Park, J.Y. Assessing the degradation pattern and mechanism of membranes in polymer electrolyte membrane fuel cells using open-circuit voltage hold and humidity cycle test protocols. Mater. Sci. Energy Technol. 2022, 5, 66–73. [Google Scholar] [CrossRef]
- Lebreton, C.; Damour, C.; Benne, M.; Grondin-Perez, B.; Chabriat, J.-P. Passive Fault Tolerant Control of PEMFC air feeding system. Int. J. Hydrogen Energy 2016, 41, 15615–15621. [Google Scholar] [CrossRef]
- Lebreton, C.; Benne, M.; Damour, C.; Yousfi-Steiner, N.; Grondin-Perez, B.; Hissel, D.; Chabriat, J.P. Fault Tolerant Control Strategy applied to PEMFC water management. Int. J. Hydrogen Energy 2015, 40, 10636–10646. [Google Scholar] [CrossRef]
- Zhang, Y.; Jiang, J. Integrated Design of Reconfigurable Fault-Tolerant Control Systems. J. Guid. Control. Dyn. 2001, 24, 133–136. [Google Scholar] [CrossRef]
- Blanke, M.; Kinnaert, M.; Lunze, J.; Staroswiecki, M. Diagnosis and Fault-Tolerant Control with Contributions; Springer: Berlin/Heidelberg, Germany, 2006. [Google Scholar]
- Wu, X.; Zhou, B. Fault tolerance control for proton exchange membrane fuel cell systems. J. Power Sources 2016, 324, 804–829. [Google Scholar] [CrossRef]
- Zhou, S.; Wang, K.; Zhou, S.; Shan, J.; Bao, D. Features selection and substitution in PEM fuel cell water management failures diagnosis. Fuel Cells 2021, 21, 512–522. [Google Scholar] [CrossRef]
- Lin-Kwong-Chon, C.; Damour, C.; Benne, M.; Kadjo, J.J.A.; Grondin-Pérez, B. Adaptive neural control of PEMFC system based on data-driven and reinforcement learning approaches. Control Eng. Pract. 2022, 120, 105022. [Google Scholar] [CrossRef]
- Ziane, M.A.; Join, C.; Pera, M.C.; Steiner, N.Y.; Benne, M.; Damour, C. A new method for fault detection in a free model context. IFAC-PapersOnLine 2022, 55, 55–60. [Google Scholar] [CrossRef]
- Lee, D.; Bae, J. Visualization of flooding in a single cell and stacks by using a newly-designed transparent PEMFC. Int. J. Hydrogen Energy 2012, 37, 422–435. [Google Scholar] [CrossRef]
- Barbir, F.; Gorgun, H.; Wang, X. Relationship between pressure drop and cell resistance as a diagnostic tool for PEM fuel cells. J. Power Sources 2005, 141, 96–101. [Google Scholar] [CrossRef]
- Steiner, N.Y.; Hissel, D.; Moçotéguy, P.; Candusso, D. Diagnosis of polymer electrolyte fuel cells failure modes (flooding & drying out) by neural networks modeling. Int. J. Hydrogen Energy 2011, 36, 3067–3075. [Google Scholar]
- Yousfi Steiner, N.; Hissel, D.; Mocoteguy, P.; Candusso, D.; Marra, D.; Pianese, C.; Sorrentino, M. Application of Fault Tree Analysis to Fuel Cell diagnosis. Fuel Cells 2012, 12, 302–309. [Google Scholar] [CrossRef]
- Dijoux, E.; Steiner, N.Y.; Benne, M.; Pera, M.; Grondin-Perez, B. Fault Structural Analysis Applied to Proton Exchange Membrane Fuel Cell Water Management Issues. Electrochem 2021, 2, 604–630. [Google Scholar] [CrossRef]
- Single Cell Hardware. Available online: http://fuelcelltechnologies.com/single-cell-hardware (accessed on 1 May 2020).
- MEA for Expandable PEM Research Test Cell—50cm2. Available online: https://www.fuelcellstore.com/fuel-cell-components/membrane-electrode-assembly/mea-expandable-test-cell-50 (accessed on 3 May 2020).
- Siegel, J.B.; McKay, D.A.; Stefanopoulou, A.G.; Hussey, D.S.; Jacobson, D.L. Measurement of Liquid Water Accumulation in a PEMFC with Dead-Ended Anode. J. Electrochem. Soc. 2008, 155, B1168. [Google Scholar] [CrossRef]
Publisher’s Note: MDPI stays neutral with regard to jurisdictional claims in published maps and institutional affiliations. |
© 2022 by the authors. Licensee MDPI, Basel, Switzerland. This article is an open access article distributed under the terms and conditions of the Creative Commons Attribution (CC BY) license (https://creativecommons.org/licenses/by/4.0/).