Article

Hydrogen Bond Donors Influence on the Electrochemical Performance of Composite Graphene Electrodes/Deep Eutectic Solvents Interface

Departamento de Química e Bioquímica, Faculdade de Ciências da Universidade do Porto, CIQUP–Physical Analytical Chemistry and Electrochemistry Group, Rua do Campo Alegre, s/n, 4169-007 Porto, Portugal
*
Author to whom correspondence should be addressed.
Electrochem 2022, 3(1), 129-142; https://doi.org/10.3390/electrochem3010009
Submission received: 15 December 2021 / Revised: 20 January 2022 / Accepted: 7 February 2022 / Published: 10 February 2022
(This article belongs to the Collection Feature Papers in Electrochemistry)

Abstract

:
The development of energy storage devices with better performance relies on the use of innovative materials and electrolytes, aiming to reduce the carbon footprint through the screening of low toxicity electrolytes and solvent-free electrode design protocols. The application of nanostructured carbon materials with high specific surface area, to prepare composite electrodes, is being considered as a promising starting point towards improving the power and energy efficiency of energy storage devices. Non-aqueous electrolytes synthesized using greener approaches with lower environmental impact make deep eutectic solvents (DES) promising alternatives for electrochemical energy storage and conversion applications. Accordingly, this work proposes a systematic study on the effect of the composition of DES containing a diol and an amide as HBD (hydrogen bond donor: 1,2-propylene glycol and urea), on the electrochemical performance of graphene and graphite composite electrodes/DES electrolyte interface. Glassy carbon (GC) was selected as the bare electrode material substrate to prepare the composite formulations since it provides an electrochemically reproducible surface. Gravimetric capacitance was measured for commercial graphene and commercial graphite/GC composite electrodes in contact with choline chloride, complexed with 1,2-propylene glycol, and urea as the HBD in 1:2 molar ratio. The electrochemical stability was followed by assessing the charge/discharge curves at 1, 2, and 4 A g−1. For comparison purposes, a parallel study was performed using commercial graphite. A four-fold increase in gravimetric capacitance was obtained when replacing commercial graphite (1.70 F g−1) by commercial graphene (6.19 F g−1) in contact with 1,2-propylene glycol-based DES. When using urea based DES no significant change in gravimetric capacitance was observed when commercial graphite is replaced by commercial graphene.

Graphical Abstract

1. Introduction

Carbon-based materials are excellent candidates as electrode materials for energy storage applications due to their physicochemical properties such as their low atomic number, making them lightweight, with long term stability, low residual current, and broad potential range. Carbon nanomaterials, such as graphene and graphite, present remarkable physical, chemical, and mechanical properties [1] which have attracted considerable interest for a large diversity of applications, ranging from energy conversion (solar and fuel cells) [2,3,4], to energy storage (supercapacitors and batteries) [5,6,7], and to environmental remediation (removal of heavy metals from water and soils) [8,9].
Carbon materials selected as electrodes for supercapacitors are characterized by a certain degree of porosity that can be suitable for aqueous or organic solvents, but their capacitance can be significantly influenced by the size of ions present in the electrolytes which can be critical when DES or ILs are used [10]. The electrochemistry of graphene has been massively studied in conventional aqueous and non-aqueous electrolytes [11,12,13,14,15,16,17,18]. Up to this point, DES/graphene interfaces have been mainly studied through computational methods [19,20,21,22] and only a few experimental reports are available [23,24].
The energy storage mechanism is determined by the electrical double-layer structure (EDL) which in turn relies on the potential dependency of the electrolyte ions charges distribution through the electrode/electrolyte interface [25]. The anatomy of the IL EDL structure is shaped by the nature of the electrode surface and electrolyte composition which significantly influences the charge storage and ion dynamics, and consequently, the arrangement of the ions at the electrified surface [26]. In the differential capacity assessment of a DES based on choline chloride and glycerol/solid electrodes interfaces, C(E) curves were potential-dependent and sensitive to the electrode material, presenting higher capacitance for Au than for Pt or GC [27]. Dean et al. [28] assessed the electrode–electrolyte interfaces of DES containing ChCl and ethylene glycol, thus highlighting distinct capacitive behavior depending on the electrode material (GC, Pt, and Au). The authors interpreted the EDL model within the framework of a modified Gouy–Chapman model, with the size of the ions playing a relevant role in the definition of the inner layer at the electrode surface. More recently, Wu et al. [29] assessed the HBD effect in describing electrochemical interfaces of choline chloride-based DES complexed with ethylene glycol and lactic acid using anodic dissolution and the passivation of Au electrode in the EDL region. The authors notice the relevant effect of the Cl- adsorption in the formation of coordination compounds during Au surface reconstruction. It is common knowledge that electrode nature strongly conditions the electrochemical system’s behavior, therefore in the pursuit of better-performing electrochemical interfaces, Costa et al. [30] assessed the electrochemical behavior of carbon allotropes composite electrodes immersed in 1-butyl-3-methylimidazolium (tris(pentafluoroethyl) trifluorophosphate) ([C4MIM][FAP]) IL, in which a 100-fold increase in the capacitive current was reported for reduced graphene oxide. Recently, Brandão et al. [24] studied the electrochemical behavior of commercial graphene and commercial graphite in ethaline (eutectic mixture formed by choline chloride and ethylene glycol), showing a specific capacitance of 5.45 ± 0.96 F g−1 and 4.27 ± 0.85 F g−1, respectively. The authors demonstrated the possibility to successfully use composite carbon allotropes electrodes immersed in DES electrolytes as promising electrochemical interfaces for advanced energy storage devices applications (e.g., supercapacitors).
It has been proposed that porous carbons present a significant proportion of narrow micropores inaccessible to the electrolyte ions (or molecules), and due to that, the overall surface is not being used for charge accumulation processes [31,32]. It has been suggested that the capacitance corresponds to separate contributions from the surface of the micropore walls and the external surface [33,34]. Pores with sizes matching the ion dimensions result in more effective charge storage, maximizing the capacitance normalized to the surface area (in F m−2) [35,36]. To determine the specific role of the carbon porosity in the mechanism of the electrical double-layer structure formation it is crucial to collect experimental data on the specific surface area and pore size and assess possible existing correlation with capacitance.
In this work, the electrochemical study of commercial graphene and graphite, with well-defined surface area and pore size was studied by varying the composition of the DES constituted by choline chloride complexed with the HBD diol (1,2-propeline) and amide (urea). This work demonstrates the importance of correlating the surface area and porosity of the carbon materials with the electrochemical behavior of the carbon composite electrodes/DES interfaces (e.g., size and structure of the DES constituting ions).

2. Materials and Methods

2.1. Chemicals and Solvents

Choline chloride (Sigma Aldrich, 99% (Merck KGaA, Darmstadt, Germany)) was dried in the oven overnight, at 60 °C, before use; commercial graphene (platelets, 99.5%, Iolitec Nanomaterials (IoLiTec−Ionic Liquids Technologies GmbH, Heilbronn, Germany)), commercial graphite (powder, Sigma Aldrich (Merck KGaA, Darmstadt, Germany)), 1,2–propylene glycol, urea (Sigma Aldrich, 99% (Merck KGaA, Darmstadt, Germany)), Nafion TM 117 (Sigma Aldrich, 99% (Merck KGaA, Darmstadt, Germany)), and N, N-Dimethylformamide (Sigma Aldrich, 99% (Merck KGaA, Darmstadt, Germany)) were used as received.
The eutectic mixture was formed by stirring the two selected components at 60 °C (detailed proportions used are displayed in Table 1) until a homogeneous and colorless liquid was created. Before the electrochemical experiments, the DES was de-aerated with nitrogen, and the cell was always kept under a nitrogen atmosphere.

2.2. Physicochemical Characterization

2.2.1. Viscosity

The dynamic viscosity of the DES was measured using the automated Anton Paar DMA™ 4500 M micro viscometer (Anton Paar GmbH, Graz, Austria), from 30 to 60 °C.

2.2.2. Water Content

The water content was measured for each eutectic mixture before each measurement to make sure that all the electrochemical studies were performed under the same conditions. The water content results are presented in Table 2. Water content (wt.%) was determined using a Karl Fischer titrator (831 KF Coulometer, Methrom), before the electrochemical studies. The sample solution was manually mixed to homogenize before titrating. Then, 1.00 mL of sample was added to the dry methanol solvent (HYDRANAL™, max 0.01 wt.% water, Riedel−de−Haën (Honeywell Specialty Chemicals Seelze GmbH Charlotte, EUA)) and titrated with HYDRANAL™ Composite 5 Reagent (4.5–5.5 mg mL−1 water equivalent, Riedel−de−Haën (Honeywell Specialty Chemicals Seelze GmbH Charlotte, EUA)) for moisture determination. Measurements were performed in triplicate.

2.2.3. Ionic Conductivity

The ionic conductivity of 1,2-propeline and R200 were measured with Mettler Toledo Conductivity meter F30. An aqueous solution of KCl was used as a calibration standard. The temperature was stabilized with a thermostat for both calibration and experimental measurement.

2.3. Electrochemical Measurements

A three-electrode electrochemical cell consisting of a glassy carbon (GC) electrode (Methrom (Herisau, Switzerland), area 0.0721 cm2), a GC rod (Thermo Fisher (Kandel) GmbH, Germany) counter electrode, and a silver wire (Thermo Fisher (Kandel) GmbH, Germany) pseudo-reference electrode were used.
The preparation of the working electrode (polishing and electrochemical cleaning) is described elsewhere [30,37,38].
The immobilization of the carbon material followed the description presented by Brandão et al. [24,38], using N, N-Dimethylformamide (DMF) as dispersant media and Nafion as a binder. Briefly, the immobilization of the carbon/composite material was achieved by preparing a dispersion of 5 mg of carbon in 950 μL of DMF and 10 μL Nafion® 117 solutions. To keep the dispersion restricted to the electrode’s active surface, avoiding the Teflon surrounding part, several small amounts of the suspension were dropped on the glassy carbon electrode surface using a micropipette. The amount of the carbon coated on the GC electrode was obtained as an average of three measurements. The area density of the carbon material for the subsequent studies was calculated taking into consideration that the material and Nafion dispersion in DMF is homogeneous. The value of the area density was estimated to be ~6.67 × 10⁻³ g cm−2.
Electrochemical impedance spectroscopy spectra (EIS, Metrohm (Herisau, Switzerland)) were collected in the range of 20 kHz to 1 Hz with frequencies logarithmically distributed with a sinusoidal signal of 10 mV (rms) superimposed over a dc potential. EIS measurements were made at 20 mV intervals. The differential capacitance was obtained from the EIS measurements, and the impedance data were fitted to an equivalent circuit using Nova 2.1.5. software version.
The capacitance extraction from the impedance data is described by Silva et al. [39]. The EIS spectra were fitted to a simple R-CPE circuit, and the quality of the fitting was judged by the value of χ2 (<10−3).
Galvanostatic charge/discharge curves were collected at current densities of 1, 2 and 4 A g−1. The specific capacitance in three-electrode configuration was calculated from the galvanostatic discharge curves using the Equation (1) proposed by Stoller et al. [40]:
C = I Δ t m Δ V
where I is the discharge current (A), Δt is the discharge time (s), ΔV is the potential window (V), and m is the weight of the carbon material in the electrode.

2.4. Carbon Material Characterization

Surface analysis was carried out using scanning electron microscopy FEI Quanta 400 FEG/EDAX Genesis X4 M at CEMUP (FEI company, Hillsboro, OR, USA). The surface area and pore parameters were determined by Brunauer-Emmett-Teller (BET) nitrogen adsorption analyzer (TriStar Plus, Micromeritics, Norcross, GA, USA).

3. Results and Discussion

The HBD nature is known to be of extreme importance to establish carbon structure–liquid property relationships in DESs. Type III DESs class, including 1,2-propanediol polyalcohol, and the amide urea, as HBDs, complexed with choline chloride, will be used to evaluate the effect of the nature of the HBD on the interfacial capacitance of the composite carbon film.

3.1. Deep Eutectic Solvent Characterization

The water content, viscosity and ionic conductivity of the two studied DES are presented in Table 2. R200, composed of urea as HBD, present higher values of viscosity, lower water content and lower values of ionic conductivity, compared with 1,2-propeline, which is in agreement with the work published by Salomé et al. [37].
According to Table 2, with increasing temperature there is a decrease in viscosity and consequently an increase in the ionic conductivity, which is in agreement with several papers already published [41,42,43,44,45,46]. Shahbaz et al. [47] found that the type of salt and HBD along with the mole ratio of both compounds had a significant effect on increasing/decreasing the viscosity and ionic conductivity of the DES. The viscosity of the DES decreases with increasing temperature, and there is a clear dependence on the chain length of the HBD, as presented by Cotroneo-Figueroa et al. [48], being also consistent with the results presented by Garcia et al. [49] about the density decay due to a longer alkyl chain for organics acids.
The sizes of the HBDs (1,2-propylene glycol and urea) and the HBA (choline chloride) are presented in Figure 1 [22,50].

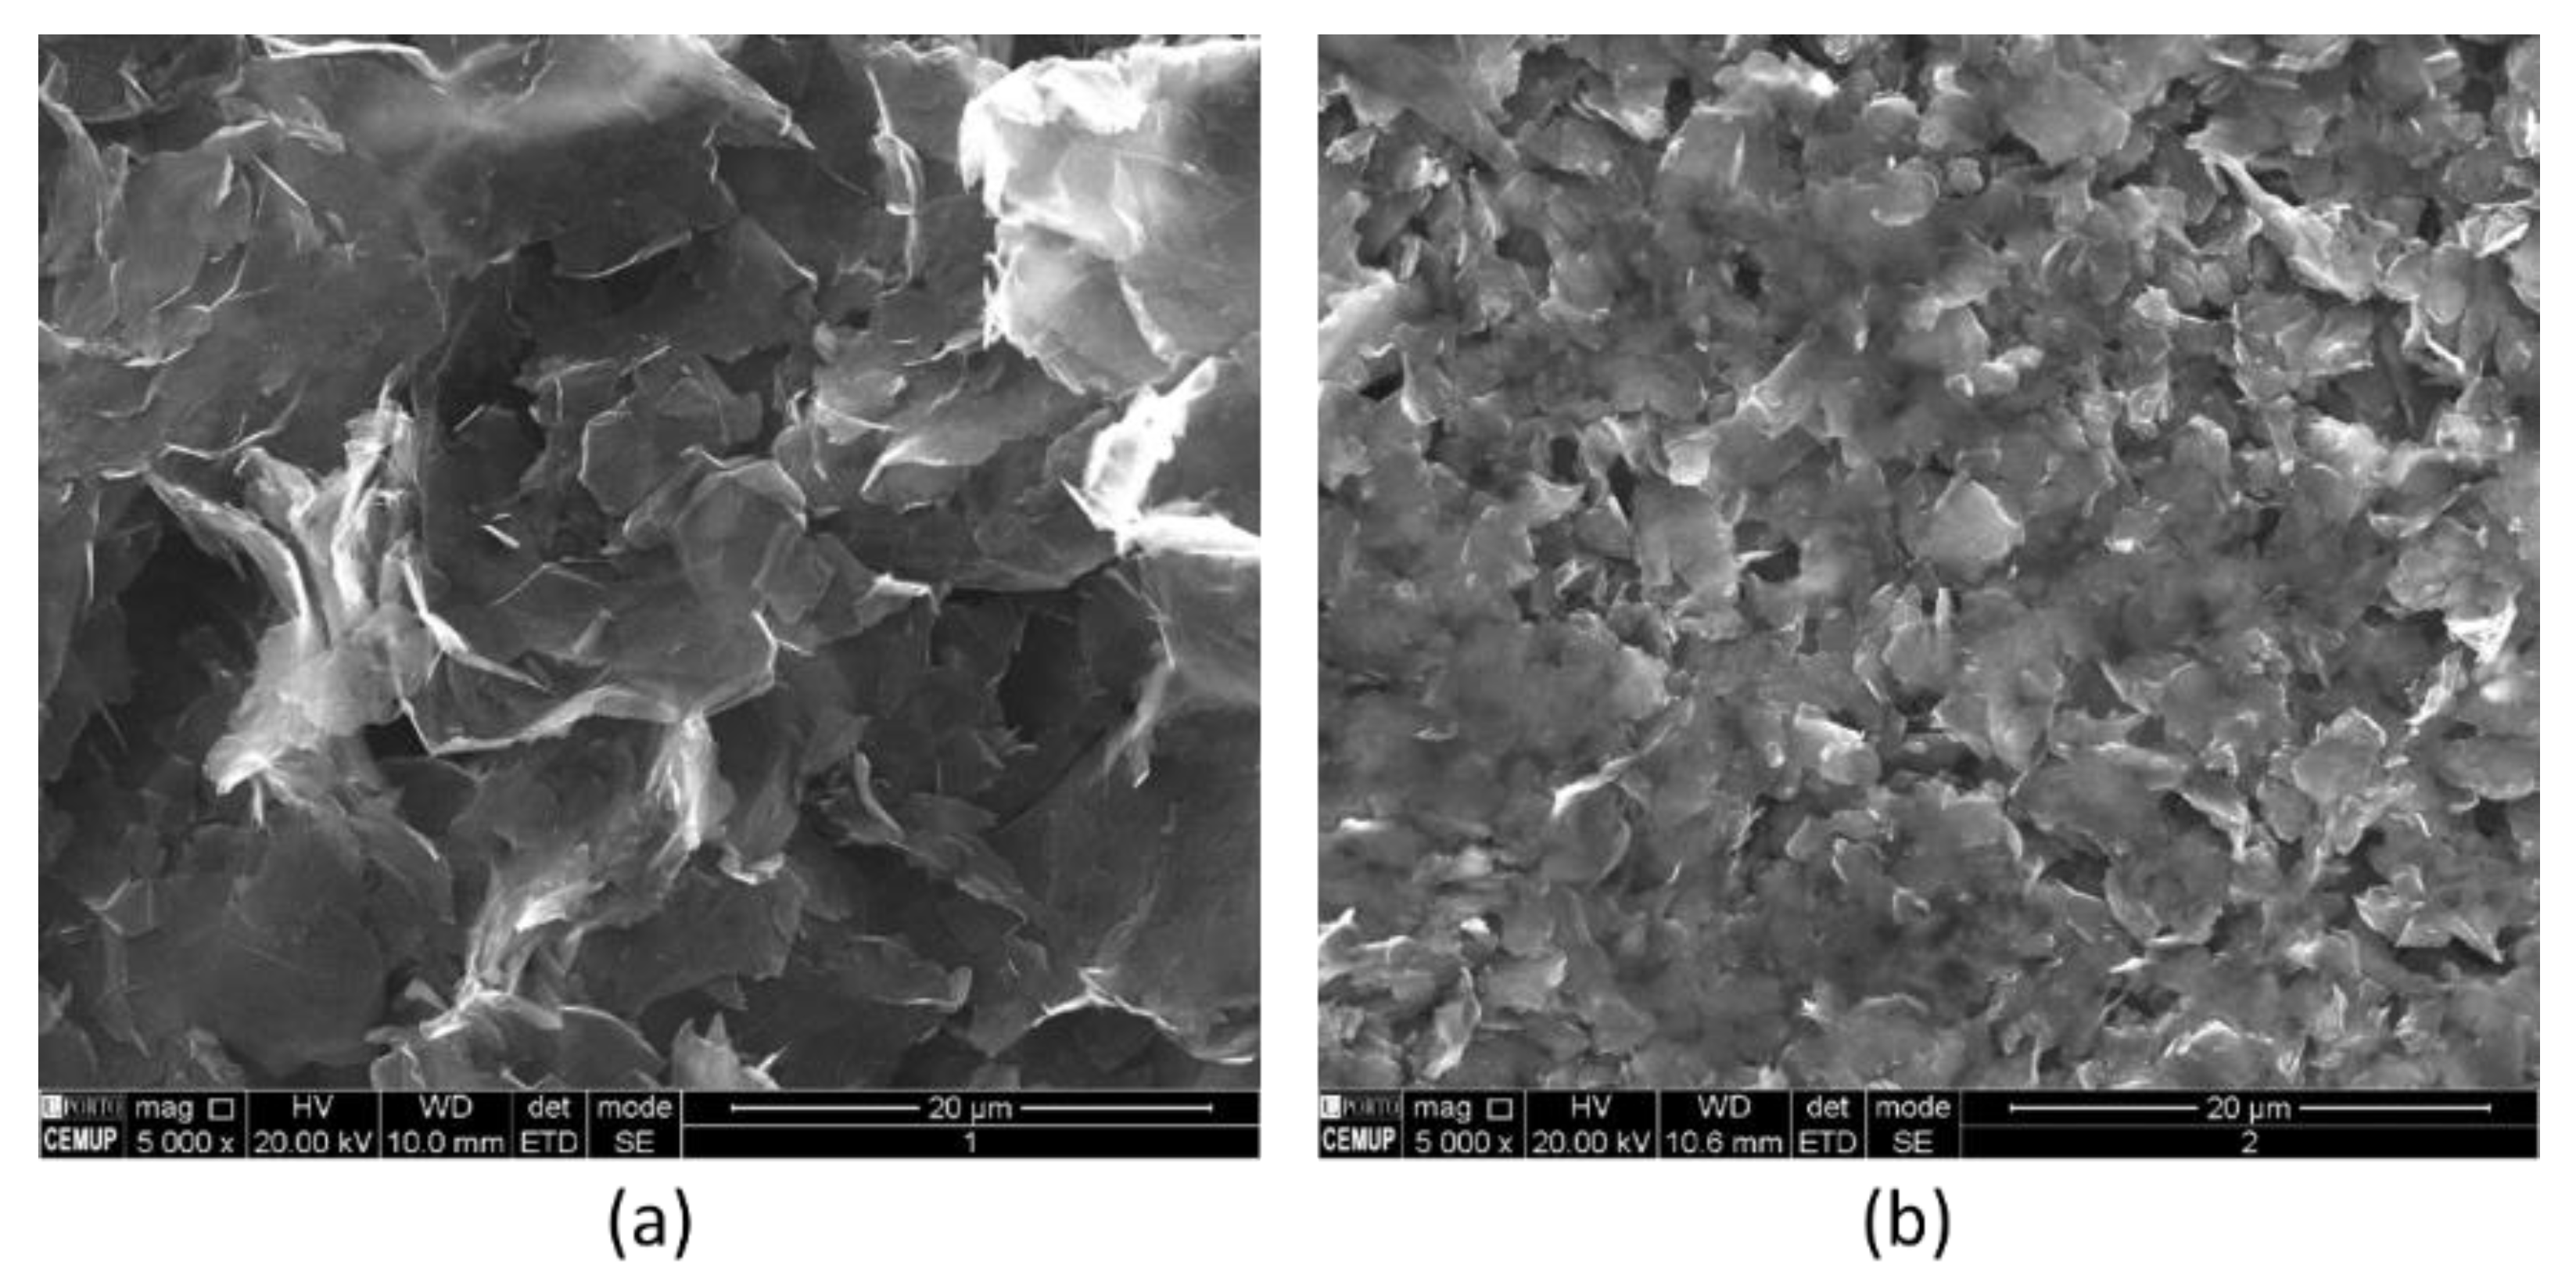
3.2. Carbon Materials Characterization

The characterization of the graphene and graphite carbon materials was accessed by SEM and BET analysis. SEM images, presented in Figure 2, present well-defined graphene sheets (a) and the disorganized graphite (b). In Figure 2a, a slight wrinkled and transparent structure is visible, which is typically observed in graphene sheets, and can be a result of the deformation that occurred during the exfoliation process [51]. On the other hand, the difference reported in Figure 2b, wherein graphite is presented, is not visible in the well-defined flakes described as in graphene.
The results estimated from the BET analysis are presented in Table 3, and it shows a specific surface area of 45.14 m2 g−1 for graphene and 10.74 m2 g−1 for graphite. The determination of the pore volume was also accessed, showing a value of 0.00461 cm3 g−1 for graphene, 16 times higher than graphite (0.00028 cm3 g−1). The nitrogen adsorption–desorption isotherms of both graphene and graphite are presented in Figure S1, in Supporting Information (SI). The obtained value for graphene is significantly lower than the theoretical surface area of 2630 m2 g−1 for individual graphene sheets [52]. This discrepancy can be the consequence of a large amount of surface area that is not accessible to the nitrogen adsorption, due to overlapping or/and by the agglomeration of the exfoliated graphene layers, which may result from the van der Waals interactions occurring between the adjacent graphene sheets [52,53].

3.3. Electrochemical Characterization

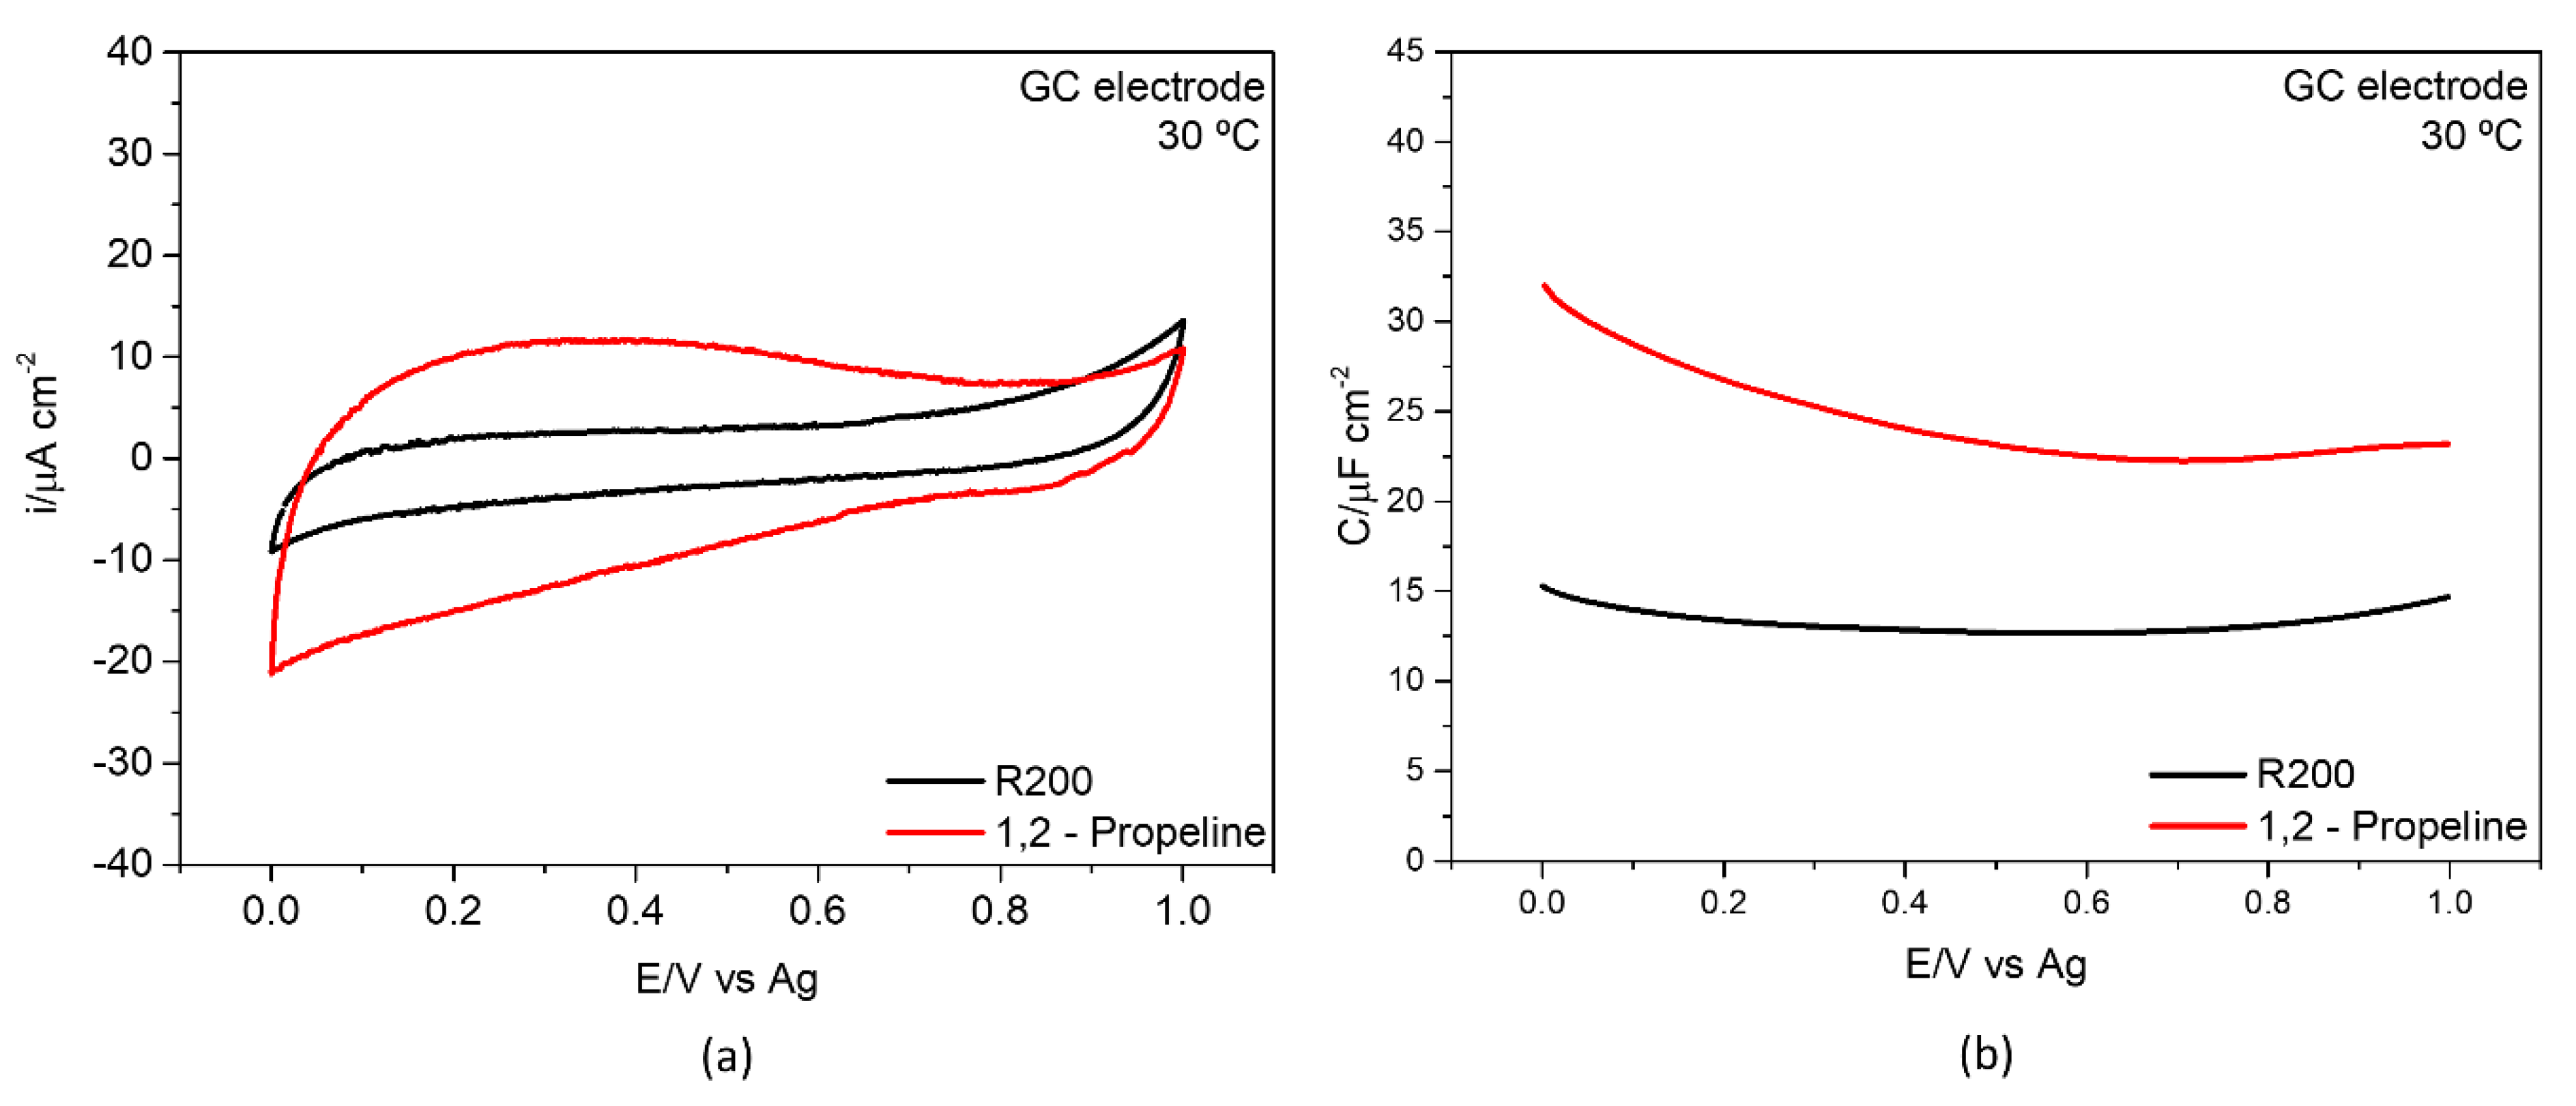
3.3.1. Glassy Carbon/DES Interface

In the case of DES, the potential window is dependent on the potential at which the cation goes through reduction and the anion goes through oxidation. The electrochemical potential window of the DESs prepared in this work have been defined between 0 V and 1 V. Figure 3 presents the cyclic voltammetry (a) and differential capacitance curve (b) in the bare GC/DES interface, without the presence of the carbon allotrope materials.
From the analysis of Figure 3, the CVs measured at the electrode/DES interface show that keeping the same electrochemical window and temperature, the current intensity is dependent on the nature of the HBD, presenting a higher cathodic current for 1,2-propeline. The anodic current does not present a significant change for both DES.
The differential capacitance curves (Figure 3b) as a function of the applied potential can give information regarding the structural changes in the EDL structure. In typical ionic liquids, the electrode/ILs interface presents various shapes, where these differences can be explained due to the influence of the ionic nature of the ions present in the IL [30,39,54,55]. Regarding DES, there is still a large lack of knowledge regarding the relationship between the DES composition, electrode surface, electrode’s coating, and temperature on the shape of the capacitance curves [27,56]. The results displayed in Figure 3b show flattened and asymmetric U-shape curves, revealing a reduced sensitivity to the electrode potential, with 1,2-propeline system presenting higher capacitance, when compared to the R200 eutectic mixture. Figueiredo et al. [27] present a similar capacitance curve shape in GC/glyceline interface, in the [0 V, 0.8 V] interval, however, presents lower capacitance values compared to the results obtained in this work, which may be attributed to the viscosity of the eutectic mixture, since glyceline presents higher values (423 cP at 25 °C [57]).
Salomé et al. [48] studied the effect of the viscosity of the same DES studied in this work and showed that 1,2-propeline presents a viscosity value of 20 cP, and R200 shows a viscosity that is around eight times higher (167 cP) at 75 °C. The viscosity of the DES studied in this work is presented in Table 2, for temperatures ranging from 30 °C to 60 °C, showing similar values when compared with those reported in the literature [43].

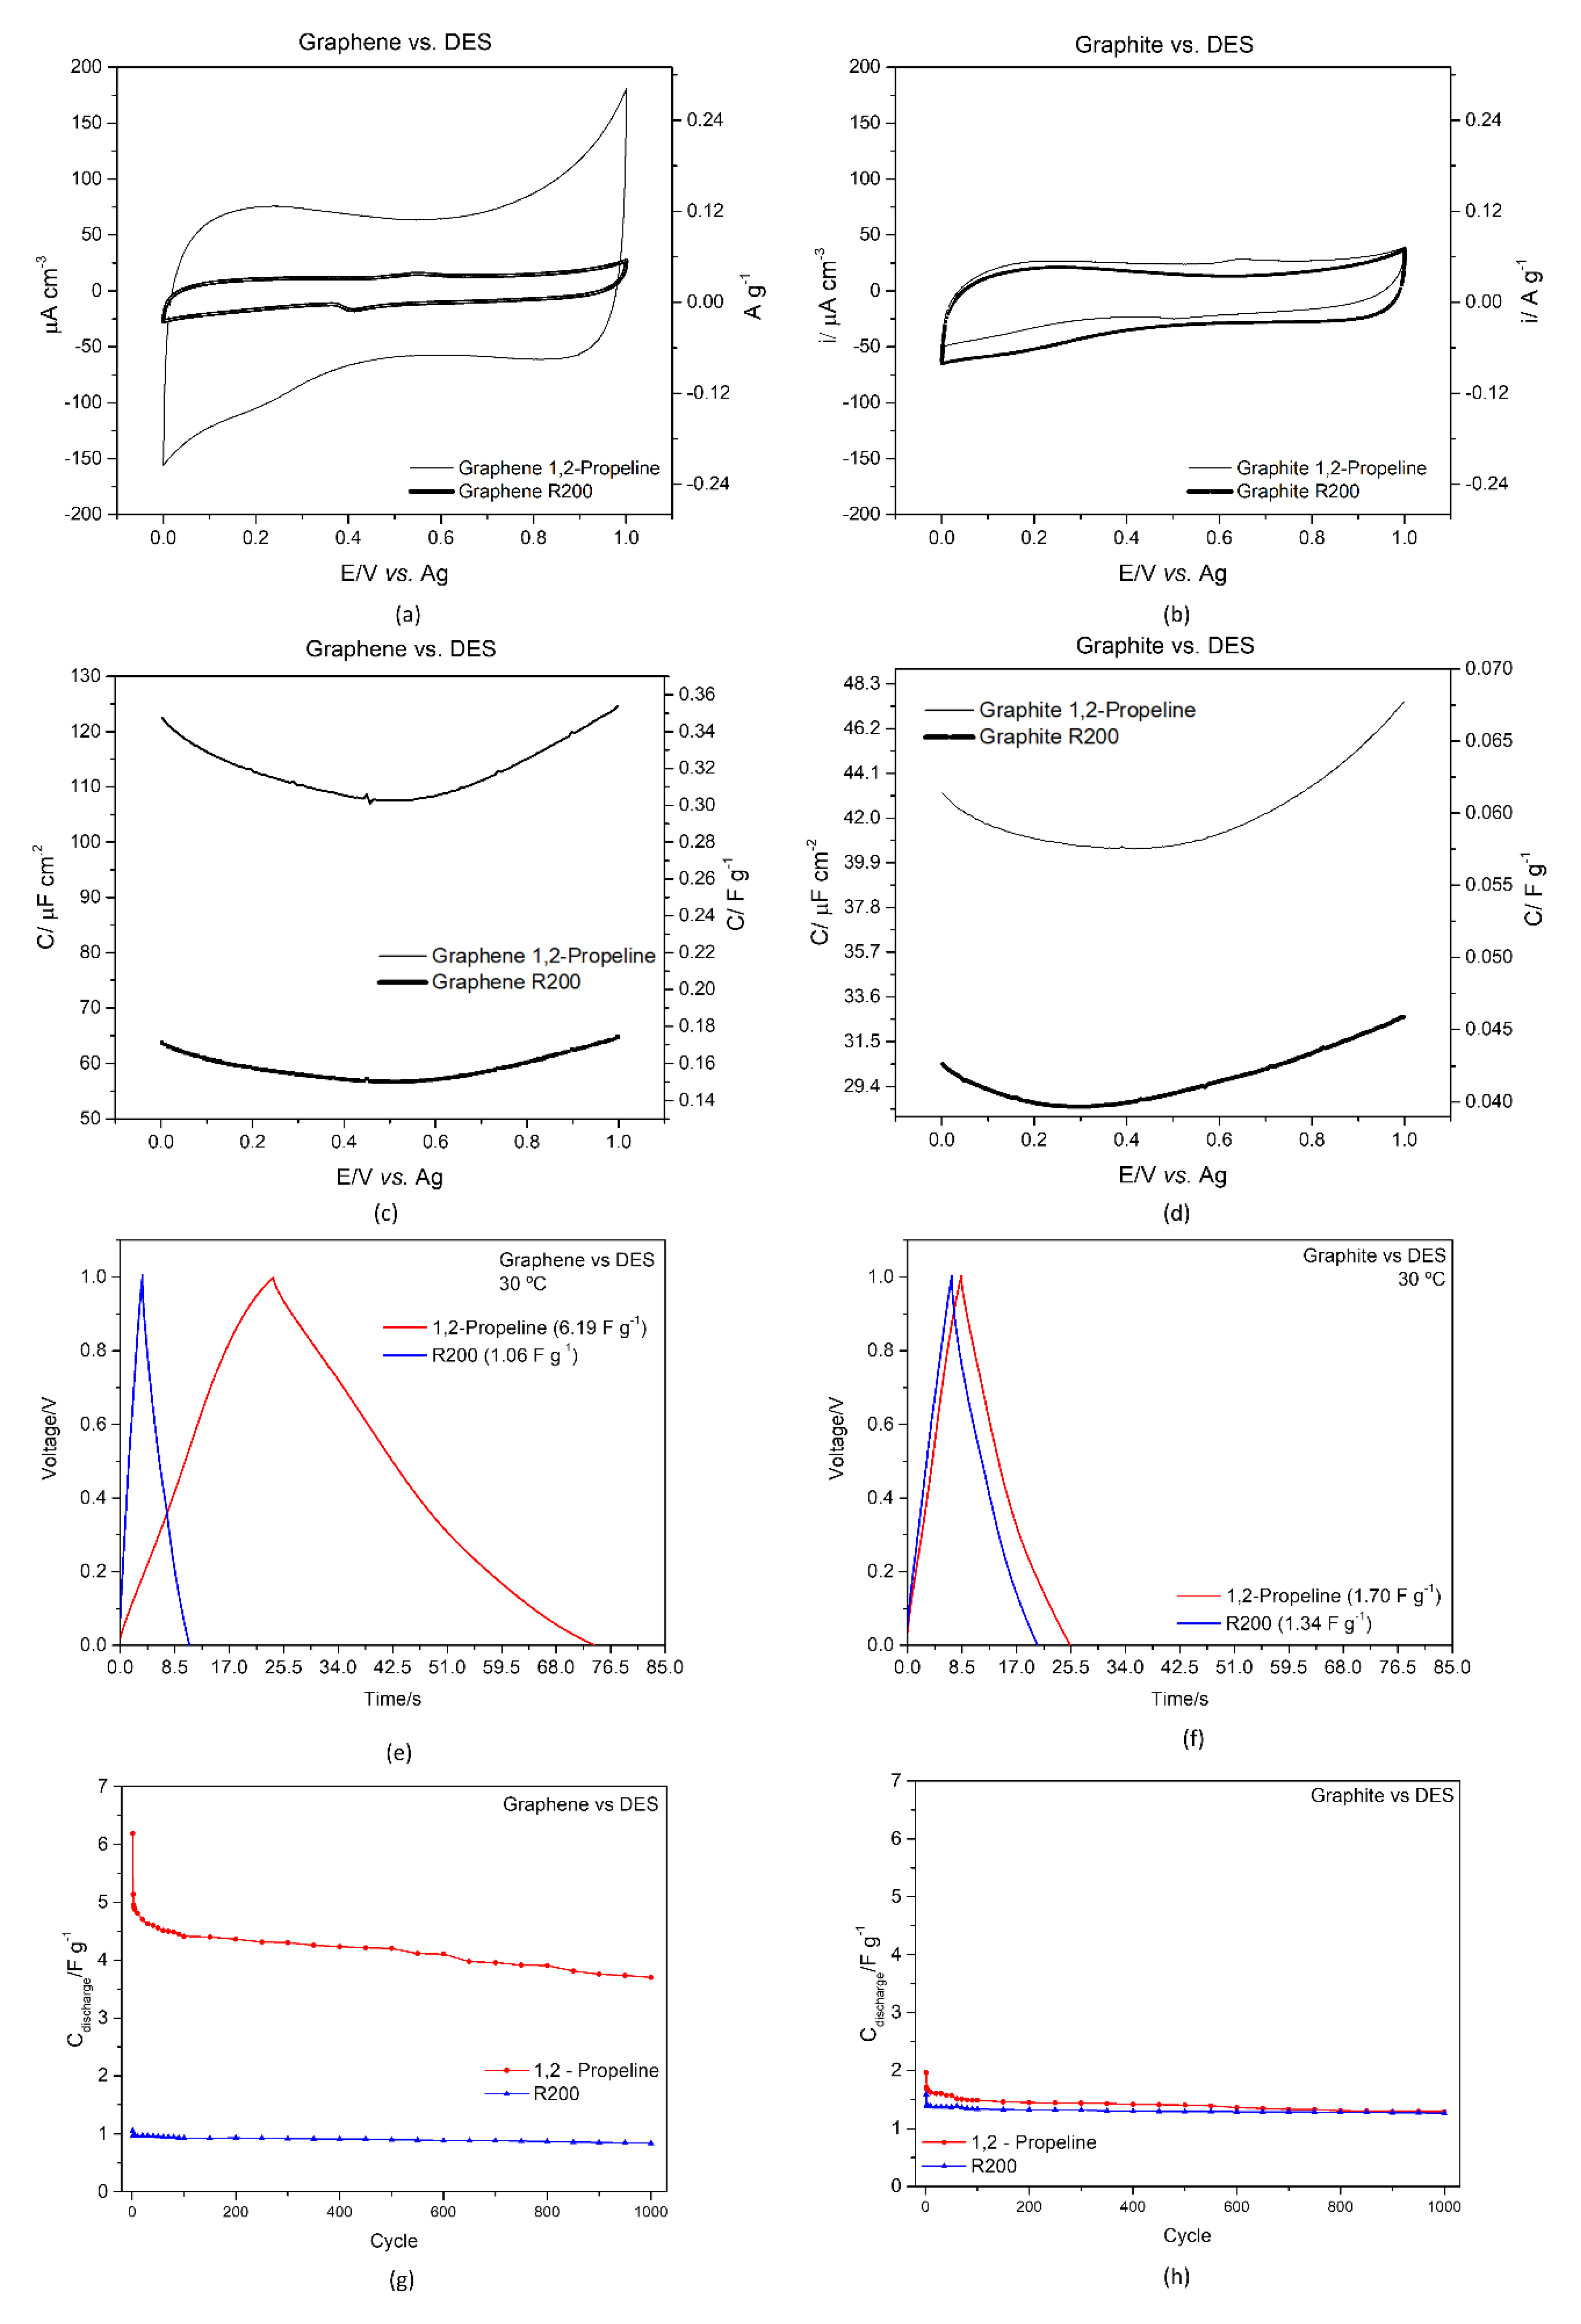
3.3.2. Graphene and Graphite/ DES Interface

A systematic study was carried out using a three-electrode electrochemical cell and a working electrode modified with commercial graphene, and commercial graphite. Figure 4 presents the electrochemical study (cyclic voltammetry, EIS, and charge–discharge) for the graphene and graphite/DES interface, comparing both studied HBDs. The extensive study of commercial graphene and graphite on both DES is presented in SI (Figures S2–S5)). The capacitance values obtained for the different temperatures, 30 °C to 60 °C, shows an increase with increase in temperature. These results are strictly associated with the decrease in viscosity and increase in conductivity with increase in temperature, as presented in Table 2. Several authors presented the same conclusions [58,59,60,61]. On the other hand, Galek et al. [62], recently concluded that increase in the electrolyte viscosity does not significantly reduce the mobility of the ions (conductivity). However, the increased viscosity of the electrolyte reduces the wettability phenomenon, which is a main concern in terms of energy storage applications.
From the analysis of Figure 4, it is clear that the presence of both carbon materials enhances the electrochemical performance of the GC electrode, namely an increase in the capacitance of the charging/discharging process. Furthermore, the HBDs strongly affect the capacitance retention of the carbon materials’ composite electrodes, which impact is more noticeable for graphene composite electrodes.
Figure 4a,b presents the cyclic voltammetry of graphene and graphite, with both scales of the current in µF cm−2 and in A g−1, to be able to observe the increase in current when compared to the bare GC electrode. Taking into consideration the results obtained with the bare GC electrode, there is an increase up to 8 x and 2 x, when the interface is constituted by graphene/1,2-Propeline and graphene/R200, respectively. The increase is not so intensively verified when graphite is being used as carbon composite electrode. The cyclic voltammetry represented in Figure 4a,b show that 1,2-propeline presents the highest anodic and cathodic currents, in contact with graphene. 1,2-propeline presents an increased rectangular shape in the cyclic voltammetric profile, showing an increase in the ideal capacitance behavior, when compared to R200. R200 electrolyte presents a small redox peak around +0.40 V and +0.60 V, for graphene and graphite materials, respectively, which is not observed in the bulk eutectic mixture (Figure 3a). A possible explanation for the existence of this redox peak may be associated with this liquid’s pseudocapacitance contribution to the overall capacitance [63] or the presence of small amounts of impurities. According to the scan rate study performed for both graphene and graphite/R200 interface (Tables S2 and S4, in supporting information), it is possible to observe that at 5 mV s−1, the peak is not visible, but only up to 10 mV s−1. The same cannot be said regarding graphite/R200 interface, presenting the peak regardless of the scan rate. With the increase in scan rate there is a shift of the peak potential towards anodic potentials.
Figure 4c,d presents the differential capacitance curves for both graphene and graphite, respectively. Taking into consideration the differential capacitance values of the bare GC electrode, there is an increase up to 4 times when adding graphene, and up to 2 times when adding graphite, both in 1,2-propeline and R200 electrolytes. Sillars et al. [64] concluded that for highest capacitance the lowest viscosity and smallest ion size should be achieved.
From the assessment of Figure 4e,f, it is possible to determine the ohmic drop values (IR), from the galvanostatic charge-discharge graphs. Table 4 shows the electrochemical results (specific capacitance, capacitance retention and IR drop) of graphene and graphite in both eutectic mixtures, at 30 °C. The ohmic drop (IR) is strongly affected by the conductivity and viscosity of the electrolytes, thus R200 presents the highest variation, as noticed in Figure S6 and Table S1, in SI. Comparing the two studied carbons, graphite presents the highest IR variation, showing that the micropore structure presents a great effect on the electrochemical performance [65].
Figure 4g,h present the capacitance for both graphene and graphite estimated by considering 1000 cycles in both DES. The capacitance retention after 1000 cycles is ~80% in R200 for both graphene and graphite, followed by 60% in graphene/1,2-propeline and 65% in graphite/1,2-propeline. The highest capacitance retention is reported for the R200 electrolyte in both carbon allotrope materials (30 °C). A possible explanation may be offered based on the higher viscosity presented by the R200 eutectic mixture, which may promote a lower deterioration of the carbon composite film established on the bare electrode’s surface, for a three-electrode system.
Tables S2 and S3, in SI, present the temperature effect on capacitance for graphene and graphite, in both DES, in the 1st and 1000th cycles, respectively. For all systems there is an increase in capacitance with an increase in temperature and a decrease in capacitance from the 1st cycle to the 1000th cycle.
Brandão et al. [24] reported similar electrochemical studies for both commercial graphene and graphite composite electrodes, using ethaline as electrolyte, at 30 °C. The CV and gravimetric capacitance−potential curves reported in the previous study, present comparable behavior as described in Figure 4; in particular, the rectangular shape associated to the CV and U-shape of the gravimetric capacitance−potential curves in both carbon materials and electrolytes. The specific capacitance for ethaline presented a value of 5.45 ± 0.96 F g−1 (capacitance retention ~70% after 1000 cycles) and 4.27 ± 0.85 F g−1 (capacitance retention ~66% after 1000 cycles), for graphene and graphite, respectively [24]. Taking these results into consideration, 1,2-propeline presents slightly higher capacitance for graphene compared to ethaline, with both eutectic mixtures presenting similar values of viscosity at 30 °C (a slightly higher value for 1,2-propeline, 71.1 mPa s, against 64.3 mPa S for ethaline [24]).
The size/length of the HBD molecule considered for the electrolytes formulation (ethylene glycol molecule is ~0.36 nm [66], which is smaller than the 1,2-propylene glycol (~0.45 nm) and urea (~0.41 nm) molecules as noticed in the dimensions of HBD represented in Figure 1). The SBET and pore volume of the carbon materials can be strictly correlated with the specific capacitance estimated at the electrode/electrolyte interfaces. This may be one of the reasons for the decrease in the capacitance measured at commercial graphene/ethaline interface, compared to 1,2-propeline-based DES [24]. Similar behavior is not observed for commercial graphite/ethaline interface, thus presenting 4× higher capacitance, compared to commercial graphite/1,2-propeline interface.
The length of the HBD 1,2-propylene glycol molecule is slightly larger than urea, followed by ethylene glycol, creating in the 1,2-propylene glycol a more organized carbon/DES interface. This may result from the decrease of the “free-space” established between the ions of the electrolyte that occupy the active surface area of the carbon material on the electrode surface, leading, consequently, to an increase in the capacitance measured at commercial graphene/1,2-propeline electrolyte interface. The lower values of SBET and pore volume of commercial graphite, allows ethaline (which presents the smallest HBD molecules) to present higher capacitance when compared to 1,2-propeline, and consequently R200 electrolyte.
It is known that the size of electrolyte ions is correlated with the match of the carbon allotrope pore size, i.e., carbon materials with bigger pore size require bulkier electrolyte ions for optimizing the ion–pore match [67]. The higher capacitance obtained for graphene over graphite, in all electrolytes, may be due to the overlapping and agglomeration of graphite layers, not allowing the electrolyte to fill all the pores present on the carbon surface [52]. For this assumption, it is necessary to always take into consideration the contribution of the electrode nature and the electrolyte composition.
The correlation established between the electrochemical performance and the electrolyte composition also needs to address the relevant contribution of the physicochemical parameter of the electrolyte (e.g., viscosity, wettability). This assumption finds support in the results obtained for the commercial graphene immersed in R200. The viscosity obtained for R200 is 4.92× higher than the viscosity obtained for 1,2-propeline, thus resulting in the decrease of the electrochemical performance of 5.83×. This correlation is strictly dependent on the carbon composite electrode since this trend was not established in the commercial graphite composite electrode, highlighting that other properties, such as wettability, should contribute to the overall performance of the electrochemical interface.

4. Conclusions

In this work, it was demonstrated that the electrolyte can be a key factor for the optimization of the electrochemical performance of the carbon materials’ composite electrodes. The analysis of two carbon materials, graphene and graphite (from commercial sources, without any treatment), with a surface area of 45.15 and 10.74 m2 g−1 and average pore size of 0.9049 and 0.9251 nm, respectively, was performed. By comparison to the bare glassy carbon electrode, it was shown that the nature of the studied carbons critically impacts the electrochemical behavior of the electrode/DES interface. 1,2-propeline eutectic mixture presents higher specific capacitance in both graphene and graphite, with lower IR drop. Improved capacitance retention (after 1000 cycles) was achieved when using urea eutectic mixtures. This result is in-line with previous results reported by the authors for the use of ethylene glycol-based DES (ethaline) and seems to reflect the important role of -OH groups of the glycol moiety, when compared with the amine or carbonyl groups in urea, to the storage of surface charges.
This study showed that, although electrochemical performance of graphite composite electrodes is inferior to that of graphene equivalents, both graphene and graphite materials present merit to be used as electrode materials for the application in energy storage devices. Focus solely on the electrode material can be counterproductive since we clearly demonstrate here that the nature of the electrolyte has an important role on the specific capacitance and capacitance retention of the electrochemical devices. Therefore further studies have to be made, since existing studies only have explored a reduced number of DES systems, and from the existing data it is not possible to infer the role of the DES’s functional groups or if/which physicochemical property of the DES is responsible for the capacitance enhancement.
Further, the modification and increase of surface area of the studied carbon materials may also be a new route to obtain higher capacitance systems. It is also important to start testing the performance of composite nanostructured electrodes/DES using coin-cell setup since new challenges will have to be overcome and is the natural step to prove the value of the proposed electrochemical systems.

Supplementary Materials

The following supporting information can be downloaded at: https://www.mdpi.com/article/10.3390/electrochem3010009/s1, Figure S1: Nitrogen adsorption–desorption isotherms of commercial graphene (a) and commercial graphite obtained at 77.3 K; Figure S2: Electrochemical testing of graphene in R200 electrolyte at 30 °C. (a) galvanostatic charge–discharge curves recorded with current density 1, 2 and 4 A g−1. (b) CV curves recorded at scan rates 5, 10, 20, 50, 100 and 200 mV s−1, temperature effect at 30, 40, 50 and 60 °C: (c) cyclic voltammetry; (d) capacitance–potential curve; (e) discharge gravimetric capacitance for 1000 cycles; (f) capacitance retention; Figure S3: Electrochemical testing of graphene in 1,2-propeline electrolyte at 30 °C. (a) galvanostatic charge–discharge curves recorded with current density 1, 2 and 4 A g−1. (b) CV curves recorded at scan rates 5, 10, 20, 50, 100 and 200 mV s−1, temperature effect at 30, 40, 50 and 60 °C: (c) cyclic voltammetry; (d) capacitance –potential curve; (e) discharge gravimetric capacitance for 1000 cycles; (f) capacitance retention; Figure S4: Electrochemical testing of graphite in R200 electrolyte at 30 °C. (a) galvanostatic charge–discharge curves recorded with current density 1, 2 and 4 A g−1. (b) CV curves recorded at scan rates 5, 10, 20, 50, 100 and 200 mV s−1, temperature effect at 30, 40, 50 and 60 °C: (c) cyclic voltammetry; (d) capacitance–potential curve; (e) discharge gravimetric capacitance for 1000 cycles; (f) capacitance retention; Figure S5: Electrochemical testing of graphite in 1,2-propeline electrolyte at 30 °C. (a) galvanostatic charge–discharge curves recorded with current density 1, 2 and 4 A g−1. (b) CV curves recorded at scan rates 5, 10, 20, 50, 100 and 200 mV s−1, temperature effect at 30, 40, 50 and 60 °C: (c) cyclic voltammetry; (d) capacitance–potential curve; (e) discharge gravimetric capacitance for 1000 cycles; (f) capacitance retention; Figure S6: IR drop for both carbon materials and eutectic mixtures at temperatures between 30 and 60 °C; Table S1: Temperature effect on IR drop for graphene and graphite in both eutectic mixtures, at 1 A g−1; Table S2: Temperature effect on capacitance (1st cycle) for graphene and graphite in both eutectic mixtures; Table S3: Temperature effect on capacitance (1000th cycle) for graphene and graphite in both eutectic mixtures.

Author Contributions

Conceptualization, A.T.S.C.B. and C.M.P.; methodology, A.T.S.C.B., R.C. and C.M.P.; formal analysis, A.T.S.C.B. and C.M.P.; investigation, A.T.S.C.B. and C.M.P.; writing—original draft, A.T.S.C.B. and C.M.P.; writing—review and editing, A.T.S.C.B., R.C. and C.M.P.; supervision, A.F.S. and C.M.P.; resources, C.M.P.; funding acquisition, C.M.P. All authors have read and agreed to the published version of the manuscript.

Funding

This work was financially supported by the FCT under Research Grant UIDB/00081/2020–CIQUP and IL4Energy project (02/SAICT/2017−NORTE−01−0145−FEDER−032294) funded by FCT and the European Funds for regional development (FEDER) through the operational program of competitiveness and internationalization with reference POCI−01−0145−FEDER−032294). Ana Brandão thanks SCANSCI—equipamentos de laboratório for the financial support given to the PhD program and the scholarship awarded by FCT with reference 2021.04783.BD. Renata Costa thanks FCT for funding through program DL 57/2016–Norma transitória (SFRH/BPD/89752/2012).

Institutional Review Board Statement

Not applicable.

Informed Consent Statement

Not applicable.

Data Availability Statement

Not applicable.

Acknowledgments

The authors would like to thank the COST Action CA15107–MULTICOMP (Multi−Functional Nano−Carbon Composite Materials Network).

Conflicts of Interest

The authors declare no conflict of interest.

References

  1. Ratajczak, P.; Suss, M.E.; Kaasik, F.; Béguin, F. Carbon electrodes for capacitive technologies. Energy Storage Mater. 2019, 16, 126–145. [Google Scholar] [CrossRef]
  2. Pareek, A.; Shanthi Sravan, J.; Venkata Mohan, S. Exploring chemically reduced graphene oxide electrode for power generation in microbial fuel cell. Mater. Sci. Energy Technol. 2019, 2, 600–606. [Google Scholar] [CrossRef]
  3. Shin, D.; Lee, K.; Chang, N. Fuel economy analysis of fuel cell and supercapacitor hybrid systems. Int. J. Hydrog. Energy 2016, 41, 1381–1390. [Google Scholar] [CrossRef]
  4. Iqbal, M.Z.; Siddique, S.; Khan, A.; Haider, S.S.; Khalid, M. Recent developments in graphene based novel structures for efficient and durable fuel cells. Mater. Res. Bull. 2019, 122, 110674. [Google Scholar] [CrossRef]
  5. Iro, Z.S.; Subramani, C.; Dash, S.S. A brief review on electrode materials for supercapacitor. Int. J. Electrochem. Sci. 2016, 11, 10628–10643. [Google Scholar] [CrossRef]
  6. Eftekhari, A. On the mechanism of microporous carbon supercapacitors. Mater. Today Chem. 2018, 7, 1–4. [Google Scholar] [CrossRef]
  7. Yang, Z.; Tian, J.; Yin, Z.; Cui, C.; Qian, W.; Wei, F. Carbon nanotube- and graphene-based nanomaterials and applications in high-voltage supercapacitor: A review. Carbon N. Y. 2019, 141, 467–480. [Google Scholar] [CrossRef]
  8. Ge, J.; Zhang, Y.; Heo, Y.-J.; Park, S.-J. Advanced Design and Synthesis of Composite Photocatalysts for the Remediation of Wastewater: A Review. Catalysts 2019, 9, 122. [Google Scholar] [CrossRef] [Green Version]
  9. Laskar, M.A.; Siddiqui, S. Chapter 12-Nanomaterials—Based on graphene oxide and its derivatives—For separation and preconcentration of metal ions. In Micro and Nano Technologies, Graphene-Based Nanotechnologies for Energy and Environmental Applications; Jawaid, M., Ahmad, A., Lokhat, D., Eds.; Elsevier: Durban, South Africa, 2019; pp. 205–219. ISBN 978-0-12-815811-1. [Google Scholar]
  10. Centeno, T.A.; Hahn, M.; Fernández, J.A.; Kötz, R.; Stoeckli, F. Correlation between capacitances of porous carbons in acidic and aprotic EDLC electrolytes. Electrochem. Commun. 2007, 9, 1242–1246. [Google Scholar] [CrossRef] [Green Version]
  11. Paek, E.; Pak, A.J.; Hwang, G.S. A Computational Study of the Interfacial Structure and Capacitance of Graphene in [BMIM][PF6] Ionic Liquid. J. Electrochem. Soc. 2012, 160, A1–A10. [Google Scholar] [CrossRef] [Green Version]
  12. Uysal, A.; Zhou, H.; Feng, G.; Lee, S.S.; Li, S.; Fenter, P.; Cummings, P.T.; Fulvio, P.F.; Dai, S.; McDonough, J.K.; et al. Structural Origins of Potential Dependent Hysteresis at the Electrified Graphene/Ionic Liquid Interface. J. Phys. Chem. C 2014, 118, 569–574. [Google Scholar] [CrossRef]
  13. Oll, O.; Romann, T.; Lust, E. An infrared study of the few-layer graphene | ionic liquid interface: Reintroduction of in situ electroreflectance spectroscopy. Electrochem. Commun. 2014, 46, 22–25. [Google Scholar] [CrossRef]
  14. Méndez-Morales, T.; Carrete, J.; Pérez-Rodríguez, M.; Cabeza, Ó.; Gallego, L.J.; Lynden-Bell, R.M.; Varela, L.M. Molecular dynamics simulations of the structure of the graphene–ionic liquid/alkali salt mixtures interface. Phys. Chem. Chem. Phys. 2014, 16, 13271–13278. [Google Scholar] [CrossRef] [PubMed] [Green Version]
  15. Ivaništšev, V.; Fedorov, M.V.; Lynden-Bell, R.M. Screening of Ion–Graphene Electrode Interactions by Ionic Liquids: The Effects of Liquid Structure. J. Phys. Chem. C 2014, 118, 5841–5847. [Google Scholar] [CrossRef]
  16. Paek, E.; Pak, A.J.; Hwang, G.S. On the influence of polarization effects in predicting the interfacial structure and capacitance of graphene-like electrodes in ionic liquids. J. Chem. Phys. 2015, 142, 24701. [Google Scholar] [CrossRef]
  17. Begić, S.; Jónsson, E.; Chen, F.; Forsyth, M. Molecular dynamics simulations of pyrrolidinium and imidazolium ionic liquids at graphene interfaces. Phys. Chem. Chem. Phys. 2017, 19, 30010–30020. [Google Scholar] [CrossRef]
  18. Williams, C.D.; Dix, J.; Troisi, A.; Carbone, P. Effective Polarization in Pairwise Potentials at the Graphene–Electrolyte Interface. J. Phys. Chem. Lett. 2017, 8, 703–708. [Google Scholar] [CrossRef]
  19. Shen, Y.; He, X.; Hung, F.R. Structural and Dynamical Properties of a Deep Eutectic Solvent Confined Inside a Slit Pore. J. Phys. Chem. C 2015, 119, 24489–24500. [Google Scholar] [CrossRef]
  20. Kaur, S.; Sharma, S.; Kashyap, H.K. Bulk and interfacial structures of reline deep eutectic solvent: A molecular dynamics study. J. Chem. Phys. 2017, 147, 194507. [Google Scholar] [CrossRef]
  21. Atilhan, M.; Costa, L.T.; Aparicio, S. Elucidating the Properties of Graphene–Deep Eutectic Solvents Interface. Langmuir 2017, 33, 5154–5165. [Google Scholar] [CrossRef]
  22. Chen, Z.; McLean, B.; Ludwig, M.; Stefanovic, R.; Warr, G.G.; Webber, G.B.; Page, A.J.; Atkin, R. Nanostructure of Deep Eutectic Solvents at Graphite Electrode Interfaces as a Function of Potential. J. Phys. Chem. C 2016, 120, 2225–2233. [Google Scholar] [CrossRef]
  23. Fuchs, D.; Bayer, B.C.; Gupta, T.; Szabo, G.L.; Wilhelm, R.A.; Eder, D.; Meyer, J.C.; Steiner, S.; Gollas, B. Electrochemical Behavior of Graphene in a Deep Eutectic Solvent. ACS Appl. Mater. Interfaces 2020, 12, 40937–40948. [Google Scholar] [CrossRef] [PubMed]
  24. Brandão, A.T.S.C.; Costa, R.; Silva, A.F.; Pereira, C.M. Sustainable Preparation of Nanoporous Carbons via Dry Ball Milling: Electrochemical Studies Using Nanocarbon Composite Electrodes and a Deep Eutectic Solvent as Electrolyte. Nanomaterials 2021, 11, 3258. [Google Scholar] [CrossRef] [PubMed]
  25. Bard, A.J.; Faulkner, L.R. Electrochemical Methods: Fundamentals and Applications, 2nd ed.; John Wiley & Sons, Inc.: New York, NY, USA, 2001; ISBN 978-0-471-04372-0. [Google Scholar]
  26. Costa, R.; Pereira, C.M.; Silva, A.F. Charge storage on ionic liquid electric double layer: The role of the electrode material. Electrochim. Acta 2015, 167, 421–428. [Google Scholar] [CrossRef]
  27. Figueiredo, M.; Gomes, C.; Costa, R.; Martins, A.; Pereira, C.M.; Silva, F. Differential capacity of a deep eutectic solvent based on choline chloride and glycerol on solid electrodes. Electrochim. Acta 2009, 54, 2630–2634. [Google Scholar] [CrossRef]
  28. Dean, W.; Klein, J.; Gurkan, B. Do Deep Eutectic Solvents Behave Like Ionic Liquid Electrolytes? A Perspective from the Electrode-Electrolyte Interface. J. Electrochem. Soc. 2021, 168, 026503. [Google Scholar] [CrossRef]
  29. Wu, J.; Liu, S.; Tan, Z.; Guo, Y.; Zhou, J.-Z.; Mao, B.; Yan, J. Effect of Hydrogen Bond Donor Molecules Ethylene Glycerol and Lactic Acid on Electrochemical Interfaces in Choline Chloride Based-Deep Eutectic Solvents. J. Chem. Phys. 2021, 155, 244702. [Google Scholar] [CrossRef]
  30. Costa, R.; Pereira, C.M.; Silva, A.F. Insight on the effect of surface modification by carbon materials on the Ionic Liquid Electric Double Layer Charge Storage properties. Electrochim. Acta 2015, 176, 880–886. [Google Scholar] [CrossRef]
  31. Yan, J.; Wang, Q.; Wei, T.; Fan, Z. Recent Advances in Design and Fabrication of Electrochemical Supercapacitors with High Energy Densities. Adv. Energy Mater. 2014, 4, 1300816. [Google Scholar] [CrossRef]
  32. Pandolfo, A.G.; Hollenkamp, A.F. Carbon properties and their role in supercapacitors. J. Power Sources 2006, 157, 11–27. [Google Scholar] [CrossRef]
  33. Qu, D.; Shi, H. Studies of activated carbons used in double-layer capacitors. J. Power Sources 1998, 74, 99–107. [Google Scholar] [CrossRef]
  34. Shi, H. Activated carbons and double layer capacitance. Electrochim. Acta 1996, 41, 1633–1639. [Google Scholar] [CrossRef]
  35. Raymundo-Piñero, E.; Kierzek, K.; Machnikowski, J.; Béguin, F. Relationship between the nanoporous texture of activated carbons and their capacitance properties in different electrolytes. Carbon N. Y. 2006, 44, 2498–2507. [Google Scholar] [CrossRef]
  36. Pohlmann, S.; Lobato, B.; Centeno, T.A.; Balducci, A. The influence of pore size and surface area of activated carbons on the performance of ionic liquid based supercapacitors. Phys. Chem. Chem. Phys. 2013, 15, 17287–17294. [Google Scholar] [CrossRef] [Green Version]
  37. Salomé, S.; Pereira, N.M.; Ferreira, E.S.; Pereira, C.M.; Silva, A.F. Tin electrodeposition from choline chloride based solvent: Influence of the hydrogen bond donors. J. Electroanal. Chem. 2013, 703, 80–87. [Google Scholar] [CrossRef]
  38. Brandão, A.T.S.C.; Rosoiu, S.; Costa, R.; Lazar, O.A.; Silva, A.F.; Anicai, L.; Pereira, C.M.; Enachescu, M. Characterization and electrochemical studies of MWCNTs decorated with Ag nanoparticles through pulse reversed current electrodeposition using a deep eutectic solvent for energy storage applications. J. Mater. Res. Technol. 2021, 15, 342–359. [Google Scholar] [CrossRef]
  39. Silva, F.; Gomes, C.; Figueiredo, M.; Costa, R.; Martins, A.; Pereira, C.M. The electrical double layer at the [BMIM][PF6] ionic liquid/electrode interface—Effect of temperature on the differential capacitance. J. Electroanal. Chem. 2008, 622, 153–160. [Google Scholar] [CrossRef]
  40. Stoller, M.D.; Ruoff, R.S. Best practice methods for determining an electrode material’s performance for ultracapacitors. Energy Environ. Sci. 2010, 3, 1294–1301. [Google Scholar] [CrossRef]
  41. Protsenko, V.S.; Kityk, A.A.; Shaiderov, D.A.; Danilov, F.I. Effect of water content on physicochemical properties and electrochemical behavior of ionic liquids containing choline chloride, ethylene glycol and hydrated nickel chloride. J. Mol. Liq. 2015, 212, 716–722. [Google Scholar] [CrossRef]
  42. Protsenko, V.S.; Bobrova, L.S.; Danilov, F.I. Physicochemical properties of ionic liquid mixtures containing choline chloride, chromium (III) chloride and water: Effects of temperature and water content. Ionics 2017, 23, 637–643. [Google Scholar] [CrossRef]
  43. Al-Murshedi, A.Y.M.; Alesary, H.F.; Al-Hadrawi, R. Thermophysical properties in deep eutectic solvents with/without water. J. Phys. Conf. Ser. 2019, 1294, 052041. [Google Scholar] [CrossRef]
  44. Gajardo-Parra, N.F.; Cotroneo-Figueroa, V.P.; Aravena, P.; Vesovic, V.; Canales, R.I. Viscosity of Choline Chloride-Based Deep Eutectic Solvents: Experiments and Modeling. J. Chem. Eng. Data 2020, 65, 5581–5592. [Google Scholar] [CrossRef]
  45. Shah, D.; Mjalli, F.S. Effect of water on the thermo-physical properties of Reline: An experimental and molecular simulation based approach. Phys. Chem. Chem. Phys. 2014, 16, 23900–23907. [Google Scholar] [CrossRef] [PubMed]
  46. Brandão, A.T.S.C.; Rosoiu, S.; Costa, R.; Silva, A.F.; Anicai, L.; Enachescu, M.; Pereira, C.M. Characterization of Carbon Nanomaterials Dispersions: Can Metal Decoration of MWCNTs Improve Their Physicochemical Properties? Nanomaterials 2022, 12, 99. [Google Scholar] [CrossRef] [PubMed]
  47. Shahbaz, K.; Mjalli, F.S.; Hashim, M.A.; AlNashef, I.M. Prediction of the surface tension of deep eutectic solvents. Fluid Phase Equilib. 2012, 319, 48–54. [Google Scholar] [CrossRef]
  48. Cotroneo-Figueroa, V.P.; Gajardo-Parra, N.F.; López-Porfiri, P.; Leiva, Á.; Gonzalez-Miquel, M.; Garrido, J.M.; Canales, R.I. Hydrogen bond donor and alcohol chain length effect on the physicochemical properties of choline chloride based deep eutectic solvents mixed with alcohols. J. Mol. Liq. 2022, 345, 116986. [Google Scholar] [CrossRef]
  49. García, G.; Aparicio, S.; Ullah, R.; Atilhan, M. Deep eutectic solvents: Physicochemical properties and gas separation applications. Energy Fuels 2015, 29, 2616–2644. [Google Scholar] [CrossRef]
  50. Shannon, R.D. Revised effective ionic radii and systematic studies of interatomic distances in halides and chalcogenides. Acta Crystallogr. Sect. A 1976, 32, 751–767. [Google Scholar] [CrossRef]
  51. Meyer, J.C.; Geim, A.K.; Katsnelson, M.I.; Novoselov, K.S.; Booth, T.J.; Roth, S. The structure of suspended graphene sheets. Nature 2007, 446, 60–63. [Google Scholar] [CrossRef]
  52. Bourlinos, A.B.; Steriotis, T.A.; Karakassides, M.; Sanakis, Y.; Tzitzios, V.; Trapalis, C.; Kouvelos, E.; Stubos, A. Synthesis, characterization and gas sorption properties of a molecularly-derived graphite oxide-like foam. Carbon N. Y. 2007, 45, 852–857. [Google Scholar] [CrossRef]
  53. Gao, Y.; Ma, D.; Wang, C.; Guan, J.; Bao, X. Reduced graphene oxide as a catalyst for hydrogenation of nitrobenzene at room temperature. Chem. Commun. 2011, 47, 2432–2434. [Google Scholar] [CrossRef] [PubMed]
  54. Costa, R.; Pereira, C.M.; Silva, A.F. Dicationic ionic liquid: Insight in the electrical double layer structure at mercury, glassy carbon and gold surfaces. Electrochim. Acta 2014, 116, 306–313. [Google Scholar] [CrossRef]
  55. Voroshylova, I.V.; Teixeira, F.; Costa, R.; Pereira, C.M.; Cordeiro, M.N.D.S. Interactions in the ionic liquid [EMIM][FAP]: A coupled experimental and computational analysis. Phys. Chem. Chem. Phys. 2015, 2617–2628. [Google Scholar] [CrossRef] [PubMed]
  56. Costa, R.; Figueiredo, M.; Pereira, C.M.; Silva, F. Electrochemical double layer at the interfaces of Hg/choline chloride based solvents. Electrochim. Acta 2010, 55, 8916–8920. [Google Scholar] [CrossRef]
  57. AlOmar, M.K.; Hayyan, M.; Alsaadi, M.A.; Akib, S.; Hayyan, A.; Hashim, M.A. Glycerol-based deep eutectic solvents: Physical properties. J. Mol. Liq. 2016, 215, 98–103. [Google Scholar] [CrossRef]
  58. Lewandowski, A.; Olejniczak, A.; Galinski, M.; Stepniak, I. Performance of carbon–carbon supercapacitors based on organic, aqueous and ionic liquid electrolytes. J. Power Sources 2010, 195, 5814–5819. [Google Scholar] [CrossRef]
  59. Kwon, H.-N.; Jang, S.-J.; Kang, Y.C.; Roh, K.C. The effect of ILs as co-salts in electrolytes for high voltage supercapacitors. Sci. Rep. 2019, 9, 1180. [Google Scholar] [CrossRef] [Green Version]
  60. Abdallah, T.; Lemordant, D.; Claude-Montigny, B. Are room temperature ionic liquids able to improve the safety of supercapacitors organic electrolytes without degrading the performances? J. Power Sources 2012, 201, 353–359. [Google Scholar] [CrossRef]
  61. Zarrougui, R.; Hachicha, R.; Rjab, R.; Messaoudi, S.; Ghodbane, O. Physicochemical characterizations of novel dicyanamide-based ionic liquids applied as electrolytes for supercapacitors. RSC Adv. 2018, 8, 31213–31223. [Google Scholar] [CrossRef] [Green Version]
  62. Galek, P.; Slesinski, A.; Fic, K.; Menzel, J. Peculiar role of the electrolyte viscosity in the electrochemical capacitor performance. J. Mater. Chem. A 2021, 9, 8644–8654. [Google Scholar] [CrossRef]
  63. Mohd Zaid, N.A.; Idris, N.H. Enhanced Capacitance of Hybrid Layered Graphene/Nickel Nanocomposite for Supercapacitors. Sci. Rep. 2016, 6, 32082. [Google Scholar] [CrossRef] [PubMed]
  64. illars, F.B.; Fletcher, S.I.; Mirzaeian, M.; Hall, P.J. Variation of electrochemical capacitor performance with room temperature ionic liquid electrolyte viscosity and ion size. Phys. Chem. Chem. Phys. 2012, 14, 6094–6100. [Google Scholar] [CrossRef] [PubMed]
  65. Kikuchi, K.; Yamashita, R.; Sakuragawa, S.; Hasumi, K.; Mukai, Y.; Kobayakawa, H.; Wakabayashi, S.; Saito, Y. Pore structure and the properties of electric double layer capacitor electrode of bamboo-derived activated carbon prepared by superheated steam. J. Wood Sci. 2018, 64, 642–649. [Google Scholar] [CrossRef] [Green Version]
  66. Luo, Z.; Zhang, B.; Qian, H.; Lu, Z.; Cui, S. Effect of the size of solvent molecules on the single-chain mechanics of poly (ethylene glycol): Implications on a novel design of a molecular motor. Nanoscale 2016, 8, 17820–17827. [Google Scholar] [CrossRef] [PubMed]
  67. Xu, B.; Wu, F.; Chen, R.; Cao, G.; Chen, S.; Wang, G.; Yang, Y. Room temperature molten salt as electrolyte for carbon nanotube-based electric double layer capacitors. J. Power Sources 2006, 158, 773–778. [Google Scholar] [CrossRef]
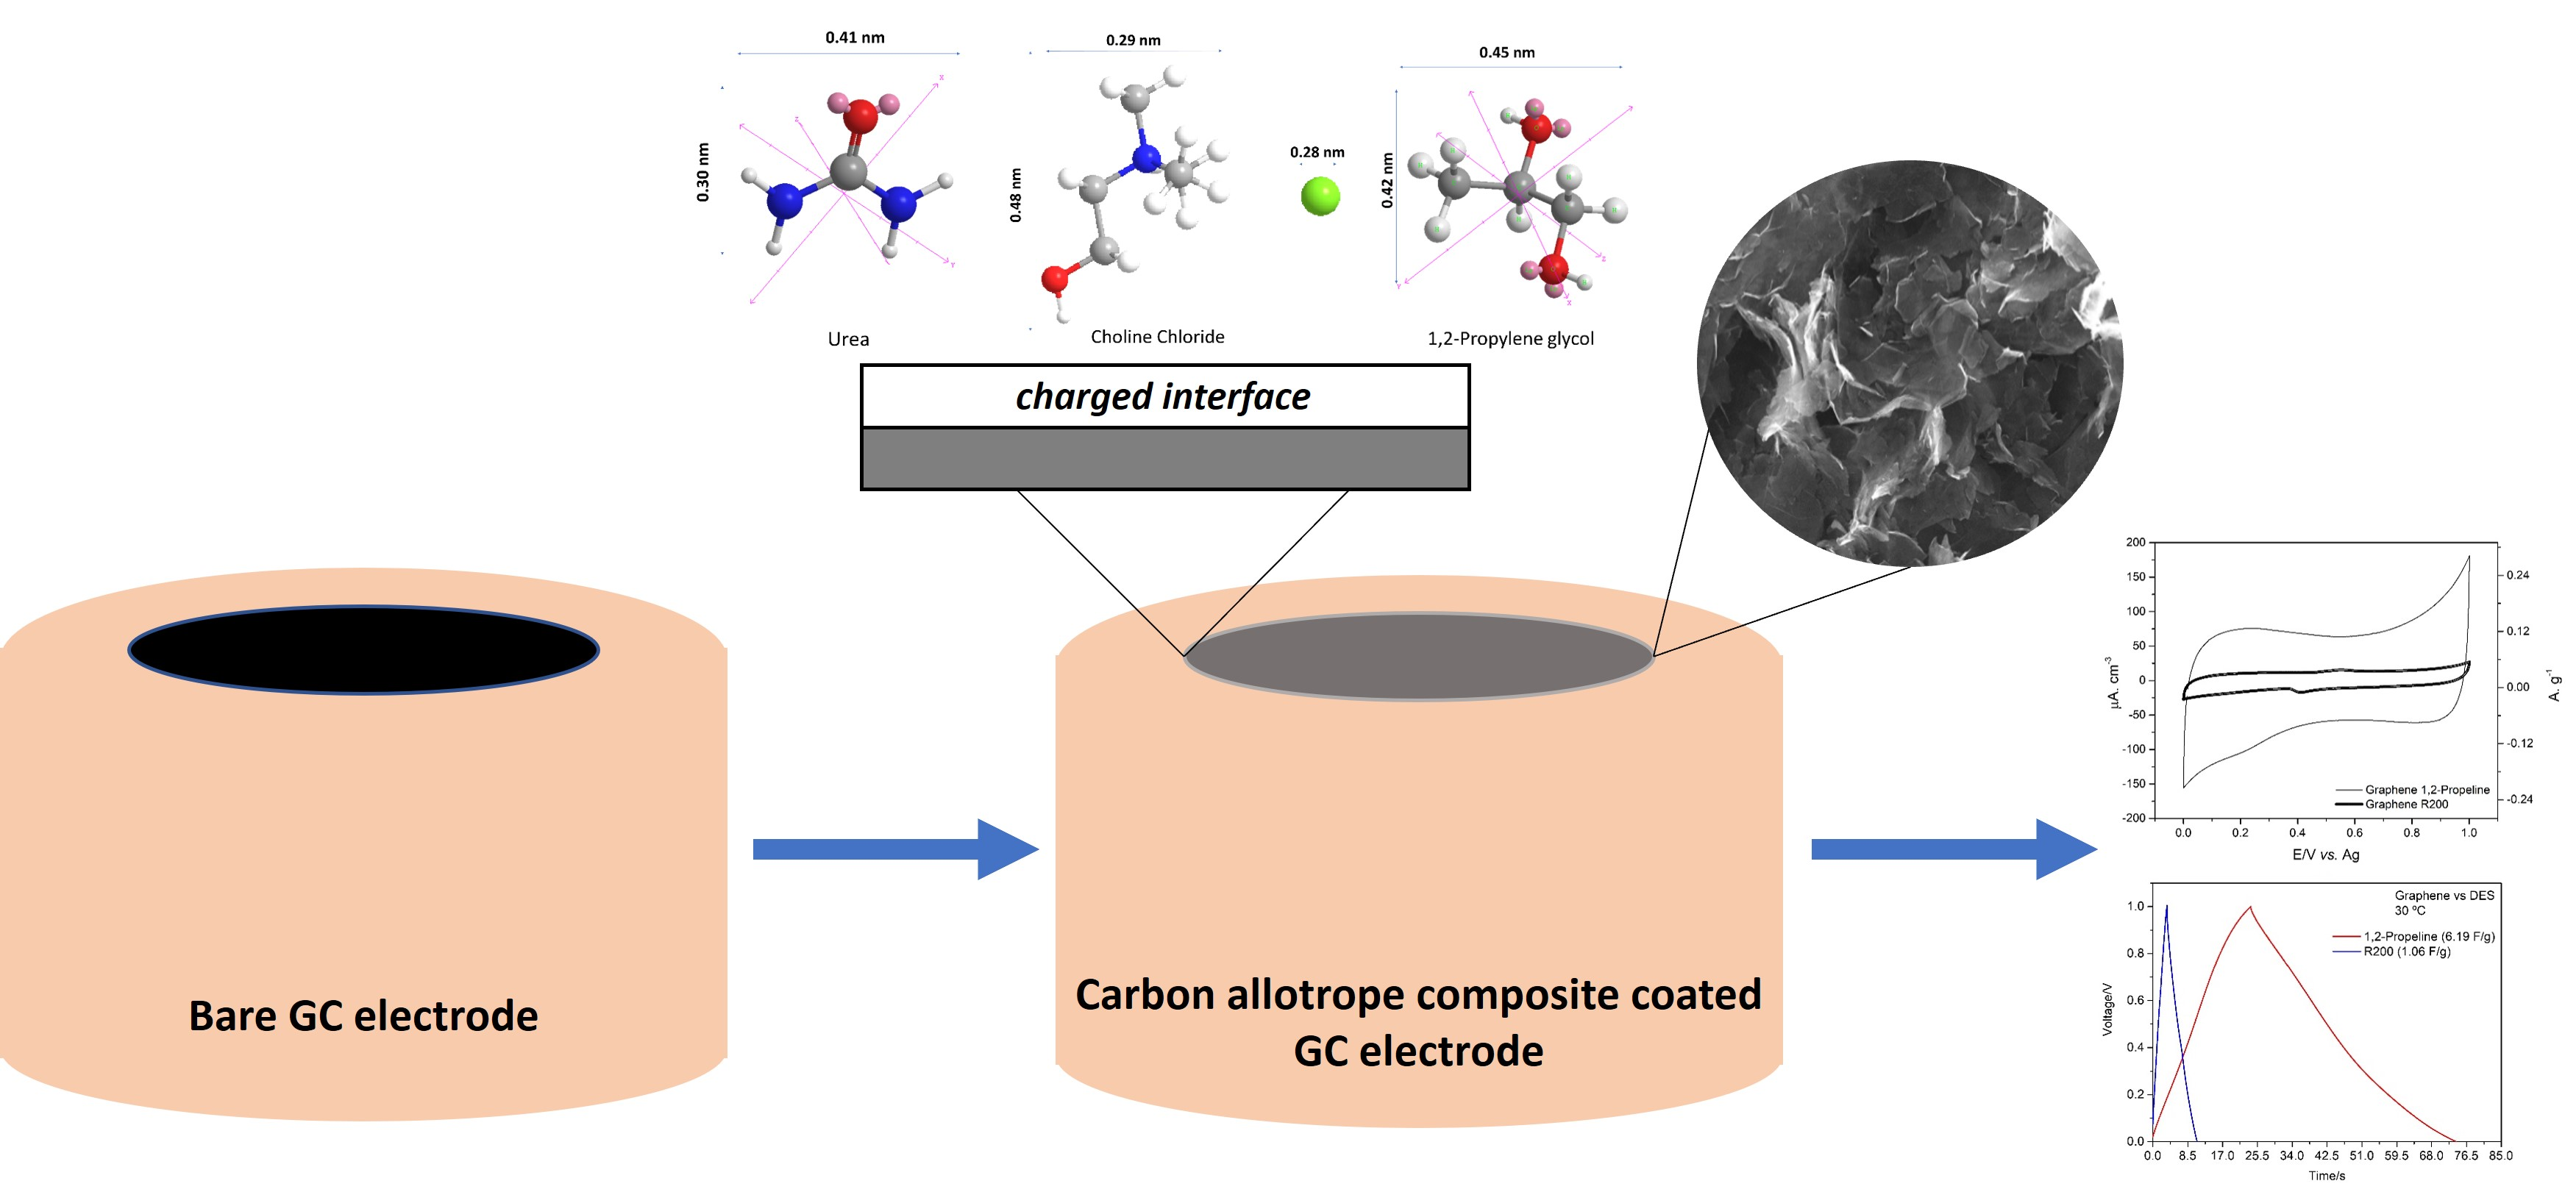
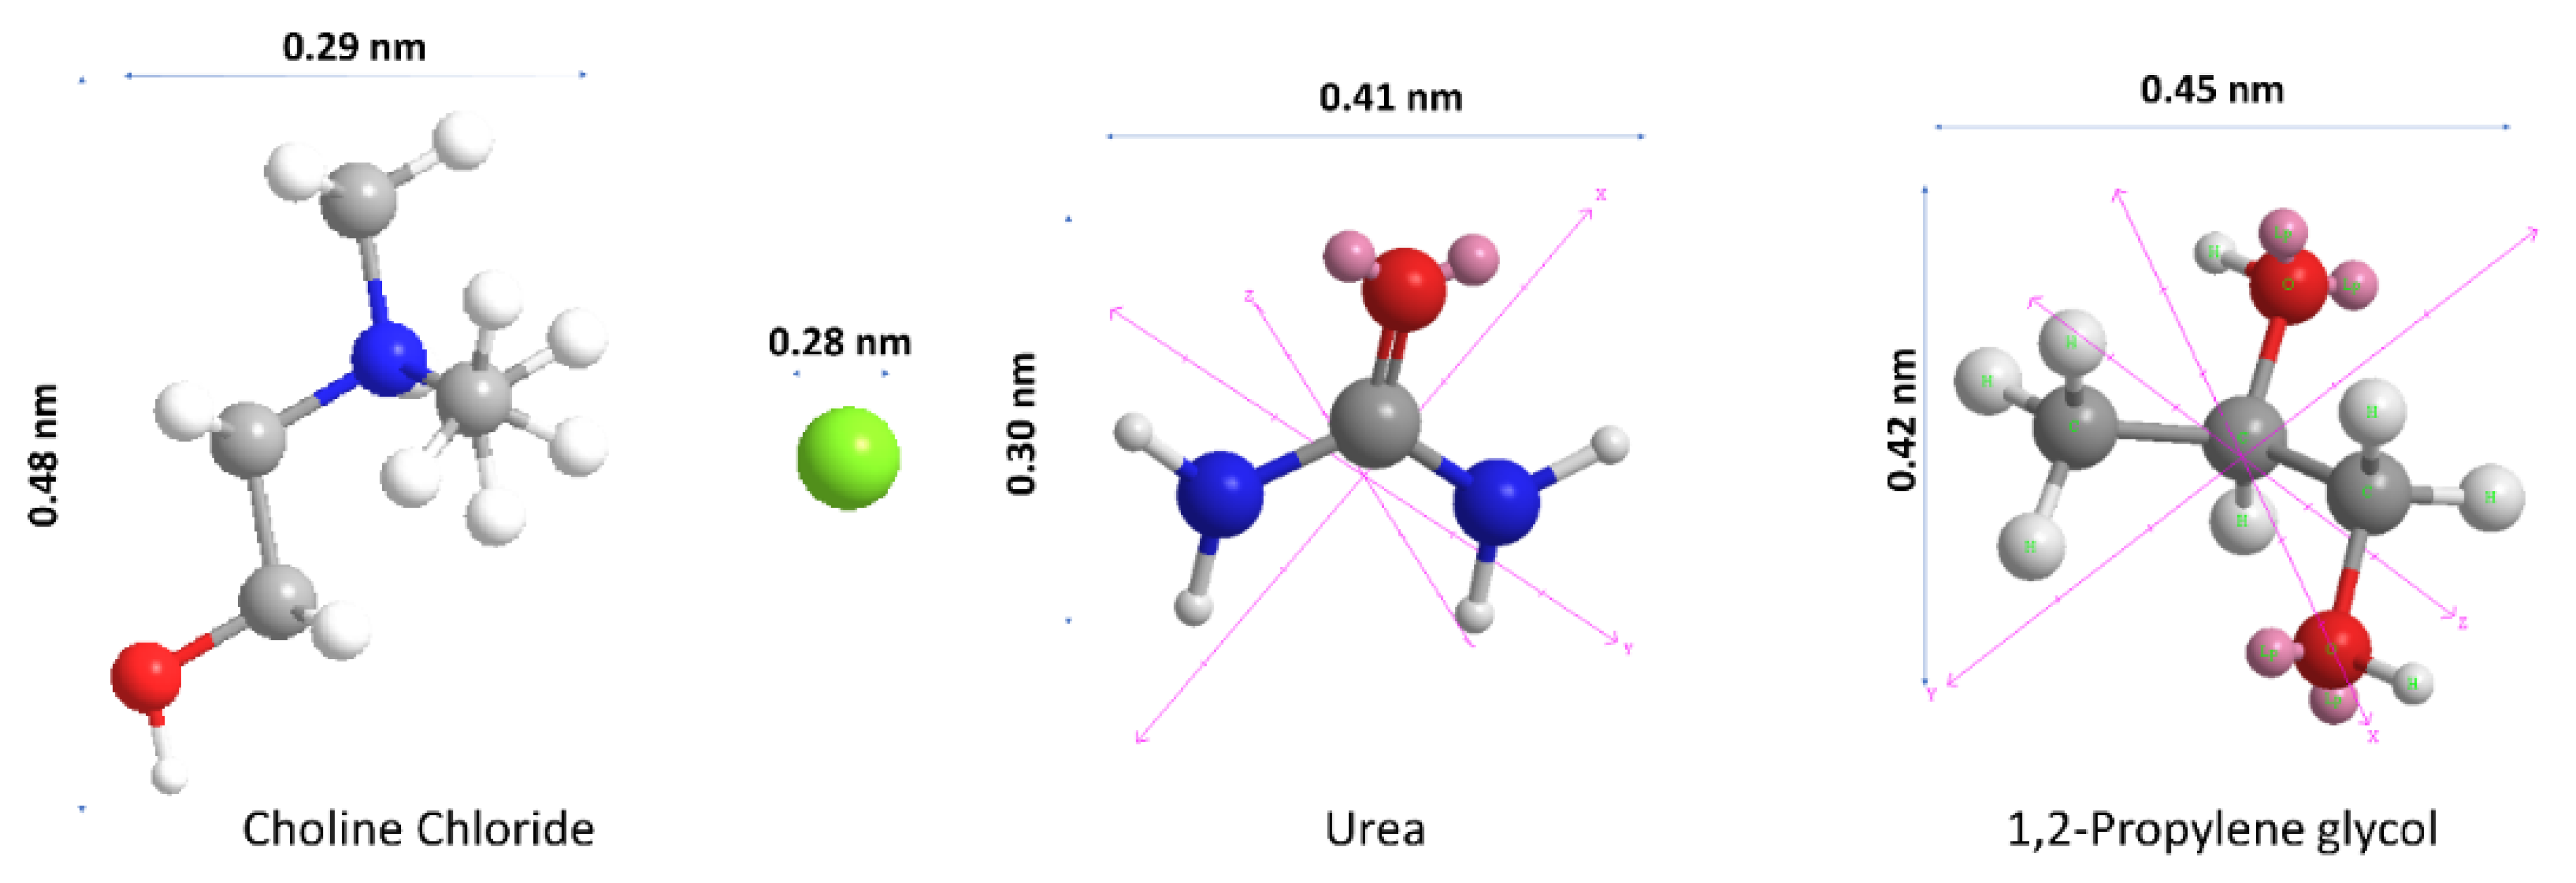
Figure 1. Approximate dimensions of DES components (choline chloride and HBDs). Atoms: C (gray), N (blue), O (red), and H (white). Molecules were drawn in ChemDraw19 software. Dimensions reported in [22,50].
Electrochem 03 00009 g001
Figure 2. SEM pictures of the G_REF (a) and commercial graphite (b), at 5000× magnification.
Electrochem 03 00009 g002
Figure 3. Cyclic voltammetry (scan rate of 50 mV s−1) (a) and differential capacitance curve (EIS) (b) measured at GC/DES interface at 30 °C.
Electrochem 03 00009 g003
Figure 4. Electrochemical testing of graphene and graphite at 30 °C (a,b)—cyclic voltammetry; (c,d)—capacitance-potential curve; (e,f)—charge/discharge at 1 A g−1; (g,h)—gravimetric capacitance for 1000 cycles.
Electrochem 03 00009 g004
Table 1. Composition and commercial designation of the DES used.
DESCompositionMolar RatioCholine ChlorideHBD
1,2-Propeline
(12P)
Choline chloride (ChCl) + 1,2-propylene glycol (1,2-PG)1 (ChCl): 2 (1,2-PG) Electrochem 03 00009 i001 Electrochem 03 00009 i002
reline 200 *
(R200)
Choline chloride (ChCl) + Urea (U)1 (ChCl):2 U Electrochem 03 00009 i003 Electrochem 03 00009 i004
* Trade name.
Table 2. Water content, dynamic viscosity and ionic conductivity for 1,2–propeline and reline 200.
DESWater Content **/wt.%T/°CViscosity ***/mPa sIonic Conductivity/mS cm−1
1,2–Propeline *6.9 ± 1.130 °C71.1 ± 0.9
56.8 ± 1.1
40.8 ± 0.8
31.5 ± 1.0
3.11 ± 0.09
4.09 ± 0.05
4.78 ± 0.09
5.4 ± 0.1
40 °C
50 °C
60 °C
reline 200 *
(R200)
5.5 ± 0.430 °C350.3 ± 4.3
322.2 ± 1.9
257.1 ± 6.0
203.7 ± 9.6
0.34 ± 0.01
0.76 ± 0.03
1.21 ± 0.09
1.96 ± 0.07
40 °C
50 °C
60 °C
* Trade name; ** measured at room temperature, right after the DES preparation; *** measured between 30–60 °C, right after the DES preparation.
Table 3. Surface area, pore volume and average pore size of commercial graphene and graphite materials.
SBET/m2 g−1Pore Volume/cm3 g−1Average Pore Width/nm
Commercial Graphene45.14 ± 0.430.00461 ± 0.000120.9049
Commercial Graphite10.74 ± 0.120.00028 ± 0.000090.9251
Table 4. Electrochemical parameters for both graphene and graphite in 1,2-propeline and R200 eutectic mixtures at 30 °C.
DESSpecific Capacitance/
F g−1
Capacitance Retention after 1000 Cycles/%IR/V
Commercial Graphene1,2-Propeline6.1959.780.0064
R2001.0679.710.0278
Commercial Graphite1,2-Propeline1.7065.470.0104
R2001.3479.550.0289
Publisher’s Note: MDPI stays neutral with regard to jurisdictional claims in published maps and institutional affiliations.

