Abstract
Cu-Mn alloy films are electrodeposited on Au substrates as precursor alloys for the synthesis of fine-structured nanoporous Cu structures. The alloys are deposited galvanostatically in a solution containing ammonium sulfate, (NH4)2SO4, which serves as a source of the ammine ligand that complexes with Cu, thereby decreasing the inherent standard reduction potential difference between Cu and Mn. The formation of the [Cu(NH3)n]2+ complex was confirmed by UV-Vis spectroscopic and voltammetric studies. Galvanostatic deposition at current densities ranging from 100 to 200 mA⋅cm−2 generally resulted in the formation of type I, crystalline coatings as revealed by scanning electron microscopy. Although the deposition current efficiency is (<30%) generally low, the atomic composition (determined by energy dispersive X-ray spectroscopy) of the deposited alloys range from 70–85 at% Mn, which is controlled by simply adjusting the ratio of the metal ion concentrations in the deposition bath. Anodic stripping characterization revealed a three-stage dissolution of the deposited alloys, which suggests control over the selective removal of Mn. The composition of the alloys obtained in the studies are ideal for electrochemical dealloying to form nanoporous Cu.
1. Introduction
Manganese (Mn) and its alloys have been used extensively in the metal industry as galvanic sacrificial coating protection for steel to prevent corrosion and degradation [1,2,3,4,5]. Due to its very negative standard reduction potential [6], pure Mn exhibits very high reactivity and is prone to quick corrosion under ambient conditions [7]. As a result, Mn has been alloyed with other metals such as Cu [4], Ni [3], Co [8], and Zn [9]. These alloys have significantly improved corrosion protective characteristics [10,11]. One of the most commonly synthesized Mn-alloys is Cu-Mn due to its excellent mechanical properties [12,13]. Typical Cu-Mn coatings exhibit a ductile centered-tetragonal γ-Mn that is stabilized by Cu, which is a face-center cubic (fcc) metal, thus forming an fcc solid solution also referred to as the γ-phase [14,15]. According to the Cu-Mn binary phase diagram, increasing the Cu content in the alloy (to approximately 18 atomic percent, at%) can prevent the deterioration of the Mn-rich α-phase that is generally unstable and exhibits similar properties as pure Mn coatings [5,16]. Pure Mn or low Cu-containing Cu-Mn coatings are brittle with weaker mechanical properties rendering them ineffective as a sacrificial coating [17]. Mn-alloy coatings can be characterized into two categories, namely type I and type II. The former has a crystalline morphology with regularly shaped grains while the latter is more compact and amorphous [4,5,17]. Either type can be formed under different conditions.
Although most of the applications of Mn-containing alloys are associated with industrial uses, our interest in Cu-Mn alloys comes from their potential application as a precursor for the formation of nanoporous Cu (np-Cu) structures for use in microelectronic packaging applications [18]. These np-Cu structures have a high surface area-to-volume ratio that ultimately promotes a melting temperature depression. This property makes np-Cu an ideal material for low-temperature sintering that can be applied in the electronics industry as a solder-free interconnection realized by Cu-on-Cu bonding [19]. To obtain these structures, the precursor alloy must contain high atomic percentages of the less noble metal [20], which would then be selective removed or dealloyed to form a np-Cu structure [21]. Recently, we have reported the electrodeposition of Zn-rich Cu-Zn alloys that are promising candidates for np-Cu formation [22]. Others have reported the use of Cu-Al [23], Cu-Hf-Al [24], and Cu-Mn [25]. Among these alloys, Cu-Mn is an ideal choice because of the wide difference between the standard reduction potentials of Cu/Cu2+ (Eº = 0.34 V vs. SHE) and Mn/Mn2+ (Eº = −1.18 V vs. SHE) [26] which allows for a large dealloying potential window.
Typical precursor alloys can be synthesized by traditional arc melting processes [25,27], but electrochemistry offers better control over deposition parameters without the use of high temperatures. However, difficulties in the electrodeposition of Cu-Mn arise from the large difference in the reduction potentials of Cu and Mn. Due to this potential difference, it has become necessary for a ligand or complexing agent to be added in the deposition bath. The ligand selectively complexes with Cu, thus changing its electronic structure and shifting its reduction potential negatively towards that of Mn [28], thereby allowing for co-deposition at similar potentials. Some ligands that have been used in literature for Mn-alloys include EDTA, tartrate, and gluconate [12,29]. However, the most used one is ammine (NH3), which comes from ammonium sulfate electrolytes [4,5,11]. Not only does NH3 act as a complexing agent for Cu, but it also has positive effects on electrodeposition of Mn and Mn-containing alloys [17,30]. For instance, it supports the production of well-adhering, dense deposits while also providing a buffering effect at pH 2–3 and 6–8, thus, to some extent, stabilizing the pH on the surface of the cathode substrate [31]. However, during electrodeposition of Mn-alloys, hydrogen (H2) reduction occurs concurrently. As a result, typical Cu-Mn alloys are electrodeposited at fairly low current densities and result in relatively rough surfaces [11,17]. To minimize H2 evolution, some researchers have used deep eutectic and organic solvents [32,33], but these electrolytes are generally toxic and non-environmentally friendly [34].
Electrodeposition of Cu-Mn alloys is usually carried out under galvanostatic control [4,11,17,35]. Typical Cu-Mn alloys currently presented in literature contain only small amounts of Cu (<10 at%) for purposes of stabilizing the γ-phase as protective coatings [4,5]. It has been shown that low applied current densities (<100 mA⋅cm−2) produce Cu-rich, type I Cu-Mn alloys while high current densities (>300 mA⋅cm−2) favor the growth of type II alloys that mostly contain manganese oxides [4,7]. Alloys with desired atomic compositions were usually obtained at current densities ranging from 100 to 200 mA⋅cm−2. In our studies, the desired Cu-Mn alloy composition should ideally feature approximately 10–30 at% Cu. Precursor alloys for np-Cu formation require about <30 at% Cu and >70 at% of the less noble metal in order to obtain properly structured ligaments, as discussed extensively in the literature (e.g., dealloying of Ag-Au and dealloying of Cu-Zn) [22,36,37].
In this paper, we report the electrodeposition of Mn-rich Cu-Mn alloys as precursor alloys for np-Cu synthesis. The deposition was performed in ammonium sulfate-based baths as a source of the ammine ligand. The formation of Cu-ammine complex, in different electrolyte pH, was confirmed by UV-Vis spectroscopy and voltammetry. The effect of factors such as applied current density and varying metal ion concentrations on the alloy morphology and composition were studied via galvanostatic deposition, anodic stripping voltammetry, and scanning electron microscopy coupled with energy dispersive X-ray spectroscopy.
2. Materials and Methods
2.1. Reagents
The following chemicals were used as received without further purification: nitric acid (HNO3; VWR Chemicals, Monroeville, PA, USA; ACS grade), ethanol (Pharmco, Brookfield, CT, USA; ACS/USP grade), copper sulfate pentahydrate (CuSO4∙5H2O; Aldrich, MI, USA; 99.995%), manganese sulfate monohydrate (MnSO4∙H2O; Fisher, Boston, MA, USA; ACS grade), ammonium sulfate ((NH4)2SO4; J.T. Baker, Warren, NJ, USA; ACS grade), ammonium hydroxide (Fisher, Boston, MA, USA; ACS grade), sodium sulfate decahydrate (Na2SO4∙10H2O; J.T. Baker, Warren, NJ, USA; 98.1%), and sulfuric acid (H2SO4; J.T. Baker, Warren, NJ, USA; ACS grade). All solutions were prepared using Barnstead Nanopure® water (NPW, North Clearwater, NL, USA; resistance of 18.2 MΩ cm).
2.2. Electrode Preparation and Cell Setup
All electrochemical experiments were performed using a conventional three-electrode cell using a Pt wire as the counter electrode (annealed using a propane torch prior to each experiment), a Hg/Hg2SO4 (saturated K2SO4) reference electrode (MSE, Pine Instruments, Grove City, PA, USA; 0.65 V vs. SHE), and polycrystalline Au cylinders (surface area of 0.30 cm2) as the working electrode (WE). The sequential preparation of the WEs is as follows: mechanical polishing down to 1 µm de-agglomerated alumina slurry on a Buehler polishing pad, thorough rinsing with NPW, sonicating in ethanol for three minutes, sonicating in NPW for one minute, immersing in warm concentrated HNO3, annealing using a propane torch for five minutes, cooling with ultra-pure N2 gas, and final rinsing with NPW. Au WEs were attached to a conductive vacuum holder and were in contact with solutions in a hanging meniscus configuration [38]. All solutions were purged with N2 gas for at least 15 min prior to each experiment. Electrochemical experiments were executed using a VersaSTAT3 potentiostat (Princeton Applied Research, Oak Ridge, TN, USA) controlled using the VersaStudio software 2.50.3.
2.3. Electrodeposition of Cu-Mn Alloys
Cu-Mn alloys were electrodeposited on Au substrates from a deposition bath containing 0.01 M CuSO4 and 0.09 M MnSO4 in 0.5 M (NH4)2SO4 (labeled as “1:9 bath”). The pH of the bath was adjusted to 6.5 with NH4OH. The deposition bath was studied via ultraviolet-visible spectroscopy (UV-Vis) using a Shimadzu UV-2600 UV-Vis spectrophotometer. The electrodeposition was performed under galvanostatic control at applied current densities ranging from 100 to 200 mA⋅cm−2 at a constant deposition time of 60 s. The effect of varying metal ion ratio on the composition of the electrodeposited alloy was studied by changing the concentration of MnSO4 in the deposition bath. These baths contained 0.01 M CuSO4 + 0.06 M MnSO4 (labeled as “1:6 bath”) and 0.01 M CuSO4 + 0.04 M MnSO4 (labeled as “1:4 bath”). The deposition protocol using these baths remained as previously described.
2.4. Electrochemical, SEM, and EDS Characterizations
The stripping behavior of the electrodeposited Cu-Mn alloys were characterized via linear sweep voltammetry (LSV) in a solution containing 0.1 M Na2SO4 and 1 mM H2SO4. The potential was scanned from −1.7 V to 0 V at a scan rate of 2 mV∙s−1. The charges (Q) under the stripping curve were determined and used to calculate the deposition current efficiency (CE) using the following equation: . The reported charges were corrected with the background charge collected on bare Au under similar conditions. The morphology of the electrodeposited alloys was studied by scanning electron microscopy (SEM, Zeiss, Germany; FEG-SEM Zeiss Supra 55 VP) via the in-lens detector at an accelerating voltage of 10 kV and a working distance of 4–5 mm. All images were taken at 50,000× magnification (unless otherwise noted). The atomic composition of the alloys was also determined by energy dispersive X-ray spectroscopy (EDS) coupled with SEM via the SE2 detector at an accelerating voltage of 15 kV and a working distance of 8.5 mm. EDS was performed on three different areas of the WE and the results are reported as average atomic percentages (at%).
3. Results and Discussion
3.1. Deposition Bath Studies
Mn and Mn-containing alloys such as Cu-Mn are commonly electrodeposited from solutions containing ammonium sulfate, (NH4)2SO4, which has been found to be an essential component for Mn deposition with good coverage [17]. (NH4)2SO4-based electrolytes increase the discharging ability of Mn2+ ions while also providing a good buffering condition at pH ranges of 2–3 and 6–8 [17]. Furthermore, (NH4)2SO4 provides an ammine ligand (NH3) that can complex with Cu2+. It is also possible that NH3 can complex with Mn. However, previous studies [17] have shown that the resulting Mn-ammine complex is relatively unstable; thus, NH3 will selectively complex with Cu. The resulting Cu-ammine complex is reduced at relatively more negative potential, thus bringing it closer to that of Mn, allowing for co-deposition at similar potentials. The complexation of Cu was studied via UV-Vis spectroscopy. The resulting absorbance spectra are shown in Figure 1. In the absence of NH3, the Cu2+ solution absorbs at 810 nm (black curve), which is characteristic of free [Cu(H2O)m]2+ complex ions [39]. Upon the addition of NH3 at pH 2.5 (red curve), a similar peak is observed at 810 nm. This suggests that at the pH range of 2–3, Cu2+ still exists as a free ion. When the bath is adjusted to pH 6.5, the color of the solution changes from a very light blue to a darker blue color, which suggests the formation of Cu-ammine complexes. This is confirmed by the observance of a peak shift towards a shorter wavelength (indicating higher energy), as well as an increase in the absorbance readings (blue curve). The maximum absorbance is found at 696 nm, which corresponds to the absorption of the [Cu(NH3)n]2+ complex generated by the reaction presented in Equation (1) [39,40].
[Cu(H2O)m]2+ (aq) + n NH3 (aq) → [Cu(NH3)n]2+ (aq) + m H2O (l)
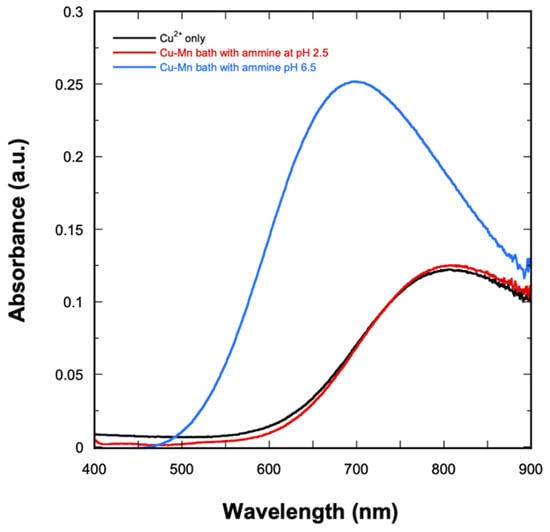
Figure 1.
UV−Vis spectra of Cu2+ solution and the Cu-Mn deposition bath at pH 2.5 and 6.5.
The effect of the ammine ligand was also studied via cathodic linear scan voltammetry (LSV). The voltammogram of free Cu2+ (shown in Figure 2a) shows the reduction of Cu2+ to elemental Cu at the onset potential of −0.35 V. Upon the addition of (NH4)2SO4 at pH 2.5, the onset reduction potential shifts slightly negatively to −0.43 V. At pH 6.5, two reduction peaks are observed, which likely reflect a two-step reduction of the [Cu(NH3)n]2+ complex, as shown in the proposed mechanism (Equations (2) and (3)) [11,40]. The first peak, which begins at −0.30 V, may be assigned to the reduction of [Cu(NH3)n]2+ to the intermediate [Cu(NH3)2]+. The second cathodic peak, which begins at −0.66 V, is assigned to the further reduction of [Cu(NH3)2]+ to metallic Cu with the release of ammonia [28,41]. The assignment of these peaks is further supported by independent polarization and stripping analyses presented in Figure S1a,b, respectively, in the Supplementary Information. The differences in the reduction behavior of Cu2+ with and without the addition of (NH4)2SO4 provide additional evidence of the formation of the Cu-ammine complex.
[Cu(NH3)n]2+ (aq) + e− → [Cu(NH3)2]+ (aq) + (n−2) NH3 (aq)
[Cu(NH3)2]2+ (aq) + e− → Cu (s) + 2 NH3 (aq)
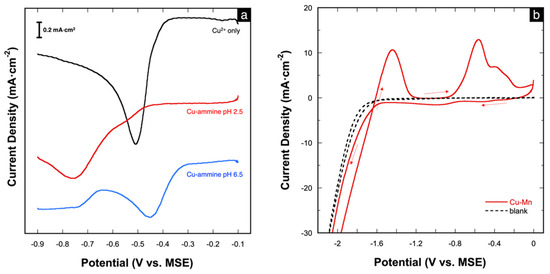
Figure 2.
(a) Potentiodynamic curves depicting the cathodic behavior of 10 mM CuSO4 solution without and with (NH4)2SO4 (at pH 2.5 and 6.5); (b) CV of the Cu-Mn deposition bath at pH 6.5; scan rate = 50 mV⋅s−1.
The deposition bath (1:9) was also studied via cyclic voltammetry (CV). The voltammogram (Figure 2b) shows large cathodic currents starting at −1.6 V, which correspond to the co-reduction of Cu and Mn. The large current magnitudes are also due to the concurrent hydrogen reduction (evolution) (Equation (4)) [17]. In fact, hydrogen evolution is inevitable in aqueous solutions during Mn deposition because of the very negative reduction potential of Mn. On the reverse scan, two anodic peaks are seen at −1.45 V and −0.5 V, which correspond to the successive oxidation of Mn and Cu, respectively.
2 H2O (l) + 2e− → H2 (g) + 2 OH−(aq)
3.2. Galvanostatic Deposition of Cu-Mn
Cu-Mn alloys were electrodeposited on Au substrates under galvanostatic control using the 1:9 bath. The resulting deposition curves are presented in Figure S2. The chosen applied current densities for the deposition process were in the range of 75 to 200 mA⋅cm−2. The morphology of the Cu-Mn alloys was characterized by scanning electron microscopy (SEM). The corresponding SEM images of the alloys deposited at different current densities are presented in Figure 3. The micrographs suggest that the alloys electrodeposited at 100 to 200 mA⋅cm−2 exhibit a type I morphology consisting of clustered grains with sizes ranging from 200 nm to 1 µm. Furthermore, irregular cracks between the grains are present throughout the surface of the alloys, which has been attributed to some pockets of space occupied by H2 gas that evolved concurrently during the electrodeposition [11]. The atomic composition of these alloys was also determined via energy dispersive spectroscopy (EDS) coupled with the SEM and the results are shown in Table 1. Similar atomic compositions were obtained for the alloys deposited at 100 to 200 mA⋅cm−2, with a Mn content of about 84–86 at%. Although not directly correlated, these compositions correspond closely to the ratio of the respective metal ion ratio in the deposition bath (10% Cu2+, 90% Mn2+). Nonetheless, the alloy’s composition is generally consistent with the anticipated Mn-rich type I morphology. For the alloy electrodeposited at 75 mA⋅cm−2, the overall morphology is type II. This is not a surprise as the composition of that alloy is Cu41Mn59, which deviates substantially from the solution ratio. Apparently, at this lower applied current density, the current is not high enough to sufficiently surpass the Cu reduction limiting current and reach the Mn reduction limiting one [11,42,43]. Therefore, the resulting alloy, deposited with mass-transport limitations for Cu and in transient regime for Mn, contains higher Cu content than the desired composition. Deposition at current densities higher than 200 mA⋅cm−2 were not performed because it has been found that the deposition at these potentials results in the growth of Mn oxides and hydroxides [11], presumably induced by the increase of the local pH in the near-electrode vicinity. The latter trend is associated with the release of OH− ions (Equation (4)) as a product of the concurrent hydrogen evolution [11,14].
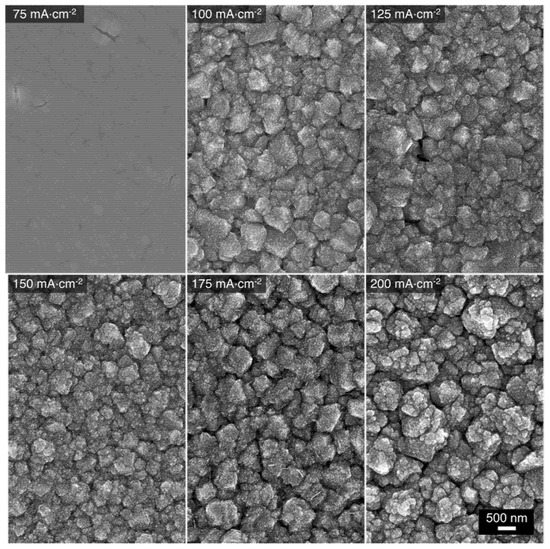
Figure 3.
SEM micrographs of Cu-Mn alloys electrodeposited at different applied current densities using the 1:9 bath.

Table 1.
Atomic compositions of Cu-Mn alloys electrodeposited from the 1:9 bath as determined by EDS.
3.3. Alloy Stripping Analysis
The electrochemical dissolution or stripping behavior of the electrodeposited alloys were characterized by linear sweep voltammetry (LSV). For this study, an alloy with atomic composition of Cu15Mn85 was firstly electrodeposited at 175 mA⋅cm−2. A representative LSV stripping curve, shown in Figure 4a, reveals three peaks at different potentials that suggest a three-stage alloy stripping labeled as stages I, II, and III, accordingly. A similar observation is seen in the dissolution of electrodeposited Cu-Zn alloys [22]. After each stage of the alloy stripping, the changes in the alloy’s morphology and elemental composition were studied via SEM and EDS to assign each stripping peak appropriately. Figure 4b shows the morphology of the alloy after stage I. Compared to the morphology of the alloy prior to dissolution (Figure 3), the morphology of the alloy post-stage I is relatively rougher, with cracks forming between relatively smaller grains. The surface of the alloy appears to also be covered with nanowire and nanoplatelet bundles (inset in Figure 4b), which are indicative and characteristic of Mn oxides [44]. This is also evident in the EDS result showing an atomic composition of Cu36Mn10O54. It is likely that the Mn in this intermediate stage of dissolution is susceptible to oxide-formation, which is promoted by the above-mentioned near-electrode local alkalization [11,14] and results in the crystallization of Mn oxides. Excluding oxygen from the quantitative analysis, the elemental distribution of the alloy is Cu78Mn22. Since there is still some residual amount of Mn remaining, the peak in stage I of the stripping curve can be assigned only to non-bonded and low-coordinated Mn atoms that were mostly organized in the surface grains of the as-deposited precursor alloy.
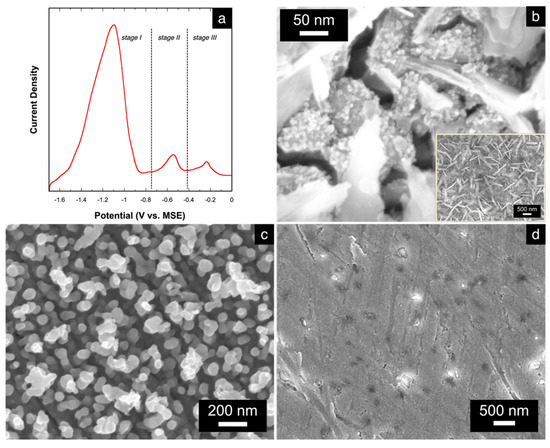
Figure 4.
(a) LSV curve showing the three-stage stripping of the electrodeposited Cu-Mn alloy; SEM micrographs of the Cu-Mn alloy (b) after stage 1 (at 400,000× magnification; inset shows the image at 50,000× magnification), (c) after stage 2 (at 100,000× magnification), and (d) after stage 3 of stripping.
After the second stage of dissolution, the atomic composition of the alloy changes to Cu98Mn2, suggesting almost a complete dissolution of Mn from the starting alloy. The morphology also changes to the np-Cu structure (Figure 4c) with ligament sizes ranging from 20 to 50 nm. The small amount of residual Mn likely resulted in the entrapment of some Mn atoms during the stripping process caused by the simultaneous rearrangement of the Cu atoms to form the Cu-rich ligaments. Based on these results, the peak in stage II of the stripping curve can be assigned to the stripping of the remaining Mn atoms that were strongly bonded to the Cu atoms existing within the bulk of the alloy. These findings also reveal that the dealloying of Cu-Mn occurs as a two-stage process to form the np-Cu structure. Lastly, the peak in stage III is assigned to the complete dissolution of the np-Cu, as evidenced by the SEM image in Figure 4d showing a bare Au substrate, while EDS results show no remaining signals for Cu nor for Mn.
Figure 5 shows the LSV stripping curves for all alloys deposited from the 1:9 bath. Regardless of the applied current density, the three-stage dissolution process is seen for all electrodeposited alloys. Quantitatively, the total charges under the stage I and stage II peaks (both signifying the stripping of Mn) increase as the applied current density increases. On the other hand, no clear trend is seen in the charge under the stage III peak as a function of current density. Amongst these stripping curves, the one obtained at 75 mA⋅cm−2 appears slightly different from the other stripping curves. The magnitudes of the stage I and stage III peaks are almost identical, which reflects the alloy’s atomic composition of Cu41Mn59 that is also different from the other electrodeposited alloys. Despite that, all considered alloys follow the same dissolution behavior, independent of the applied current density.
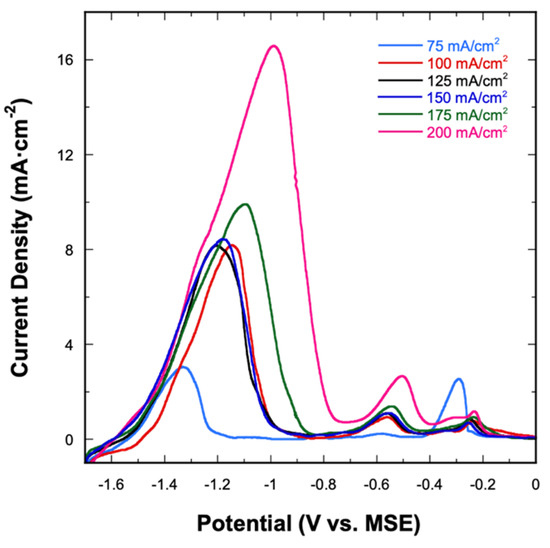
Figure 5.
Anodic stripping curves of Cu-Mn alloys electrodeposited at different applied current densities using the 1:9 bath.
3.4. Effect of Metal Ion Concentration Ratio
The formation of np-Cu is achievable by dealloying of Cu-Mn alloys with varying atomic compositions but with a Mn content no less than 60 at% [45]. As so, Cu-Mn alloys were electrodeposited from baths containing different precursor metal ion concentration ratios to achieve Mn-rich alloys with varying compositions. In this study, three different ratios were chosen, as described in the Experimental Section. The concentration of CuSO4 was kept constant at 0.01 M while the concentration of MnSO4 was varied from 0.09 M, 0.06 M, and 0.04 M. For the sake of discussion, these baths are labeled 1:9, 1:6, and 1:4, respectively. As already discussed, Cu-Mn alloys that were deposited galvanostatically from the 1:9 bath in the current density range of 100 to 200 mA⋅cm−2 resulted in alloys with an average composition of Cu15Mn85. When the Cu2+:Mn2+ concentration of ratio changed to 1:6, the atomic composition of the deposited alloy (Table 2) ranged from 21 to 23 at% Cu and 77 to 79 at% Mn when deposited at the applied current density range of 100 to 200 mA⋅cm−2. The atomic composition of the alloy deposited at 100 mA⋅cm−2 (Cu27Mn73) deviates away from those obtained at higher current densities.
Table 2.
EDS atomic composition of Cu-Mn alloys electrodeposited from the 1:6 and 1:4 baths at different applied current densities.
Using the 1:4 bath, the deposited alloy contained mostly Cu with some very minimal Mn (4 at%) when deposited at 100 mA⋅cm−2. At 125 mA⋅cm−2, the deposited alloy is relatively uneven in terms of deposit and elemental distribution throughout the WE surface. EDS studies revealed that the Cu-Mn alloy with a composition of Cu27Mn73 only deposited on certain areas of the electrode surface while the rest of the electrode was covered with pure Cu deposits. A homogenous deposit and stable atomic composition of Cu30–31Mn69–70 are obtained at applied current density of 150 to 200 mA⋅cm−2. Based on the EDS studies of the alloys deposited from 1:9, 1:6, and 1:4 baths (at the applied current densities of interest), it appears that the Mn reduction limiting current shifts toward higher current magnitudes as the bath concentration of MnSO4 decreases [4]. As a result, alloys with higher atomic fractions of Cu are obtained at lower current densities (100 mA⋅cm−2) with respect to those deposited at higher current densities.
Figure 6a shows overlaid LSV stripping curves of Cu-Mn alloys electrodeposited at 175 mA⋅cm−2 using the three different deposition baths. The three-stage dissolution behavior is observed in all three deposition baths. In terms of stripping charge, the total charge under the stages I and II peaks decrease as the concentration of MnSO4 in the deposition bath decreases (1.84, 1.51, 1.29 C⋅cm−2 for the 1:9, 1:6, and 1:4 baths, respectively). At the same time, the Cu stripping charges under the stage III peak increase (0.081, 0.091, 0.51 C⋅cm−2 for the 1:9, 1:6, and 1:4 baths, respectively). In our previous work, stripping characterizations were used to estimate the atomic composition of Cu-Zn alloys based on electrochemical characterization by comparing the respective stripping charges [22]. In this case, however, the ratios of the stripping charges (Cu:Mn) do not match quantitatively with the EDS results (Table 1 and Table 2). However, a qualitative matching trend can be derived wherein the Mn at% (based on EDS) also decreases as the concentration of MnSO4 decreases while the Cu at% increases. The stripping charges were also used to calculate the current efficiency (CE) at each applied deposition current density in all three deposition baths. The relationship between calculated CE as a function of deposition current density is shown in Figure 6b. The highest CE is achieved at 200 mA⋅cm−2, while no clear trend is observed for the other tested current densities. Nevertheless, overall low CEs of 10–30% are achieved, which is expected given the vigorous H2 evolution complementing the alloy deposition process. Similar low CEs were obtained in previous reports on the electrodeposition of Mn-containing alloys [9,11,17,46].
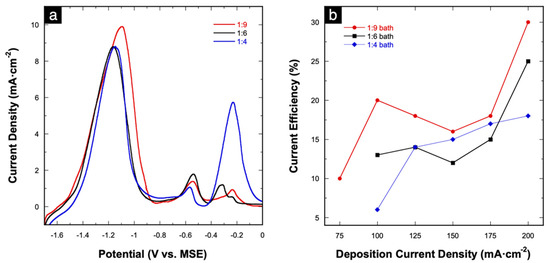
Figure 6.
(a) Anodic stripping curves of Cu-Mn alloys electrodeposited at 175 mA⋅cm−2 from different deposition baths; (b) relationship between current efficiency versus applied deposition current density in each deposition bath.
The morphology of the alloys obtained from the 1:6 bath is shown in Figure 7. The overall surface morphologies resemble those obtained from the 1:9 bath (Figure 3). Regardless of the deposition current density, a type I crystalline coating is achieved. Additionally, alloys deposited from the 1:6 bath also appear to have less microcracks between the grain deposits. The morphology of the alloys deposited from the 1:4 bath is presented in Figure 8. The structure obtained at 100 mA⋅cm−2 shows clusters of Cu deposits which corresponds well with the EDS results. At 125 mA⋅cm−2, the Cu-Mn type I alloy coatings are observed on the area of the electrode where the EDS atomic composition is Cu27Mn73. On the Cu-rich side of the electrode, the morphology and atomic composition are like that obtained at 100 mA⋅cm−2. The morphology of the alloys deposited at 150, 175, and 200 mA⋅cm−2 are more homogenous and representative of type I Cu-Mn coatings. The surfaces of these alloys also have much smaller voids/gaps between grains. Additionally, comparing the morphologies of the alloys deposited from the three baths, the increase of the Cu content in the alloy has some smoothening effect on the grainy alloy surfaces. A similar trend was observed in the morphologies of electrodeposited Cu-Zn alloys with increasing Cu content [22].
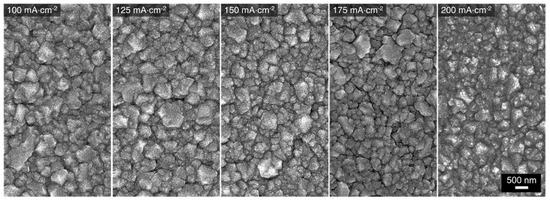
Figure 7.
SEM micrographs of Cu-Mn alloys electrodeposited at different applied current densities using the 1:6 deposition bath.
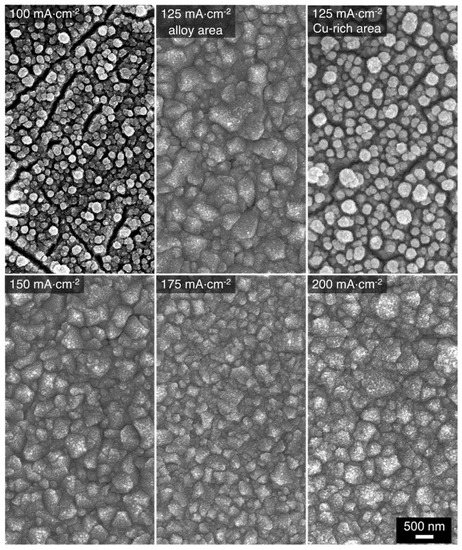
Figure 8.
SEM micrographs of Cu-Mn alloys electrodeposited at different applied current densities using the 1:4 deposition bath.
4. Conclusions
Cu-Mn alloys were electrodeposited on Au substrates as precursor alloys for the synthesis of nanoporous Cu. The deposition bath containing (NH4)2SO4 provided a complexing ammine ligand that efficiently shifts the deposition potential of Cu closer to that of Mn. This selective complexation was confirmed by UV-Vis spectroscopic and voltammetric studies. Galvanostatic deposition of Cu-Mn resulted in the formation of alloys with Mn content of ~70–85%. These alloys featured crystalline type I morphologies with specific atomic compositions (that are ideal for nanoporous Cu formation) which were obtained by simply changing the metal ion concentration ratio of Cu2+:Mn2+ in the deposition bath. The anodic stripping behavior of the alloys showed a three-stage dissolution process, where it was revealed that Cu-Mn dealloying undergoes a two-step process to form the nanoporous Cu structure. The results of this study provide substantial insight on the preparation of precursor Cu-Mn alloys with varying compositions that can be utilized to form nanoporous Cu with controlled thickness, morphology, and surface area.
Supplementary Materials
The following are available online at https://www.mdpi.com/article/10.3390/electrochem2030033/s1, Figure S1. (a) Polarization curves at −0.45 V and −0.74 V on Au substrate in 10 mM CuSO4 + 0.5 M (NH4)2SO4 at pH 6.5; (b) linear scan voltammograms depicting the stripping after the respective polarizations.; Figure S2, Potential-time curves obtained during the electrodeposition of Cu-Mn at different current densities using the (a) 1–9, (b) 1–6, and (c) 1–4 baths.
Author Contributions
E.C.: conceptualization, literature review, methodology, resources, data curation, validation, investigation, visualization, writing—original draft. N.D.: supervision, conceptualization, project administration, funding acquisition. All authors have read and agreed to the published version of the manuscript.
Funding
This research was funded by the Semiconductor Research Corporation (SRC) under CHIRP Task 2878.011.
Institutional Review Board Statement
Not applicable.
Informed Consent Statement
Not applicable.
Data Availability Statement
Data is contained within the article or supplementary material.
Conflicts of Interest
The authors declare no conflict of interest.
References
- Zhang, K.; Zhang, K.; Li, H.X.; Chen, G.N. Interface fracture behavior of electroplated coating on metal substrate under compressive strain. J. Mater. Process. Technol. 2009, 209, 1337–1341. [Google Scholar] [CrossRef][Green Version]
- Navinšek, B.; Panjan, P.; Milošev, I. PVD coatings as an environmentally clean alternative to electroplating and electroless processes. Surf. Coat. Technol. 1999, 116–119, 476–487. [Google Scholar] [CrossRef]
- Abedini, B.; Ahmadi, N.P.; Yazdani, S.; Magagnin, L. Structure and corrosion behavior of Zn-Ni-Mn/ZnNi layered alloy coatings electrodeposited under various potential regimes. Surf. Coat. Technol. 2019, 372, 260–267. [Google Scholar] [CrossRef]
- Gong, J.; Zangari, G.; Huang, K. Electrodeposition and Characterization of Sacrificial Copper-Manganese Alloy Coatings. J. Electrochem. Soc. 2004, 151. [Google Scholar] [CrossRef]
- Gong, J.; Wei, G.; Barnard, J.A.; Zangari, G. Electrodeposition and characterization of sacrificial copper-manganese alloy coatings: Part II. Structural, mechanical, and corrosion-resistance properties. Met. Mater. Trans. A 2005, 36, 2705–2715. [Google Scholar] [CrossRef]
- Broekaert, J.A. Daniel C. Harris: Quantitative Chemical Analysis; Springer: Berlin, Germany, 2015. [Google Scholar]
- Gong, J.; Zana, I.; Zangari, G. Electrochemical synthesis of crystalline and amorphous manganese coatings. J. Mater. Sci. Lett. 2001, 20, 1921–1923. [Google Scholar] [CrossRef]
- Ortiz, Z.; Díaz-Arista, P.; Meas, Y.; Ortega-Borges, R.; Trejo, G. Characterization of the corrosion products of electrodeposited Zn, Zn–Co and Zn–Mn alloys coatings. Corros. Sci. 2009, 51, 2703–2715. [Google Scholar] [CrossRef]
- Müller, C.; Sarret, M.; Andreu, T. Electrodeposition of Zn-Mn Alloys at Low Current Densities. J. Electrochem. Soc. 2002, 149, C600. [Google Scholar] [CrossRef]
- Ananth, M.V. Corrosion Studies on Electrodeposited Nickel-Manganese Coatings. Trans. IMF 1997, 75, 224–227. [Google Scholar] [CrossRef]
- Haerifar, M.; Zandrahimi, M. Effect of current density and electrolyte pH on microstructure of Mn–Cu electroplated coatings. Appl. Surf. Sci. 2013, 284, 126–132. [Google Scholar] [CrossRef]
- Gong, J.; Zangari, G. Electrodeposition of copper-manganese alloy coatings for sacrificial corrosion protection. ECS Trans. 2006, 1, 97. [Google Scholar] [CrossRef]
- Mangolini, F.; Magagnin, L.; Cavallotti, P. Pulse plating of Mn–Cu alloys on steel. J. Electrochem. Soc. 2006, 153, C623. [Google Scholar] [CrossRef]
- Gong, J.; Zangari, G. Increased Metallic Character of Electrodeposited Mn Coatings Using Metal Ion Additives. Electrochem. Solid-State Lett. 2004, 7, C91–C94. [Google Scholar] [CrossRef]
- Dean, R.; Graham, T.; Hayes, E.; Long, J.; Potter, E. The copper-manganese equilibrium system. ASM TRANS 1945, 34, 443–464. [Google Scholar]
- Wang, C.P.; Liu, X.J.; Ohnuma, I.; Kainuma, R.; Ishida, K. Thermodynamic assessments of the Cu–Mn–X (X: Fe, Co) systems. J. Alloy. Compd. 2007, 438, 129–141. [Google Scholar] [CrossRef]
- Gong, J.; Zangari, G. Electrodeposition and Characterization of Manganese Coatings. J. Electrochem. Soc. 2002, 149, C209–C217. [Google Scholar] [CrossRef]
- Mohan, K.; Shahane, N.; Liu, R.; Smet, V.; Antoniou, A. A Review of Nanoporous Metals in Interconnects. JOM 2018, 70, 2192–2204. [Google Scholar] [CrossRef]
- Mohan, K.; Shahane, N.; Raj, P.M.; Antoniou, A.; Smet, V.; Tummala, R. Low-temperature, organics-free sintering of nanoporous copper for reliable, high-temperature and high-power die-attach interconnections. In Proceedings of the 2017 IEEE Applied Power Electronics Conference and Exposition (APEC), Tampa, FL, USA, 26–30 March 2017; pp. 3083–3090. [Google Scholar]
- Erlebacher, J.; Aziz, M.J.; Karma, A.; Dimitrov, N.V.; Sieradzki, K. Evolution of nanoporosity in dealloying. Nature 2001, 410, 450–453. [Google Scholar] [CrossRef]
- Jia, F.; Yu, C.; Deng, K.; Zhang, L. Nanoporous Metal (Cu, Ag, Au) Films with High Surface Area: General Fabrication and Preliminary Electrochemical Performance. J. Phys. Chem. C 2007, 111, 8424–8431. [Google Scholar] [CrossRef]
- Castillo, E.; Dimitrov, N. Electrodeposition of Zn-rich CuxZn(1−x) Films with Controlled Composition and Morphology. J. Electrochem. Soc. 2021, 168, 062513. [Google Scholar] [CrossRef]
- Qi, Z.; Zhao, C.; Wang, X.; Lin, J.; Shao, W.; Zhang, Z.; Bian, X. Formation and Characterization of Monolithic Nanoporous Copper by Chemical Dealloying of Al−Cu Alloys. J. Phys. Chem. C 2009, 113, 6694–6698. [Google Scholar] [CrossRef]
- Wang, Z.; Liu, J.; Qin, C.; Liu, L.; Zhao, W.; Inoue, A. Fabrication and new electrochemical properties of nanoporous Cu by dealloying amorphous Cu–Hf–Al alloys. Intermetallics 2015, 56, 48–55. [Google Scholar] [CrossRef]
- Hayes, J.; Hodge, A.; Biener, J.; Hamza, A.; Sieradzki, K. Monolithic nanoporous copper by dealloying Mn–Cu. J. Mater. Res. 2006, 21, 2611–2616. [Google Scholar] [CrossRef]
- Harris, D.C. Quantitative Chemical Analysis; Macmillan: New York, NY, USA, 2010. [Google Scholar]
- Enhessari, M.; Salehabadi, A.; Maarofian, K.; Khanahmadzadeh, S. Synthesis and physicochemical properties of CuMn. Int. J. Bio-Inorg. Hybr. Nanomater 2016, 5, 115–120. [Google Scholar]
- Rahimi, M.; Schoener, Z.; Zhu, X.; Zhang, F.; Gorski, C.A.; Logan, B.E. Removal of copper from water using a thermally regenerative electrodeposition battery. J. Hazard. Mater. 2017, 322, 551–556. [Google Scholar] [CrossRef]
- Joi, A.; Akolkar, R.; Landau, U. Pulse Electrodeposition of Copper-Manganese Alloy for Application in Interconnect Metallization. J. Electrochem. Soc. 2013, 160, D3145–D3148. [Google Scholar] [CrossRef]
- Clark, D.S. Electrolytic manganese and its alloys. Eng. Sci. 1952, 15, 4. [Google Scholar]
- Fernández-Barcia, M.; Hoffmann, V.; Oswald, S.; Giebeler, L.; Wolff, U.; Uhlemann, M.; Gebert, A. Electrodeposition of manganese layers from sustainable sulfate based electrolytes. Surf. Coat. Technol. 2018, 334, 261–268. [Google Scholar] [CrossRef]
- Chiang, W.-S.; Huang, J.-Q.; Chen, P.-C.; Wu, P.-W.; Joi, A.; Dordi, Y. Pulse electrodeposition of copper-manganese alloy in deep eutectic solvent. J. Alloy. Compd. 2018, 742, 38–44. [Google Scholar] [CrossRef]
- Simka, W.; Puszczyk, D.; Nawrat, G. Electrodeposition of metals from non-aqueous solutions. Electrochim. Acta 2009, 54, 5307–5319. [Google Scholar] [CrossRef]
- Krishnan, A.; Gopinath, K.P.; Vo, D.-V.N.; Malolan, R.; Nagarajan, V.M.; Arun, J. Ionic liquids, deep eutectic solvents and liquid polymers as green solvents in carbon capture technologies: A review. Environ. Chem. Lett. 2020, 18, 1–24. [Google Scholar] [CrossRef]
- Lu, J.; Dreisinger, D.; Glück, T. Manganese electrodeposition—A literature review. Hydrometallurgy 2014, 141, 105–116. [Google Scholar] [CrossRef]
- Mohan, K.; Shahane, N.; Sosa, R.; Khan, S.; Raj, P.M.; Antoniou, A.; Smet, V.; Tummala, R. Demonstration of Patternable All-Cu Compliant Interconnections with Enhanced Manufacturability in Chip-to-Substrate Applications. In Proceedings of the 2018 IEEE 68th Electronic Components and Technology Conference (ECTC), Marina, CA, USA, 29 May–1 June 2018; pp. 301–307. [Google Scholar]
- Wittstock, A.; Biener, J.; Baeumer, M. Nanoporous gold: A new material for catalytic and sensor applications. Phys. Chem. Chem. Phys. 2010, 12, 12919–12930. [Google Scholar] [CrossRef]
- Herrero, E.; Clavilier, J.; Feliu, J.; Aldaz, A. Influence of the geometry of the hanging meniscus contact on the hydrogen oxidation reaction on a Pt(111) electrode in sulphuric acid. J. Electroanal. Chem. 1996, 410, 125–127. [Google Scholar] [CrossRef]
- Grant, D.; Kollrack, R. Absorption spectra and configuration of the ammine complexes of copper (II). J. Inorg. Nucl. Chem. 1961, 23, 25–29. [Google Scholar] [CrossRef]
- Nam, D.H.; Kim, R.; Han, D.; Kim, J.; Kwon, H. Effects of (NH4)2SO4 and BTA on the nanostructure of copper foam prepared by electrodeposition. Electrochim. Acta 2011, 56, 9397–9405. [Google Scholar] [CrossRef]
- Bard, A. Standard Potentials in Aqueous Solution; Routledge: Oxfordshire, UK, 2017. [Google Scholar]
- Roy, S.; Matlosz, M.; Landolt, D. Effect of corrosion on the composition of pulse-plated Cu-Ni alloys. J. Electrochem. Soc. 1994, 141, 1509. [Google Scholar] [CrossRef]
- Bradley, P.; Landolt, D. A surface coverage model for pulse-plating of binary alloys exhibiting a displacement reaction. Electrochim. Acta 1997, 42, 993–1003. [Google Scholar] [CrossRef]
- Xu, N.; Liu, Z.-H.; Ma, X.; Qiao, S.; Yuan, J. Controlled synthesis and characterization of layered manganese oxide nanostructures with different morphologies. J. Nanoparticle Res. 2008, 11, 1107–1115. [Google Scholar] [CrossRef]
- Zheng, J.; Zhang, S.; Liu, W.; Xing, Y. Influence of alloy composition on nanoporous structure by dealloying Mn-Cu ribbons. Rare Met. 2011, 30, 370–374. [Google Scholar] [CrossRef]
- Sylla, D.; Savall, C.; Gadouleau, M.; Rebere, C.; Creus, J.; Refait, P. Electrodeposition of Zn–Mn alloys on steel using an alkaline pyrophosphate-based electrolytic bath. Surf. Coat. Technol. 2005, 200, 2137–2145. [Google Scholar] [CrossRef]


Publisher’s Note: MDPI stays neutral with regard to jurisdictional claims in published maps and institutional affiliations. |
© 2021 by the authors. Licensee MDPI, Basel, Switzerland. This article is an open access article distributed under the terms and conditions of the Creative Commons Attribution (CC BY) license (https://creativecommons.org/licenses/by/4.0/).