1. Introduction
Urban lighting has undergone a rapid transition toward LED technology during the last decade [
1]. Municipalities have been replacing traditional high-pressure sodium and metal-halide luminaires with LED systems in search of higher energy efficiency, longer lifetimes, reduced maintenance, and improved controllability [
2]. Beyond these practical benefits, LED luminaires also offer narrower optical beams and more precise light steering due to the small size of the emitter and the availability of secondary optics [
3]. These characteristics have driven a profound transformation in the photometric design of streets, cycle lanes and pedestrian areas [
4]. However, together with these advantages, new visual challenges have emerged, particularly those related to the perception of glare in outdoor environments [
5].
Glare is a phenomenon that limits visual comfort and safety in lighting applications [
6]. The descriptions of glare contained in CIE 117 were developed at a time when light sources with uniform relative luminance predominated [
7]. The behaviour of LED luminaires used in street lighting differs from this definition, as their high illuminance peaks, compact emitting surfaces and directional patterns mean that their glare behaviour depends more on the geometry of the observer than that of traditional technologies, causing two observers located only a few degrees apart to perceive the same luminaire very differently [
8,
9]. This effect is clear in urban environments where pedestrians, cyclists and drivers interact with the same lighting installation, but from different heights, distances and directional lines of sight [
10].
Several studies have attempted to characterize discomfort glare produced by LED luminaires, although most of them rely on fixed evaluation conditions [
11]. For example, many works evaluate glare assuming a reference observer placed near the axis of maximum luminous intensity [
12]. Others apply the Unified Glare Rating (UGR) using the standard tabular method, which prescribes a limited set of geometric situations [
13]. These approaches are useful for normative assessment but provide only partial insight into the angular sensitivity of glare perception [
14]. In real streets, the observer position changes continuously, especially for mobile users such as cyclists and drivers [
15]. As users move along the roadway or sidewalk, the angle under which they view the luminaire also varies, and so does the luminance distribution that reaches their eyes [
16]. This dynamic component is still insufficiently represented in the literature [
14].
The lack of angularly resolved glare analysis is partly due to the complexity of real photometric distributions [
17]. Each luminaire model has its own intensity pattern, often provided as detailed IES or Eulumdat files with hundreds of measurement points [
18]. Although accurate, these data make it difficult to isolate the fundamental optical parameters that drive glare behaviour [
19]. Some authors have proposed parametric models, but they are typically aimed at luminaire design rather than perceptual evaluation [
20]. As a result, there is a need for simplified, physically meaningful models that capture the essential features of LED photometry while enabling analytical or semi-analytical glare calculations [
21].
One such model is the cosine-power distribution, expressed as
. This function, widely used in optical engineering to approximate directional emitters, offers a balance between simplicity and expressiveness [
22]. With only one exponent m, it can represent a broad range of beam spreads, from wide diffuse patterns to narrow forward-throw distributions [
23]. For LED street luminaires, typical values of m fall in a range that produces realistic angular attenuation without requiring large data sets [
21]. Moreover, because the model is inherently smooth and symmetric, it facilitates analytical integration, geometric manipulation, and interpretation of angular effects [
5,
24]. Despite these advantages, the cosine-power distribution has rarely been used in the context of outdoor glare assessment.
The present work addresses this gap by applying a cosm photometric model to study how glare varies with the observer angle of view. Rather than evaluating glare at a single geometric condition, we compute the luminance perceived by an observer positioned at multiple angular displacements from the luminaire optical axis. For each position, we derive the corresponding UGR value using a patch-based luminance integration and the Guth position index, ensuring consistency with established glare theory while allowing continuous angular variation. This approach offers a clearer view of how small changes in viewing direction affect the perception of LED luminaires in urban contexts.
An additional contribution of this study is the integration of three representative types of urban users: pedestrians, cyclists, and drivers. These groups differ not only in viewing height but also in typical distances to the luminaire and in the angular ranges they encounter during normal movement. By modelling each observer profile separately, we reveal how glare sensitivity shifts across the urban population and how a luminaire that appears comfortable for one group may be disturbing for another. This multi-observer framework provides insight into an aspect of urban lighting that is often overlooked: equity in visual comfort, referring to the equitable distribution of discomfort glare among pedestrians, cyclists, and drivers exposed to the same lighting installation.
The objective of the work is therefore twofold. First, we aim to develop a unified and computationally simple model capable of quantifying angle-dependent glare produced by LED luminaires. Second, we apply this model to compare the glare experienced by pedestrians, cyclists, and drivers, identifying how their viewing geometry conditions influence UGR trends. The methodology, though simplified, is sufficiently general to be extended to more complex photometric distributions or to support adaptive lighting strategies in future developments.
2. Materials and Methods
2.1. Photometric Assumptions and Angular Model
The luminous intensity distribution of the LED luminaire is described using an analytical cosine-power function of the form [
22,
25,
26]:
where
θ is the elevation angle measured from the luminaire optical axis. The photometric properties of the luminaire are assumed to be fixed and independent of the observer position.
In order to account for the effect of observer geometry on glare perception, an effective angular parameter is introduced. This parameter does not represent a physical modification of the luminaire emission, but rather the apparent angular extent of the luminous beam contributing to glare for a given observer–luminaire configuration.
The effective angular width is defined as:
where
is the manufacturer-specified half-beam angle, and
α represents the relative angular displacement between the observer line of sight and the luminaire optical axis.
Accordingly, the analytical model does not attempt to reproduce the detailed radiance distribution of a specific commercial luminaire, but rather to provide a controlled and interpretable framework for analyzing angular glare sensitivity.
The parameter therefore represents the apparent beam edge as perceived by the observer, incorporating both the intrinsic optical spread of the luminaire and the geometrical viewing conditions. This formulation allows the angular sensitivity of glare to be explored without altering the physical photometry of the source.
For each value of α, the cosine-power exponent
m is determined by imposing [
23]:
It should be emphasized that the exponent m is treated as an effective modelling parameter that reflects the angular portion of the emission relevant for glare perception under a given observer geometry, rather than a physical change in the luminaire emission.
The choice of the half-intensity criterion in Equation (3) provides an operational definition of the effective beam edge that enables a compact analytical description of angular redistribution. This definition is adopted for mathematical convenience and repeatability and should not be interpreted as a perceptual glare threshold. Consequently, variations in the cosine-power exponent m are intended to represent effective changes in angular attenuation associated with observer-luminaire geometry, rather than a full physical model of luminaire aiming, beam shaping, or optical cut-off characteristics.
This procedure ensures that the effective angular redistribution associated with the observer geometry is treated consistently across all configurations, while preserving the total luminous flux normalization of the analytical model [
23]:
where
Φ = 10,000 lm is the total luminous flux of LED luminaire.
This separation between intrinsic photometry and observer-dependent geometry is maintained throughout the methodology.
2.2. Discretization of the Emitting Surface
To ensure physical and geometrical consistency, the emitting aperture of the luminaire is defined by a single physical area:
subdivided into a uniform grid of 20 × 20 patches.
For the coordinates
of each patch centre, the geometric area per element is:
With N = 400 the number of cells.
The discretization resolution of 20 × 20 patches was verified to provide stable UGR values, with no singular behavior observed for the considered observer geometries.
2.3. Observer Locations and Viewing Geometry
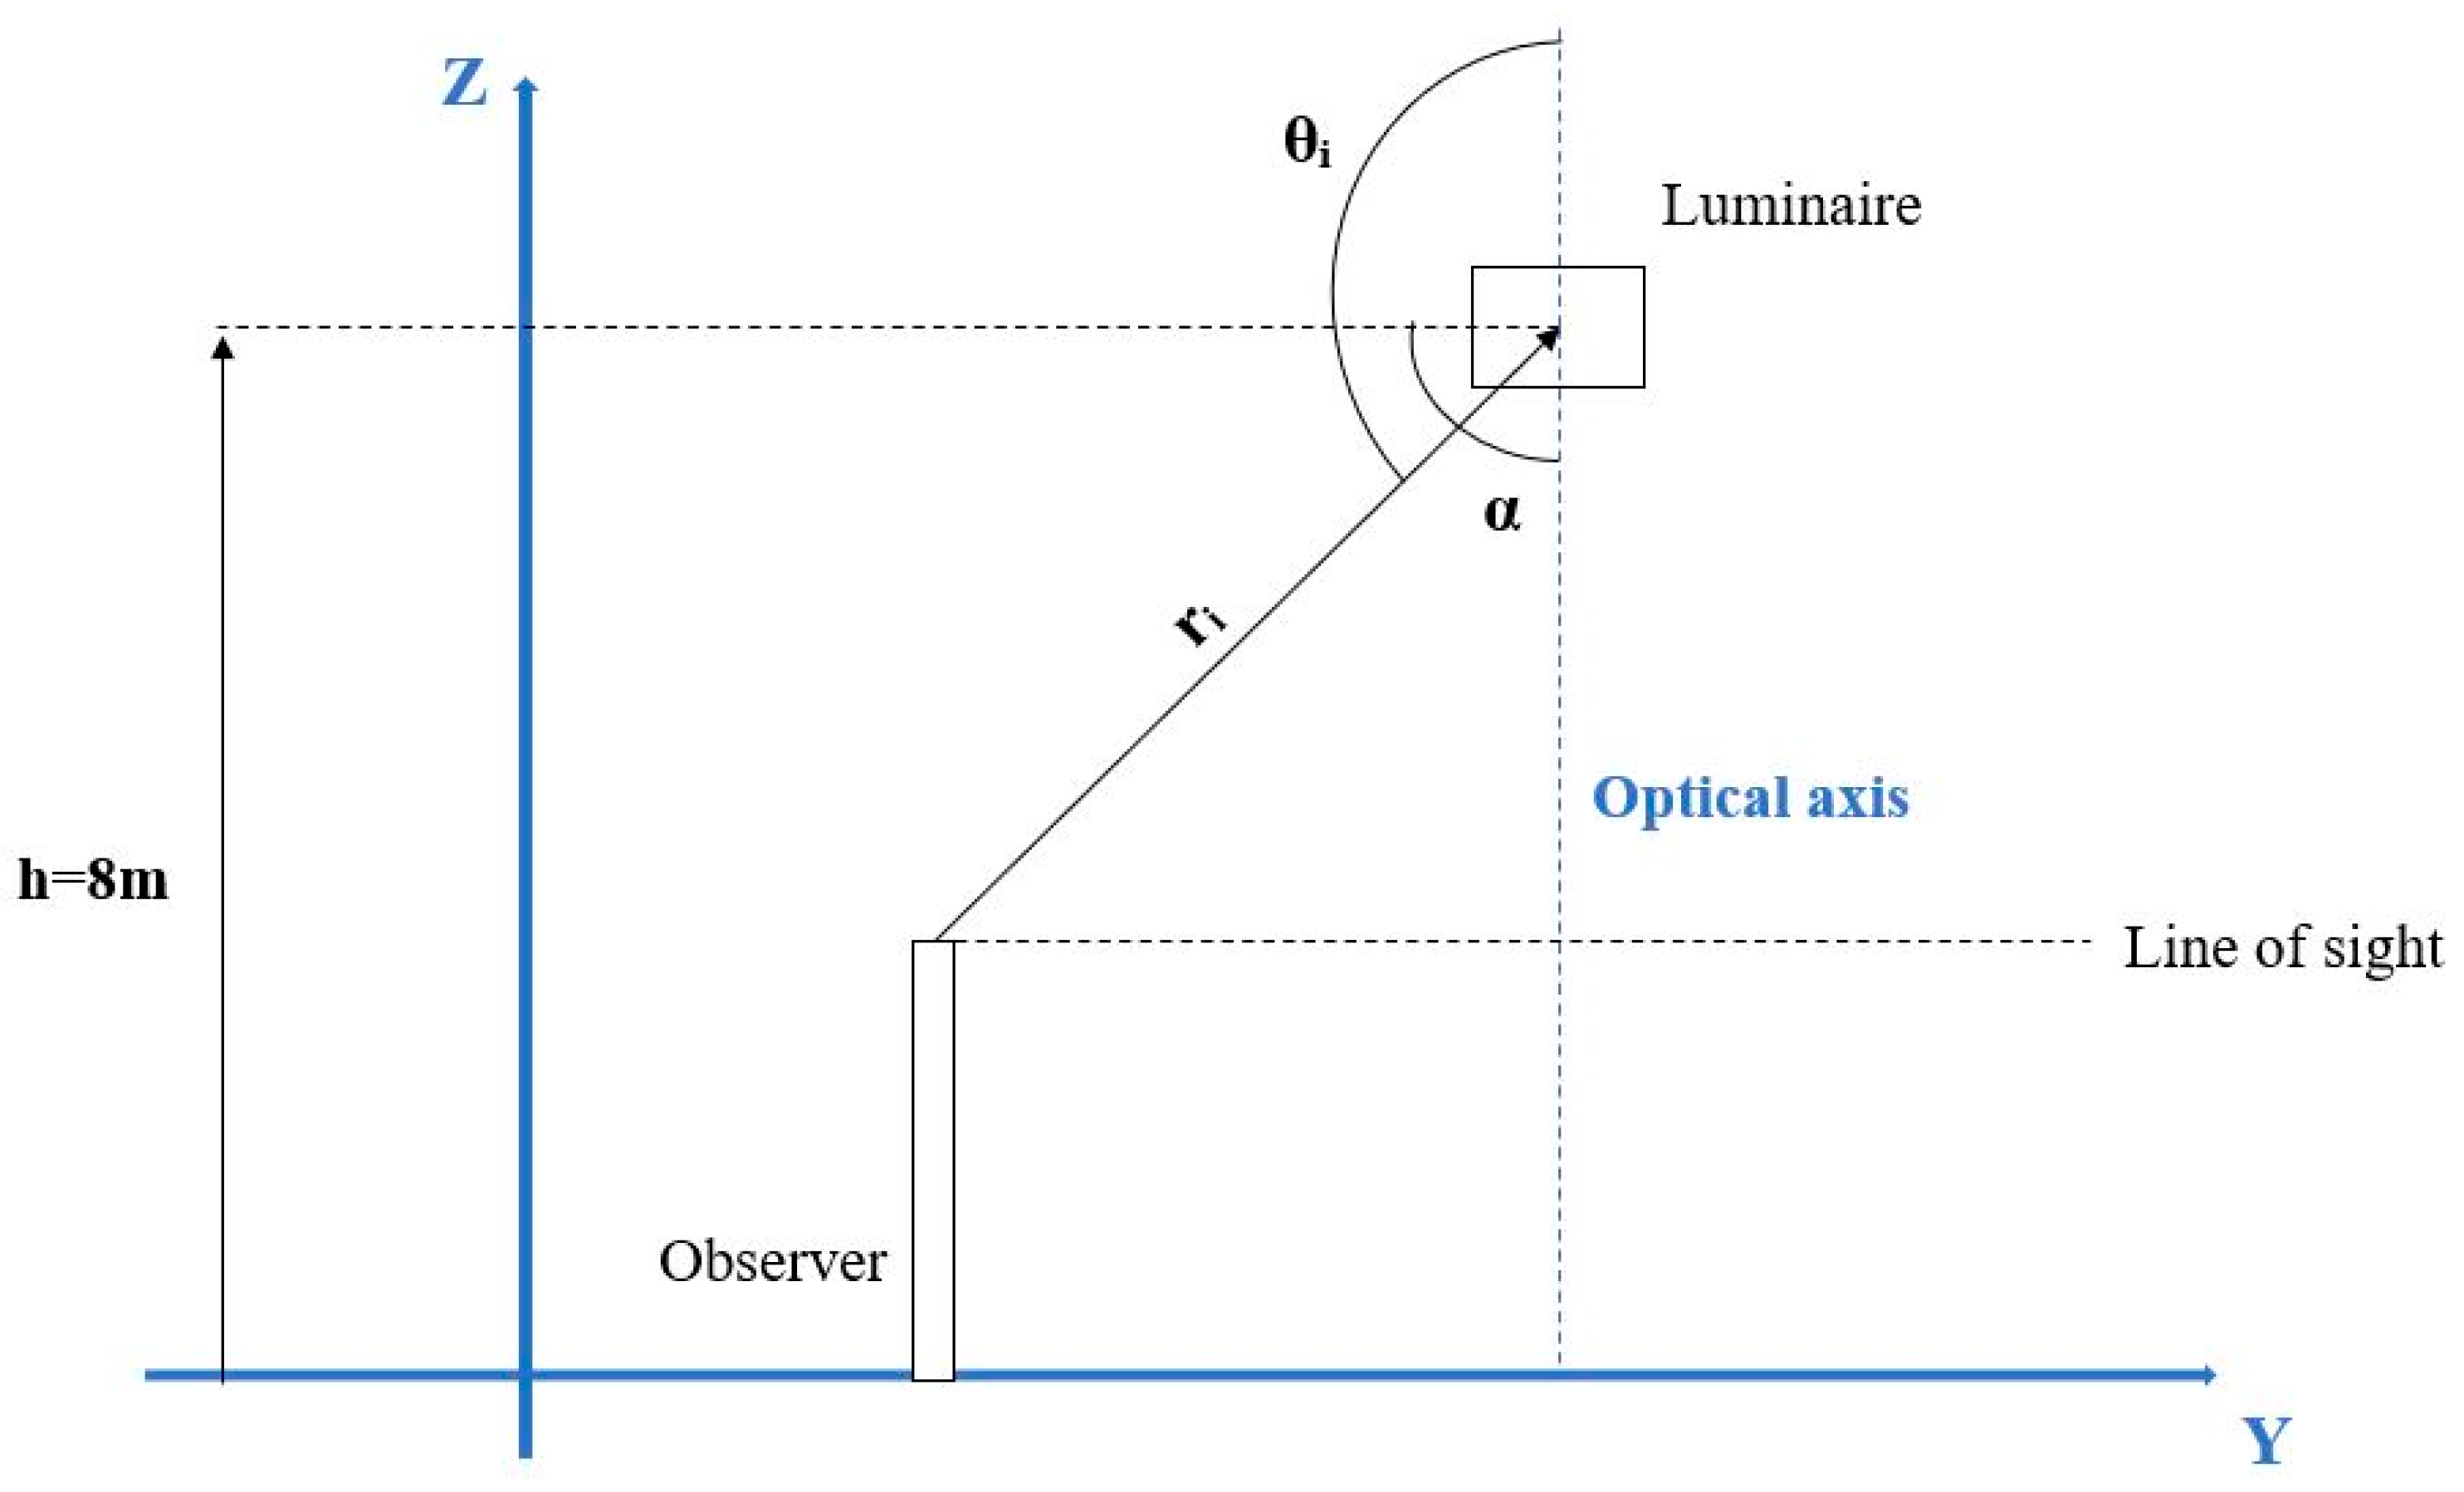
Figure 1 illustrates the geometric configuration adopted in this study. The angle
θi is defined as the angular displacement between the observer line of sight and the optical axis, and is consistently used in both luminance and Guth position index evaluations.
The luminaire is located at height emits along the optical axis. The observer line of sight forms an angle θi with respect to the optical axis for each emitting patch, at a distance ri. The parameter α represents the angular redistribution of the luminous intensity relative to the optical axis.
Three observers were defined to represent typical urban users: a pedestrian, a cyclist, and a driver.
The luminaire is placed at with .
The observer coordinates are:
For each patch
i, the distance to the observer is [
27]:
The cosine of the local angle between the patch normal (pointing downward) and the line of sight is:
The corresponding angular position is:
These quantities are computed independently for each of the three observers.
2.4. Patch Luminance and Solid Angle
The directional intensity emitted by patch
i in the direction of the observer is [
25,
26]:
The luminance of the patch is obtained by:
where the cosine term accounts for the projected emitting area in the viewing direction.
The projected solid angle of patch
i is approximated by:
This expression corresponds to the standard projection of a small planar element into the observer field of view.
Using the same patch area consistently in both and expressions avoids arbitrary scaling of UGR and ensures dimensional coherence of glare formulation.
2.5. Guth Position Index
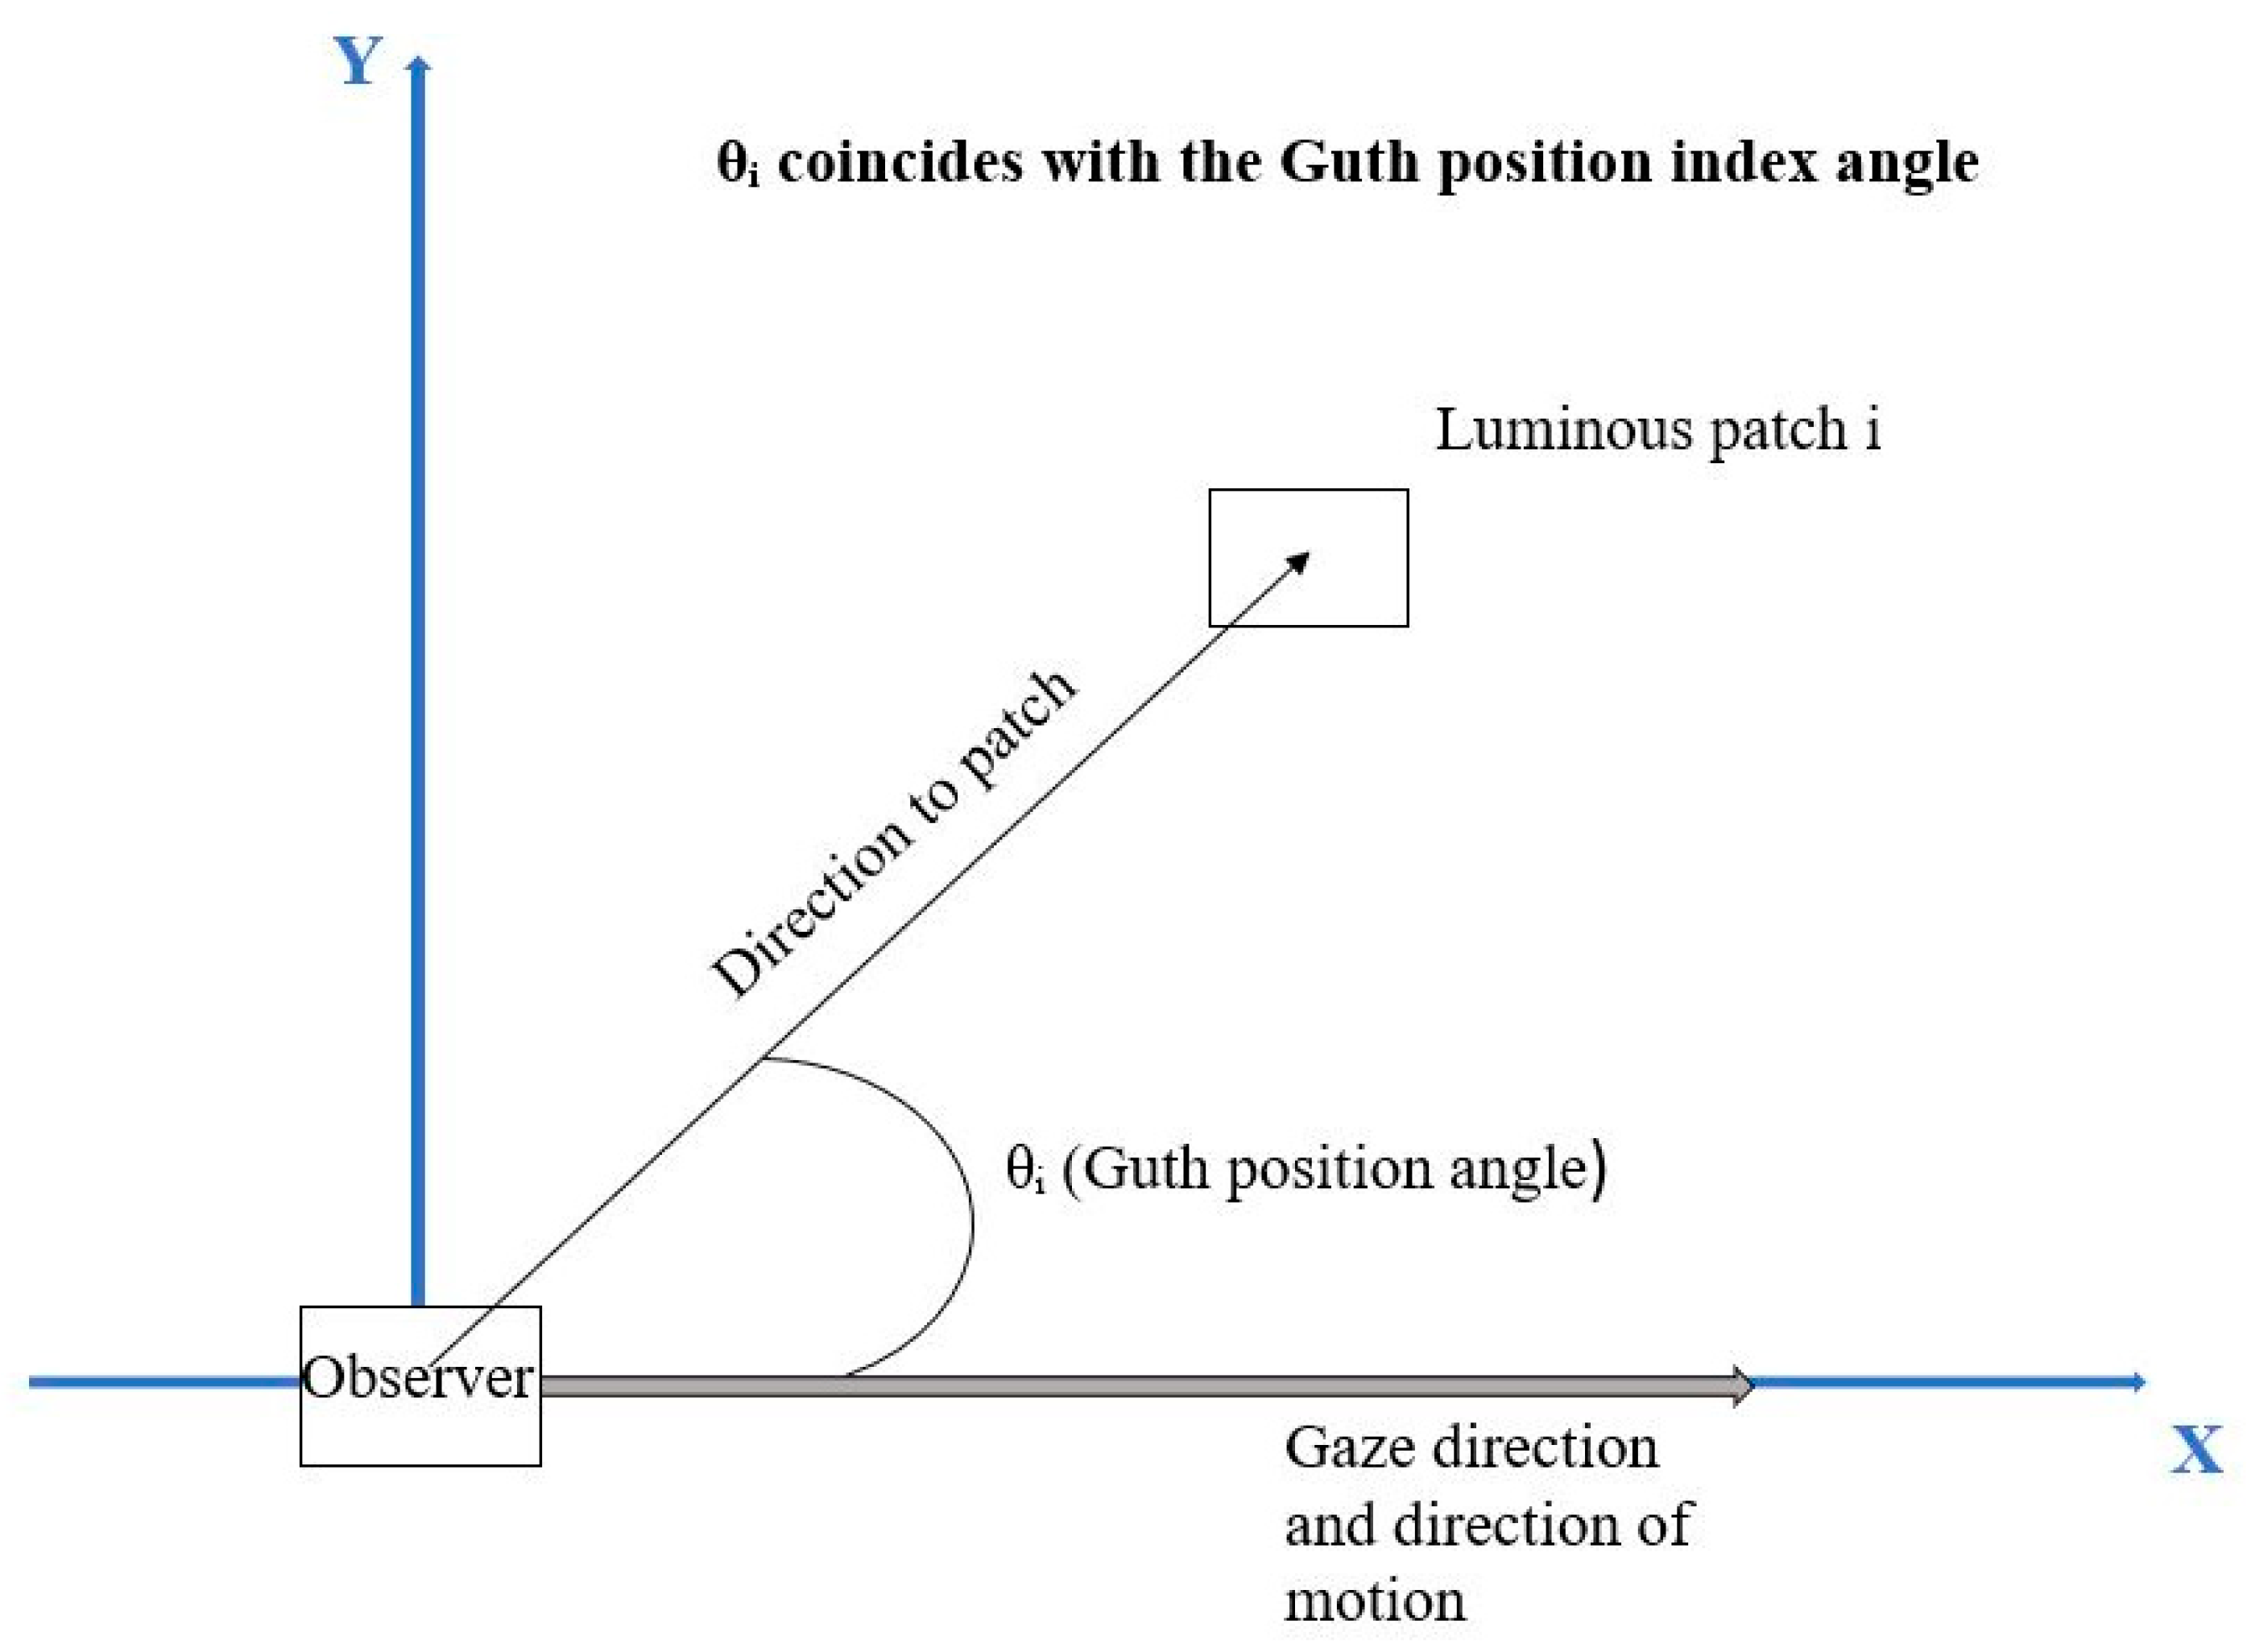
In this study, the observer line of sight is assumed to be horizontal and aligned with the direction of motion, which is a common approximation for pedestrian, cyclists and drivers in urban road lighting conditions.
Under this assumption, the angular displacement relevant to the Guth position index is defined as the angle between the observer line of sight and the direction toward each luminous patch.
With the adopted geometry, this angular displacement coincides with the patch-observer angle
. Therefore, the Guth position index can be consistently expressed as a function of
, and the standard CIE-recommended Guth tables can be applied directly using this angular definition, as can be seen in
Figure 2The observer gaze direction is assumed to be horizontal and aligned with the direction of motion. The angle θi is defined as the angular displacement between the observer line of sight and the direction toward each luminous patch, and coincides with the angular variable used in the CIE-recommended Guth position index tables.
The position-dependent weighting factor used in the UGR formulation is the Guth position index
. Since the Guth function is tabulated at discrete angles, the values were obtained by linear interpolation [
28]:
where
are the CIE-recommended tabulated angles and corresponding index values. Interpolation ensures continuity and avoids numerical artefacts across patches.
2.6. Unified Glare Rating (UGR)
The glare level for each observer and angle α is obtained using the classical CIE expression applied patch-wise [
14,
29]:
where
is the background luminance.
The background luminance was fixed at , a reference value commonly adopted in standardized glare evaluations. Although background luminance in outdoor road lighting can vary significantly depending on road class, surroundings, and adaptation level, a constant value was intentionally used in this study to isolate the effect of angular beam redistribution and observer geometry. As a consequence, the reported UGR values should be interpreted in a comparative sense, focusing on relative trends with respect to the angular parameter α, rather than as absolute predictions of discomfort glare under specific outdoor conditions. Variations in would shift the absolute UGR levels but would not alter the qualitative trends discussed in this work.
The summation extends over all 400 surface patches.
The formulation is strictly equivalent to the continuous UGR expression but discretized over the emitter geometry.
2.7. Relative Illuminance
The horizontal illuminance at the observer eye point is estimated through [
30]:
which corresponds to the superposition of individual patch contributions.
The result is given in relative units, since the study focuses on the angular trend with α rather than on absolute lux values.
3. Results
3.1. Unified Glare Rating (UGR) Comparison
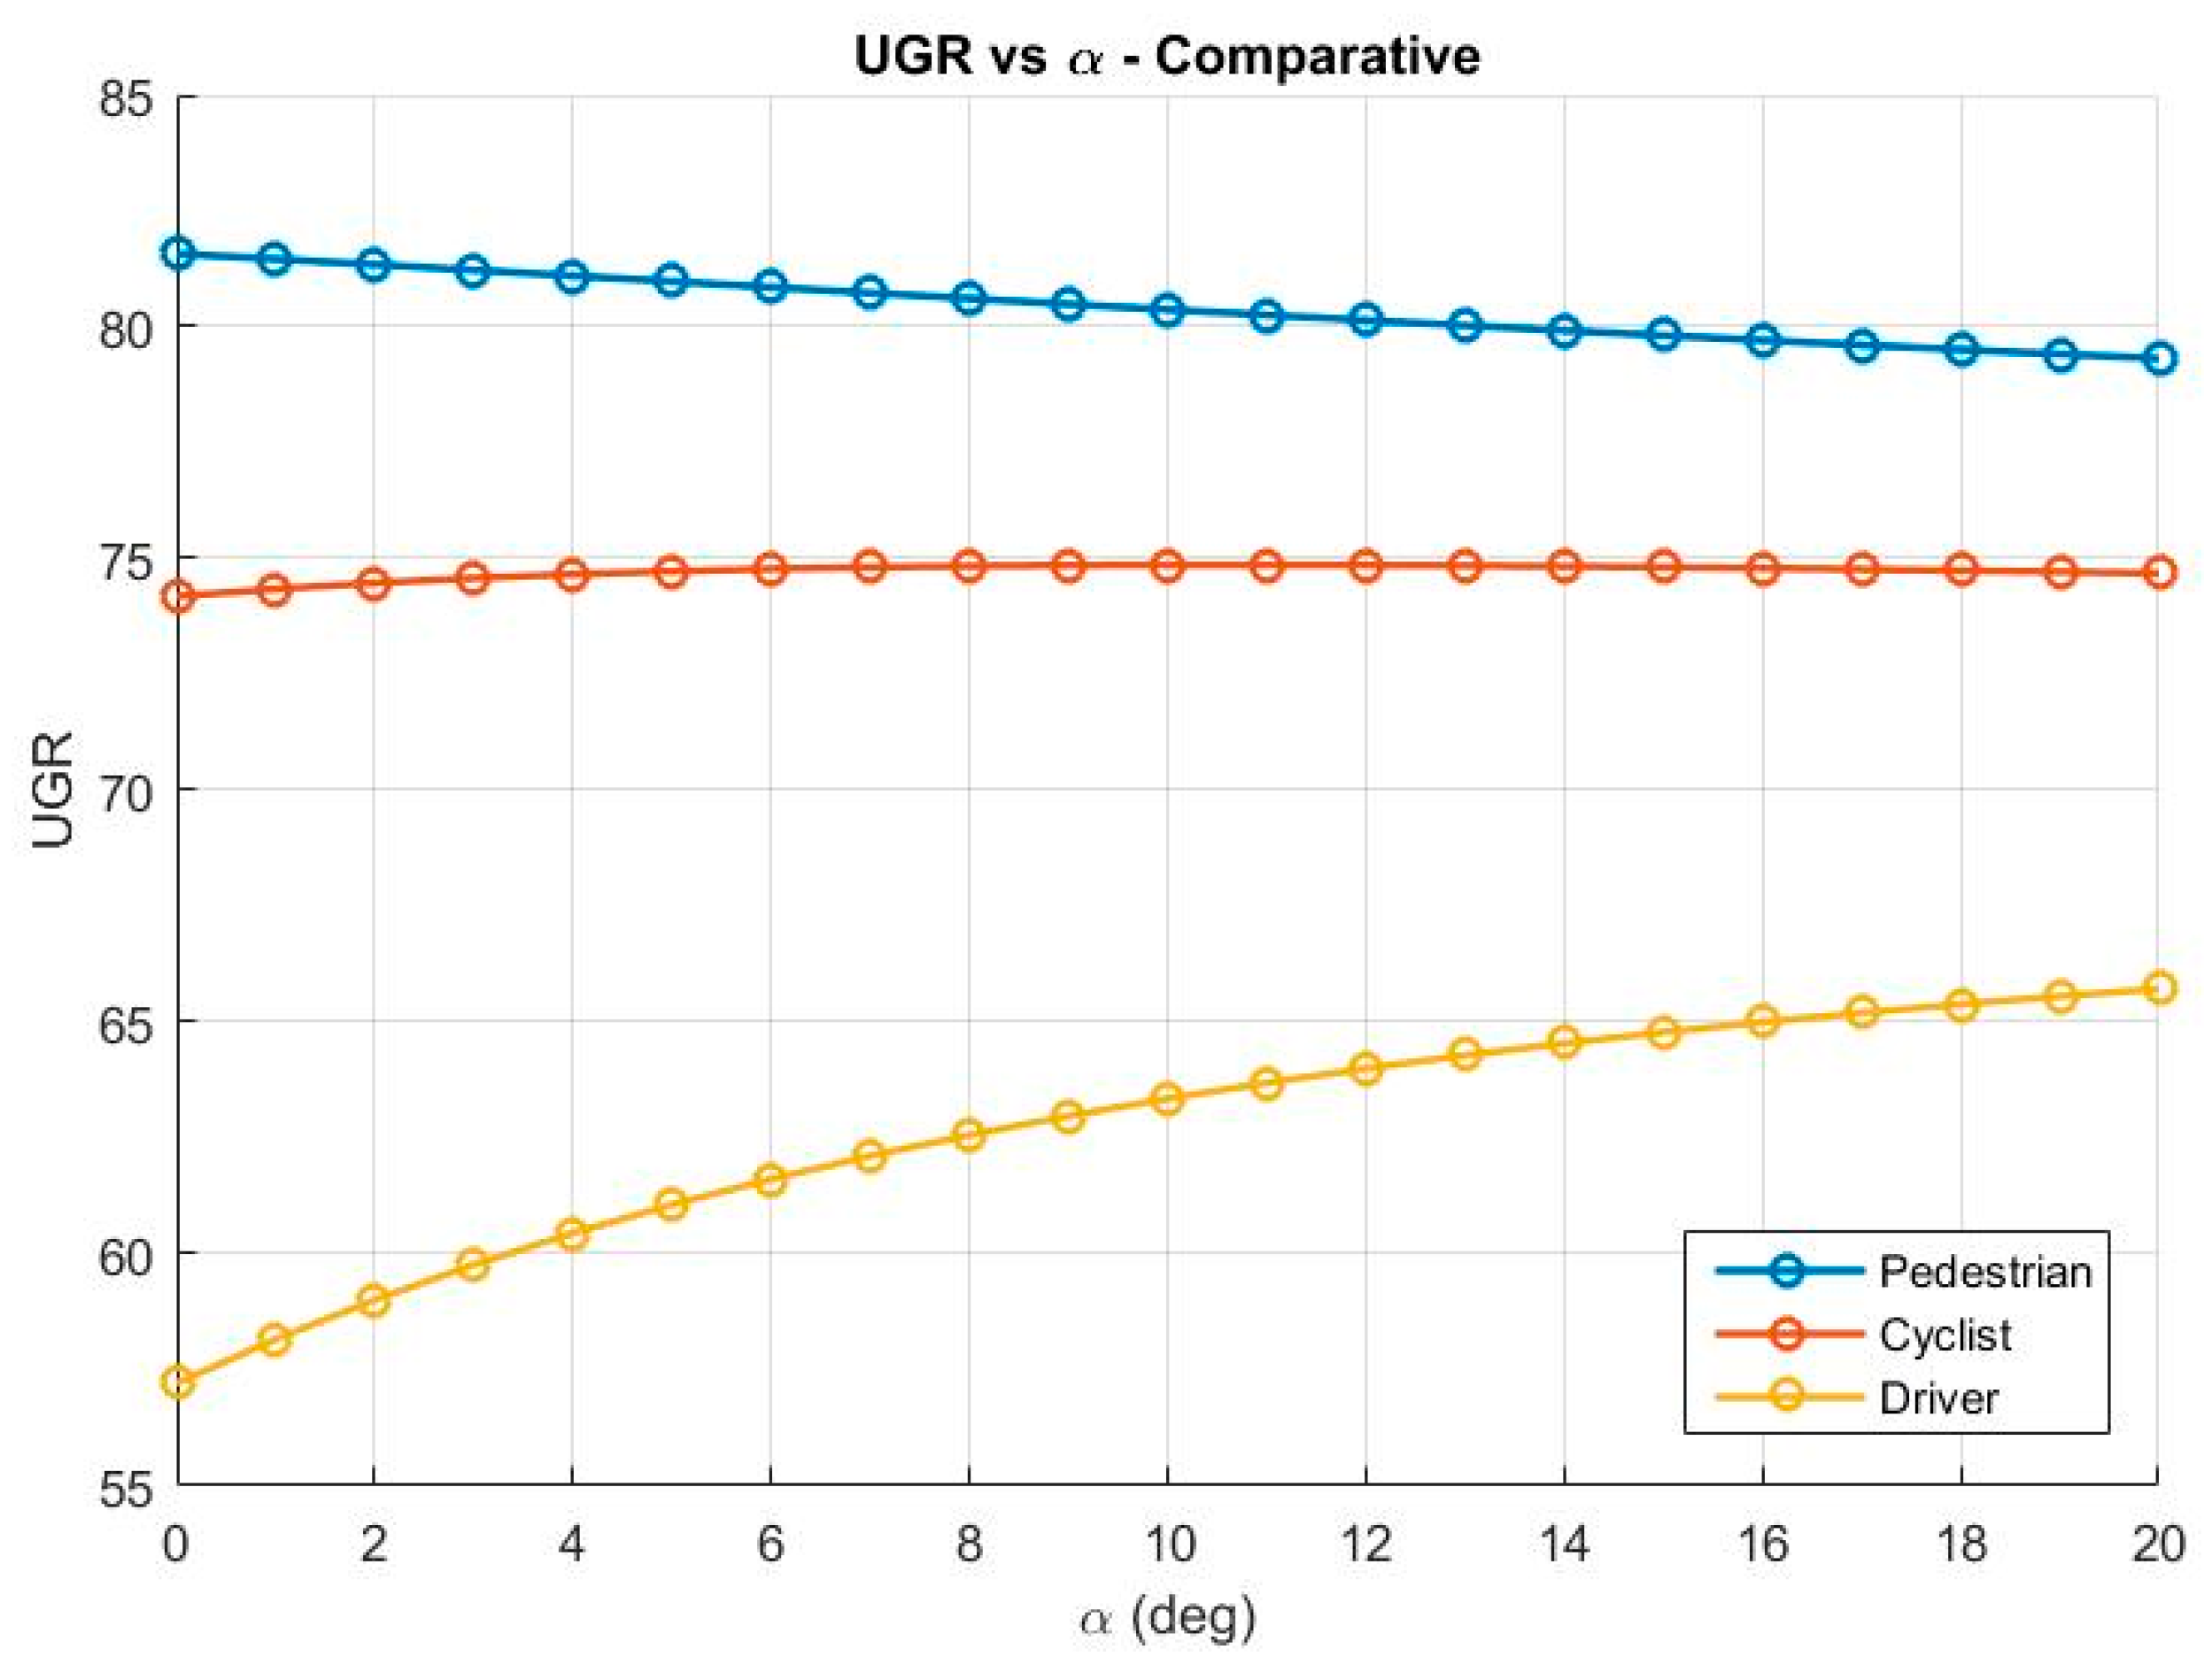
Figure 3 shows the evolution of the UGR for the three observers considered (pedestrian, cyclist, and driver). This figure clearly shows how the variation in the UGR with respect to α is moderate, which will allow the behavior of each observer to be adequately distinguished.
Regarding the pedestrian graph, it can be deduced that the UGR decreases linearly and progressively as the value of α increases. The most notable decrease is observed in the first degrees of deviation and leads to more stable values. This means that the perceived glare is reduced from this position, which is high and frontal with respect to the light projector.
The cyclist UGR shows very little variation in each of the values analyzed, and as can be seen in
Figure 3, the curve remains practically stable, indicating that small turns of the optical system barely modify the glare from the angle that characterizes this observer.
On the other hand, regarding the driver, it is clear that the UGR increases gradually as the projector moves angularly. The slope is gentler in the first degrees of α and steeper at higher values, indicating an increase in glare for this observer, who is characterized by a low line of sight close to the horizon.
The differences between the graphs are due to the relative geometry between the observer and the front of the luminaire. The displacement of the beam moves the maximum intensity away from the pedestrian field of vision, barely altering the portion of the beam that intersects with the cyclist and providing a greater concentration of luminance towards the driver.
These results indicate that the UGR is sensitive to changes in the orientation of the projector and is dependent on the position of the observer, yielding three different behaviors, as shown in
Figure 3.
3.2. Relative Illuminance E (α) Comparison
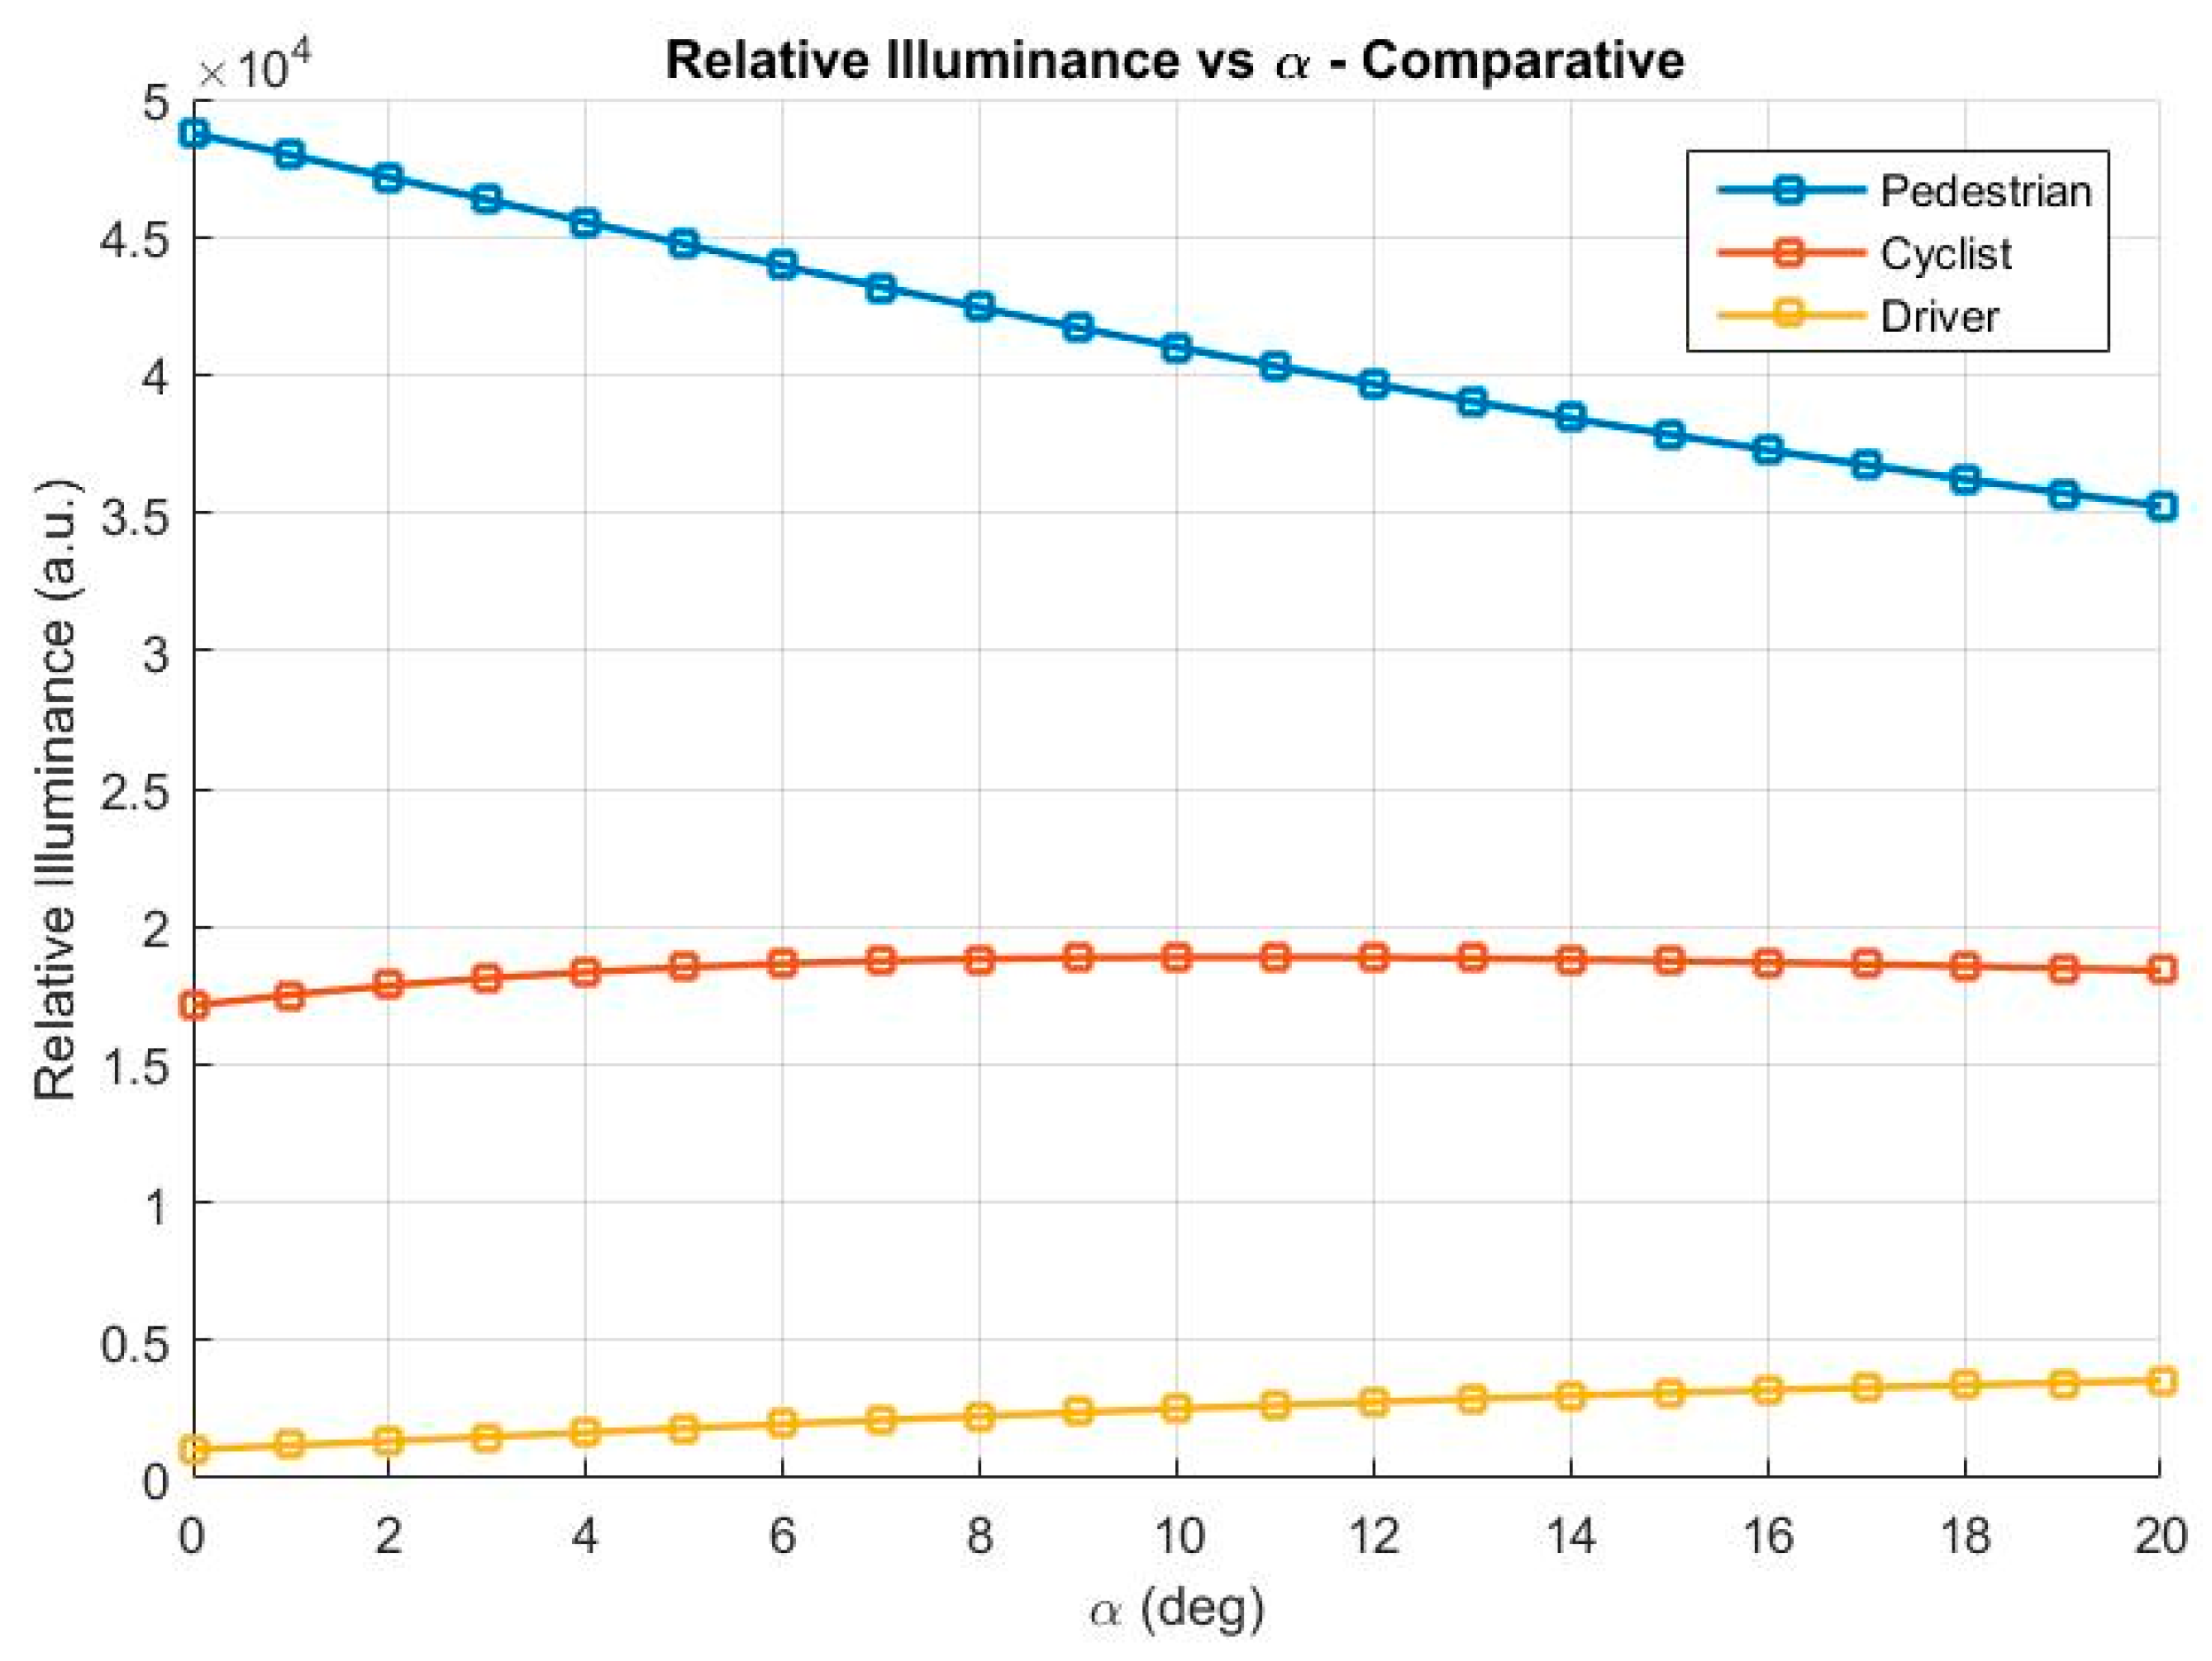
Figure 4 represents the variation in relative illuminance as a function of the orientation angle α for the three observers analyzed (pedestrian, cyclist, and driver). This variable analyses the amount of flux reaching a given point and allows us to evaluate how the angular redistribution of the beam affects the level of illumination available.
Relative illuminance is given in arbitrary units (a.u.), indicating that the values are proportional to illuminance but not expressed in lux, as the study focuses on comparative trends between observers.
The graph of relative illuminance for pedestrian shows a progressive decrease as the value of angle α increases, with the value of this variable being highest at the first value α, when the main axis of the beam coincides with the vertical. This shows a loss of concentration of the flux in directions close to the normal of the luminaire, which then reduces the direct contribution in nearby and elevated positions.
Regarding the cyclist, the illuminance shows a more moderate variation and its values oscillate within a small range, with the greatest increase at intermediate angles and then stabilizing. This indicates that the cyclist is in an angular region where changes in beam orientation have little influence on the effective projection of the flux.
Finally, it can be seen that the driver behavior is opposite to the pedestrian. The relative illuminance increases progressively as the value of angle α increases, with the highest values occurring at the last values of α, which indicate greater deviations analyzed. This result is due to the characteristic observation geometry of the driver, as the driver line of sight is located at a low height and at a greater horizontal distance from the luminaire.
Overall, the results show that the angular redistribution of the flux affects each type of observer differently and that relative illuminance should be complemented by the analysis of glare.
3.3. Comparative Results Table
To provide a concise quantitative overview of the observed behaviors,
Table 1 summarizes the initial and final values of UGR and relative illuminance, together with their overall variation, for each observer position.
4. Discussion
Table 1 and
Figure 3 and
Figure 4 allow us to analyze how the angular redistribution of the beam affects both relative illuminance and the UGR glare index. Although, as can be seen in both graphs, they show coinciding monotonic trends for each observer, their physical interpretation is different and highlights the importance of considering both variables together.
Relative illuminance is defined, from a photometric point of view, as the amount of flux reaching the observer position and is specified as the linear sum of contributions weighted by distance and angle of incidence. On the other hand, the UGR glare index depends on the square of the apparent luminance and the relative angular position of the source, through the Guth index. Finally, this difference in the definition of the variables means that moderate variations in illuminance can lead to more pronounced changes in glare, and vice versa, depending on the geometry of the observer.
The numerical results summarized in
Table 1 clearly illustrate this distinction. On the one hand, analyzing the pedestrian, a 27.7% reduction in relative illuminance translates into an absolute decrease of 2.2 in the UGR, indicating a moderate decrease. It can be seen that the angular redistribution of the beam reduces the amount of flux directed towards the observer, but that the most relevant luminance regions are shifted outside the field of vision with the greatest sensitivity. Continuing with the case of the cyclist, the data in
Table 1 indicate that both the UGR and relative illuminance vary little and remain almost constant, suggesting that their position is located in an angular region that is not very sensitive to changes in the effective orientation of the beam. Finally, in the case of the driver, significant changes are observed in both relative illuminance and UGR, despite being at a greater distance from the luminaire, showing that small angular variations can align regions of high luminance with critical lines of sight. It should be noted that the large relative increase in illuminance observed for the driver case (+240%) is partly due to the low baseline value at α = 0°. In absolute terms, the angular redistribution aligns a previously weak contribution with the driver line of sight, resulting in a moderate absolute increase that appears amplified when expressed as a percentage. Expressed differently, the relative illuminance for the driver increases by a factor of approximately 3.4 between α = 0° and α = 20°, highlighting the sensitivity of distant observers to angular beam redistribution.
It should be noted that the observer configurations defined in Equations (8)–(10) differ not only in observer height but also in the horizontal distance y to the luminaire. This parameter simultaneously affects the observer–luminaire distance and the observation angle, thereby influencing illuminance through inverse-square decay and glare through angle-dependent luminance and Guth weighting. Consequently, part of the differences observed between pedestrians, cyclists, and drivers reflects distance-related geometric effects rather than observer category alone. In this work, each observer type is therefore interpreted as a representative geometrical configuration commonly encountered in urban road environments, rather than as an isolated physiological condition.
The selected observer positions correspond to a representative lateral road layout commonly found in urban lighting configurations, where pedestrians, cyclists, and drivers occupy progressively increasing horizontal distances from the luminaire. Alternative layouts, such as one-sided lighting or different sidewalk placements, could modify the relative observer–luminaire distances and, consequently, the balance between illuminance decay and angular glare weighting. While such configurations may alter the quantitative values of UGR and relative illuminance, the present analysis is intended to capture general geometry-dependent trends. Therefore, the conclusions should be interpreted as illustrative of how angular beam redistribution interacts with observer geometry, rather than as exhaustive predictions for all possible road layouts.
These results show that the same angular redistribution strategy does not produce the same effects for the three typical users of urban space analyzed. It can be observed that an optical configuration that improves pedestrian visual comfort increases the glare perceived by drivers. This result is not trivial and cannot be achieved solely with evaluations based on a single observer or isolated illuminance metrics.
The main contribution of this study is the introduction of the relative angular parameter α into the UGR, allowing glare to be analyzed as a continuous function of observer-luminaire geometry. Normally, the UGR is evaluated for static configurations, and this approach allows pedestrians, cyclists and drivers to be compared consistently using a single analytical photometric model. This work allows the evaluation of trade-offs between lighting efficiency and visual comfort in real urban scenarios, where there are users with different observation geometries.
The model used in the study is based on a cosm distribution and a planar discretization of the emitter, and is simplified in nature. The aim of the study is not to accurately reproduce the behavior of a specific commercial luminaire, but to analyze the effect of the angular redistribution of the beam on widely used metrics. The results obtained in this research should be interpreted as general trends, serving as a basis for more detailed studies or for the future integration of this approach into lighting simulation tools.
5. Conclusions
As a conclusion, it can be stated that the angular redistribution of an urban LED luminaire beam affects glare and relative illuminance differently, depending on the geometry of the observer. By studying the UGR with the relative angular parameter α, it has been shown that the same optical configuration can improve pedestrian visual comfort and increase the glare perceived by drivers. The results also show that UGR and relative illuminance are not equivalent metrics and that their joint evaluation is essential in urban scenarios with multiple users. The study is a simple analytical model that allows compromises between lighting efficiency and visual comfort to be identified, and is a useful tool for the preliminary analysis of urban lighting design strategies.
Future work will focus on extending the proposed framework to additional luminaire types and urban configurations, as well as on comparative studies with simulation-based or measurement-based approaches. Such developments will allow the robustness and practical applicability of the observed trends to be further assessed beyond the scope of the present analytical study.
The reported findings are therefore intended to illustrate general observer–geometry trends under representative urban layouts, and not to provide exhaustive predictions for all possible road configurations.




 ,
,