
Article

Dynamic Optical Coherence Tomography Monitoring of Keloid Laser Treatment: A Single-Case Proof-of-Concept Study

1
Department of Clinical Sciences, Sapienza University of Rome, 00185 Rome, Italy
2
Department of Dermatology, University of Modena and Reggio Emilia, 41124 Modena, Italy
*
Author to whom correspondence should be addressed.
Optics 2026, 7(1), 13; https://doi.org/10.3390/opt7010013
Submission received: 22 December 2025 / Revised: 26 January 2026 / Accepted: 2 February 2026 / Published: 4 February 2026

Abstract

Background: Keloids are fibroproliferative scars with a prominent vascular component, and pulsed dye laser (PDL) is an established treatment, but objective imaging biomarkers of response are lacking. Objective: To evaluate whether dynamic optical coherence tomography (D-OCT) can provide quantitative, depth-resolved monitoring of keloid vascular remodeling under PDL and to explore candidate metrics for hypothesis-generating assessment in future studies. Methods: We conducted a prospective single-case pilot, hypothesis-generating study of a thoracic keloid treated with three sessions of 595 nm PDL, acquiring D-OCT scans at baseline and approximately 30, 60, and 90 days over a standardized 4 × 4 mm region of interest at 0.15, 0.30, and 0.50 mm depths. Primary D-OCT metrics included vascular en-face area, vessel length density, junction density, and mean vessel caliber. Results: The superficial layer (0.15 mm) showed an almost complete collapse of vascular signal (area −88% vs. baseline), the intermediate layer at 0.30 mm exhibited a sustained ~39% reduction in vascular area with parallel decreases in length and caliber at stable branching, and the deep layer at 0.50 mm showed modest area changes with longer but thinner vessels. These depth-resolved changes were consistent with clinical improvement in Vancouver Scar Scale and POSAS scores. Conclusions: D-OCT yielded quantitative, clinically interpretable vascular metrics that align with the expected effects of PDL in this single patient. In this patient, the percentage reduction in vascular area at 0.30 mm by week 8 emerged as a candidate quantitative metric for response monitoring; thresholds in the order of ≥25% could be tested prospectively as hypothesis-generating cut-offs in future controlled and reliability-tested studies, but are not proposed here as validated clinical criteria.

1. Introduction

Keloids are defined as typically fibroproliferative lesions, characterized by an excessive growth of scar tissue that extends beyond the margins of the original wound. The treatment of this type of lesion represents one of the most complex challenges in dermatological practice today [1,2,3,4]. The pathogenesis of these lesions is rooted in an altered healing process in response to numerous skin traumas; they can often appear following surgical interventions or inflammatory processes and the prevalence seems to vary significantly between different ethnic groups, reaching 16% in individuals of African origin [2,5]. In this context, an altered balance between collagen synthesis and degradation is found, with hyperactivated fibroblasts and alterations in gene expression that play a central role [3]. In particular, the vascular component represents a highly relevant aspect in the progression of these lesions, characterized by aberrant neovascularization and elevated levels of vascular growth factor (VEGF) [6]. Endothelial alteration emerges as a crucial pathogenetic element, supporting the hypothesis that keloids can be considered, at least in part, as vascular disorders [5]. Pulsed dye laser (PDL) is a consolidated option for the treatment of the vascular component of keloids [7,8], operating on the principle of selective thermolysis using specific wavelengths (585–595 nm) that correspond to the absorption peaks of hemoglobin [9]. On the other hand, optical coherence tomography (OCT) represents a major advance in the approach to dermatological diagnosis, allowing non-invasive, high-resolution imaging of skin structures, with instruments that reach a penetration of up to 2.0 mm and axial resolution <10 μm and lateral resolution <7.5 μm (specificities dependent on the device) [10]. The evolution of this technique towards dynamic optical coherence tomography (D-OCT) has added a new dimension to this tool, allowing real-time visualization of skin microvasculature [11]. Dynamic OCT is commonly implemented as speckle-variance/motion-contrast OCT, leveraging inter-frame speckle decorrelation to highlight perfused microvessels in vivo [12]. Although these technologies have made significant progress in recent years, the role they could have in monitoring complex therapies such as those for keloids has not, to our knowledge, been systematically addressed. In this context, we believe that the interaction of these two tools—PDL for therapy and OCT for keloid assessment and follow-up—may represent an innovative opportunity that combines targeted therapy of the vascular component with advanced imaging for personalized medicine.

1.1. PDL in the Management of Keloids

To date, pulsed dye laser is a well-established therapeutic approach for the treatment of keloids, particularly the vascular component, with extensive evidence supported by controlled clinical trials and systematic reviews [7,11,13,14,15]. Kuo et al. provided molecular evidence on the mechanisms of action of PDL, demonstrating that treatment with specific parameters (585 nm, fluences 10–18 J/cm2 with a mean of 14.0 J/cm2, pulse duration 450 μs, spot size 5 mm) induces a downregulation of TGF-β1 expression in keloid fibroblasts [16]. Clinical results from the same study on 30 patients with keloids showed keloid regression (≥50%) in 86.7% of cases after 1–11 PDL treatments with a 12-month follow-up, with superior results for patients receiving more than 6 treatments (79% vs. 50%) [16]. Achieving optimized PDL parameters has been the central focus of several specific studies. Cannarozzo et al. reported clinical benefits in treating keloids with specific parameters, highlighting the importance of therapeutic customization [8]. A direct comparison of PDL wavelengths was evaluated by Nouri et al., who demonstrated comparable efficacy between 585 nm and 595 nm in the treatment of surgical scars [17]. A recent network meta-analysis of 18 studies and 550 patients highlighted the efficacy of PDL in reducing Vancouver Scar Scale (VSS) scores; in particular, it showed a greater benefit when combined with other laser sources [14]. Additional data from meta-analyses and reviews further support the role of PDL and other associated lasers in the management of keloids and hypertrophic scars [18,19]. Combined approaches therefore represent an emerging therapeutic strategy in the management of pathological scars [20]; furthermore, sequential protocols appear to increase success rates and achieve a consistent reduction in the pathology [21]. Similar sequential combination strategies have also been explored in facial rejuvenation, further supporting the logic of multimodal laser approaches [15,22,23].

1.2. Imaging Techniques for Monitoring Keloids

Optical coherence tomography (OCT) provides non-invasive, high-resolution imaging of structural skin alterations with a penetration depth of up to 2.0 mm and axial resolution <10 μm and lateral resolution <7.5 μm (device-specific) [10,24,25]. In routine dermatologic D-OCT, the effective depth for dynamic flow mapping is typically shallower; quantitative analysis was performed within the depth range specified in the Methods section. Ring et al. evaluated how, in 33 patients with collagen deposition disorders, structural OCT was able to identify specific morphological patterns of keloids, characterized by disorder and hyperreflective areas located primarily in the upper dermis with heterogeneous dermal morphology [26]. Similarly, Abrouk et al. proposed an OCT atlas comparing scar subtypes to support laser parameter selection and clinical interpretation [27]. The integration of these two methods represents an innovative approach supported by concrete clinical evidence. Amato et al.’s study on 15 patients with auricular keloids demonstrated the efficacy of a combined sequential protocol that uses pre-treatment assessment to guide therapeutic selection [28]. The protocol for the PDL component included handpiece spot size 12 mm, fluence 7 J/cm2, and pulse duration 0.5 ms, while the CO2 component included handpiece 7 mm and power 0.3–2.5 W in freehand mode. Results show consistent reductions in VSS scores (from 8.3 ± 1.1 to 2.9 ± 0.5) and Patient and Observer Scar Assessment Scale (POSAS) total scores (from 42.6 ± 6.2 to 16.2 ± 5.1, p < 0.05) with a 12-month follow-up [28]. It is important to note that these results refer to the combined CO2 + PDL protocol and cannot be directly extended to PDL monotherapy [29,30,31]. In addition to OCT, other high-resolution non-invasive methods for imaging skin structures include optical elastography [32], photoacoustic tomography [33], multiphoton microscopy [34], and optical diffraction tomography [35]. Emerging wavefront-shaping and digital optical phase-conjugation approaches have also been proposed to mitigate optical scattering in turbid media, but they remain largely experimental and are not routinely available in clinical dermatology [36,37]. Collectively, these modalities span a trade-off between spatial resolution, penetration depth, functional contrast, cost, and clinical practicality. For example, multiphoton approaches provide very high microstructural detail but are typically limited by shallow effective imaging depth and constrained field of view; photoacoustic techniques can add functional vascular contrast but may require more complex hardware and can have lower spatial detail compared with OCT for superficial dermal microstructure; ultrasound-based methods offer deeper structural assessment and stiffness-related information but do not natively provide the same dermal microvascular mapping capability targeted by PDL. Emerging wavefront-shaping and phase-conjugation strategies aim to mitigate scattering, yet they remain largely experimental. In this context, OCT/D-OCT provides a practical compromise for dermatologic workflows by combining high-resolution structural imaging with depth-resolved microvascular mapping without exogenous contrast. OCT was chosen in this study due to its high spatial resolution, the ability to visualize the microvasculature in real time via D-OCT, and its well-established application in dermatology, which allows non-invasive and reproducible monitoring without the need for exogenous contrast [11,24,38]. Compared with ultrasound-based imaging (e.g., high-frequency ultrasound and multimodal ultrasound incorporating elastography), which can assess scar thickness, mechanical properties, and deeper tissue characteristics [39,40], D-OCT provides depth-resolved microvascular maps and quantitative vascular metrics within the dermis, particularly relevant for PDL, which targets hemoglobin-rich superficial vessels via selective photothermolysis [9,16]. Ultrasound remains complementary where deeper structures and stiffness mapping are the primary endpoints [39,40].

1.3. Gaps in the Literature and Rationale for Our Study

The literature review highlights marked gaps in the standardization of treatment protocols and in the objective assessment of results [41,42,43]. Despite advances in OCT imaging and laser therapies, to our knowledge, there are currently no standardized protocols for quantitative analysis of OCT data in keloids, representing a critical gap in personalized dermatological medicine [44,45,46]. The study by Ring et al. demonstrated that, although OCT can identify morphological differences between keloids, scleroderma, and healthy skin, no differences were found in mean density measurements (p = 0.07), indicating the need for more sophisticated quantitative parameters for objective characterization [11,26]. This single-case proof-of-concept study aims to illustrate a feasible workflow for integrating PDL and D-OCT in keloid treatment, providing initial technical and biological insights that need to be tested and refined in larger cohorts before any standardized framework can be defined. This approach will allow objective monitoring of PDL-induced changes in keloid microvasculature, providing quantitative data to optimize laser parameters and contributing to the development of evidence-based guidelines for personalized keloid treatment [47]. Although the D-OCT metrics employed in this study are based on established techniques for vascular sampling, their specific application to monitor keloid response to PDL treatment represents a novel extension. By focusing on depth-resolved quantitative parameters, such as en-face vascular area and vessel length density, we provide insights into the differential remodeling of superficial, intermediate, and deep dermal plexuses, which have not been systematically explored in the keloid literature. This approach merges basic imaging methods with clinical utility, offering a basis for optimizing personalized therapy in fibroproliferative scars [40,41,42].

2. Case Presentation and Laser Protocol

2.1. Case Presentation

A 22-year-old Fitzpatrick skin type III woman presented with a symptomatic keloid in the mid-thoracic region, secondary to inflammatory acne. The lesion had been present for approximately 4 years, with a maximal clinical extension of about 3.5 × 2.0 cm and a central thickness of roughly 3–4 mm. The lesion was characterized by persistent elevation, erythema, and pruritus, with episodic pain on pressure. The keloid had been clinically stable over the previous months, with no episodes of spontaneous regression. No previous surgical excision, intralesional corticosteroid injections, or device-based treatments (including laser or light sources) had been performed on this lesion. In the 6 months preceding and throughout the laser treatment course, the patient did not receive any other keloid-directed therapy (topical, intralesional, or systemic), and there were no relevant changes in systemic medications. This stable therapeutic background supports the attribution of the observed clinical and D-OCT changes predominantly to the PDL protocol. At baseline (T0), the keloid was documented with standardized clinical photography and evaluated using the Vancouver Scar Scale (VSS) and the Patient and Observer Scar Assessment Scale (POSAS), together with a visual analog scale (VAS) for pruritus and pain. D-OCT examinations were performed at T0 and at predefined follow-up time points (T1, T2, T3) to monitor the depth-resolved vascular response during and after PDL treatment.

2.2. Pulsed Dye Laser Protocol

PDL treatment was delivered with a 595 nm pulsed dye laser (Synchro VasQ, DEKA M. E. L. A. srl, Calenzano, Italy) using a 12 mm spot size and cryogen-based epidermal cooling. A fluence of 6.5 J/cm2 and a pulse duration of 0.5 ms were selected based on current recommendations for vascular-targeted treatment of hypertrophic scars and keloids and were kept constant across all sessions. Each treatment session consisted of two non-overlapping passes over the entire keloid, visually guided to ensure complete coverage while avoiding stacked pulses. A total of three sessions were performed at approximately 4-week intervals. No test spot was required, and the procedure was carried out under topical anesthesia with a lidocaine/prilocaine cream applied 30 min before irradiation. Immediately after each session, the treated area was cooled with cold air and a bland emollient was applied. The patient was instructed to avoid sun exposure on the treated region and to use a broad-spectrum sunscreen (SPF 50+) throughout the treatment and follow-up period. No adverse events such as blistering, secondary infection, or post-inflammatory hyperpigmentation were observed.

2.3. D-OCT Acquisition and Quantitative Analysis

D-OCT Acquisition

D-OCT analysis was performed using en-face imaging following the technical recommendations and best-practice guidelines for dermatologic OCT described by Ulrich et al. [38] and subsequent dermatologic OCT reviews [10]. D-OCT imaging was performed with a multi-beam swept-source Fourier-domain OCT system (VivoSight Dx, Michelson Diagnostics, Kent, Chatham, UK). According to the manufacturer’s technical data, the system operates at a laser center wavelength of 1305 ± 10 nm with a frequency sweep range ≥147 nm and an A-line rate of 20 kHz, providing axial optical resolution (in tissue) <10 μm and lateral optical resolution <7.5 μm over a 6 × 6 mm scan area; imaging depth is tissue dependent and typically ~1 mm for skin [48]. Each volumetric scan consisted of 120 frames (default/recommended for en-face resolution), with acquisition times <15 s in en-face mode and <40 s in dynamic mode [48]. Dynamic mode uses speckle-variance/motion-contrast processing of sequential OCT frames to generate depth-resolved en-face microvascular maps that reflect moving erythrocytes within perfused vessels [12,38]. For each time point (T0–T3), at least two repeated dynamic-mode volumetric acquisitions were performed over the target lesion to minimize motion artifacts and confirm visibility of the dynamic signal at the selected en-face depths; the highest-quality dataset (best focus and least motion) was selected for quantitative analysis [38,48]. For quantitative analysis, a single 4 × 4 mm region of interest (ROI) was defined at baseline (T0) at the center of the treated lesion, using fixed anatomical landmarks to ensure spatial consistency of longitudinal measurements. The same ROI coordinates were then applied at all time points and depths. En-face flow maps were exported as PNG images at three standardized nominal depth levels (0.15, 0.30, and 0.50 mm), corresponding respectively to superficial dermal papilla capillaries, an intermediate vascular plexus, and deeper dermal vessels; the nominal depth displayed by the system is approximate and was used to standardize sampling across visits [48]. This depth stratification allows visualization of the dermal papillae capillaries, the superficial dermal plexus, and the deep dermal plexus in a clinically interpretable way [38]. Although structural OCT can reach a penetration level of up to ~2.0 mm in skin under favorable conditions (device- and tissue-dependent), quantitative D-OCT flow mapping is typically reliable within the more superficial dermis (here, ~1 mm), and the analysis is restricted to the standardized depths reported. For figure preparation and quality control, en-face vascular maps and cross-sectional structural images were exported at the highest available native resolution. The device provides a relative flow-intensity color scale without physical units, and the display intensity scaling is automatically set by the software and cannot be manually standardized across time points. Accordingly, color intensity is used for visualization only, whereas longitudinal comparisons are based on the offline quantitative metrics extracted from a fixed ROI. Figures were standardized by using consistent spatial and depth labeling and unambiguous indication of the analyzed region. To enhance transparency and reproducibility, the de-identified unprocessed (native-export) en-face flow maps and representative cross-sectional images corresponding to the analyzed time points and depths are provided as Supplementary Raw Data (see README for file naming and correspondence to the main figures).
Software and analysis parameters: D-OCT images were processed offline using Python (version 3.11) and Fiji/ImageJ (v.1.54r). For each depth and time point, en-face flow maps were imported, converted to 8-bit, normalized, and visually inspected for motion artifacts or extensive saturation. To attenuate surface reflections and improve contrast, intensities were clipped at the 99th percentile when necessary. Vascular segmentation was obtained with Otsu thresholding applied independently at each depth level, followed by morphological opening and closing to remove isolated noise and small artifacts (area < 25 pixels). All binary masks were visually verified by an experienced dermatologist with D-OCT expertise. Skeletonization of the segmented vasculature was then performed to obtain a one-pixel-wide representation of the vessel network. The quantitative D-OCT analysis focused on four primary, clinically interpretable vascular metrics, reported in the main text and figures: (i) Vascular en-face area (%)—the percentage of the ROI occupied by segmented vascular pixels; (ii) vessel length density (a.u.)—the total length of skeletonized vessels within the ROI, normalized by ROI area; (iii) junction density (a.u.)—the number of branching nodes (degree ≥ 3) per unit area, reflecting network complexity; and (iv) mean vessel caliber (px)—a proxy for average vessel diameter, calculated as the ratio between total vascular area and total length of skeletonized vessels. The choice of these metrics is conceptually aligned with the D-parameter framework proposed by Ulrich et al. [38] (Depth, Density, Diameter, Direction, Distribution), in that vascular area and vessel length density capture aspects of “Density”, mean caliber reflects “Diameter”, and the depth sampling (0.15/0.30/0.50 mm) corresponds to “Depth”. In addition to the four primary metrics reported in the main text, we also computed exploratory network descriptors related to the “Direction” and “Distribution” components of the D-parameters, such as fractal dimension, orientation coherence, and surrogate indices of vessel tortuosity. These additional descriptors were used to qualitatively cross-check the overall vascular remodeling pattern but did not materially change the interpretation of the depth-resolved response. For the sake of clarity and to keep the focus on clinically interpretable measures, these exploratory metrics are not reported in detail in the main text; a concise description of their computation and summary values are provided in the Supplementary Methods and in a Supplementary Table, for readers interested in reproducing or expanding the present analysis. Because this was a single-case exploratory study, we did not perform formal test–retest or inter-observer reliability assessments of the D-OCT metrics. All measurements should therefore be interpreted as descriptive estimates, obtained under strictly standardized acquisition and analysis conditions rather than as fully validated quantitative endpoints.

3. Results

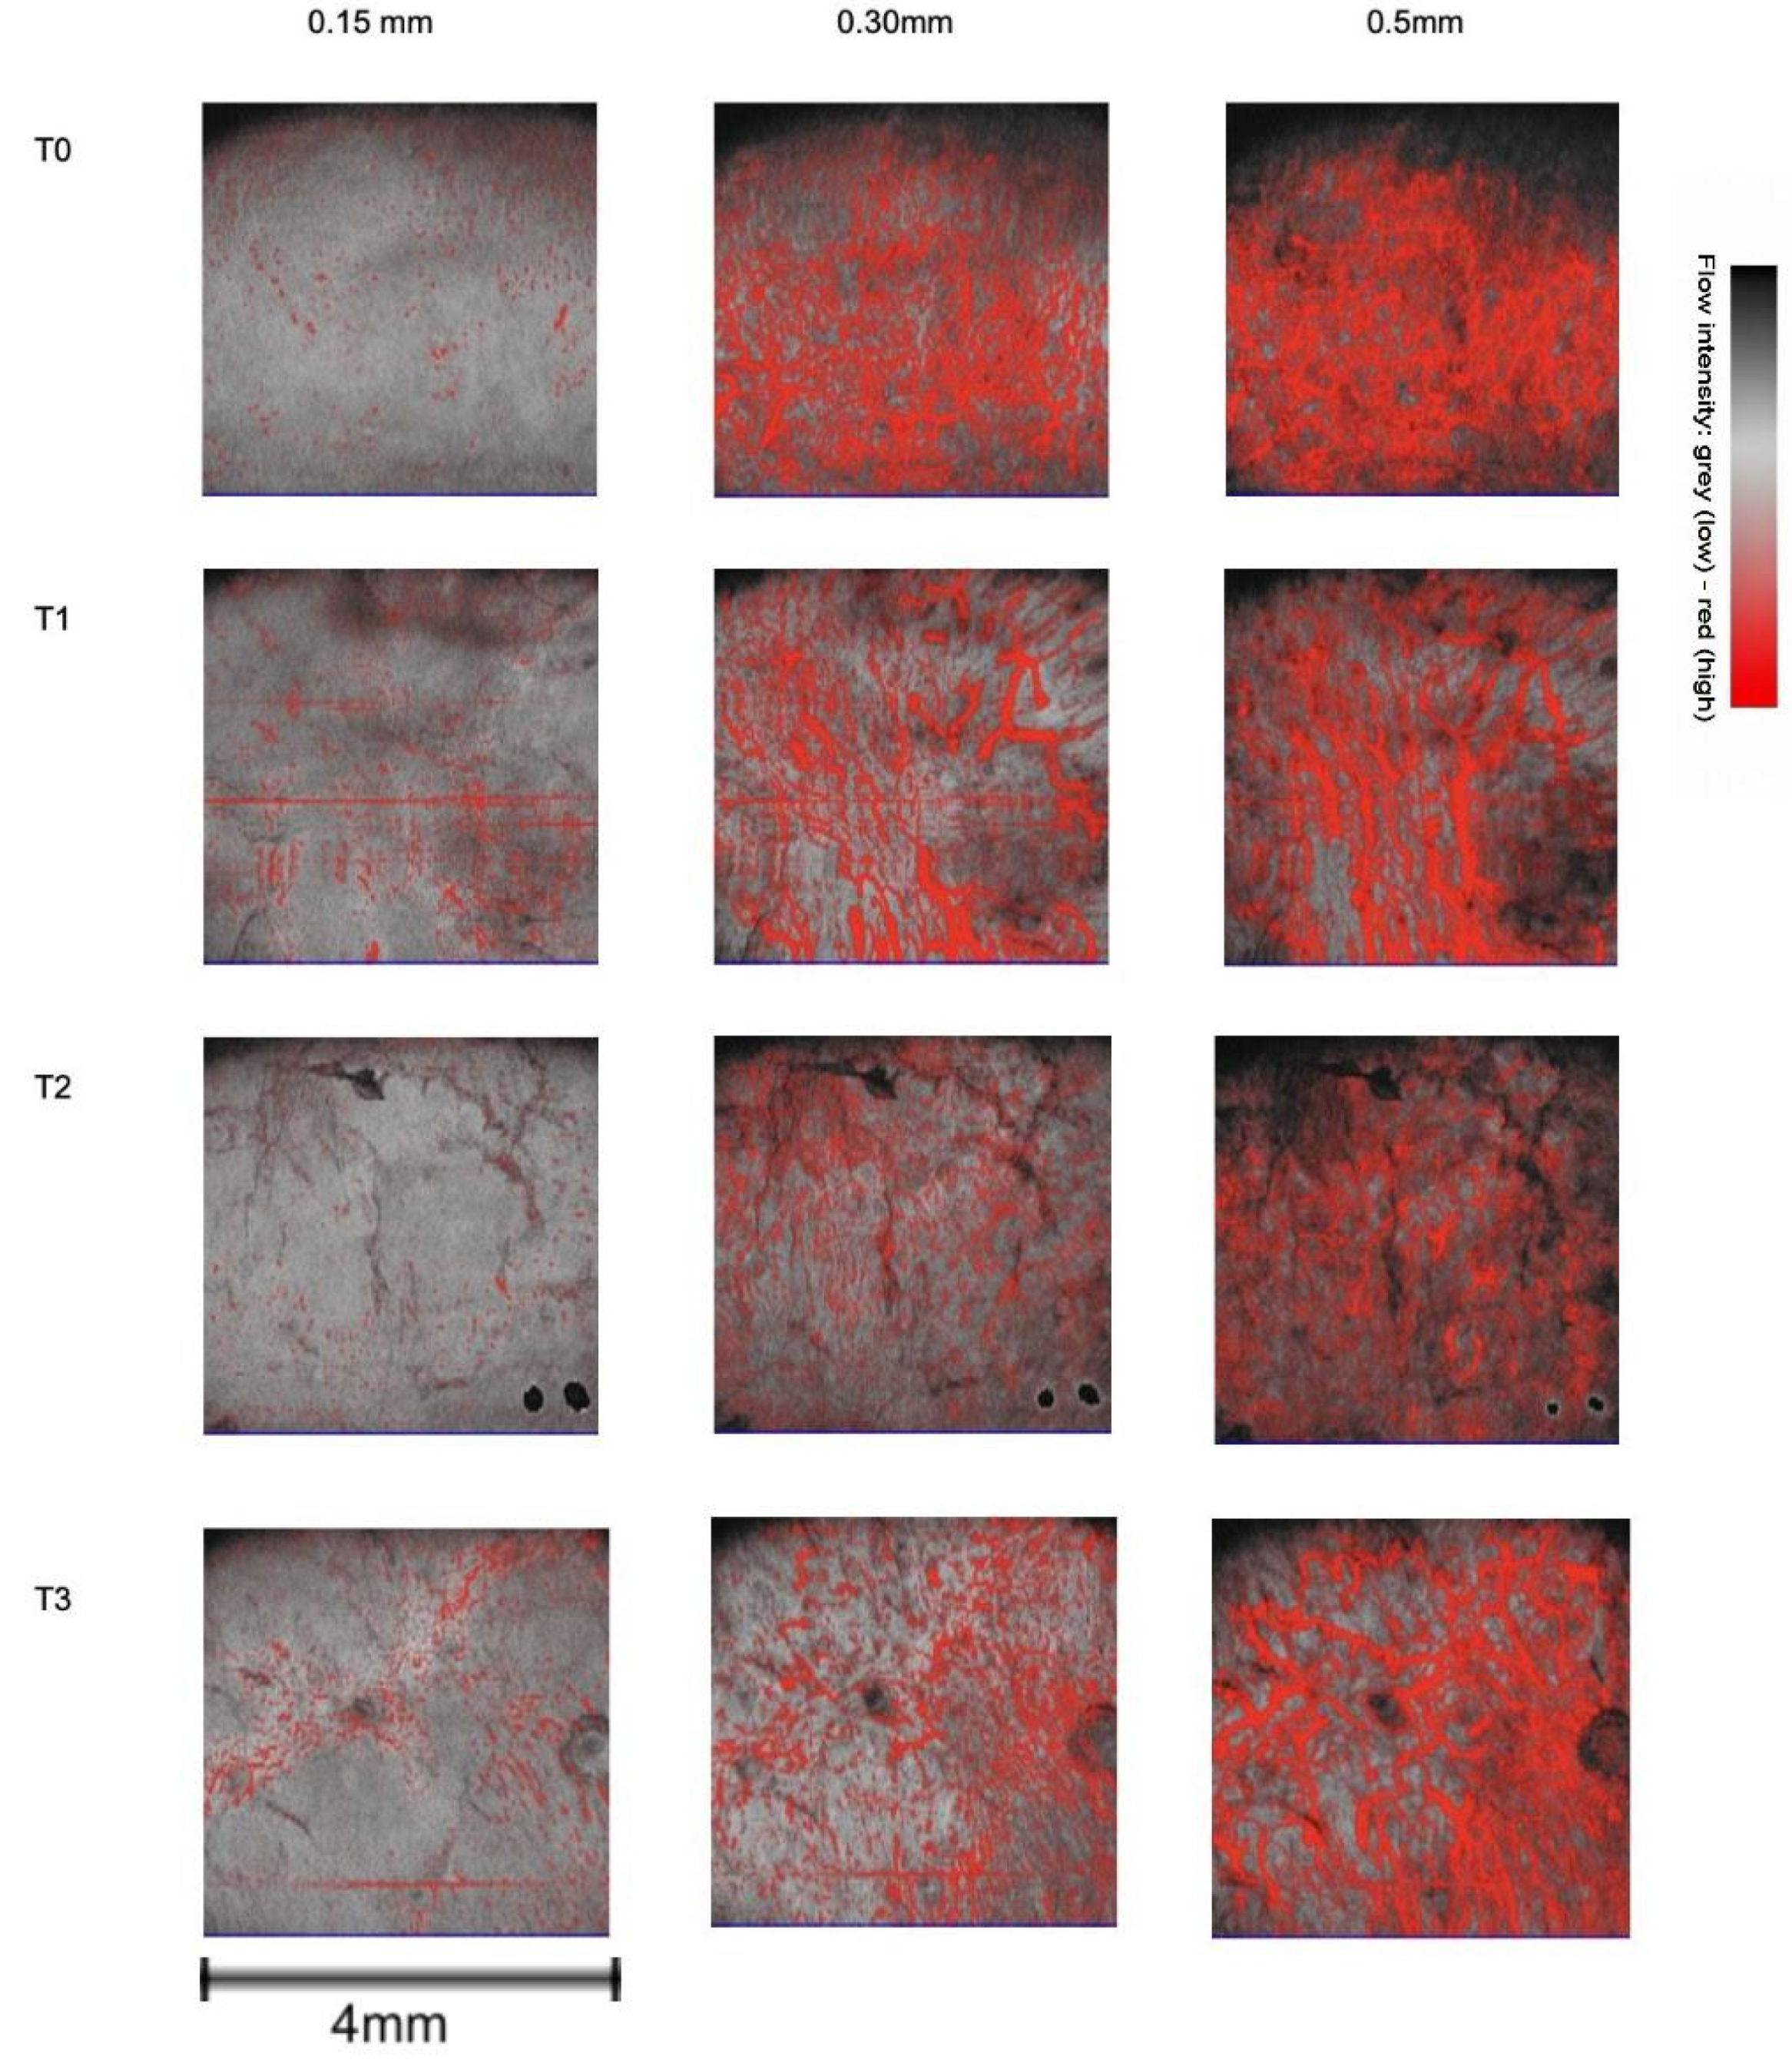
Dynamic OCT acquisitions were obtained at baseline (T0) and approximately 30 (T1), 60 (T2), and 90 days (T3) after initiation of PDL treatment, on the same standardized 4 × 4 mm region of interest (ROI) centered on the most elevated portion of the keloid (Figure 1). Table 1 summarizes the absolute values and percentage changes of all vascular metrics at the three depths (0.15, 0.30, and 0.50 mm). Representative en-face flow maps illustrate the qualitative evolution of the vascular network over time (Figure 2).

3.1. Vascular En-Face Area

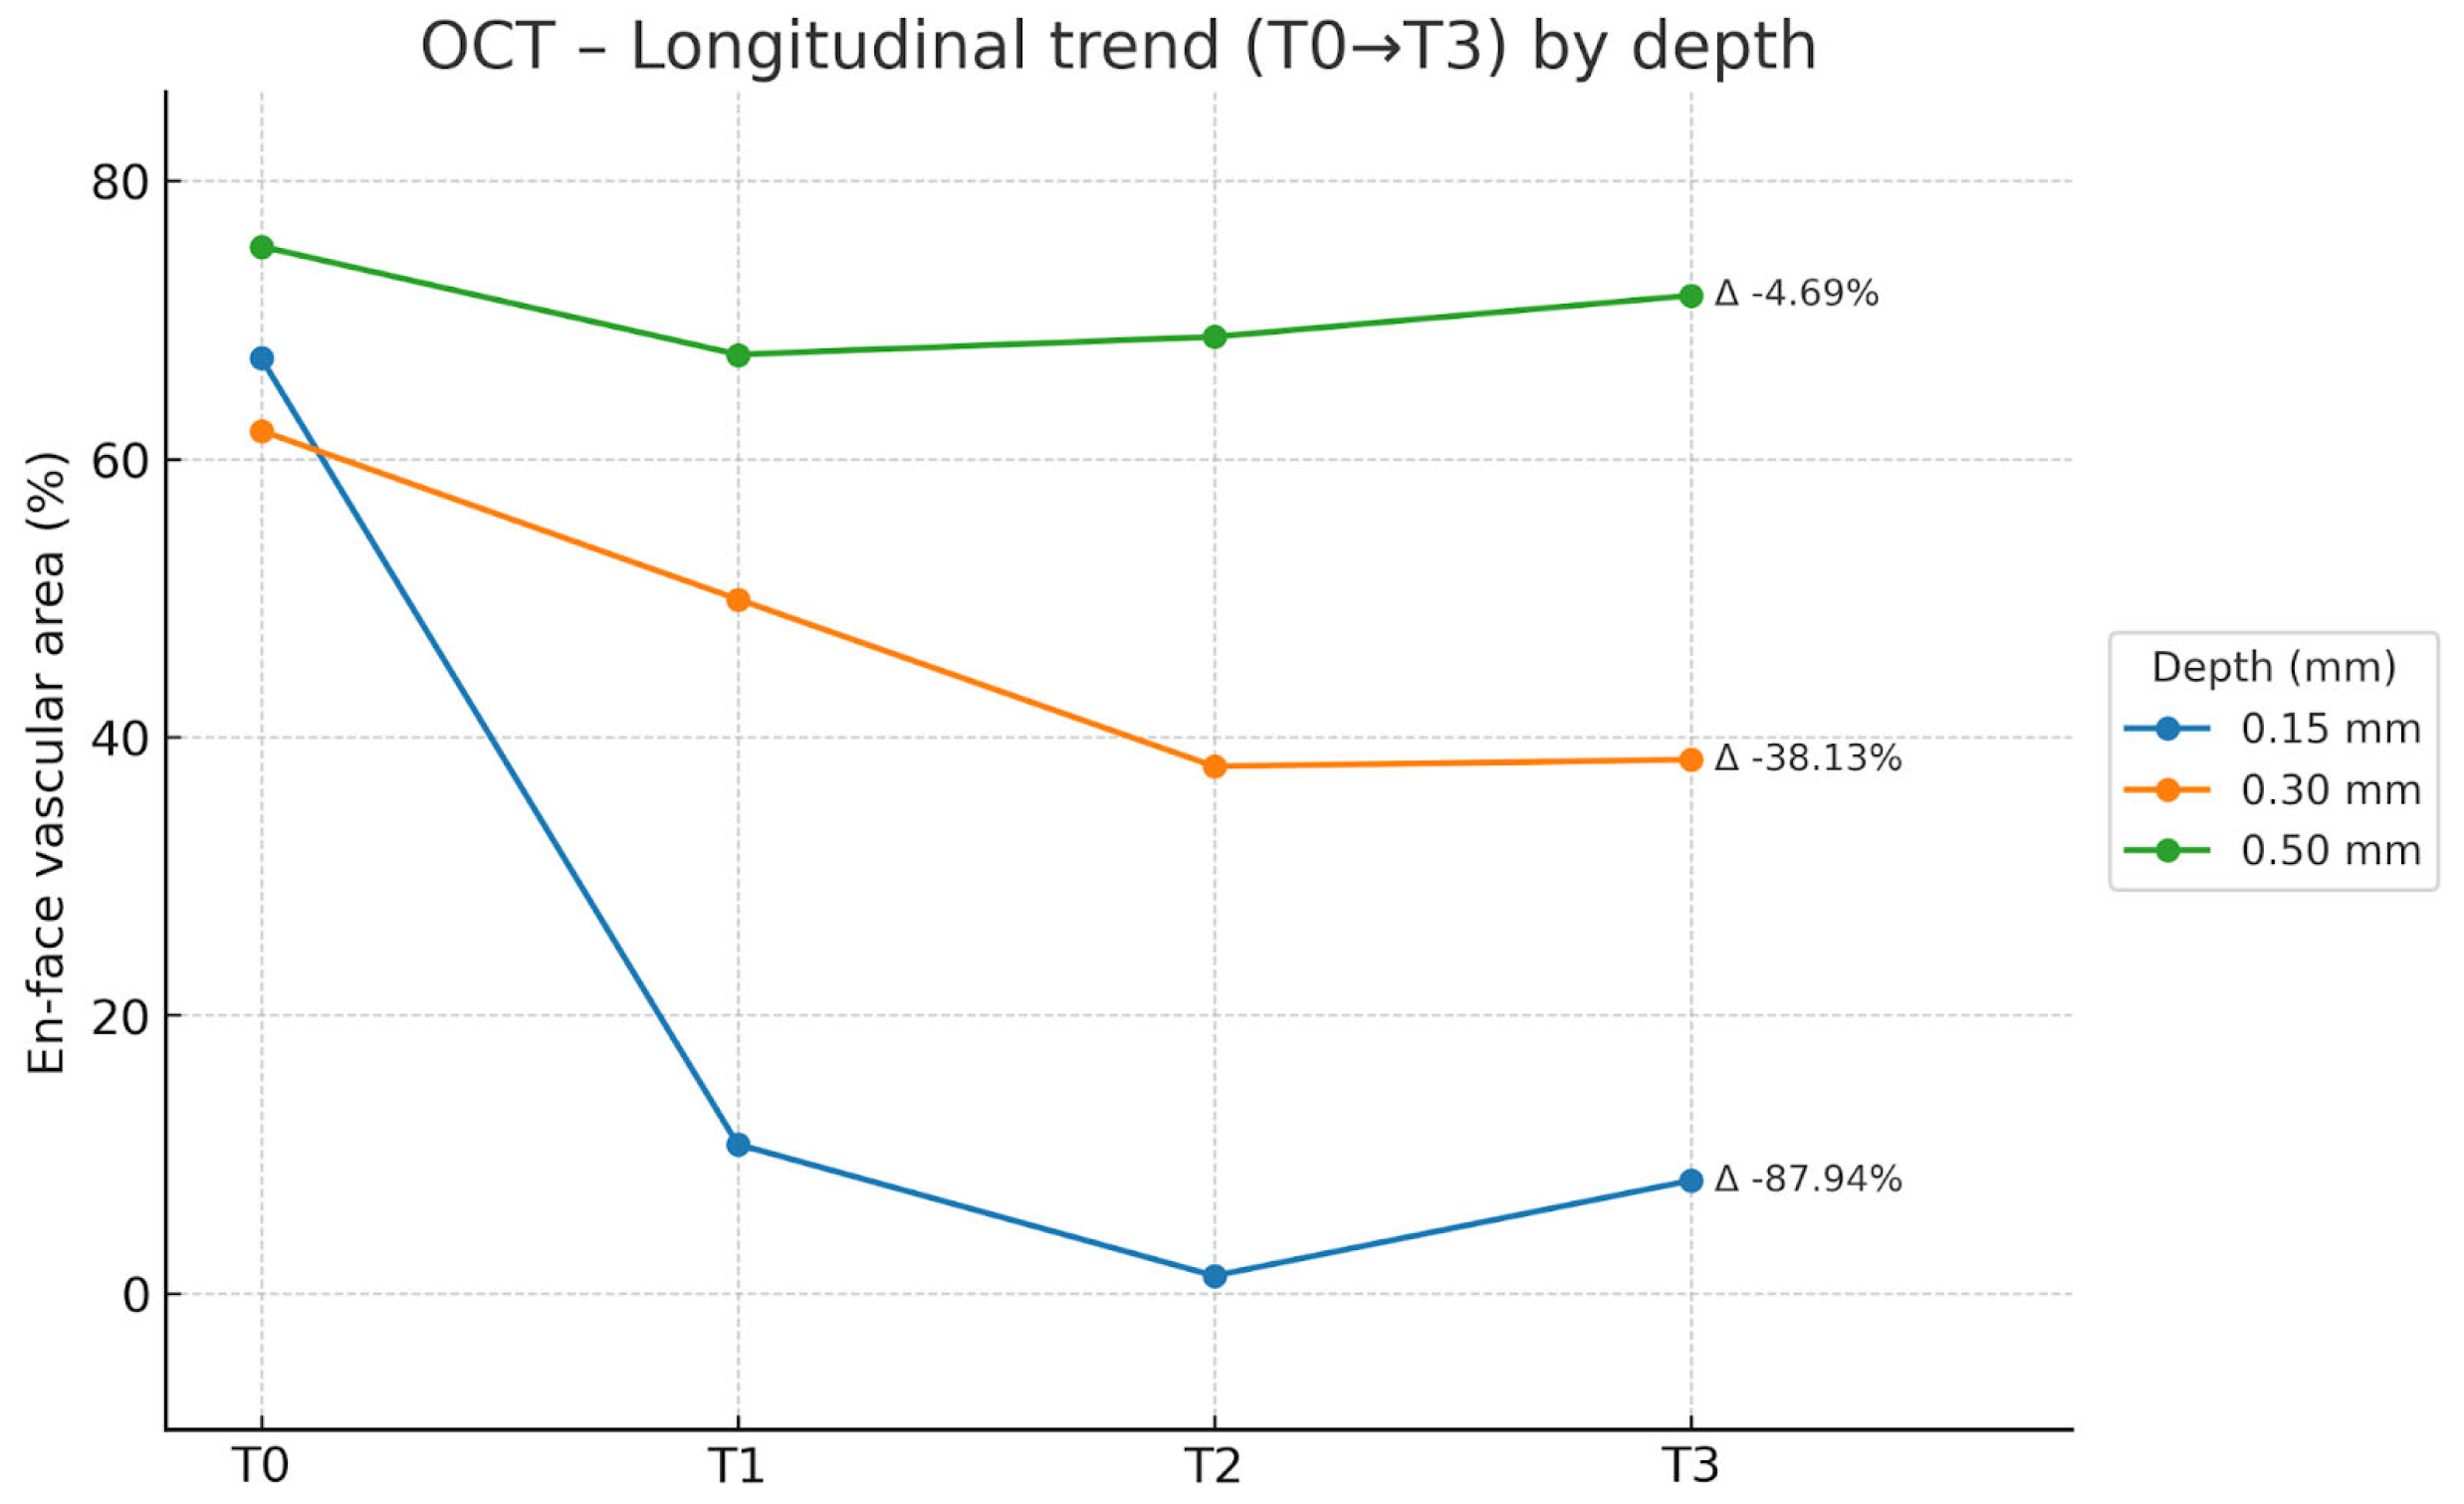
At the superficial depth of 0.15 mm, the en-face vascular area showed a marked collapse over time, as summarized in Table 1 for absolute values and percentage changes. At the intermediate depth of 0.30 mm, the vascular area decreased more gradually but steadily (see Table 1). At the deeper level of 0.50 mm, changes in vascular area were modest (see Table 1). Overall, these data indicate a near-complete disappearance of the superficial vascular signal, a substantial but not complete reduction in the mid-dermis, and only minor changes in the deep dermis (Table 1, Figure 2), which is consistent with the clinical evolution observed in Figure 1, showing progressive flattening, softening, and reduction of keloid erythema.

3.2. Network Metrics: Vessel Length Density, Junction Density and Mean Vessel Caliber

Vessel length density mirrored the depth-dependent behavior observed for vascular area, as detailed in Table 1. Junction density remained largely stable at the intermediate and deep levels (see Table 1), indicating preservation of the overall branching architecture. At 0.15 mm, junction density remained 0 at all time points, reflecting the near-complete collapse of the superficial vascular plexus. Mean vessel caliber (proxy) decreased at all depths, with the most pronounced changes in the superficial layers (see Table 1 for specific values). Overall, these network metrics describe a pattern of decreasing vessel length and caliber at 0.15 and 0.30 mm, contrasting with increasing length but thinner vessels at 0.50 mm under conditions of stable branch density (Table 1, Figure 3).

3.3. Depth-Dependent Vascular Remodeling Pattern

By integrating the area-based and network-based metrics, a coherent depth-resolved pattern of vascular remodeling emerges. Superficial layer (0.15 mm): D-OCT revealed an almost complete disappearance of detectable flow signal, with a >80% reduction in vascular area and >70% decrease in mean caliber, and vessel length density approaching zero. This reflects a collapse of the superficial plexus, consistent with the expected impact of PDL on the most superficial, highly erythematous component of the keloid.
Intermediate layer (0.30 mm): The mid-dermal depth exhibited the most balanced combination of changes, with a sustained ~39% reduction in vascular area at T2 and T3, a ~29% reduction in vessel length density, and an ~18–22% reduction in mean caliber, at stable junction density. This pattern suggests selective pruning and thinning of vessels within a preserved network topology, making this plane a plausible candidate for quantitative biomarker development. Deep layer (0.50 mm): In the deep dermis, vascular area changed only slightly, but vessel length density increased (+20–40% vs. baseline) while mean caliber decreased by approximately 26–36%, on a stable junction density. This combination is compatible with reorganization of the deeper network into longer, thinner vessels rather than overt pruning. Qualitatively, the en-face D-OCT maps support these quantitative findings, showing progressive clearing of the superficial vascular signal, reduction of the congested mid-dermal network, and a finer, more elongated deep plexus over the course of treatment (Figure 2). This depth-specific behavior underpins the subsequent discussion of mid-dermal vascular area at 0.30 mm as an exploratory candidate metric for monitoring PDL-induced remodeling in keloid. A small increase in vascular area at 0.30 mm from T2 to T3 (Table 1) was observed; this minimal change may reflect measurement variability (e.g., segmentation thresholding and physiologic perfusion fluctuations) rather than true vascular rebound, and warrants confirmation with longer follow-up.

4. Discussion

This single-case report is a pilot, hypothesis-generating application suggesting that dynamic OCT can serve as a quantitative, depth-resolved tool for monitoring vascular remodeling in keloids treated with PDL [16,22]. Accordingly, the findings should be interpreted as exploratory and descriptive rather than statistically generalizable. Our results provide in vivo, depth-resolved imaging evidence that is consistent with the proposed mechanisms of action of the laser and lay the foundation for an imaging-guided therapeutic approach. The main finding is a measurable, depth-resolved reduction in keloid vascularization, particularly at the intermediate (0.30 mm) plexus. Our quantitative data (38.1% reduction in vascular area) provides an objective measure of this effect. At the molecular level, Kuo et al. [16] demonstrated that PDL suppresses keloid fibroblast proliferation by downregulating TGF-β1, a potent profibrotic factor. A transient post-photothermal ischaemic milieu might contribute to downstream antifibrotic signaling (e.g., TGF-β1 downregulation), but this remains a mechanistic hypothesis requiring dedicated studies. Our work provides in vivo, depth-resolved imaging evidence that is consistent with the proposed mechanisms of action of PDL on keloid vasculature, and suggests that OCT monitoring could help personalize combination protocols in future studies. We propose that the percentage change in vascular area at 0.30 mm may serve as an exploratory candidate metric for future studies. In this patient, a reduction of approximately 40% at T2 was associated with clinical improvement, suggesting that thresholds in the order of ≥25% could be tested prospectively as part of predefined response criteria. However, our single-case study cannot support any clinical decision rule, and no recommendation can be made regarding continuation or modification of treatment based on D-OCT alone. This approach is similar to that already demonstrated for monitoring other skin conditions, such as non-melanoma skin cancers treated with photodynamic therapy and Kaposi’s sarcoma, where OCT has proven valuable in assessing response to treatment [49,50]. The adoption of a standardized methodology, such as that promoted by Ulrich et al. [38], is essential to ensure the reproducibility of these hypothesis-generating markers across different centers [51]. Although causal relationships cannot be established from a single case, the concordance between the quantitative D-OCT changes and the improvement in VSS/POSAS scores supports the clinical relevance of the proposed vascular exploratory biomarker. From a methodological standpoint, the choice of 0.30 mm as the primary depth for candidate metrics reflects a trade-off between sensitivity to PDL-induced changes and robustness of the signal. While the most dramatic reduction in vascular area was observed at 0.15 mm, this superficial level is highly susceptible to physiological variability in microflow and acquisition conditions (e.g., probe pressure, temperature, local vasomotor tone), which may limit its reproducibility in multi-center settings. In contrast, the intermediate vascular plexus at 0.30 mm exhibited a more balanced pattern of sustained area reduction with preserved network topology, which may provide a more stable substrate for quantitative monitoring across sessions and patients. The significance of this study is not limited to a single threshold at 0.30 mm; rather, the depth-resolved profile across 0.15/0.30/0.50 mm (en-face vascular area plus skeleton-based network metrics) provides a compact quantitative signature of vascular remodeling. Ultrasound can quantify scar thickness and stiffness and interrogate deeper tissue compartments [39,40], but its spatial resolution limits detailed mapping of intradermal microvascular networks. In contrast, D-OCT provides depth-resolved microvascular maps and quantitative network metrics within the dermis, enabling longitudinal monitoring of PDL effects without contrast agents [11,24,38]. Future studies should formally compare test–retest variability at different depths to identify the most reliable planes for longitudinal assessment. In this pilot context, the present case illustrates how established D-OCT methodologies can be adapted to keloids and suggests that the percentage reduction in vascular area at 0.30 mm (e.g., on the order of ≥25% by week 8) may be explored as a hypothesis-generating candidate threshold for response monitoring. Although the metrics are relatively basic and draw from prior literature on vascular imaging, their integration into a longitudinal framework for PDL-treated keloids moves beyond mere descriptive capillary patterns, enabling quantifiable assessment of therapeutic efficacy. This could inform future thresholds tailored to keloid vascular remodeling, addressing gaps in objective biomarkers for dermatological interventions [44,45]. From a conceptual standpoint, we propose that future prospective studies might test whether predefined thresholds in vascular area reduction at 0.30 mm (for example, in the order of ≥25% by T2) are associated with clinically meaningful endpoints. In the current single-case study, this value must be regarded purely as an illustrative example derived from a single observation, and no clinical cut-off can be proposed at this stage. In the context of existing OCT literature on keloids and scars, our study adds a complementary perspective. Beyond OCT, additional non-invasive imaging modalities such as handheld two-photon microscopy and multimodal ultrasound have also been explored for the assessment of pathological scars and keloids [52]. Histopathological differences in collagen architecture across scar phenotypes (keloid, hypertrophic, and normotrophic scars) underpin the rationale for structural imaging endpoints [53]. Ring et al. [26] demonstrated that structural OCT can differentiate collagen deposition disorders based on qualitative and semi-quantitative features, but did not report depth-resolved vascular metrics or standardized response criteria for keloid treatment. Similarly, previous D-OCT studies have mainly focused on descriptive capillary patterns in inflammatory and neoplastic conditions rather than on quantitative monitoring of laser-induced vascular remodeling [11,38]. In contrast, our approach combines a fixed, anatomically anchored 4 × 4 mm ROI, predefined depth levels, and a small set of clinically interpretable vascular metrics, allowing us to map a coherent, depth-dependent response to PDL over time. Although limited to a single patient, this workflow illustrates how D-OCT can move from purely qualitative imaging to hypothesis-generating, quantitative assessment in keloid therapy.

Limitations and Future Directions

Future studies should evaluate volumetric and 3D network metrics across the entire keloid volume to complement the depth-slice approach. They should include appropriate comparators (untreated scar region, contralateral/pathologic scar, and/or adjacent normal skin) and, where feasible, longitudinal follow-up beyond 90 days. Test–retest acquisitions within the same visit and between visits should be planned, and inter-operator variability assessed on a predefined subset of scans. Primary imaging endpoints and quality-control criteria for motion artifacts and scan acceptance should be pre-specified. When feasible, histological or ultrasound correlates can help anchor imaging changes to tissue remodeling. Once sample size permits, appropriate longitudinal statistical models (e.g., mixed-effects models) should be used, and effect sizes reported with uncertainty estimates.

5. Conclusions

In conclusion, this single-case pilot, hypothesis-generating report supports the feasibility of using D-OCT as a quantitative, non-invasive tool for tracking depth-resolved vascular remodeling in keloids treated with PDL. The integration of this theranostic (therapy + diagnostics) approach into clinical research may contribute to more personalized keloid management by enabling objective monitoring of vascular response. However, the present single-case report does not justify any change in clinical practice and does not provide validated response criteria. Future controlled, reliability-tested studies with appropriate comparators and longer follow-up are required to quantify measurement variability, define minimal detectable change, and evaluate whether candidate response metrics and thresholds are clinically meaningful [46].

Supplementary Materials

The following supporting information can be downloaded at https://www.mdpi.com/article/10.3390/opt7010013/s1, De-identified unprocessed native-export D-OCT en-face flow maps (PNG exports at predefined depths for T0–T3) are provided as Supplementary Raw Data (see README for file naming and correspondence to the main figures).

Author Contributions

Conceptualization, L.G. (Luca Guarino) and A.C.; methodology, S.P.N., G.C. and M.S.; software, L.G. (Luca Guarino); validation, L.G. (Luca Gargano), A.C. and G.P.; formal analysis, L.G. (Luca Guarino); investigation, L.G. (Luca Guarino), L.G. (Luca Gargano), A.C. and S.P.N.; resources, L.G. (Luca Gargano) and M.S.; data curation, L.G. (Luca Guarino); writing—original draft, L.G. (Luca Guarino); writing—review and editing, L.G. (Luca Gargano) and A.C.; visualization, E.Z. and G.C.; supervision, E.Z. and M.S.; project administration, S.P.N. and G.P. All authors have read and agreed to the published version of the manuscript.

Funding

This research received no external funding.

Institutional Review Board Statement

According to the institutional policy, single-patient case reports that do not include identifiable information and are based on routine clinical care are exempt from formal ethics committee review. Specific Institutional Review Board approval was not required for this study.

Informed Consent Statement

Written informed consent was obtained from the patient for the procedure, image acquisition, and publication of this report and accompanying images.

Data Availability Statement

The original contributions presented in this study are included in the article/Supplementary Material. Further inquiries can be directed to the corresponding author.

Conflicts of Interest

The authors declare no conflicts of interest.

References

  1. Limandjaja, G.C.; Niessen, F.B.; Scheper, R.J.; Gibbs, S. The Keloid Disorder: Heterogeneity, Histopathology, Mechanisms and Models. Front. Cell Dev. Biol. 2020, 8, 360. [Google Scholar] [CrossRef]
  2. Merlino, L.; Dominoni, M.; Pano, M.R.; Pasquali, M.F.; Senatori, R.; Zino, G.; Gardella, B. Recent Progress in Keloid Mechanism and Treatment: A Comprehensive Review. Biomedicines 2025, 13, 2276. [Google Scholar] [CrossRef] [PubMed]
  3. Kim, H.J.; Kim, Y.H. Comprehensive Insights into Keloid Pathogenesis and Advanced Therapeutic Strategies. Int. J. Mol. Sci. 2024, 25, 8776. [Google Scholar] [CrossRef] [PubMed]
  4. Ekstein, S.F.; Wyles, S.P.; Moran, S.L.; Meves, A. Keloids: A review of therapeutic management. Int. J. Dermatol. 2021, 60, 661–671. [Google Scholar] [CrossRef]
  5. Delaleu, J.; Charvet, E.; Petit, A. Keloid disease: Review with clinical atlas. Part I: Definitions, history, epidemiology, clinics and diagnosis. Ann. Dermatol. Venereol. 2023, 150, 3–15. [Google Scholar] [CrossRef] [PubMed]
  6. Wilgus, T.A. Vascular Endothelial Growth Factor and Cutaneous Scarring. Adv. Wound Care 2019, 8, 671–678. [Google Scholar] [CrossRef]
  7. Gauglitz, G.G. Management of keloids and hypertrophic scars: Current and emerging options. Clin. Cosmet. Investig. Dermatol. 2013, 6, 103–114. [Google Scholar] [CrossRef]
  8. Cannarozzo, G.; Sannino, M.; Tamburi, F.; Morini, C.; Nisticò, S.P. Flash-lamp pulsed-dye laser treatment of keloids: Results of an observational study. Photomed. Laser Surg. 2015, 33, 274–277. [Google Scholar] [CrossRef]
  9. Huang, C.; Ogawa, R. Keloidal pathophysiology: Current notions. Scars Burn. Heal. 2021, 7, 2059513120980320. [Google Scholar] [CrossRef]
  10. Welzel, J. Optical coherence tomography in dermatology: A review. Ski. Res. Technol. 2001, 7, 1–9. [Google Scholar] [CrossRef]
  11. Schuh, S.; Holmes, J.; Ulrich, M.; Themstrup, L.; Jemec, G.B.E.; De Carvalho, N.; Pellacani, G.; Welzel, J. Imaging Blood Vessel Morphology in Skin: Dynamic Optical Coherence Tomography as a Novel Potential Diagnostic Tool in Dermatology. Dermatol. Ther. 2017, 7, 187–202. [Google Scholar] [CrossRef] [PubMed]
  12. Ulrich, M.; Themstrup, L.; de Carvalho, N.; Manfredi, M.; Grana, C.; Ciardo, S.; Kästle, R.; Holmes, J.; Whitehead, R.; Jemec, G.B.; et al. Dynamic Optical Coherence Tomography in Dermatology. Dermatology 2016, 232, 298–311. [Google Scholar] [CrossRef]
  13. de las Alas, J.M.; Siripunvarapon, A.H.; Dofitas, B.L. Pulsed dye laser for the treatment of keloid and hypertrophic scars: A systematic review. Expert Rev. Med. Devices 2012, 9, 641–650. [Google Scholar] [CrossRef] [PubMed]
  14. Foppiani, J.A.; Khaity, A.; Al-Dardery, N.M.; Hasan, M.T.; El-Samahy, M.; Lee, D.; Abdelwahab, O.A.; Abd-Alwahed, A.E.; Khitti, H.M.; Albakri, K.; et al. Laser Therapy in Hypertrophic and Keloid Scars: A Systematic Review and Network Meta-analysis. Aesthetic Plast. Surg. 2024, 48, 3988–4006. [Google Scholar] [CrossRef]
  15. Zappia, E.; Piccolo, D.; Del Re, C.; Bonan, P.; Guarino, L.; Ribero, S.; Galadari, H.; Nisticò, S.P. Combined Efficacy of Q-Switched 785 nm Laser and Tranexamic Acid Cream in the Treatment of Melasma: A Prospective Clinical Study. Photonics 2024, 11, 938. [Google Scholar] [CrossRef]
  16. Kuo, Y.R.; Jeng, S.F.; Wang, F.S.; Chen, T.; Huang, H.; Chang, P.; Yang, K.D. Flashlamp pulsed dye laser (PDL) suppression of keloid proliferation through down-regulation of TGF-beta1 expression and extracellular matrix expression. Lasers Surg. Med. 2004, 34, 104–108. [Google Scholar] [CrossRef]
  17. Nouri, K.; Jimenez, G.P.; Harrison-Balestra, C.; Elgart, G.W. 585-nm pulsed dye laser in the treatment of surgical scars starting on the suture removal day. Dermatol. Surg. 2003, 29, 65–73. [Google Scholar] [CrossRef]
  18. Clementi, A.; Cannarozzo, G.; Amato, S.; Zappia, E.; Bennardo, L.; Michelini, S.; Morini, C.; Sannino, M.; Longo, C.; Nistico, S.P. Dye Laser Applications in Cosmetic Dermatology: Efficacy and Safety in Treating Vascular Lesions and Scars. Cosmetics 2024, 11, 227. [Google Scholar] [CrossRef]
  19. Worley, B.; Kim, K.; Jain-Poster, K.; Reynolds, K.A.; Merkel, E.A.; Kang, B.Y.; Dirr, M.A.; Anvery, N.; Christensen, R.E.; Hisham, F.I.; et al. Treatment of traumatic hypertrophic scars and keloids: A systematic review of randomized control trials. Arch. Dermatol. Res. 2023, 315, 1887–1896. [Google Scholar] [CrossRef]
  20. Clementi, A.; Cassalia, F.; Cannarozzo, G.; Guarino, L.; Zappia, E.; Bennardo, L.; Mazzetto, R.; Danese, A.; Longo, C.; Nisticò, S.P. Laser-Assisted Exosome Delivery (LAED) with Fractional CO2 Laser: A Pilot Two-Case Report and Narrative Review. Cosmetics 2025, 12, 199. [Google Scholar] [CrossRef]
  21. Nistico, S.P.; Silvestri, M.; Zingoni, T.; Tamburi, F.; Bennardo, L.; Cannarozzo, G. Combination of Fractional CO2 Laser and Rhodamine-Intense Pulsed Light in Facial Rejuvenation: A Randomized Controlled Trial. Photobiomod. Photomed. Laser Surg. 2021, 39, 113–117. [Google Scholar] [CrossRef] [PubMed]
  22. Liu, A.; Moy, R.L.; Ross, E.V.; Hamzavi, I.; Ozog, D.M. Pulsed dye laser and pulsed dye laser-mediated photodynamic therapy in the treatment of dermatologic disorders. Dermatol. Surg. 2012, 38, 351–366. [Google Scholar] [CrossRef]
  23. Clementi, A.; Cannarozzo, G.; Guarino, L.; Zappia, E.; Cassalia, F.; Alma, A.; Sannino, M.; Longo, C.; Nisticò, S.P. Sequential Fractional CO2 and 1540/1570 nm Lasers: A Narrative Review of Preclinical and Clinical Evidence. J. Clin. Med. 2025, 14, 3867. [Google Scholar] [CrossRef] [PubMed]
  24. Wan, B.; Ganier, C.; Du-Harpur, X.; Harun, N.; Watt, F.; Patalay, R.; Lynch, M.D. Applications and future directions for optical coherence tomography in dermatology. Br. J. Dermatol. 2021, 184, 1014–1022. [Google Scholar] [CrossRef] [PubMed]
  25. Wang, J.V.; Bajaj, S.; Himeles, J.R.; Geronemus, R.G. Clinical and Optical Coherence Tomography Correlation of Vascular Conditions Treated with a Novel, Variable-Sequenced, Long-Pulsed, 532 and 1064 nm Laser with Cryogen Spray Cooling. Dermatol. Surg. 2024, 50, 277–281. [Google Scholar] [CrossRef]
  26. Ring, H.C.; Mogensen, M.; Hussain, A.A.; Steadman, N.; Banzhaf, C.; Themstrup, L.; Jemec, G. Imaging of collagen deposition disorders using optical coherence tomography. J. Eur. Acad. Dermatol. Venereol. 2015, 29, 890–898. [Google Scholar] [CrossRef]
  27. Abrouk, M.; Gianatasio, C.; Li, Y.; Holmes, J.; Dong, J.; Quiñonez, R.L.; Waibel, J.S. An Atlas of Optical Coherence Tomography (OCT): Elucidating In Vivo Differences of Scar Types Using OCT in Order to Guide Laser Treatment Parameters. J. Clin. Aesthet. Dermatol. 2022, 15, 30–39. [Google Scholar] [PubMed] [PubMed Central]
  28. Amato, S.; Nisticò, S.P.; Pellacani, G.; Guida, S.; Rossi, A.; Longo, C.; Berardesca, E.; Cannarozzo, G. Sequential and Combined Efficacious Management of Auricular Keloid: A Novel Treatment Protocol Employing Ablative CO2 and Dye Laser Therapy—An Advanced Single-Center Clinical Investigation. Cosmetics 2023, 10, 126. [Google Scholar] [CrossRef]
  29. Alster, T.S.; Williams, C.M. Treatment of keloid sternotomy scars with 585 nm flashlamp-pumped pulsed-dye laser. Lancet 1995, 345, 1198–1200. [Google Scholar] [CrossRef]
  30. Manuskiatti, W.; Wanitphakdeedecha, R.; Fitzpatrick, R.E. Effect of pulse width of a 595-nm flashlamp-pumped pulsed dye laser on the treatment response of keloidal and hypertrophic sternotomy scars. Dermatol. Surg. 2007, 33, 152–161. [Google Scholar] [CrossRef]
  31. Al-Mohamady, A.E.-S.; Ibrahim, S.M.; Muhammad, M.M. Pulsed dye laser versus long-pulsed Nd:YAG laser in the treatment of hypertrophic scars and keloid: A comparative randomized split-scar trial. J. Cosmet. Laser Ther. 2016, 18, 208–212. [Google Scholar] [CrossRef] [PubMed]
  32. Kennedy, B.F.; Hillman, T.R.; McLaughlin, R.A.; Quirk, B.C.; Sampson, D.D. In vivo dynamic optical coherence elastography using a ring actuator. Opt. Express 2009, 17, 21762–21772. [Google Scholar] [CrossRef]
  33. Ntziachristos, V.; Razansky, D. Molecular Imaging by Means of Multispectral Optoacoustic Tomography (MSOT). Chem. Rev. 2010, 110, 2783–2794. [Google Scholar] [CrossRef] [PubMed]
  34. Koehler, M.J.; König, K.; Elsner, P.; Bückle, R.; Kaatz, M. In Vivo assessment of human skin aging by multiphoton laser scanning tomography. Opt. Lett. 2006, 31, 2879–2881. [Google Scholar] [CrossRef] [PubMed]
  35. Lee, A.J.; Hugonnet, H.; Park, W.; Park, Y. Three-dimensional label-free imaging and quantification of migrating cells during wound healing. Biomed. Opt. Express 2020, 11, 6812–6824. [Google Scholar] [CrossRef]
  36. Stockbridge, C.R.; Lu, Y.; Moore, J.; Hoffman, S.M.; Paxman, R.G.; Toussaint, K.C., Jr.; Bifano, T.G. Focusing through dynamic scattering media. Opt. Express 2012, 20, 15086–15092. [Google Scholar] [CrossRef]
  37. Hillman, T.R.; Yamauchi, T.; Choi, W.; Dasari, R.R.; Feld, M.S.; Park, Y.; Yaqoob, Z. Digital optical phase conjugation for delivering two-dimensional images through turbid media. Sci. Rep. 2013, 3, 1909. [Google Scholar] [CrossRef]
  38. Ulrich, M.; Themstrup, L.; de Carvalho, N.; Ciardo, S.; Holmes, J.; Whitehead, R.; Welzel, J.; Jemec, G.; Pellacani, G. Dynamic optical coherence tomography of skin blood vessels—Proposed terminology and practical guidelines. J. Eur. Acad. Dermatol. Venereol. 2018, 32, 152–155. [Google Scholar] [CrossRef]
  39. Zhou, L.; Zhou, Q.; Zheng, C.; Wang, Z.; Rao, M. Multimodal ultrasound assessment for monitoring keloid severity and treatment response. Sci. Rep. 2025, 15, 8568. [Google Scholar] [CrossRef] [PubMed] [PubMed Central]
  40. Wang, H.; Li, Q.; Xue, M.; Zhao, P.; Cui, J. Cardiac Myxoma: A Rare Case Series of 3 Patients and a Literature Review. J. Ultrasound Med. 2017, 36, 2285–2293. [Google Scholar] [CrossRef]
  41. Schianchi, L.; Vaira, F.; Chessa, M.; Flocco, S.F.; Magon, A.; Conte, G.; Olaya, K.G.Z.; Bortolussi, G.; Cioffi, E.; Di Nicola, M.R.; et al. The Effects of Laser Therapy in Treating Hypertrophic Scars and Keloids after Median Sternotomy: A Scoping Review. Congenit. Heart Dis. 2024, 19, 363–374. [Google Scholar] [CrossRef]
  42. Nast, A.; Gauglitz, G.; Lorenz, K.; Metelmann, H.; Paasch, U.; Strnad, V.; Weidmann, M.; Werner, R.N.; Bauerschmitz, J. S2k guidelines for the therapy of pathological scars (hypertrophic scars and keloids)—Update 2020. J. Dtsch. Dermatol. Ges. 2021, 19, 312–327. [Google Scholar] [CrossRef]
  43. Walsh, L.A.; Wu, E.; Pontes, D.; Kwan, K.R.; Poondru, S.; Miller, C.H.; Kundu, R.V. Keloid treatments: An evidence-based systematic review of recent advances. Syst. Rev. 2023, 12, 42. [Google Scholar] [CrossRef] [PubMed]
  44. Zhang, G.; Liu, Z.; Li, Z.; Xu, Y. Future Directions About Keloid Scars Based on Pathogenesis and Therapies. Clin. Cosmet. Investig. Dermatol. 2024, 17, 2391–2408. [Google Scholar] [CrossRef] [PubMed]
  45. Kim, E.Y.; Hussain, A.; Khachemoune, A. Evidence-based management of keloids and hypertrophic scars in dermatology. Arch. Dermatol. Res. 2023, 315, 1487–1495. [Google Scholar] [CrossRef] [PubMed]
  46. Ud-Din, S.; Bayat, A. Noninvasive Objective Tools for Quantitative Assessment of Skin Scarring. Adv. Wound Care 2022, 11, 132–149. [Google Scholar] [CrossRef] [PubMed]
  47. Zakrzewski, B.; Bednarski, I.A.; Szala, K.; Borodacz, J.; Zakrzewska, A.; Zakrzewski, M.; Narbutt, J.; Lesiak, A. Non-surgical keloid management—Review of established and emerging treatment strategies. Forum Dermatol. 2025. Advance online publication. [Google Scholar] [CrossRef]
  48. Michelson Diagnostics Ltd. VivoSight Dx Instructions for Use (USA); Document 1191.DO.267; Michelson Diagnostics Ltd.: Maidstone, UK, 2024; Available online: https://us.vivosight.com/wp-content/uploads/2024/04/1191.DO_.267-Issue-9-VivoSight-Dx-Instructions-for-Use-USA-for-shipping.pdf (accessed on 25 January 2026).
  49. Themstrup, L.; Banzhaf, C.A.; Mogensen, M.; Jemec, G.B. Optical coherence tomography imaging of non-melanoma skin cancer undergoing photodynamic therapy reveals subclinical residual lesions. Photodiagn. Photodyn. Ther. 2014, 11, 7–12. [Google Scholar] [CrossRef]
  50. Cantisani, C.; Baja, A.V.; Gargano, L.; Rossi, G.; Ardigò, M.; Soda, G.; Boostani, M.; Kiss, N.; Pellacani, G. Optical Coherence Tomography as a Valuable Tool for the Evaluation of Cutaneous Kaposi Sarcoma Treated with Imiquimod 5% Cream. Diagnostics 2023, 13, 2901. [Google Scholar] [CrossRef]
  51. Basson, R.; Bayat, A. Skin scarring: Latest update on objective assessment and optimal management. Front. Med. 2022, 9, 942756. [Google Scholar] [CrossRef]
  52. Han, Y.; Sun, Y.; Yang, F.; Liu, Q.; Fei, W.; Qiu, W.; Wang, J.; Li, L.; Zhang, X.; Wang, A.; et al. Non-invasive imaging of pathological scars using a portable handheld two-photon microscope. Chin. Med. J. 2024, 137, 329–337. [Google Scholar] [CrossRef]
  53. Verhaegen, P.D.; van Zuijlen, P.P.; Pennings, N.M.; Van Marle, J.; Niessen, F.B.; Van Der Horst, C.M.A.M.; Middelkoop, E. Differences in collagen architecture between keloid, hypertrophic scar, normotrophic scar, and normal skin: An objective histopathological analysis. Wound Repair. Regen. 2009, 17, 649–656. [Google Scholar] [CrossRef]
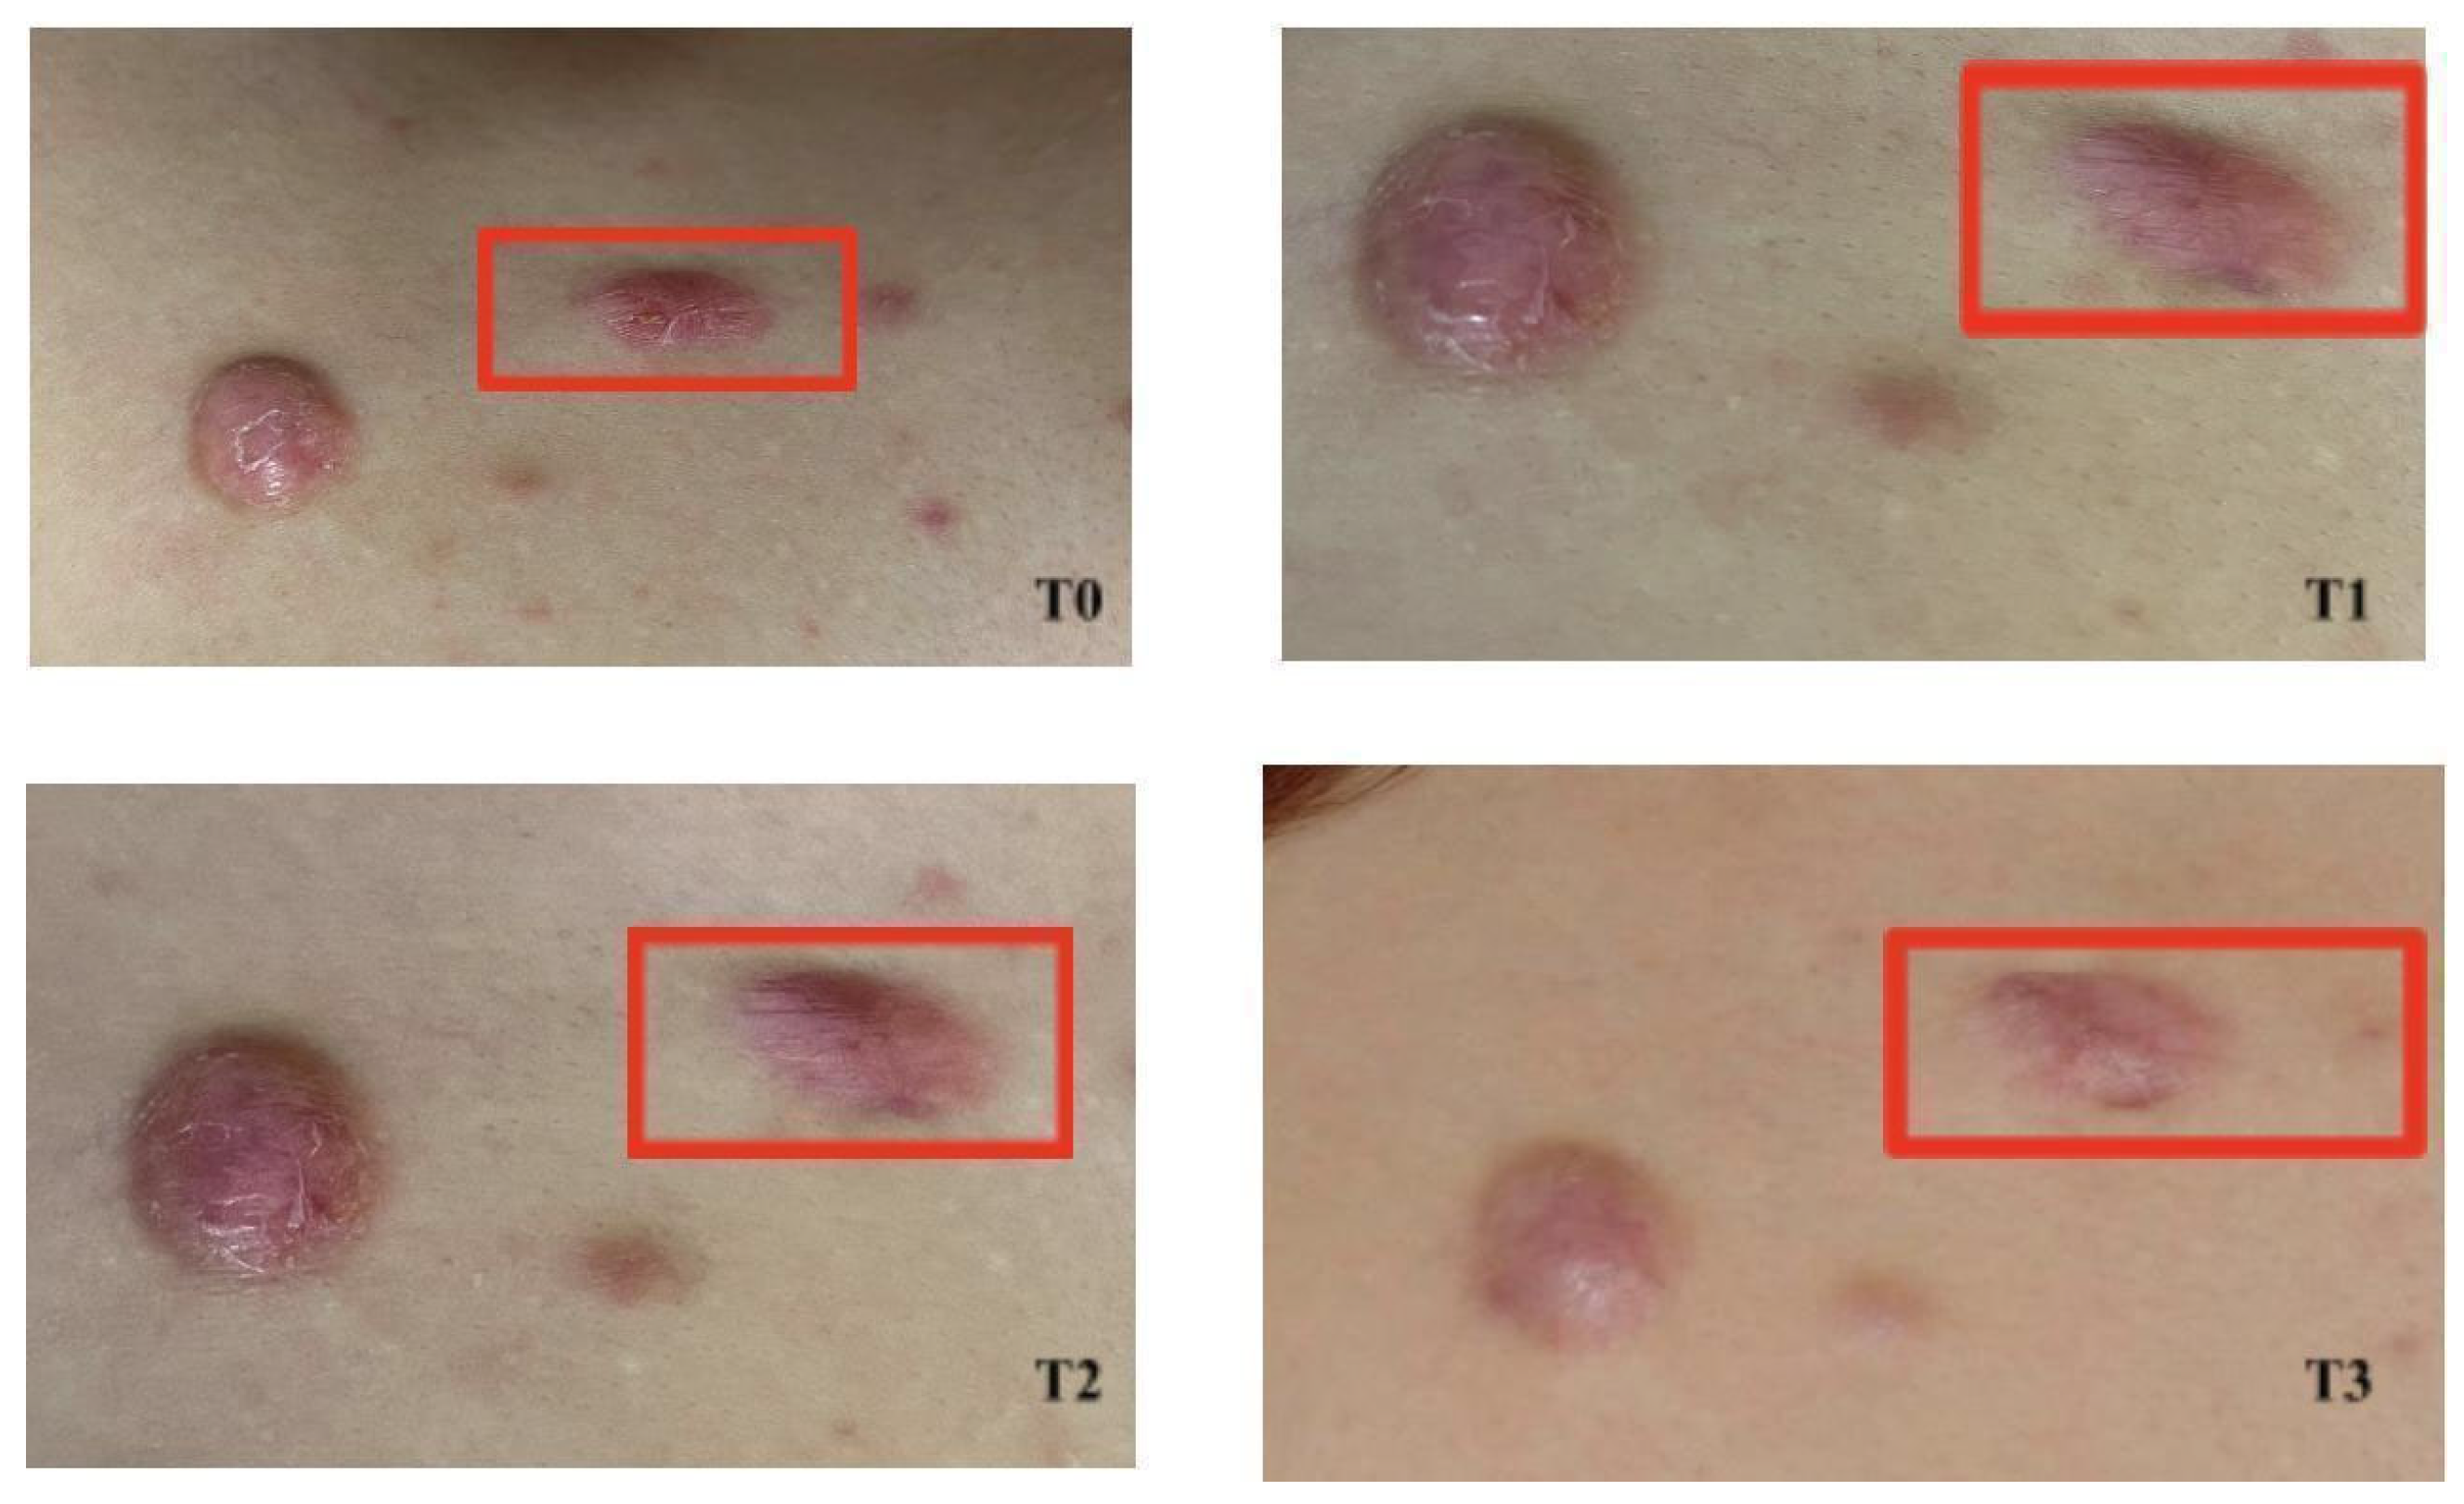
Figure 1. Clinical images of the thoracic keloid at four time points: T0 (baseline), T1 (~30 days), T2 (~60 days), and T3 (~90 days) after initiation of PDL treatment. The standardized 4 × 4 mm region of interest (ROI) analyzed by D-OCT is indicated in red. Progressive softening, flattening, and reduction in erythema are visible over time, which is in line with the quantitative D-OCT findings.
Optics 07 00013 g001
Figure 2. Representative en-face D-OCT flow maps acquired over the same 4 × 4 mm ROI at 0.15 mm (superficial), 0.30 mm (intermediate), and 0.50 mm (deep) depths at T0 (baseline), T1 (~30 days), T2 (~60 days), and T3 (~90 days). At 0.15 mm, a near-complete disappearance of detectable flow signal is observed over time, which is consistent with collapse of the superficial plexus. At 0.30 mm, there is a marked but incomplete reduction in the congested mid-dermal network. At 0.50 mm, the vascular plexus appears relatively preserved in area but progressively reorganized into finer, more elongated vessels, which is in agreement with the quantitative depth-resolved metrics. Scale: 4 × 4 mm per ROI. Color bars: relative flow signal (a.u.). Display intensity scaling is automatically set by the device software and may differ between panels; therefore, color intensity is intended for qualitative visualization only. Quantitative longitudinal comparisons are based on the segmented vascular metrics reported in Table 1. Panels are provided at native resolution with consistent depth labeling and spatial scale, and the analyzed ROI corresponds to the full 4 × 4 mm field shown.
Optics 07 00013 g002
Figure 3. Temporal evolution of D-OCT vascular metrics by depth. Line plot showing en-face vascular area (%) at three dermal depths (0.15, 0.30 and 0.50 mm) from baseline (T0) to ~90 days (T3). The superficial and intermediate layers show marked reductions (Δ −87.94% and −38.13%), whereas the deep layer exhibits only a minor change (Δ −4.69%). Trend lines indicate stabilization at T3 with no signs of further increase; however, in the absence of data beyond 90 days, future studies may explore longer follow-ups to confirm whether the curves remain stable or fluctuate.
Optics 07 00013 g003
Table 1. Quantitative D-OCT metrics extracted from the standardized 4 × 4 mm ROI at 0.15, 0.30, and 0.50 mm depths at T0 (baseline), T1 (~30 days), T2 (~60 days), and T3 (~90 days). The table reports absolute values and percentage changes (Δ% vs. T0) for vascular en-face area (%), vessel length density (a.u.), junction density (a.u.), and mean vessel caliber (px). These data highlight a depth-dependent remodeling pattern, with near-complete collapse of the superficial plexus, marked but incomplete reduction at the mid-dermal level, and modest area changes with reorganization of the deep plexus.
Depth (mm)MetricUnitT0T1T2T3Δ% T1 vs. T0Δ% T2 vs. T0Δ% T3 vs. T0
0.15Vascular en-face area%67.2510.711.268.11−84.07−98.13−87.94
0.30Vascular en-face area%62.0249.9137.8938.37−19.53−38.91−38.13
0.50Vascular en-face area%75.2767.568.7771.74−10.32−8.64−4.69
0.15Vessel length densitya.u.0.030.0200.01−33.33−100−66.67
0.30Vessel length densitya.u.0.070.060.060.05−14.29−14.29−28.57
0.50Vessel length densitya.u.0.050.070.070.06404020
0.15Junction densitya.u.0000n.d.n.d.n.d.
0.30Junction densitya.u.0.010.010.010.01000
0.50Junction densitya.u.0.010.010.010.01000
0.15Mean vessel caliber (proxy)px23.255.966.385.92−74.37−72.56−74.54
0.30Mean vessel caliber (proxy)px8.637.816.737.06−9.5−22.02−18.19
0.50Mean vessel caliber (proxy)px15.4510.059.911.38−34.95−35.92−26.34
Disclaimer/Publisher’s Note: The statements, opinions and data contained in all publications are solely those of the individual author(s) and contributor(s) and not of MDPI and/or the editor(s). MDPI and/or the editor(s) disclaim responsibility for any injury to people or property resulting from any ideas, methods, instructions or products referred to in the content.