Article

High-Myopia Diagnosis by Reciprocal of Circle Radius in Choroidal Image

1
Department of Electronic Engineering, National Kaohsiung University of Science and Technology, Kaohsiung City 807618, Taiwan
2
Department of Computer Science and Information Engineering, National Yunlin University of Science and Technology, Yunlin 64002, Taiwan
3
Department of Medical Informatics, Chung Shan Medical University, Taichung 40201, Taiwan
*
Author to whom correspondence should be addressed.
Optics 2025, 6(2), 12; https://doi.org/10.3390/opt6020012
Submission received: 12 January 2025 / Revised: 15 March 2025 / Accepted: 18 March 2025 / Published: 1 April 2025
(This article belongs to the Special Issue Advanced Optical Imaging for Biomedicine)

Abstract

:
Light-emitting electronic devices are widely used at present, and this increases the risk of myopia. Thus, the early identification of myopia and the prevention of further exacerbation has become an essential issue in ophthalmology. Recently, choroidal imaging has been used to assist in the early identification and prevention of high myopia due to the fact that swept-source optical coherence tomography (SS-OCT) is an essential diagnostic tool in ophthalmology. This study presents a novel method to judge high myopia using the SS-OCT image dataset obtained from a university hospital. In order to relate the proposed method to the region of the SS-OCT image, the curvature analysis of an arbitrary segmented curve similar to the region of the SS-OCT is first illustrated by quadratic functions and matrix operations. Next, the curvature formula is derived and then applied to the choroidal curve obtained manually in each patient’s choroidal image. In particular, we applied the curvature analysis and its results to find the maximal curvature and average curvature of each patient’s choroidal curve. Finally, we used the maximal curvature and average curvature to evaluate high myopia. The accuracy of the proposed maximal curvature method and average curvature method in the experimental results to verify the proposed method.

1. Introduction

Myopia is the main cause of visual impairment in modern people [1]. It is a refractive error caused by excessive axial elongation which cannot be recovered naturally [2]. Moreover, it has been associated with many complications, such as myopic macular degeneration (MMD), retinal detachment (RD), cataract, and open-angle glaucoma (OAG). These complications can lead to irreversible visual impairment [3,4,5]. More seriously, it is estimated that the world myopia rate will reach 49.8% and 9.8% of high myopia by 2050 [6,7]. Thus, many scholars are focused on the analysis and prevention of myopia.
Recently, optical coherence tomography (OCT) has increasingly developed and has been used as an auxiliary tool in ophthalmology in which choroidal images are part of the information obtained from the application. As the information of the images implicates the pathology of myopia, OCT can be useful in the determination of myopia. Swept-source optical coherence tomography (SS-OCT) uses a longer wavelength (1050 nm) so that clearer retina and choroidal images can be obtained as another tool for judging myopia [8]. Choroid is located exterior to the retina, which supplies blood to the eye. BartolPuyal et al. [9] indicated that choroidal thickness changes along with age, AXL, and myopia factors. Wang et al. [10] found that patients with high myopia will have a much thinner choroid than the patients without myopia. In other words, choroidal thickness is negatively related to high myopia. If the level of myopia can be automatically predicted based on the choroid thicknesses, it will be very convenient for diagnosing the complications of myopia. Moreover, choroid thinning not only correlates with myopia progression but is also related to other complications, such as staphyloma and chorioretinal atrophy in high myopia. Park et al. [11] investigated whether a foveal curvature affects the development of two major myopic macular complications, myopic traction maculopathy (MTM) and myopic choroidal neovascularization (mCNV). These results suggest that a steeper change in foveal curvature plays a role in the development of MTM but not mCNV in high myopes. In [12], a systematic review and meta-analyses of studies published before June 2019 on myopia complications is given. In [13], the authors formulated and tested ensemble learning models to classify axial length (AXL) from choroidal thickness (CT), as indicated on fovea-centered, 2D single optical coherence tomography (OCT) images. The results show high accuracy.
This study presents a novel method to judge high myopia using the SS-OCT image dataset of a particular university hospital. To present the proposed method related to the region of image (ROI), the curvature analysis of an arbitrary segmented curve similar to the ROI of our image is first illustrated using quadratic functions and matrix operations. Next, the obtained curvature formula is applied to the choroidal curve of the ROI obtained manually in each patient’s choroidal image. In other words, we apply the curvature analysis and its results to find the maximal curvature and average curvature of each patient’s choroidal curve. Finally, we use the maximal curvature and average curvature to evaluate high myopia.
The remainder of this study is organized as follows. Section 2 gives some preliminary findings. Section 3 presents the proposed approach. Section 4 lists the results of experiments to verify the advantages of the proposed approach. Some concluding remarks are provided in Section 5.

2. Preliminary Knowledge

This section reviews background knowledge about myopia and curvature for later use.

Myopia

Myopia or nearsightedness is a refractive error caused by excessive axial elongation. At present, myopia level is detailed as shown below:
  • Low myopia: degree ≤ 300;
  • Moderate: 300 < degree < 600;
  • High myopia: 600 ≤ degree.
Alternatively, it is equivalent to the following:
  • Emmetropia: −0.5D < SPH ≤ 0.5D;
  • Mild to moderate myopia: −6.00D < SPH ≤ −0.5D;
  • High myopia: SPH ≤ −6.00D.
SPH is spherical correction.
Myopia is regarded as a disease that cannot be recovered naturally. It can only be controlled by drugs or surgery or corrected optically by glasses, contact lenses, or refractive surgery. If it is not controlled, it is easy to cause myopia to exceed 600 degrees and become high myopia. High myopia will easily cause other complications such as cataract, glaucoma, retinal detachment, etc. [1,14]. In addition, the eye axis length greater than 26 mm or 26.5 mm can be judged as high myopia [15].
One of the most basic and popular auxiliary diagnostic tools in ophthalmology in recent years is optical coherence tomography (OCT). Its process is convenient and fast, and many important information can be obtained. One of them is the imaging data of the choroid. Compared with OCT, swept-source optical coherence tomography (SS-OCT) uses a longer wavelength (1050 nm), which can obtain better quality image signals for the choroid or retina and other deep eye structures [16,17,18,19].
The choroid is located slightly outside the retina in the eyeball and is an important part of the blood supply to the eye. In this study, SS-OCT was used to obtain clearer choroidal imaging data and then successfully depict choroidal curve of each eyeball.

3. Method

This section presents the proposed method related to the region of image (ROI).

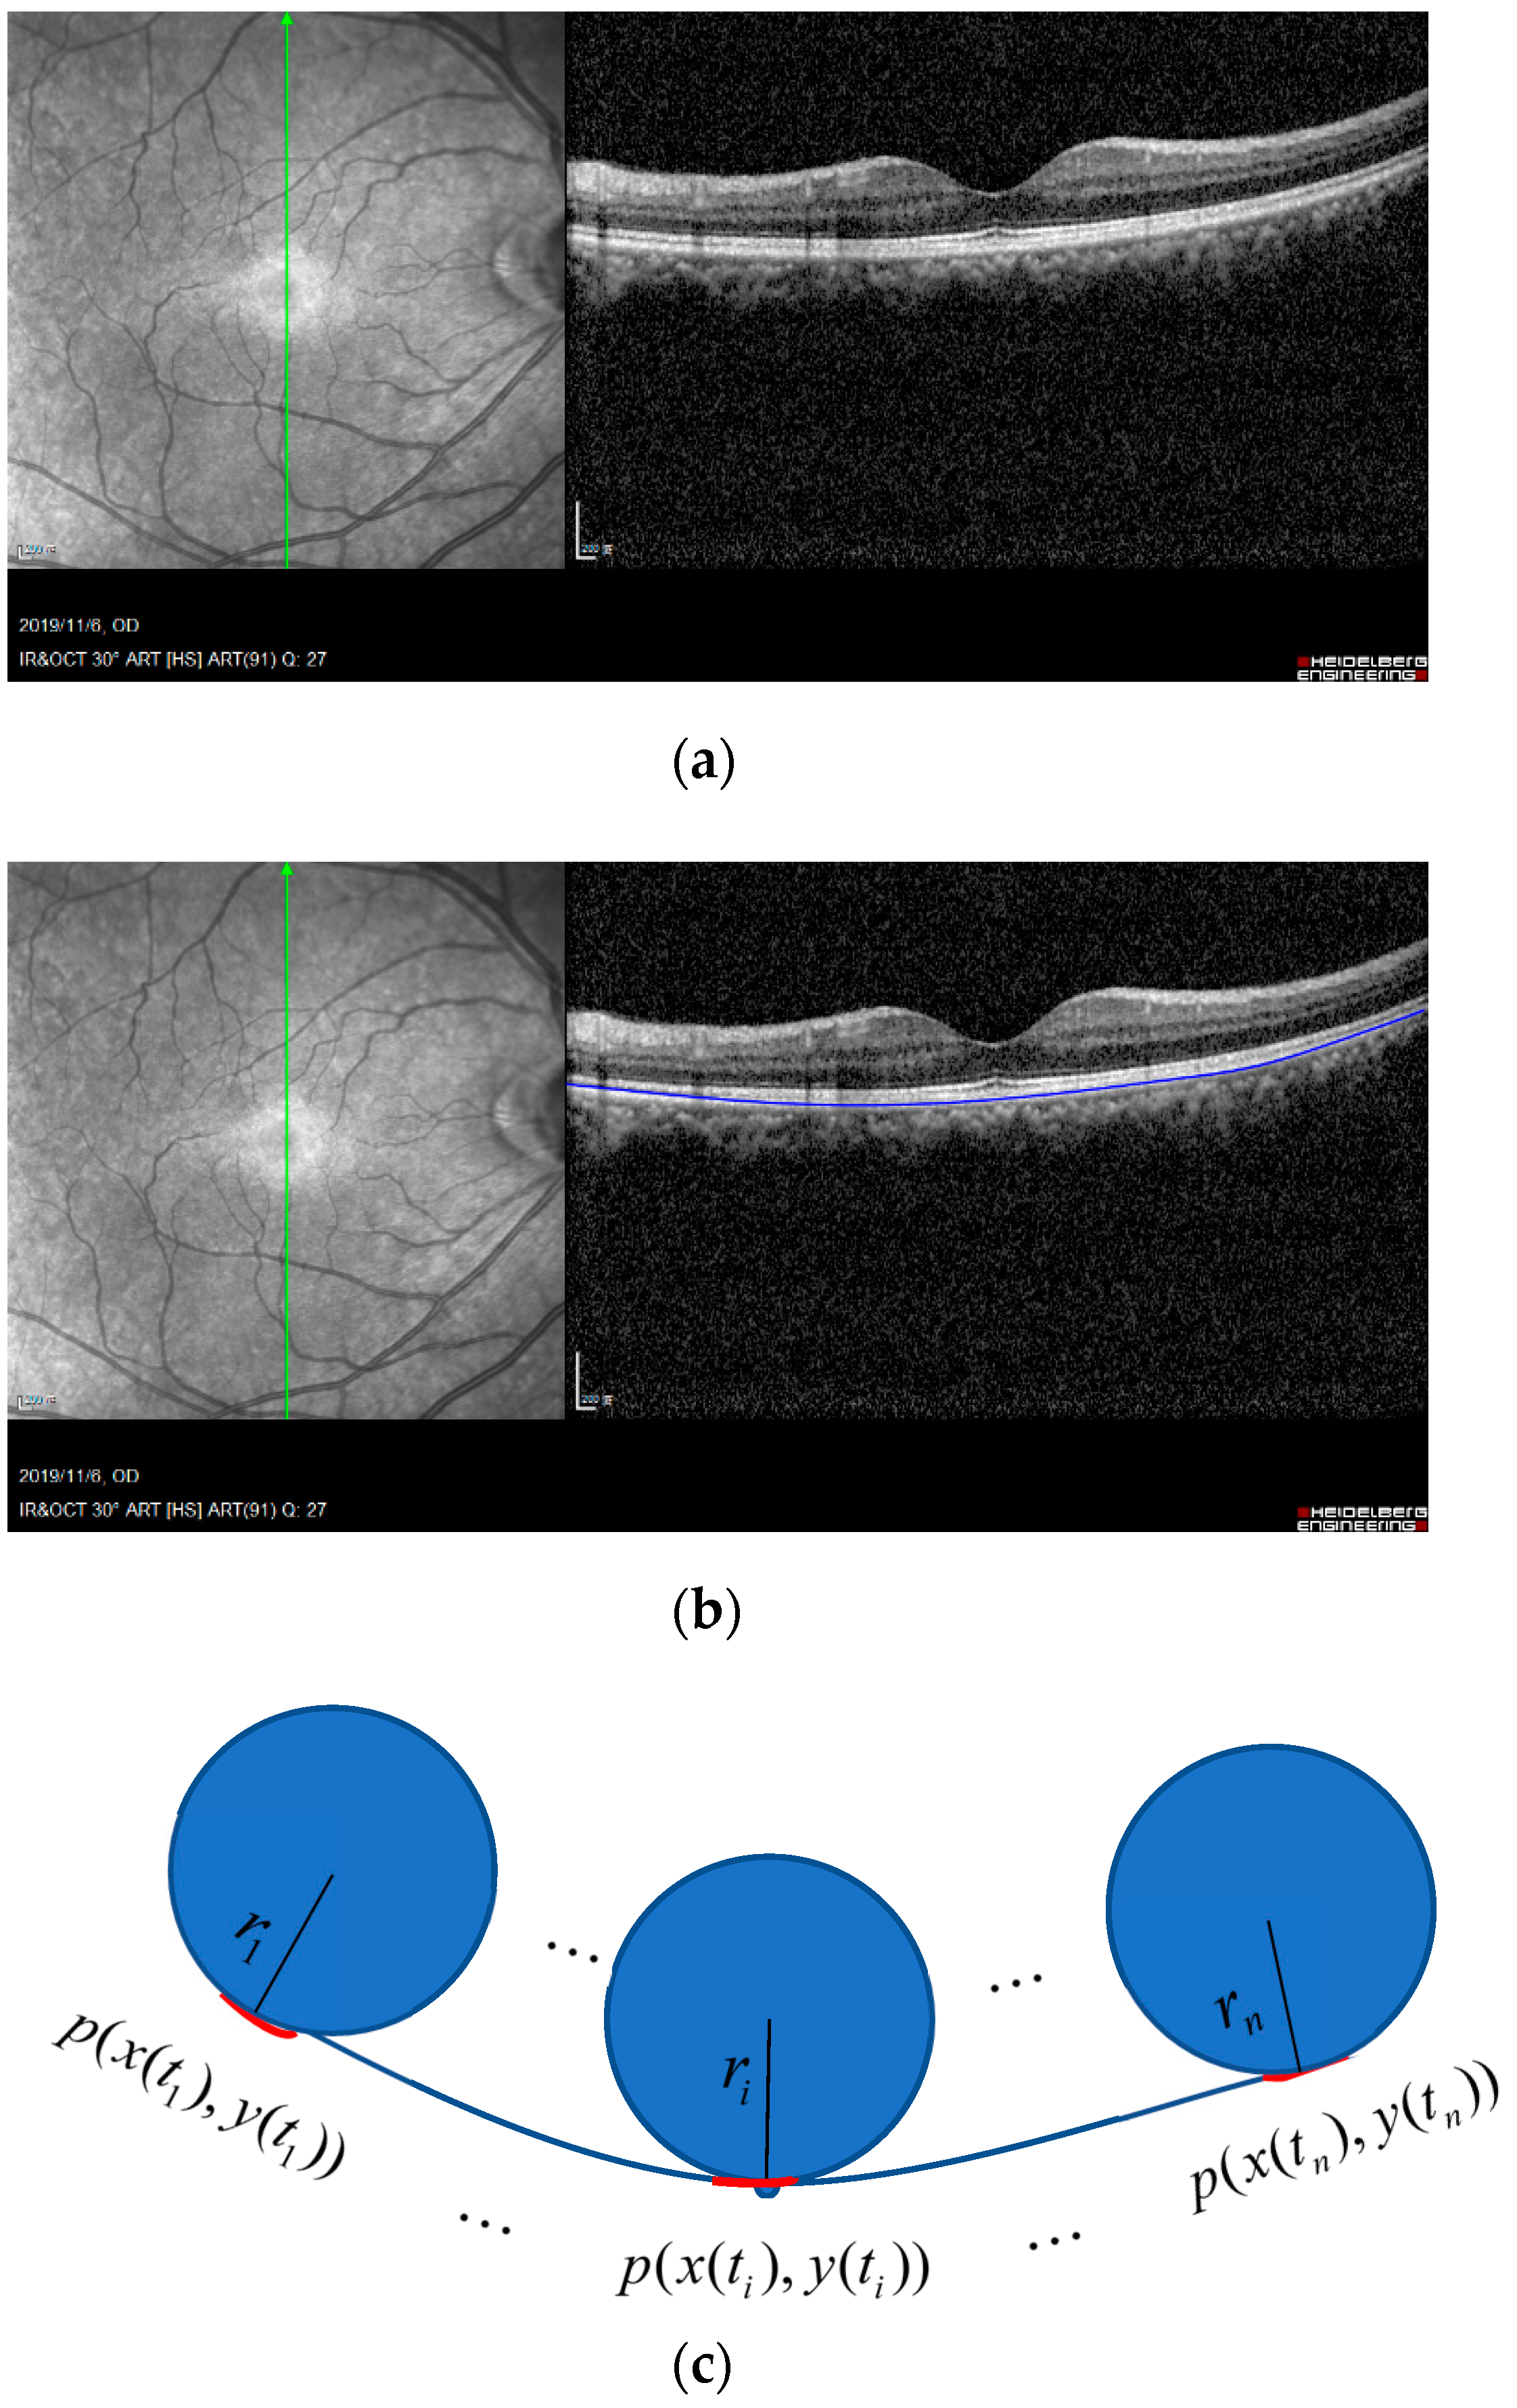
3.1. Automatical Choroidal Segmentation and Thinning

In order to automatically evaluate the curvature of a curve obtained from the choroid marginal, we first adopt thresholding method (black and white binary segmentation) to roughly segment the region of the choroid. Next, the thinning method is applied to obtain the curve of the choroid marginal automatically. Finally, we connect white to the marked points on the curve of the choroid marginal from left to right.

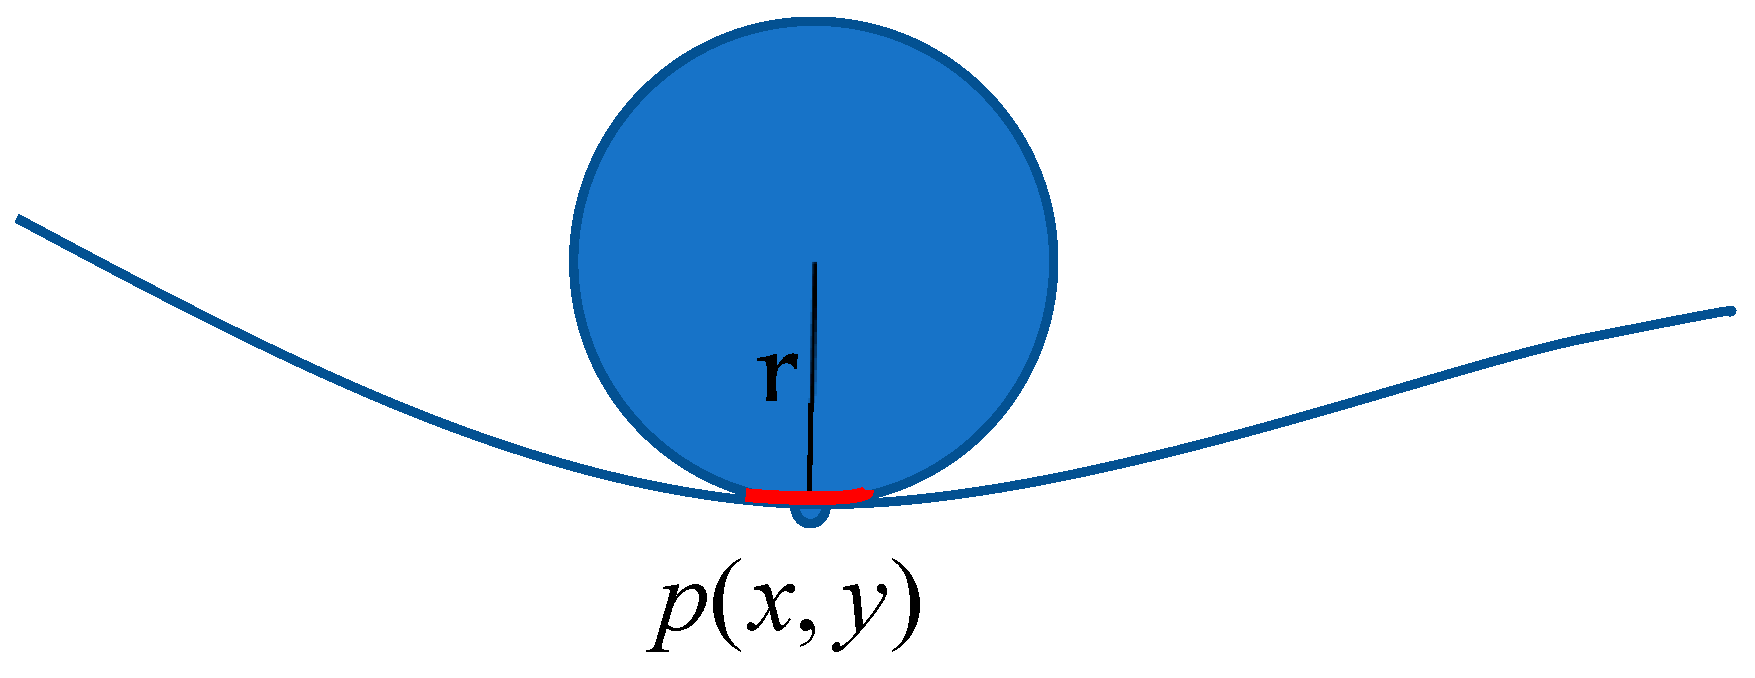
3.2. Curvature Computation of a Small Segment on the Choroid Curve

The curvature principle of this study is to take a small segment near each point on the choroid curve to make a circle. The reciprocal of the radius of the circle is the curvature of this small segment. For example, the red arc in Figure 1 is a small segment near the point p(x,y) on the choroid curve. We make a circle from the red arc and find the radius of the circle. The reciprocal 1/r of the radius r is the curvature of the red arc.

3.3. Curvature of Patient’s Choroidal Curve

In this sub-section, we first apply the curvature analysis and its results in Section 3.1 to find the maximal curvature and average curvature of each patient’s choroidal curve, as shown in Figure 2b with the blue curve. As shown in Figure 2c, we assume that the choroid curve is a function that changes with time, p ( x ( t i ) , y ( t i ) ) ,   i = 1 , , n , and the radius is also a function of time, r ( t i ) ,   i = 1 , , n . Then, we utilize max 1 r ( t i ) i = 1 , , n and average 1 r ( t i ) i = 1 , , n to evaluate high myopia.

4. Experimental Results and Discussion

This section lists the experimental data and experimental results. First, a description of the patient data is given. Second, the oversampling for imbalanced data is discussed. Finally, the results of applying curvature to patient data are presented.

4.1. Description of Patient Data

4.1.1. Participants

Patients who underwent OCT imaging and AXL evaluation at the Department of Ophthalmology, Fu Jen Catholic University Hospital, between September 2017 and December 2019, were included in this study. We collected comprehensive information on participants’ sex, age, height, weight, and best-corrected visual acuity (29, 30). Patients with incomplete data or with retinopathy (e.g., diabetic retinopathy and age-related macular degeneration) and a history of previous photodynamic therapy were excluded from this study.

4.1.2. Optical Coherence Tomography Machine and Scanning Settings

Spectralis SD-OCT equipment generated from Heidelberg Engineering, Heidelberg, Germany, was used to evaluate CT for both eyes in daytime. As shown in Figure 3, cross-sectional and longitudinal scanning was performed in each eye. The location of the fovea is defined as the anatomical depression in the macula. There were six CT measurement points: fovea, 3 mm nasal to the fovea, and 3 mm temporal to the fovea in transverse images; fovea, 3 mm above the fovea, and 3 mm below the fovea in longitudinal images. Each image was measured independently by two investigators and rechecked by a third investigator.

4.1.3. AXL Measurement

The AXL of the eye was assessed using non-contact technology on a Lenstar LS 900 platform (HAAG-Streit, Mason, OH, USA).

4.1.4. Features

This dataset has 11 features (Table 1), namely (1) participants’ gender, age, height, and weight; (2) three cross-sectional CT; (3) three longitudinal CT scans; (4) AXL; and (5) choroidal images and choroidal thickness as shown in Figure 4 (non-high myopia thickness: 164 ± 31 µm; high myopia thickness: 92 ± 18 µm).
In these patient data, we manually record each choroidal curve, and each recorded curve has to be confirmed by an ophthalmologist to ensure the correctness of these data. Finally, we record 356 complete eyeballs from 188 patients. In this dataset, there are 173 left eyeballs and 183 right eyeballs. As shown in Table 1, non-high myopia and high myopia are 282 and 74. The correlation between OCT data and axial length are described as follows. In the binary classification, there were 282 (79.21%) eyes with AXL < 26 mm and 74 (20.78%) eyes with AXL > 26 mm. In the multiclass classification, there were 14 (3.93%) eyes with AXL < 22 mm, 268 (75.28%) between 22 and 26 mm, and 74 (20.78%) eyes with AXL > 26 mm. The average AXL was 24.55 mm in the right eye and 24.61 mm in the left eye.

4.2. Oversampling for Imbalanced Data

As shown in Table 1, the proportion of non-high myopia and high myopia is 0.792:0.208 for binary classification. Therefore, the dataset is an imbalanced set. Using these imbalanced data for the proposed method may yield biased results, i.e., high myopia recognition would be sacrificed to increase accuracy. Oversampling is a popular technique for treating imbalanced data to avoid the issues mentioned above. It increases the number of samples of the smaller-sized categories so that the sample sizes are consistent across all categories. This study uses three oversampling techniques as follows.
Random oversampling (ROS): The data of the categories with fewer samples are randomly selected and replicated so that the proportion of non-high myopia data and high myopia data is the same.
Synthetic minority oversampling technique (SMOTE) [20,21]: For the categories of smaller sample sizes, sample x and its k-nearest neighbor samples x j ( j = 1 , , k ) are found. One individual x j is selected from x j , and a new sample based on the linear combination of x i and x j is created. Accordingly, the proportion of non-high myopia data and high myopia data is the same.
Adaptive synthetic sampling (ADASYN) [22]: The number of new creating samples of the small-sized categories is ascertained according to the dataset distribution. As opposed to SMOTE, creating new samples is negatively related to the number of the k-nearest neighbors around sample x of the categories. Accordingly, the proportion of non-high myopia data and high myopia data is the same.
Finally, the numbers of dataset with and without oversampling are both 282.

4.3. Results, Discussion, and Limitations

In this sub-section, we apply the proposed method in Section 3 to 282 + 282 patients data obtained from the three oversampling techniques including ROS, SMOTE, and ADASYN. We used the average curvature of normal patient data as the cutoff value to evaluate accuracy. Table 2 shows the cases that have the choroidal morphology of high myopia with curvature (curvature greater than or equal to the average value) but have spherical equivalents or axial lengths that are non-high myopia. As shown in Table 3, we list the accuracy of the proposed maximal curvature method and average curvature method for high myopia case (AXL > 26 mm). Both maximal curvature method and average curvature method have at least 88% accuracy. Compared to the method in [13], the proposed method has comparable accuracy.
This study has several limitations. First, our sample size was relatively small, especially those with AXL < 22 mm or >26 mm. Second, the relationship between SS-OCT and the three oversampling techniques are not determined. Third, myopic retinal diseases (MMD, MTM, and mCNV) are not considered because the main focus of this study is to evaluate the correlation between curvature and high myopia using the reciprocal of the circle radius in the choroidal image. Future studies should address these limitations, and we expect to conduct more investigations using a larger dataset.

5. Conclusions

This study proposed a novel method to evaluate high myopia. The ophthalmological data in this study is the SS-OCT image data of an ophthalmology clinic in a university affiliated hospital. We adopted three oversampling techniques including ROS, SMOTE, and ADASYN to change the proportion of non-high myopia and high myopia 0.792:0.208 to 1:1 for binary classification. Then, we applied curvature analysis to propose a formula including maximal curvature and average curvature for evaluating high myopia. Both maximal curvature method and average curvature method have at least accuracy 90%.

Author Contributions

Conceptualization, S.-T.C.; methodology, S.-T.C.; software, C.-F.C., K.-Y.C., Y.-H.H., S.-J.T. and J.-Q.L.; writing—original draft preparation, S.-T.C.; writing—review and editing, S.-T.C., C.-F.C., K.-Y.C., Y.-H.H., S.-J.T., J.-Q.L. and R.-J.Y.; funding acquisition, R.-J.Y. All authors have read and agreed to the published version of the manuscript.

Funding

This research received no external funding.

Institutional Review Board Statement

As this study involved human participants, it was reviewed and approved by Fu Jen Catholic University Hospital, Fu Jen Catholic University. Written informed consent for participation was not required for this study in accordance with the national legislation and the institutional requirements.

Data Availability Statement

Data is unavailable due to privacy or ethical restrictions.

Conflicts of Interest

The authors declare no conflicts of interest.

References

  1. Morgan, I.G.; Ohno-Matsui, K.; Saw, S.M. Myopia. Lancet 2012, 379, 1739–1748. [Google Scholar] [PubMed]
  2. Meng, W.; Butterworth, J.; Malecaze, F.; Calvas, P. Axial Length of Myopia: A Review of Current Research. Ophthalmologica 2011, 225, 127–134. [Google Scholar] [CrossRef] [PubMed]
  3. Flitcroft, D. The complex interactions of retinal, optical and environmental factors in myopia aetiology. Prog. Retin. Eye Res. 2012, 31, 622–660. [Google Scholar] [CrossRef] [PubMed]
  4. Tideman, J.W.L.; Snabel, M.C.C.; Tedja, M.S.; van Rijn, G.A.; Wong, K.T.; Kuijpers, R.W.A.M.; Vingerling, J.R.; Hofman, A.; Buitendijk, G.H.S.; Keunen, J.E.E.; et al. Association of Axial Length With Risk of Uncorrectable Visual Impairment for Europeans With Myopia. JAMA Ophthalmol. 2016, 134, 1355–1363. [Google Scholar] [CrossRef] [PubMed]
  5. Ikuno, Y. Overview of the complications of high myopia. Retina 2017, 37, 2347–2351. [Google Scholar] [CrossRef] [PubMed]
  6. Holden, B.A.; Fricke, T.R.; Wilson, D.A.; Jong, M.; Naidoo, K.S.; Sankaridurg, P.; Wong, T.Y.; Naduvilath, T.; Resnikoff, S. Global Prevalence of Myopia and High Myopia and Temporal Trends from 2000 through 2050. Ophthalmology 2016, 123, 1036–1042. [Google Scholar] [CrossRef] [PubMed]
  7. Zi, Y.; Deng, Y.; Zhao, J.; Ji, M.; Qin, Y.; Deng, T.; Jin, M. Morphologic and biochemical changes in the retina and sclera induced by form deprivation high myopia in guinea pigs. BMC Ophthalmol. 2020, 20, 105. [Google Scholar] [CrossRef]
  8. Waldstein, S.M.; Faatz, H.; Szimacsek, M.; Glodan, A.-M.; Podkowinski, D.; Montuoro, A.; Simader, C.; Gerendas, B.S.; Schmidt-Erfurth, U. Comparison of penetration depth in choroidal imaging using swept source vs spectral domain optical coherence tomography. Eye 2015, 29, 409–415. [Google Scholar] [CrossRef] [PubMed]
  9. Bartol-Puyal, F.D.A.; Isanta, C.; Ruiz-Moreno, O.; Abadia, B.; Calvo, P.; Pablo, L. Distribution of Choroidal Thinning in High Myopia, Diabetes Mellitus, and Aging: A Swept-Source OCT Study. J. Ophthalmol. 2019, 2019, 3567813. [Google Scholar] [PubMed]
  10. Wang, S.; Wang, Y.; Gao, X.; Qian, N.; Zhuo, Y. Choroidal thickness and high myopia: A cross-sectional study and meta-analysis. BMC Ophthalmol. 2015, 15, 70. [Google Scholar] [CrossRef] [PubMed]
  11. Park, U.C.; Ma, D.J.; Ghim, W.H.; Yu, H.G. Influence of the foveal curvature on myopic macular complications. Sci. Rep. 2019, 9, 16936. [Google Scholar] [CrossRef]
  12. Haarman, A.E.G.; Enthoven, C.A.; Tideman, J.W.L.; Tedja, M.S.; Verhoeven, V.J.M.; Klaver, C.C.W. The Complications of Myopia: A Review and Meta-Analysis. Investig. Ophthalmol. Vis. Sci. 2020, 61, 49. [Google Scholar] [CrossRef]
  13. Lu, H.-C.; Chen, H.-Y.; Huang, C.-J.; Chu, P.-H.; Wu, L.-S.; Tsai, C.-Y. Predicting Axial Length From Choroidal Thickness on Optical Coherence Tomography Images With Machine Learning Based Algorithms. Front. Med. 2022, 9, 850284. [Google Scholar] [CrossRef]
  14. Saw, S.; Gazzard, G.; Shih-Yen, E.C.; Chua, W. Myopia and associated pathological complications. Ophthalmic Physiol. Opt. 2005, 25, 381–391. [Google Scholar] [CrossRef] [PubMed]
  15. Flores-Moreno, I.; Lugo, F.; Duker, J.S.; Ruiz-Moreno, J.M. The Relationship Between Axial Length and Choroidal Thickness in Eyes With High Myopia. Arch. Ophthalmol. 2013, 155, 314–319.e1. [Google Scholar] [CrossRef]
  16. Wong, Y.L.; Sabanayagam, C.; Ding, Y.; Wong, C.-W.; Yeo, A.C.-H.; Cheung, Y.-B.; Cheung, G.; Chia, A.; Ohno-Matsui, K.; Wong, T.-Y.; et al. Prevalence, risk factors, and impact of myopic macular degeneration on visual im-pairment and functioning among adults in Singapore. Investig. Ophthalmol. Vis. Sci. 2018, 59, 4603–4613. [Google Scholar]
  17. Choudhury, F.; Meuer, S.M.; Klein, R.; Wang, D.; Torres, M.; Jiang, X.; McKean-Cowdin, R.; Varma, R.; Azen, S.P.; Hsu, C.; et al. Prevalence and Characteristics of Myopic Degeneration in an Adult Chinese American Population: The Chinese American Eye Study. Arch. Ophthalmol. 2018, 187, 34–42. [Google Scholar] [CrossRef]
  18. Naidoo, K.S.; Fricke, T.R.; Frick, K.D.; Jong, M.; Naduvilath, T.J.; Resnikoff, S.; Sankaridurg, P. Potential lost productivity resulting from the global burden of myopia: Systematic review, meta-analysis, and modeling. Ophthalmology 2019, 126, 338–346. [Google Scholar] [PubMed]
  19. Flitcroft, D.I.; He, M.; Jonas, J.B.; Jong, M.; Naidoo, K.; Ohno-Matsui, K.; Rahi, J.; Resnikoff, S.; Vitale, S.; Yannuzzi, L. IMI—Defining and Classifying Myopia: A Proposed Set of Standards for Clinical and Epidemiologic Studies. Investig. Ophthalmol. Vis. Sci. 2019, 60, M20–M30. [Google Scholar] [CrossRef] [PubMed]
  20. Chawla, N.V.; Bowyer, K.W.; Hall, L.O.; Kegelmeyer, W.P. SMOTE: Synthetic Minority Over-sampling Technique. J. Artif. Intell. Res. 2002, 16, 321–357. [Google Scholar] [CrossRef]
  21. Torgo, L.; Ribeiro, R.P.; Pfahringer, B.; Branco, P. SMOTE for Regression. In Progress in Artificial Intelligence; Lecture Notes in Computer Science; Springer: Berlin/Heidelberg, Germany, 2013; Volume 8154, pp. 378–389. [Google Scholar]
  22. He, H.; Bai, Y.; Garcia, E.A.; Li, S. ADASYN: Adaptive synthetic sampling approach for imbalanced learning. In Proceedings of the 2008 IEEE International Joint Conference on Neural Networks (IEEE World Congress on Computational Intelligence), Hong Kong, 1–8 June 2008; pp. 1322–1328. [Google Scholar]
Figure 1. The reciprocal 1/r of the radius r is the curvature of the red arc obtained from a small segment near the point p(x,y).
Optics 06 00012 g001
Figure 2. Patient’s choroidal curve and the architecture of the proposed idea for curvature analysis. (a) Original choroidal image. (b) Detected choroidal curve to be a blue curve from (a). (c) Architecture of the proposed idea for curvature analysis.
Optics 06 00012 g002
Figure 3. Longitudinal and transverse sections choroidal images from SS-OCT.
Optics 06 00012 g003
Figure 4. Choroidal images and choroidal thickness.
Optics 06 00012 g004
Table 1. Non-high myopia and high myopia.
MeanNumber (%)
Non-high myopia, SPH > −6.00D282 (79.2%)
High myopia,
SPH ≤ −6.00D
74 (20.8%)
Non-high myopia, AXL ≤ 26 mm282 (79.2%)
High myopia,
AXL > 26 mm
74 (20.8%)
Table 2. The cases that have the choroidal morphology of high myopia (curvature greater than or equal to the average value) but have spherical equivalents or axial lengths that are non-high myopia.
Oversampling MethodThe Proposed Maximal Curvature MethodThe Proposed Average Curvature Method
ROS2526
SMOTE2732
ADASYN2731
Table 3. Accuracy of the proposed maximal curvature method and average curvature method.
Oversampling MethodAccuracy of the Method [13]Accuracy of the Proposed Maximal Curvature MethodAccuracy of the Proposed Average Curvature Method
ROS94.1%91.2%90.8%
SMOTE92.6%90.4%88.7%
ADASYN93.2%90.4%89.2%
Disclaimer/Publisher’s Note: The statements, opinions and data contained in all publications are solely those of the individual author(s) and contributor(s) and not of MDPI and/or the editor(s). MDPI and/or the editor(s) disclaim responsibility for any injury to people or property resulting from any ideas, methods, instructions or products referred to in the content.

