Article

Investigation of Five Organic Dyes in Ethanol and Butanol for Two-Color Laser-Induced Fluorescence Ratio Thermometry

by
Yogeshwar Nath Mishra
1,*,†,
Ajeth Yoganantham
1,
Matthias Koegl
1,2 and
Lars Zigan
1,2
1
Lehrstuhl für Technische Thermodynamik, FAU Erlangen-Nürnberg, 91058 Erlangen, Germany
2
Erlangen Graduate School in Advanced Optical Technologies (SAOT), FAU, 91058 Erlangen, Germany
*
Author to whom correspondence should be addressed.
Current Address: NASA-Jet Propulsion Laboratory, California Institute of Technology, 4800 Oak Grove Drive, Pasadena, CA 91109, USA.
Optics 2020, 1(1), 1-17; https://doi.org/10.3390/opt1010001
Submission received: 9 November 2019 / Revised: 1 December 2019 / Accepted: 3 December 2019 / Published: 11 December 2019
(This article belongs to the Special Issue Optical Diagnostics in Engineering)

Abstract

:
In this article, we compare absorption and temperature-dependent fluorescence spectra of five organic dyes for 2c-LIF (two-color laser-induced fluorescence) thermometry in ethanol and butanol. The dyes fluorescein, eosin Y, rhodamine B, rhodamine 6G, and sulforhodamine 101 individually mixed in ethanol and butanol were studied at liquid temperatures of 25–65 °C. The self-absorption spectral bands are analyzed along with intensity ratios and the respective sensitivities for one-dye and two-dye 2c-LIF thermometry are deduced. For one-dye 2c-LIF, rhodamine B showed the highest sensitivity of 2.93%/°C and 2.89%/°C in ethanol and butanol, respectively. Sulforhodamine 101 and rhodamine 6G showed the least sensitivities of 0.51%/°C and 1.24%/°C in ethanol and butanol, respectively. For two-dye 2c-LIF, rhodamine B/sulforhodamine 101 exhibited the highest temperature sensitivities of 2.39%/°C and 2.54%/°C in ethanol and butanol, respectively. The dye pair eosin Y/sulforhodamine 101 showed the least sensitivities of 0.15%/°C and 0.27%/°C in ethanol and butanol, respectively.

1. Introduction

Organic dyes such as rhodamines, fluoresceins, and eosins have been applied as LIF (laser-induced fluorescence) tracers for the characterization of liquids and/or two-phase flows [1]. These substances are readily available as chemicals with high solubility in the liquids under investigation [1]. These dyes show high fluorescence quantum yield [2,3] and usually strong absorption cross-section depending on the selected excitation wavelength of the light source [3]. They are applicable for mixing studies and exhibit pH-dependent fluorescence [4,5,6], while their absorption and emission show dependence on dye concentration [7,8] and fluid temperature [1]. The temperature-sensitive property of the fluorescence of organic dyes has been used for two-color LIF thermometry in liquid solutions, single droplets, and sprays [1,6,9,10,11,12,13,14,15]. This ratiometric method has been reported either with a single dye or with two fluorescent dyes. In the two-dyes scheme, the individual fluorescence emissions are spectrally separated and show minimal overlap. Usually, the intensity of one dye changes with temperature, while the emission intensity from the other dye remains constant (or it is much less temperature-sensitive). Therefore, the intensity ratio of the sensitive/insensitive spectral bands is a function of the temperature of the probed liquid solution. Coppeta and Rogers demonstrated a two dyes approach using fluorescein/rhodamine B to deduce temperature fields displaying natural convection in a thermal plume [6] for the temperature range 15–55 °C. Sakakibara and Adrian used rhodamine B and rhodamine 110 dyes in water to analyze convective heat transfer over a heated horizontal surface at temperatures 22–43 °C [11]. Kim et al. demonstrated the approach at a microscopic scale using rhodamine B/rhodamine 110 in water in a 1 mm closed test cell for temperatures range 16–37 °C [16]. Estrada-Pérez et al. proposed rhodamine B/fluorescein 27 dyes combinations for LIF thermometry in water yielding a better temperature sensitivity of 4%/°C compared to 2%/°C with rhodamine B/rhodamine 110 dyes in the temperature range 20–90 °C [17]. Shafii et al. used fluorescein/Kiton Red dyes pairs of opposite temperature sensitivities to deduce temperature maps between 5 °C and 25 °C during the solidification of aqueous ammonium chloride [18]. Recently, Chaze et al. studied fluorescein disodium/sulforhodamine 640 (also known as sulforhodamine 101) dyes in water to obtain single-shot images of the temperature range 20–85 °C inside droplets impinging on a hot solid surface [19]. The combination of the same dyes has been used with ethanol to investigate the heat transfer in the regime of film boiling for droplets temperatures 20–70 °C [20]. Fenner and Stephan investigated two different dye combinations of rhodamine 6G/pyridine 1 and rhodamine 6G/DCM (dichloromethane) for thermography of ethanol solutions in a relatively narrow temperature range of 22–32 °C [21].
In single-dye LIF thermometry, two spectral bands are selected from the single LIF emission spectrum to perform ratiometric temperature measurements, where usually the one band is sensitive and the second band is insensitive (or very less sensitive) to the liquid temperature. The ratio of the two bands eliminates issues related to changes in dye concentration, laser intensity fluctuations, light extinction, etc., which could be difficult to circumvent in some situations in the two dyes scheme mentioned above [1]. Lemoine and co-workers have extensively used several fluorescent dyes for demonstrating single-dye LIF thermometry in liquid solutions, single droplets, and sprays [1,9,22,23,24]. For example, Lavieille et al. studied evaporation and combustion of ethanol droplets using rhodamine B fluorescence for temperature sensing in the temperature range 16–61 °C [9]. Castanet et al. dissolved rhodamine B in water for investigating dynamics and temperature of droplets impacting onto a heated wall up to 104 °C [23]. Labergue et al. performed LIF thermometry in water droplets of up to 51 °C using sulforhodamine B as a temperature sensing tracer [24]. In other research groups, for example, Vetrano et al. used rhodamine B in ethanol for thermal characterization of flashing jets at 21–77 °C [25]. Zhou et al. applied rhodamine B for temperature mapping in aqueous and ethanol solutions in a test cell in the temperature range −30 °C to 90 °C [26], and Mishra et al. used pyranine in water for thermometry in hollow-cone sprays at 25–55 °C [14].
Another organic dye, pyrromethene 597-8C9 (PM597) has been used extensively for thermometry in droplets and/or sprays of alkanes (dodecane), ketones (3-pentanone), and alcohols (mainly ethanol) [24,27,28,29,30,31,32,33] for temperatures up to 60 °C. Furthermore, Sanned investigated temperature-dependent fluorescence of dyes from the PM597 family to trace lubricant oil at 23–150 °C inside marine engines [34]. Therefore, solubility with alkanes, ketones, and alcohols and good fluorescence quantum yield makes PM597 a universal tracer for thermometry of an individual fuel. However, fluorescence ratio is also sensitive to fuel composition for PM597 (like for other organic dyes in ethanol and butanol investigated in this study); therefore, it requires an adjustment in selecting spectral bands, dye concentrations, and separate calibration curves for measuring and comparing temperature distribution for different fuels. Some of the limitations regarding LIF thermometry are photo-bleaching of dyes [35], morphology-dependent resonances (MDR) in droplets [27,28], self-absorption effects [25], and saturated fluorescence [36], which need to be carefully investigated for reliable temperature measurements [1]. The temperature-dependent fluorescence is also relevant for other LIF-based techniques, for example, in the LIF/Mie intensity ratio imaging for planar droplet sizing (providing the droplet Sauter mean diameter (SMD)) in atomizing sprays using different LIF tracers [37,38].
In this article, we investigate temperature-dependent LIF emission spectra of five organic fluorescent tracers—fluorescein (FL), eosin Y (EY), rhodamine B (RhB), rhodamine 6G (Rh6G), and sulforhodamine 101 (SRh101)—in pure ethanol and butanol. Ethanol and butanol are investigated here as they are alternatives to fossil fuels in internal combustion engines. Additionally, these two solvents are often applied in medical engineering and in organic chemistry [39], for which thermometry and mixing studies are required as well. There are similar fluorescence studies already reported in the literature, however, separately for each dye or a couple of dyes in ethanol and more collectively in aqueous solutions. However, to the best of our knowledge, a direct comparison study with both ethanol and butanol for investigated dyes is still not documented for this dye selection. Furthermore, in the literature usually different dye concentrations and varying laser fluences for excitation (or CW and pulsed lasers) were used for two-color-LIF thermometry, which significantly affects the absorption and emission behavior. Consequently, the calibration data (and temperature sensitivity) of different dyes are hardly comparable. Therefore, the main aim and the novelty of this study are to provide: (i) a single report on the spectral properties of absorption of different dyes in different solvents and of fluorescence as a function of liquid temperature between 25 °C and 65 °C (the maximum temperature is limited by the boiling point of ethanol) for dyes in both ethanol and butanol; (ii) an investigation of spectral overlap between absorption and emission spectra (leading to fluorescence re-absorption) of each dye/solvent; and (iii) evaluation of LIF emission spectra of dyes/solvent for two-color LIF thermometry and the temperature sensitivities using a single dye or two-dye combination.

2. Experimental Procedure

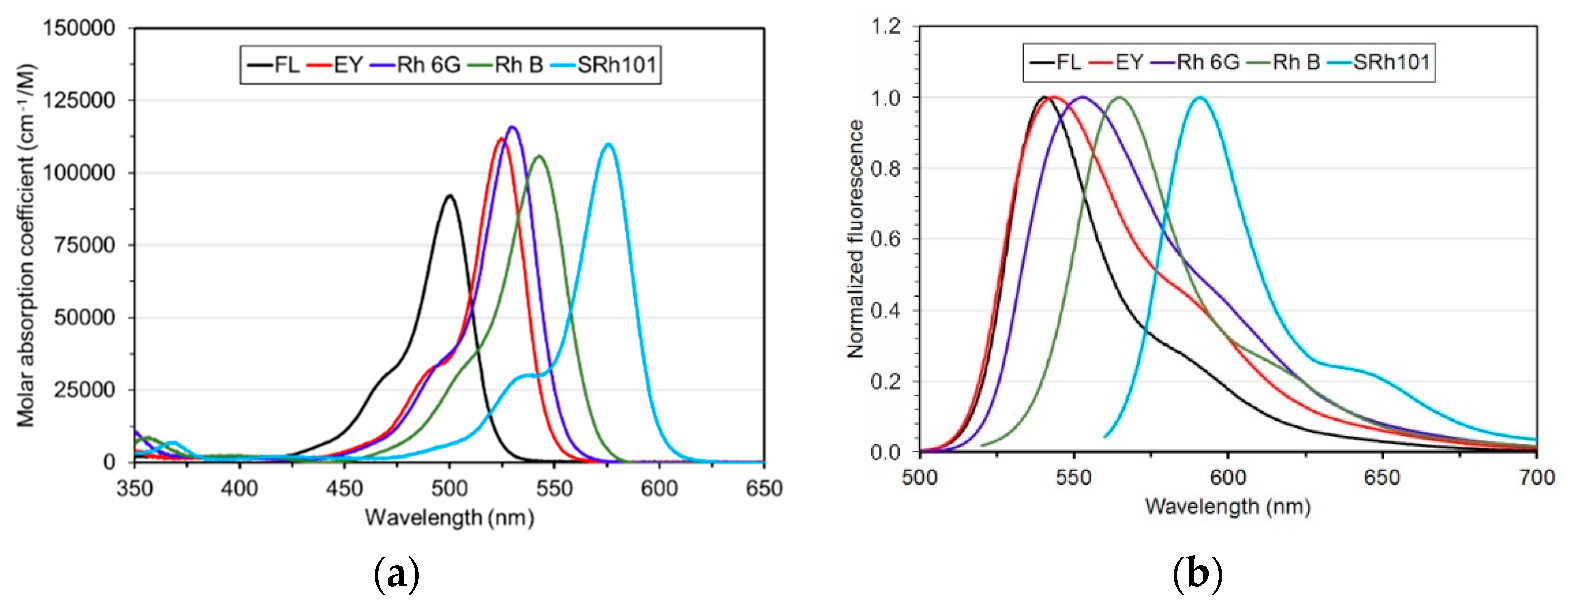
2.1. Properties of Organic Dyes

In this experiment, ethanol (purity: ≥99.9%, boiling point: 78.3 °C) and absolute butanol (99.9%, boiling point: 117 °C) purchased from VWR International GmbH, Germany were investigated as solvents. For the fluorescence studies, the organic dyes FL (Sigma-Aldrich Chemie GmbH, Taufkirchen, Germany), EY (Alfa Aesar, Haverhill, MA, USA), RhB, Rh6G, and SRh101 (all purchased from Radiant Dyes Laser GmbH, Wermelskirchen, Germany) were used. The concentrations of dyes in fuels are as given in Table 1 along with the CAS (Chemical Abstracts Service) registry numbers, melting points, and their corresponding fluorescence quantum yields (FQY) in ethanol at room temperature [40]. Out of all the investigated dyes, FL and SRh101 have the highest value of melting point > 300 °C, whereas RhB has the lowest melting point of 210 °C [40].
Figure 1 shows the optical properties of these dyes dissolved in ethanol at room temperature. These data serve for comparison with experimental results, dye concentrations, and solvents in our study. The absorption spectra in (a) and emission spectra in (b) were calculated using the software PhotochemCAD (http://www.photochemcad.com (see also [40])). All laser dyes can be excited at 532 nm, although FL has the lowest molar extinction at this wavelength (1795 cm−1/M), followed by SRh101 (29,038 cm−1/M), EY (89,560 cm−1/M), RhB (81,953 cm−1/M), and Rh6G (114,441 cm−1/M). The FQY is maximal for FL (0.97) and Rh6G (0.95). It is lowest for EY (0.67), see also Table 1. The emission spectrum of EY is a bit broader and red-shifted compared to FL. The emission spectrum of SRh101 is the most red-shifted compared to the other dyes. The chosen dye concentration was in the range of 10−4 mol/L in our study, except for fluorescein, for which 34.9 (ethanol)/34.6 × 10−4 mol/L (butanol), respectively, were necessary to achieve a comparable fluorescence signal. This was due to the very low absorption coefficient of FL. The spectra shown in Figure 1 were calculated from data related to a much lower dye concentration (~10−7 mol/L) [2].

2.2. Measurement Setup

2.2.1. Absorbance Measurements

The device used for absorption measurement was a Perkin Elmer Lambda 40 UV/Vis Spectrometer. For data acquisition, first, the background signal was stored by recording the absorbance of the square plastic cuvette (CVD series, Ocean Optics Inc., Largo, FL, USA) without dye solutions. Then, the dye solutions for both ethanol and butanol were stored in square plastic cuvettes of 10 mm pathlength for subsequent absorption measurements. A small path length ensured a minimal self-absorption effect (discussed in Section 5.1) due to the overlap of the absorbance and the emission spectra. The wavelength range of sample excitation was between 260 and 700 nm with a spectral width of 4 nm. The signal averaging time was 10 s, and a scan rate of 960 nm per min was selected. All measurements were performed at room temperature.

2.2.2. Temperature-Dependent Fluorescence Measurements

Figure 2 shows the optical setup used for temperature-dependent fluorescence measurement. The main components of the setup were an Nd:YAG laser (Quanta Ray, Spectra-Physics), a beam splitter cube (50/50: transmission/reflection, Edmund Optics, York, UK), a spectrometer (USB4000, Ocean Optics Inc., Largo, FL, USA; spectral range: 500–800 nm, slit width: 10 µm) a heating plate (IKA-Werke GmbH, Staufen, Germany), two K-type thermocouples (1.5 mm diameter, TC Ltd., Uxbridge, UK), and a glass cuvette (100 × 50 × 40 mm, Helma Analytics GmbH, Müllheim, Germany). The laser pulse of 532 nm excitation wavelength (6 ns pulse duration, 10 Hz repetition rate) was guided towards the glass cuvette using a mirror and the beam splitter cube. A top-hat beam profile of approximately 5 mm diameter was ensured using an iris. A power meter (Gentec Electro-Optic Inc., Québec, QC, Canada) was kept at the reflection face of the beam splitter cube to monitor the laser power. The temperature of the dye/fuel solutions filled in the glass cuvette was varied in the range 25–65 °C using the heating plate. For each solution, the cuvette was filled 100 mL and then the top side (opening) was covered and sealed by an aluminum plate. The thermocouples were inserted through two holes (each of 1.6 mm diameters) on the plate and finally sealed from the surrounding environment. The maximal temperature was selected here to minimize fuel evaporation. A magnetic stirrer was utilized to maintain an approximately uniform temperature throughout the cuvette. One thermocouple was kept at the front face (cuvette side facing the spectrometer) and the other at the backside (opposite to the front face) of the cuvette, such that they remained close to the cylindrical laser beam. The mean values of the temperature data acquired from the two positions were used as reference temperatures. The laser shutter was kept open until the time of signal acquisition, and for the remaining period of time, it was closed; for example, during the heating of the liquid or other variations to adjust the operating point for reducing photo-dissociation of dyes. There was no delay set between the signal acquisition and laser exposure. The fluorescence signal was collected through a fiber optic probe inbuilt in the spectrometer. First, the background signal was recorded while the laser beam was blocked. Then, the background signal was subtracted from the fluorescence signal generated by the laser beam. The fluorescence intensity emission spectra were recorded at an integration time of 0.1 s and 100 individual spectra were averaged. The laser power was varied between a minimum of 5.19 mJ/cm2 to a maximum averaged laser fluence of 37 mJ/cm2 to maintain the fluorescence linearity and to avoid saturation. The laser energy was varied by changing the Q-switching time and the averaged laser power was deduced from a total number of 5000 laser pulses. The standard deviation in the averaged fluence was approximately 3%. All measurements were performed in the linear regime of fluorescence and the dye concentrations (see Table 1) were chosen to have sufficient fluorescence intensity required for future 2c-LIF (two-color laser-induced fluorescence) thermometry of droplets in ethanol and butanol sprays [41,42]. Note that compared to dye concentration for the thermometry of liquid solutions in a test cell, atomizing sprays or single droplet studies require a relatively higher dye concentration (for better signal to noise ratio) [43,44], especially in two-dye approaches using FL [19].

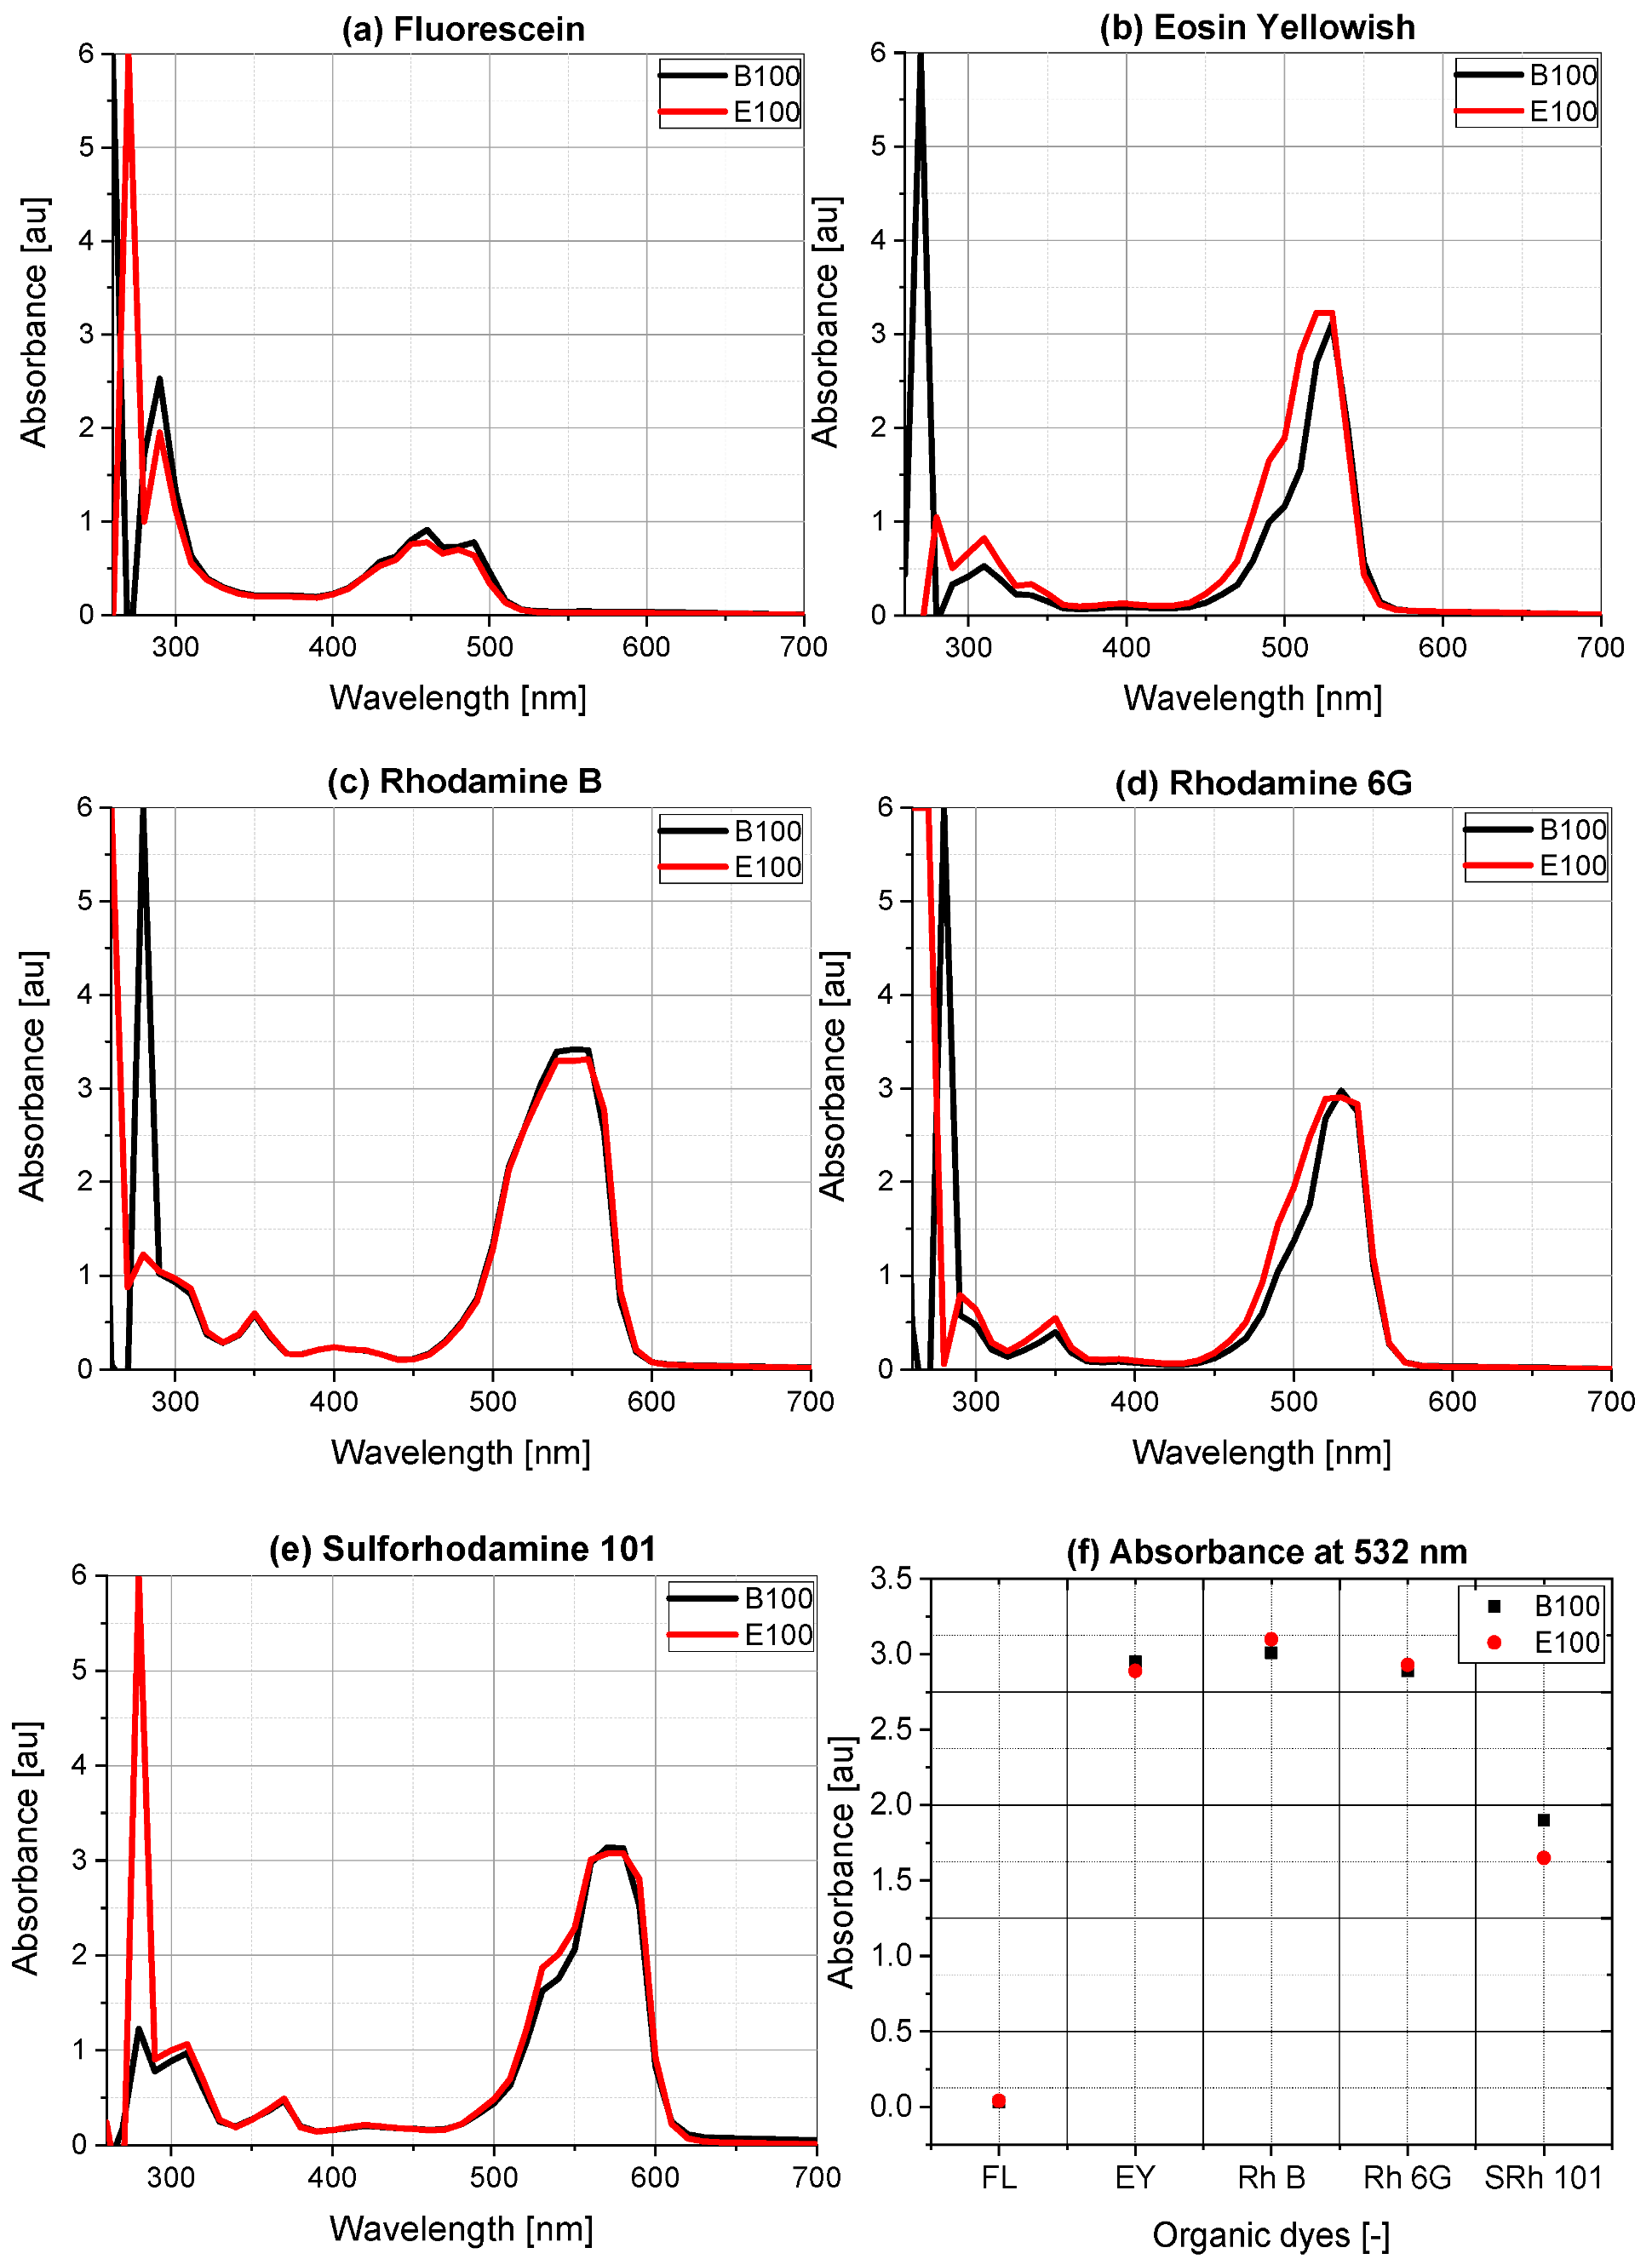
3. Results of Absorption Measurements

Figure 3 shows the absorbance spectra of FL in (a), EY in (b), RhB in (c), Rh6G in (d), and SRh101 in (e) mixed with ethanol and butanol. In (a), the absorbance of FL in ethanol has peaked at 266 nm, 280 nm, 455 nm, and 485 nm, similar to what is reported in [40,45]. However, the peak at 455 nm is very distinct compared to the calculated data in Figure 1. The butanol has peaks similar to that of ethanol except for a peak at 260 nm instead of 266 nm. In (b), the absorbance of EY in ethanol and butanol shows a peak at 532 nm, 305 nm, and around 266 nm [40]. The absorption spectra in the VIS region are similar to those in Figure 1. The absorbance of RhB solutions shows peaks in the range 545–555 nm (similar to [46] and Figure 1), 350 nm, and 280 nm as given in (c). However, the absorption spectra around 550 nm show saturation effects and this spectral range appears broadened compared to the more dilute mixture in Figure 1. This could be attributed to re-absorption in our experiments due to the significantly higher dye concentration. In (d), the Rh6G-ethanol and butanol solution shows absorbance peaks at 532 nm, 350 nm, and near 266 nm. Similar absorbance of dye in ethanol is reported in [21,46] for wavelength range 400–600 nm (see also Figure 1). The absorbance of SRh101-ethanol/butanol solutions in (e) has peaked at 555–580 nm, 370 nm, 305 nm, and around 266 nm. Finally, in (f), the absorbance of dye solutions at 532 nm wavelength recorded in Figure 3a,d are presented. For the investigated concentrations (not constant here), FL had the least absorbance of 0.04 and rhodamine B had the highest absorbance value of approximately 3.1 in accordance with Figure 1. Therefore, it was found that the majority of the dye solutions listed in Table 1 can be excited with 266 nm, 355 nm, and 532 nm excitation wavelength available from an Nd:YAG laser source. In this investigation, only 532 nm excitations are reported for fluorescence measurements (see Section 4).

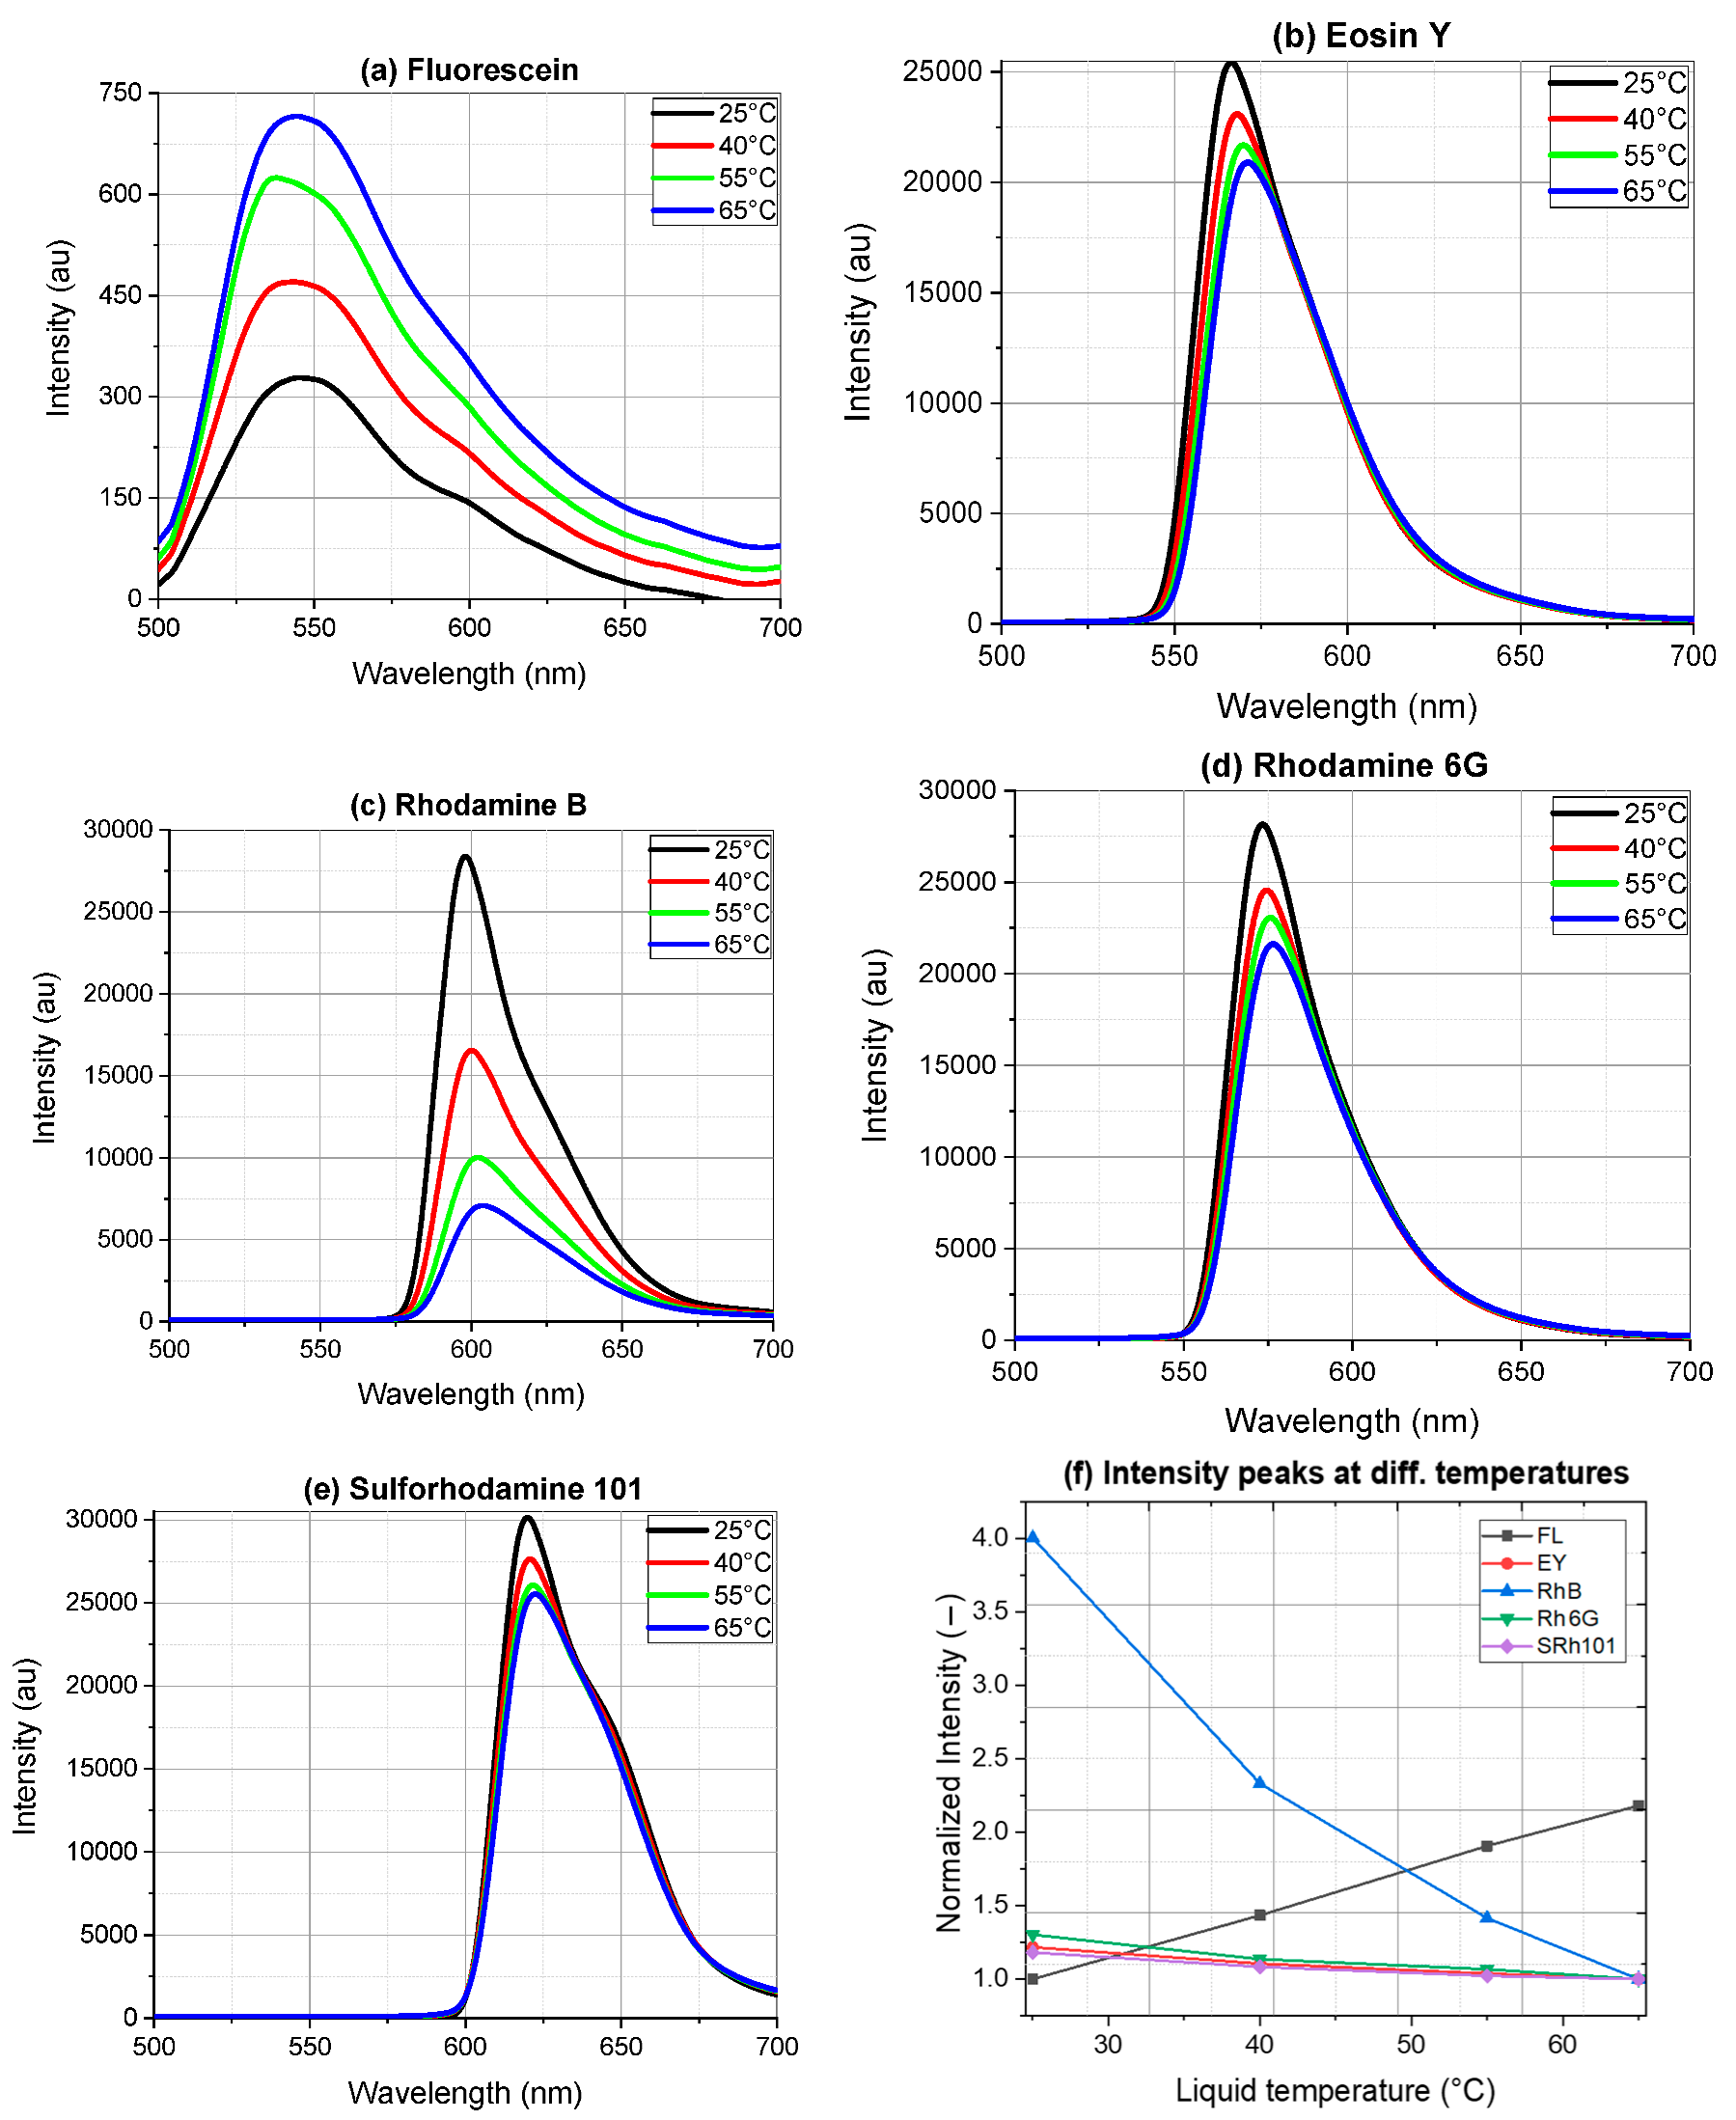
4. Results of Temperature-Dependent Fluorescence

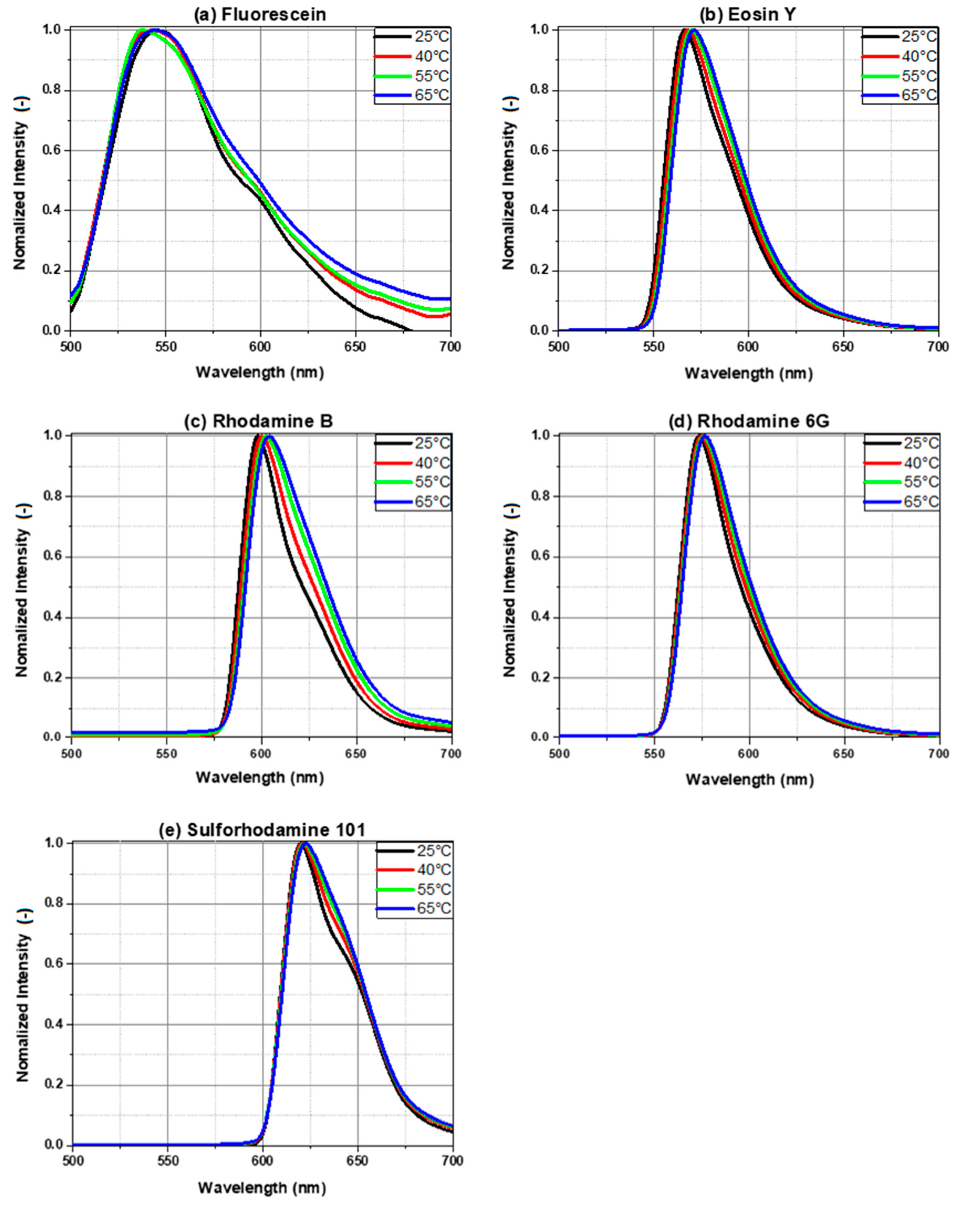
4.1. Emission Spectra of Dyes in Ethanol

Figure 4 shows the emission spectra of dyes in ethanol for FL in (a), EY in (b), RhB in (c), Rh6G in (d), and SRh101 in (e) as a function of liquid temperatures between 25 °C and 65 °C. The corresponding normalized intensity spectra are given in Appendix A. All experiments in Section 4.1 and Section 4.2 were conducted for a laser fluence of 30 mJ/cm2. In principle, all dyes at 25 °C show a spectral emission.
Comparable to those presented in Figure 1, all spectra were red-shifted in the present study (about 10–30 nm). This is explained by the increased dye concentration leading to stronger re-absorption in the “blue” region [19]. A dimer formation may also contribute to a red-shift of the fluorescence, which was confirmed for Rh6G for a similar dye concentration especially for water in [47] and for alcohol solvents in [48].
In (a), the intensity peak of FL increases 2.17 times with increased temperature from 25 °C to 65 °C. The spectral shift in emission spectra of EY can also be seen for an increase in liquid temperature. The spectra of EY are given in (b). With 2.6 times of temperature increase, the intensity peak drops 1.21 times, which is similar to the results reported by Koegl et al. [42]. In (c), RhB spectra decrease with increase in temperature. The fluorescence peak at 25 °C is reduced by 4 times at 65 °C. Lavieille et al. have reported a two times drop in emission intensity peak with 2.3 times change in liquid temperature for RhB in ethanol (at 514.5 nm CW excitation) of concentration 5 × 10⁻⁶ mol/L [9]. Due to the high dye concentration of 1.3 × 10⁻⁴ mol/L, in the present investigation, the maximum peak intensity of RhB was also red shifted to 595 nm (at 25 °C). Veterano et al. reported the LIF intensity peak at 570 nm for a lower dye concentration of 2.5 × 10⁻⁶ mol/L in ethanol at 532 nm excitation wavelength [25], which is also in accordance to Figure 1. For Rh6G in (d), the fluorescence intensity decreases with an increase in temperature. The maximum intensity decrease is 23.2% from 25 °C to 65 °C. In (e), the peak of fluorescence spectra of SRh101 changes 1.18 times in that temperature range. Finally, in (f), the normalized intensity of emission peaks is plotted. It is normalized with the intensity peak of the minimum value recorded either at 25 °C in (a) or at 65 °C in (b–e). Consequently, RhB has the highest change in intensity peak (factor of 4), while SRh101 shows the lowest change (factor of 1.18) for the studied range of liquid temperatures.

4.2. Emission Spectra of Dyes in Butanol

Figure 5 shows the emission spectra of dyes in butanol as the function of liquid temperatures between 25 °C and 65 °C. The corresponding normalized intensity spectra are given in Appendix B. In general, the emission spectra in butanol are similar to those in ethanol, but the spectral intensities show some variations. The intensity peak of FL in (a) increases 1.78 times in the studied temperature range (65 °C/25 °C). In (b), EY fluorescence peak changes 1.18 times respective to the liquid temperature. The emission spectra of RhB in (c) have intensity peak variations of 3.3 times with changing liquid temperature. In (d), Rh6G spectra exhibit a maximum intensity peak variation of 10.8% between 25 °C and 65 °C. The overall change in intensity is 1.12 times with respect to changes in temperature. The SRh101 emission spectra are given in (e), where the intensity peak varies 3.19% for the temperature change from 25 °C to 65 °C. In these spectra, the intensity drops down to the lowest value at 40 °C and then it increases towards 65 °C. This trend is observed in repeated measurements (at constant laser power) and a physical explanation for this is unknown. However, these temperature-dependent changes in the peak intensity are very small in general. In (f), the normalized peak intensity is plotted as the function of liquid temperature for all the investigated dyes. Therefore, when comparing the fluorescence spectra of the dyes in ethanol (Figure 4) and butanol (Figure 5), the intensity-temperature variation trend is similar for all dyes while the normalized signal intensity is lower for butanol.

5. Results of Self-Absorption and Two-Color Ratio

5.1. Self-Absorption

The self-absorption refers to the overlap of absorption and fluorescence spectra that most of the LIF dyes exhibit. When the laser light passes through the fluorescing medium, a part of the emitted signal is re-absorbed by the dye leading to increased re-emission of secondary fluorescence at longer wavelengths [6,11,22]. In two-color LIF thermometry (using one dye), the self-absorption has been known to affect negatively the accuracy of the measurements, if one of the spectral bands lies in this self-absorption regime [6,11]. The self-absorption is significant if the path length of the signal light crossing the medium is large or the tracer concentration is very high. For example, Castanet et al. evaluated these effects and corrected the influence of the optical path by introducing a third spectral band [22]. Table 2 shows the fuel/dye solutions and their corresponding self-absorption bands extracted from the absorption (Figure 3) and emission bands (Figure 4 and Figure 5), 500–525 nm for FL, 540–575 nm for EY, 575–610 nm for RhB, 550–575 nm for Rh6G, and 590–625 nm for SRh101 at 25 °C. To perform one-dye thermometry, the self-absorption regime cannot be fully excluded because their corresponding LIF intensity contributes largely to temperature sensitivity. For example, emission bands in the lower wavelength range selected for the one-dye approach (see Table 3, Section 5.2) falls within the self-absorption regime, and, thus, it may affect the accuracy of temperature measurements especially for large absorption volumes.

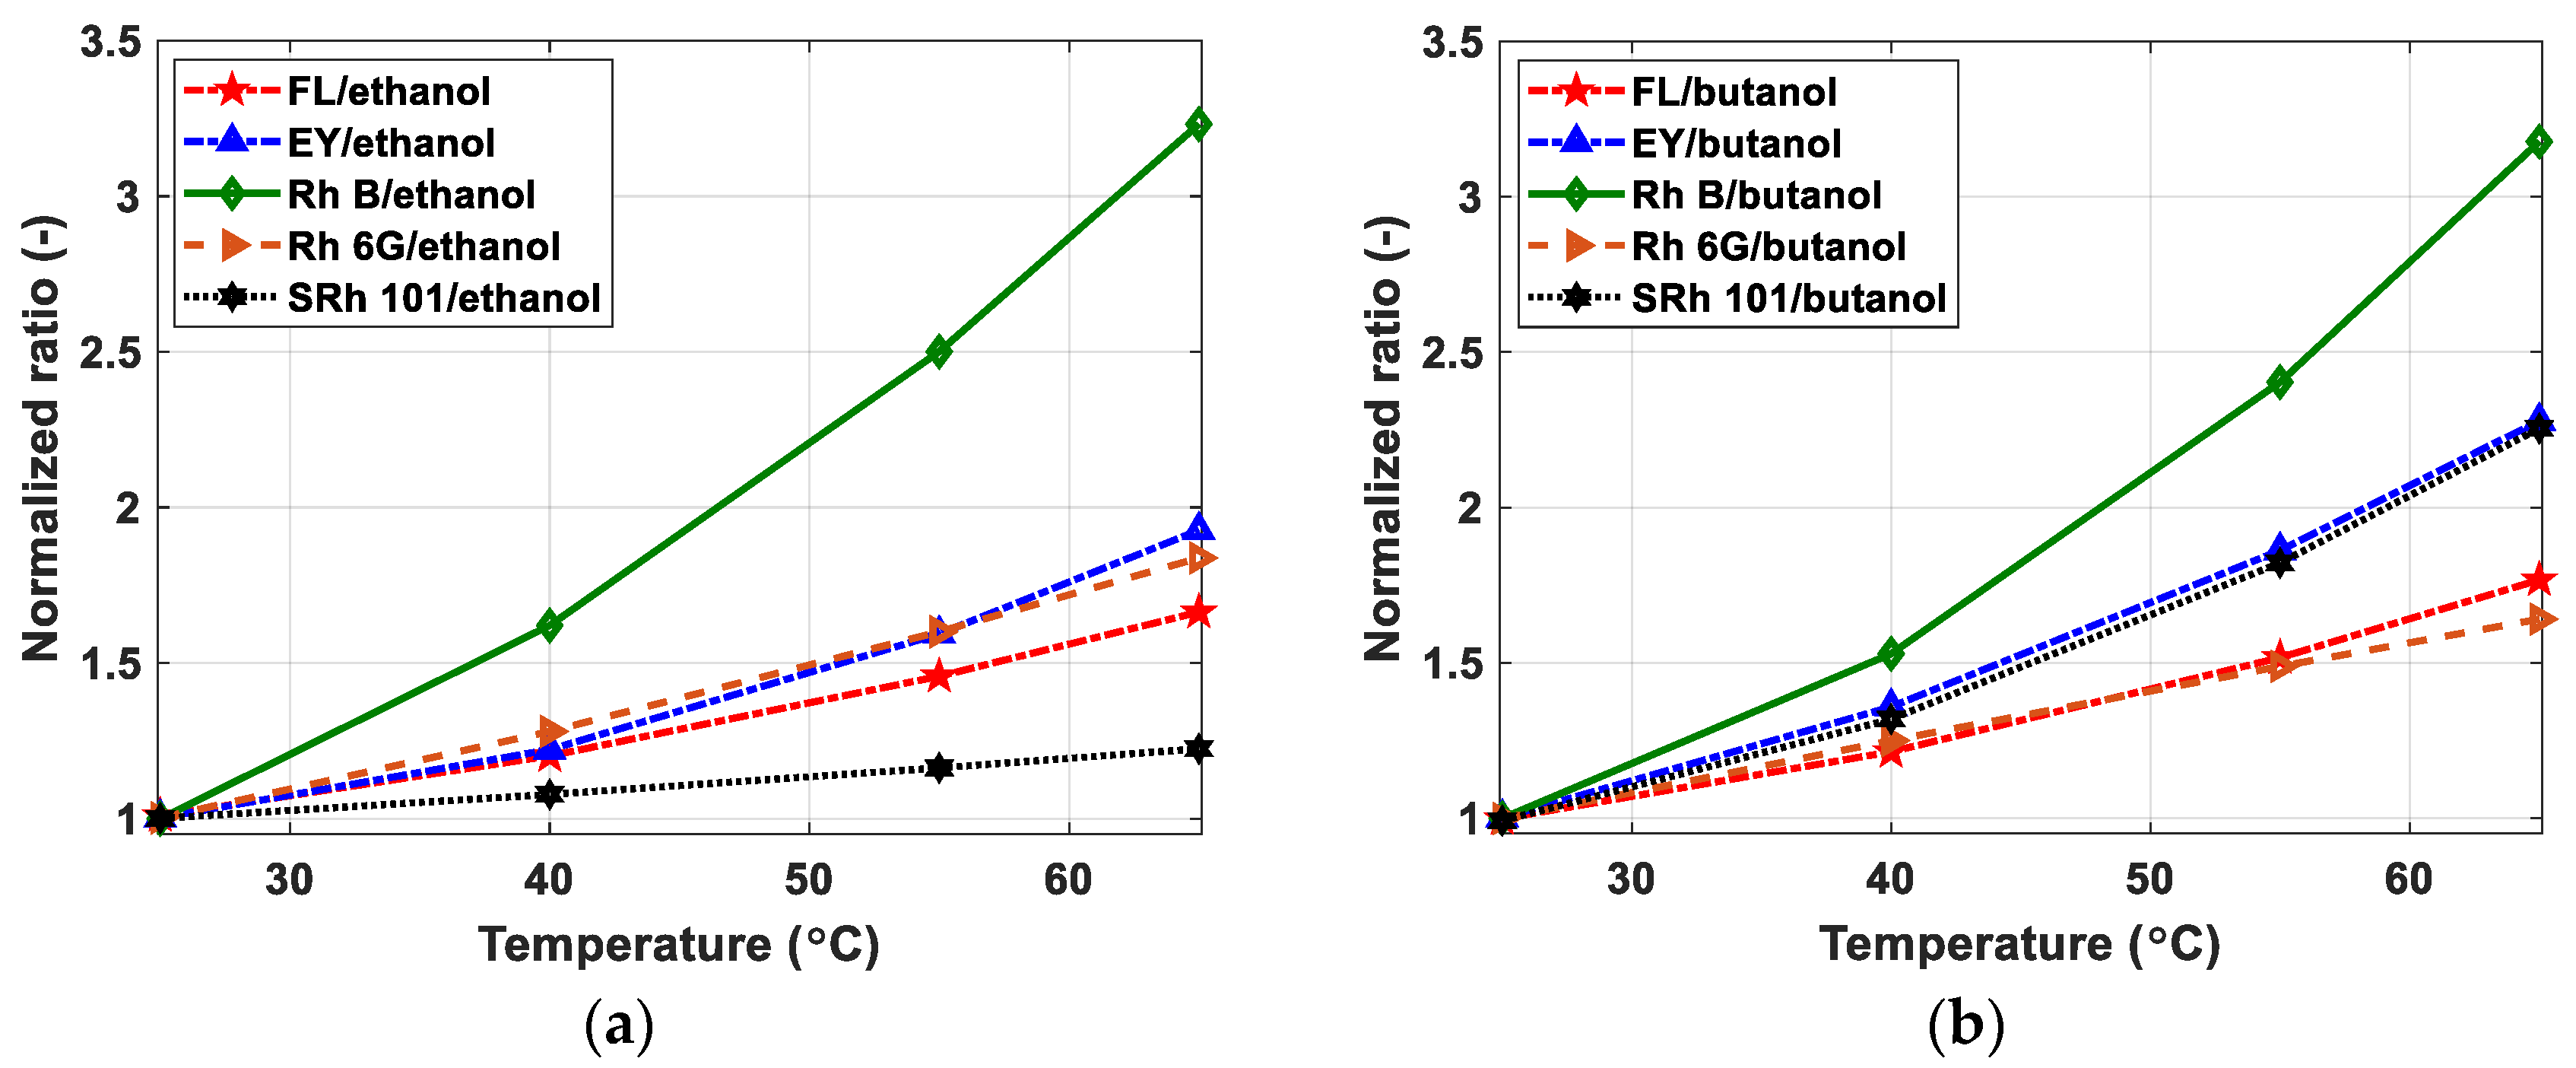
5.2. Two-Color Ratio and Temperature Sensitivity

Temperature sensitivity for two-color LIF ratio using a single dye and two-dyes thermometry approaches were evaluated using the emission spectra presented in Figure 4 and Figure 5. Table 3 shows the spectral bands, “LIF1” and “LIF2”, selected for single dye and Table 4 lists the spectral bands LIF1 (first dye) and LIF2 (second dye) for two-dyes approach. Before performing the ratio, the spectral intensities covered by the two selected bands were integrated. The two spectral bands were selected to achieve optimum temperature sensitivity without compromising too much on the signal level intensity and their availability as realistic optical filters [14]. Therefore, the spectral range of LIF1 and LIF2 bands were selected such that they were available as fluorescence bandpass filters (e.g., BrightLine, Semrock Inc., Rochester, NY, USA; this was just an arbitrary selection, of course, other manufacturers provide comparable products). For example, in Table 3, for fluorescein, LIF1 band represents the fluorescence bandpass filter (Semrock order # FF02-510/10-25) of spectral range 505–515 nm and LIF2 band is the fluorescence band pass filter (Semrock order # FF02-641/75-25) of spectral range 604–679 nm.

5.2.1. One Dye Approach

Figure 6 shows the normalized two-color ratio plots as a function of liquid temperature for the dyes in ethanol in (a) and in butanol in (b) for the spectral bands, LIF1 and LIF2, as listed in Table 3. All plots of the two-color ratio are normalized with the corresponding minimum ratio value. It is important to mention that the ratios of two bands either as LIF1/LIF2 or LIF2/LIF1 are plotted with respect to liquid temperature only in the increment order. In (a), for RhB, the two-color ratio increases almost 3.25 times with an increase in the liquid temperature. Similarly, for EY, Rh6G and FL, the ratios increase approximately 2, 1.85, and 1.7 times between 25 °C and 65 °C, respectively. The ratio for SRh101 is changing minimal by a factor of 1.22. For butanol-dye solutions in (b), RhB exhibits an increase of factor 3.18 in this temperature range. The second-highest increase of the signal ratio by a factor of approximately 2.6 is found for EY and SRh101. Similarly, for FL and Rh6G, the variation of the ratio with temperature is 1.76 and 1.64, respectively. Therefore, when comparing ratios for all dyes in (a) and (b), all the dyes display similar trends.
SRh101 and Rh6G were the least sensitive dyes for thermometry in ethanol and butanol, respectively. Table 4 shows the temperature sensitivity (in %/°C) for the two-color ratio as a function of temperature plotted in Figure 6a,b, respectively. The sensitivity refers to output per unit input, so in this case, it is a two-color LIF ratio per degree temperature. Therefore, sensitivity (s) can be expressed as:
s = log n ( R m a x / R m i n ) T m a x T m i n   × 100 %
where Rmax and Rmin refer to two-color ratio values at temperatures, Tmax (maximum), and Tmin (minimum). This expression is similar to calculations performed in [36] using the integrated LIF signals (instead of ratio in this case) as a function of temperature. The deduced sensitivity is maximum for RhB in ethanol with 2.93%/°C and in butanol, 2.89%/°C. SRh101 shows the least sensitivity of 0.51%/°C in ethanol, while Rh6G shows the lowest sensitivity of 1.24%/°C in butanol.

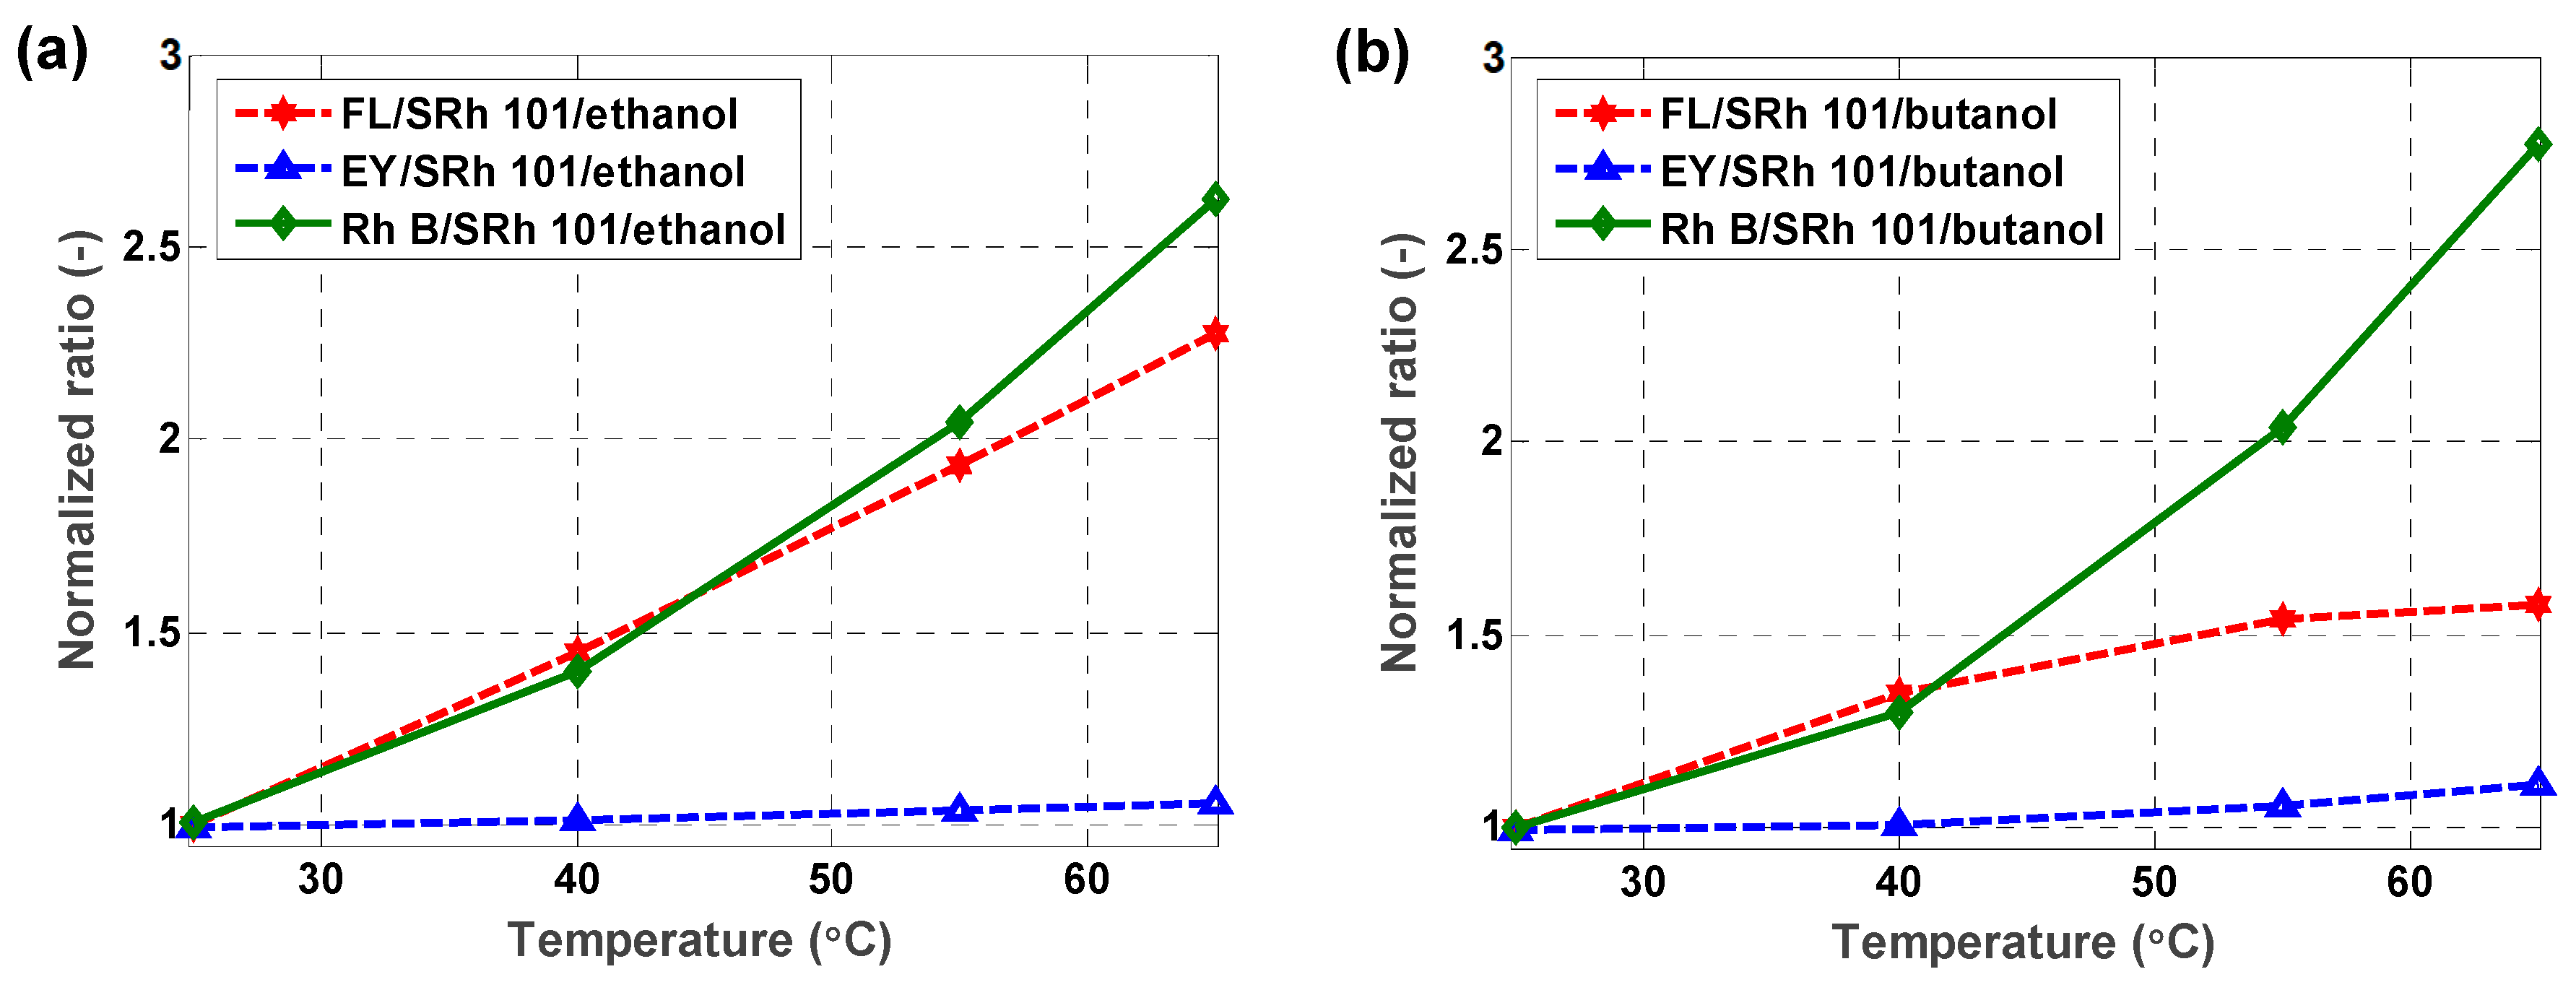
5.2.2. Two-Dyes Approach

Figure 7 shows the normalized two-color ratio plots as the function of liquid temperature for the dye combinations in ethanol in (a) and in butanol in (b) for the spectral bands listed in Table 5. The first spectral band (LIF1) were selected from emission spectra of FL, EY, and RhB such that their corresponding self-absorption region (see Section 5.1) was fully avoided. The second spectral band (LIF2) remained the same and belonged to SRh101 dye. Rh6G was excluded from the evaluations due to the overlapping of its emission bands with SRh101. Similar to Figure 6, the ratio of two bands, LIF1/LIF2 or LIF2/LIF1 is plotted with respect to liquid temperature only in the increment order. In Figure 7a, for RhB/SRh101, the ratio increases approximately 2.6 times in the studied temperature range. The ratio increases 2.27 times for the FL/SRh101 dye combination and for the couple EY/SRh101 approximately 1.07 times, therefore, showing almost no sensitivity with temperature. For the dye combinations in butanol in Figure 7b, the ratio changes 2.76 times with liquid temperature for RhB/SRh101. Similarly, for FL/SRh101, the ratio varies by a factor of 1.58. The ratio changes only approximately by a factor of 1.11 for EY/SRh101, i.e., the dye combination shows almost no temperature sensitivity.
The sensitivity calculations according to Equation (1) are given in Table 6. RhB/SRh101 dyes had the highest temperature sensitivity of 2.39%/°C in ethanol and of 2.54%/°C in butanol. Similarly, the minimum values of 0.15%/°C and 0.27%/°C were found for EY/ SRh101 in ethanol and butanol, respectively. The combination FL/SRh101 was also promising for thermometry in ethanol, but only in the temperature range up to 55 °C. This dye couple was also suggested by Chaze et al. for thermometry in water [19] and by Castanet et al. for measurements in ethanol droplets [20]. Although the temperature sensitivities are lower than for the one-dye approach (e.g., when comparing RhB and the combination RhB/SRh101), the two-dye method is advantageous as re-absorption effects on intensity ratio are reduced. This means that the measurement accuracy can be increased by using the two-dye method.

6. Outlook and Conclusions

The temperature-dependent absorption and fluorescence spectroscopy were performed for organic dyes dissolved in ethanol and butanol with a focus on liquid phase thermometry, especially for droplet and spray applications.
In principle, the emission spectra of all investigated dyes in ethanol were red-shifted by about 10–30 nm in comparison to literature data due to the increased dye concentration. The emission spectra in butanol were similar to those in ethanol, but the spectral intensities were different. For two-color LIF thermometry, the proposed filter combinations and intensity ratios in the literature must be adjusted accordingly. For one-dye LIF thermometry in ethanol, the dyes RhB, EY, Rh6G, and FL exhibited highest to least temperature sensitivity, respectively. For butanol as a solvent, RhB, EY, and SRh101 dyes showed the highest sensitivity followed by FL and Rh6G showing the least sensitivity for thermometry. Nevertheless, self-absorption remains an issue because spectral bands chosen for thermometry lies in a self-absorption regime.
For two-dyes thermometry in ethanol, the dye combination RhB/SRh101 showed maximum temperature sensitivity while the couple FL/SRh101 performed very similar up to 55 °C. In butanol, the dye combination RhB/SRh101 was highly sensitive for thermometry as well. It is important to mention that measurement uncertainties introduced by self-absorption effects were addressed in the two-dye approach because the two spectral bands chosen for thermometry are outside of the self-absorption range.

Author Contributions

Conceptualization, Y.N.M. and L.Z.; methodology, Y.N.M., A.Y., M.K., and L.Z.; investigation, Y.N.M. and A.Y.; writing—original draft preparation, Y.N.M.; writing—review and editing, L.Z.

Funding

This research received no external funding.

Acknowledgments

Authors acknowledge Ellen Hertle, and Alexander Durst from LTT Erlangen, Germany for supporting the experiments.

Conflicts of Interest

The authors declare no conflicts of interest.

Appendix A

Figure A1 shows the normalized intensity plots of temperature-dependent fluorescence of all five organic dyes in ethanol. These plots of fluorescein in (a), eosin Y in (b), rhodamine B in (c), rhodamine 6G in (d), and finally of sulforhodamine 101 in (e) show the shift in LIF spectra as the function of liquid temperature. Comparing the spectral shift in all five dyes here, eosin Y in (b) and rhodamine B in (c) show a stronger red-shifted LIF spectra.
Figure A1. Normalized intensity plot of temperature-dependent fluorescence of dyes in ethanol: (a) fluorescein, (b) eosin Y, (c) rhodamine B, (d) rhodamine 6G, and (e) sulforhodamine 101.
Optics 01 00001 g0a1

Appendix B

Figure A2 shows the normalized intensity plots of temperature-dependent fluorescence of all five organic dyes in butanol. These plots of fluorescein in (a), eosin Y in (b), rhodamine B in (c), rhodamine 6G in (d), and finally of sulforhodamine 101 in (e) show the shift in LIF spectra as the function of liquid temperature. Similar to the spectral shift of ethanol found in Figure A1b,c, here, eosin Y in (b) and rhodamine B in (c) show a stronger red-shifted LIF spectra.
Figure A2. Normalized intensity plot of temperature-dependent fluorescence of dyes in butanol: (a) fluorescein, (b) eosin Y, (c) rhodamine B, (d) rhodamine 6G, and (e) sulforhodamine 101.
Optics 01 00001 g0a2

References

  1. Lemoine, F.; Castanet, G. Temperature and chemical composition of droplets by optical measurement techniques: A state-of-the-art review. Exp. Fluids 2013, 54, 1572. [Google Scholar] [CrossRef] [Green Version]
  2. Kubin, R.F.; Fletcher, A.N. Fluorescence quantum yields of some rhodamine dyes. J. Lumin. 1982, 27, 455–462. [Google Scholar] [CrossRef]
  3. Zhang, X.-F.; Zhang, J.; Liu, L. Fluorescence Properties of Twenty Fluorescein Derivatives: Lifetime, Quantum Yield, Absorption and Emission Spectra. J. Fluoresc. 2014, 24, 819–826. [Google Scholar] [CrossRef] [PubMed]
  4. Martin, M.M.; Lindqvist, L. The pH dependence of fluorescein fluorescence. J. Lumin. 1975, 10, 381–390. [Google Scholar] [CrossRef]
  5. Lacassagne, T.; Simoëns, S.; El Hajem, M.; Champagne, J.-Y. Ratiometric, single-dye, pH-sensitive inhibited laser-induced fluorescence for the characterization of mixing and mass transfer. Exp. Fluids 2017, 59, 21. [Google Scholar] [CrossRef]
  6. Coppeta, J.; Rogers, C. Dual emission laser induced fluorescence for direct planar scalar behavior measurements. Exp. Fluids 1998, 25, 1–15. [Google Scholar] [CrossRef]
  7. Lemoine, F.; Wolff, M.; Lebouche, M. Simultaneous concentration and velocity measurements using combined laser-induced fluorescence and laser Doppler velocimetry: Application to turbulent transport. Exp. Fluids 1996, 20, 319–327. [Google Scholar] [CrossRef]
  8. Matsumoto, R.; Zadeh, H.F.; Ehrhard, P. Quantitative measurement of depth–averaged concentration fields in microchannels by means of a fluorescence intensity method. Exp. Fluids 2005, 39, 722–729. [Google Scholar] [CrossRef]
  9. Lavieille, P.; Lemoine, F.; Lavergne, G.; Lebouché, M. Evaporating and combusting droplet temperature measurements using two-color laser-induced fluorescence. Exp. Fluids 2001, 31, 45–55. [Google Scholar] [CrossRef]
  10. Lavieille, P.; Lemoine, F.; Lavergne, G.; Virepinte, J.F.; Lebouché, M. Temperature measurements on droplets in monodisperse stream using laser-induced fluorescence. Exp. Fluids 2000, 29, 429–437. [Google Scholar] [CrossRef]
  11. Sakakibara, J.; Adrian, R.J. Whole field measurement of temperature in water using two-color laser induced fluorescence. Exp. Fluids 1999, 26, 7–15. [Google Scholar] [CrossRef]
  12. Natrajan, V.K.; Christensen, K.T. Two-color laser-induced fluorescent thermometry for microfluidic systems. Meas. Sci. Technol 2009, 20, 015401. [Google Scholar] [CrossRef] [Green Version]
  13. Coolen, M.C.J.; Kieft, R.N.; Rindt, C.C.M.; van Steenhoven, A.A. Application of 2-D LIF temperature measurements in water using a Nd: YAG laser. Exp. Fluids 1999, 27, 420–426. [Google Scholar] [CrossRef]
  14. Mishra, Y.N.; Abou Nada, F.; Polster, S.; Kristensson, E.; Berrocal, E. Thermometry in aqueous solutions and sprays using two-color LIF and structured illumination. Opt. Express 2016, 24, 4949–4963. [Google Scholar] [CrossRef] [Green Version]
  15. Kan, T.; Aoki, H.; Binh-Khiem, N.; Matsumoto, K.; Shimoyama, I. Ratiometric Optical Temperature Sensor Using Two Fluorescent Dyes Dissolved in an Ionic Liquid Encapsulated by Parylene Film. Sensors 2013, 13, 4138–4145. [Google Scholar] [CrossRef]
  16. Kim, H.J.; Kihm, K.D.; Allen, J.S. Examination of ratiometric laser induced fluorescence thermometry for microscale spatial measurement resolution. Int. J. Heat Mass Transf. 2003, 46, 3967–3974. [Google Scholar] [CrossRef]
  17. Estrada-Pérez, C.E.; Hassan, Y.A.; Tan, S. Experimental characterization of temperature sensitive dyes for laser induced fluorescence thermometry. Rev. Sci. Instrum. 2011, 82, 074901. [Google Scholar] [CrossRef]
  18. Shafii, M.B.; Lum, C.L.; Koochesfahani, M.M. In situ LIF temperature measurements in aqueous ammonium chloride solution during uni-directional solidification. Exp. Fluids 2010, 48, 651–662. [Google Scholar] [CrossRef]
  19. Chaze, W.; Caballina, O.; Castanet, G.; Lemoine, F. Spatially and temporally resolved measurements of the temperature inside droplets impinging on a hot solid surface. Exp. Fluids 2017, 58, 96. [Google Scholar] [CrossRef] [Green Version]
  20. Castanet, G.; Chaze, W.; Caballina, O.; Collignon, R.; Lemoine, F. Transient evolution of the heat transfer and the vapor film thickness at the drop impact in the regime of film boiling. Phys. Fluids 2018, 30, 122109. [Google Scholar] [CrossRef] [Green Version]
  21. Fenner, A.; Stephan, P. Two dye combinations suitable for two-color/two-dye laser-induced fluorescence thermography for ethanol. Exp. Fluids 2017, 58, 65. [Google Scholar] [CrossRef]
  22. Castanet, G.; Lavieille, P.; Lebouché, M.; Lemoine, F. Measurement of the temperature distribution within monodisperse combusting droplets in linear streams using two-color laser-induced fluorescence. Exp. Fluids 2003, 35, 563–571. [Google Scholar] [CrossRef] [Green Version]
  23. Castanet, G.; Liénart, T.; Lemoine, F. Dynamics and temperature of droplets impacting onto a heated wall. Int. J. Heat Mass Transf. 2009, 52, 670–679. [Google Scholar] [CrossRef] [Green Version]
  24. Labergue, A.; Deprédurand, V.; Delconte, A.; Castanet, G.; Lemoine, F. New insight into two-color LIF thermometry applied to temperature measurements of droplets. Exp. Fluids 2010, 49, 547–556. [Google Scholar] [CrossRef] [Green Version]
  25. Vetrano, M.R.; Simonini, A.; Steelant, J.; Rambaud, P. Thermal characterization of a flashing jet by planar laser-induced fluorescence. Exp. Fluids 2013, 54, 1573. [Google Scholar] [CrossRef]
  26. Zhou, J.; Yang, W.; Yin, Y.; Chen, S.; Yan, B.; Mu, J.; Qi, X. Nonlinear temperature calibration equation for Rhodamine B in different solutions for wide-temperature-range applications. Appl. Opt. 2019, 58, 1514–1518. [Google Scholar] [CrossRef]
  27. Perrin, L.; Castanet, G.; Lemoine, F. Characterization of the evaporation of interacting droplets using combined optical techniques. Exp. Fluids 2015, 56, 29. [Google Scholar] [CrossRef]
  28. Palmer, J.; Reddemann, M.A.; Kirsch, V.; Kneer, R. Temperature measurements of micro-droplets using pulsed 2-color laser-induced fluorescence with MDR-enhanced energy transfer. Exp. Fluids 2016, 57, 177. [Google Scholar] [CrossRef]
  29. Palmer, J.; Reddemann, M.A.; Kirsch, V.; Kneer, R. Comparison of 2c- and 3cLIF droplet temperature imaging. Exp. Fluids 2018, 59, 102. [Google Scholar] [CrossRef]
  30. Palmer, J.; Reddemann, M.A.; Kirsch, V.; Kneer, R. Applying 2D-2cLIF-EET thermometry for micro-droplet internal temperature imaging. Exp. Fluids 2018, 59, 51. [Google Scholar] [CrossRef]
  31. Wolff, M.; Delconte, A.; Schmidt, F.; Gucher, P.; Lemoine, F. High-pressure Diesel spray temperature measurements using two-colour laser-induced fluorescence. Meas. Sci. Technol. 2007, 18, 697. [Google Scholar] [CrossRef]
  32. Deprédurand, V.; Delconte, A.; Lemoine, F. Combined PDA and LIF applied to size–temperature correlations measurements in a heated spray. Exp. Fluids 2011, 50, 561–571. [Google Scholar] [CrossRef]
  33. Deprédurand, V.; Miron, P.; Labergue, A.; Wolff, M.; Castanet, G.; Lemoine, F. A temperature-sensitive tracer suitable for two-colour laser-induced fluorescence thermometry applied to evaporating fuel droplets. Meas. Sci. Technol. 2008, 19, 105403. [Google Scholar] [CrossRef]
  34. Sanned, D. Study of Fluorescence Dyes for Tracing Lubrication Oil Inside Marine Engines. Bachelor’s Thesis, Lund University, Lund, Sweden, 2017. [Google Scholar]
  35. Ippen, E.; Shank, C.; Dienes, A. Rapid photobleaching of organic laser dyes in continuously operated devices. IEEE J. Quantum Electron. 1971, 7, 178–179. [Google Scholar] [CrossRef]
  36. Chaze, W.; Caballina, O.; Castanet, G.; Lemoine, F. The saturation of the fluorescence and its consequences for laser-induced fluorescence thermometry in liquid flows. Exp. Fluids 2016, 57, 58. [Google Scholar] [CrossRef] [Green Version]
  37. Le Gal, P.; Farrugia, N.; Greenhalgh, D.A. Laser Sheet Dropsizing of dense sprays. Opt. Laser Technol. 1999, 31, 75–83. [Google Scholar] [CrossRef]
  38. Domann, R.; Hardalupas, Y. Quantitative Measurement of Planar Droplet Sauter Mean Diameter in Sprays using Planar Droplet Sizing. Part. Part. Syst. Charact. 2003, 20, 209–218. [Google Scholar] [CrossRef]
  39. Reichardt, C.; Welton, T. Solvents and Solvent Effects in Organic Chemistry, 4th ed.; Wiley-VCH Verlag GmbH & Co. KGaA: Weinheim, Germany, 2010. [Google Scholar]
  40. Taniguchi, M.; Lindsey, J.S. Database of Absorption and Fluorescence Spectra of >300 Common Compounds for use in PhotochemCAD. Photochem. Photobiol. 2018, 94, 290–327. [Google Scholar] [CrossRef] [Green Version]
  41. Koegl, M.; Hofbeck, B.; Baderschneider, K.; Mishra, Y.N.; Huber, F.J.T.; Berrocal, E.; Will, S.; Zigan, L. Analysis of LIF and Mie signals from single micrometric droplets for instantaneous droplet sizing in sprays. Opt. Express 2018, 26, 31750–31766. [Google Scholar] [CrossRef]
  42. Koegl, M.; Mishra, Y.N.; Storch, M.; Conrad, C.; Berrocal, E.; Will, S.; Zigan, L. Analysis of ethanol and butanol direct-injection spark-ignition sprays using two-phase structured laser illumination planar imaging droplet sizing. Int. J. Spray Combust. Dyn. 2019, 11, 1–16. [Google Scholar] [CrossRef]
  43. Durst, A.; Wensing, M.; Berrocal, E. Light sheet fluorescence microscopic imaging for the primary breakup of diesel and gasoline sprays with real-world fuels. Appl. Opt. 2018, 57, 2704–2714. [Google Scholar] [CrossRef] [PubMed]
  44. Koegl, M.; Mull, C.; Baderschneider, K.; Wislicenus, J.; Will, S.; Zigan, L. Characterization of Nile Red as a Tracer for Laser-Induced Fluorescence Spectroscopy of Gasoline and Kerosene and Their Mixture with Biofuels. Sensors 2019, 19, 2822. [Google Scholar] [CrossRef] [PubMed] [Green Version]
  45. Seybold, P.G.; Gouterman, M.; Callis, J. Calorimetric, Photometric and Lifetime Determinations of Fluorescence Yields of Fluorescein Dyes. Photochem. Photobiol. 1969, 9, 229–242. [Google Scholar] [CrossRef]
  46. Zhang, X.-F.; Zhang, Y.; Liu, L. Fluorescence lifetimes and quantum yields of ten rhodamine derivatives: Structural effect on emission mechanism in different solvents. J. Lumin. 2014, 145, 448–453. [Google Scholar] [CrossRef]
  47. Terdale, S.; Tantray, A. Spectroscopic study of the dimerization of rhodamine 6G in water and different organic solvents. J. Mol. Liq. 2017, 225, 662–671. [Google Scholar] [CrossRef]
  48. Penzkofer, A.; Leupacher, W. Fluorescence behaviour of highly concentrated rhodamine 6G solutions. J. Lumin. 1987, 37, 61–72. [Google Scholar] [CrossRef] [Green Version]
Figure 1. Calculated absorption spectra in (a) and fluorescence spectra in (b) of five dyes dissolved in ethanol at room temperature using the software PhotochemCAD (http://www.photochemcad.com) [40].
Optics 01 00001 g001
Figure 2. The optical setup used for the measurement of temperature-dependent fluorescence spectra of dye/fuel solutions.
Optics 01 00001 g002
Figure 3. Absorbance spectra of fluorescein (FL) (a), eosin Y (EY) (b), rhodamine 6G (Rh6G) (c), rhodamine B (RhB) (d), and sulforhodamine 101 (SRh101) (e) in ethanol (E100) and butanol (B100). The absorbance signals at 532 nm are plotted in (f). The concentrations of dyes in E100 and B100 are given in Table 1.
Optics 01 00001 g003
Figure 4. Temperature-dependent emission spectra of dyes in ethanol, FL (a), EY (b), RhB (c), Rh6G (d), and SRh101 (e) at liquid temperatures ranging between 25 °C and 65 °C. In (f), normalized peak intensity is plotted as a function of liquid temperature for all investigated dyes.
Optics 01 00001 g004
Figure 5. Temperature-dependent emission spectra of dyes in butanol, FL (a), EY (b), RhB (c), Rh6G (d), and SRh101 (e) at liquid temperatures ranging between 25 °C and 65 °C. In (f), normalized intensity peaks are plotted as the function of liquid temperature for all the investigated dyes.
Optics 01 00001 g005
Figure 6. One-dye approach: normalized ratio of integrated signal intensity of LIF1 and LIF2 bands (Table 3) plotted against temperature for dyes in (a) ethanol and (b) butanol based on experimental data of Figure 4 and Figure 5.
Optics 01 00001 g006
Figure 7. Two-dyes approach: normalized ratio of integrated signal intensity of LIF1 and LIF 2 bands (Table 5) plotted against temperature for dye combinations in ethanol in (a) and in butanol in (b) based on experimental data of Figure 4 and Figure 5.
Optics 01 00001 g007
Table 1. Properties of dyes and their concentration in ethanol and butanol.
Organic Dyes
(Xanthene Family)
CAS
[40]
Melting Point
(°C)
FQY in Ethanol
[40]
Conc. In Ethanol/Butanol
(10−4 M/L)
FL2321-07-53140.9734.9/34.6
EY17372-87-12950.671.2/0.9
RhB81-88-92100.701.3/1.31
Rh6G989-38-82900.951.5/1.5
SRh10160311-02-6>3000.901.2/1.0
Table 2. Dyes in ethanol/butanol and their corresponding self-absorption bands (in nm) at 25 °C.
DyesSelf-Absorption Band
FL500–525
EY540–575
RhB575–610
Rh6G550–575
SRh101590–625
Table 3. Spectral bands (in nm) selected for two-color LIF (single dye) in ethanol and butanol.
DyesLIF1 Band (Semrock Order #)LIF2 Band (Semrock Order #)
FL505–515 (FF02-510/10-25)604–679 (FF02-641/75-25)
EY553–567 (FF01-560/14-25)620–680 (FF01-650/60-25)
RhB580–591 (FF01-585/11-25)620–680 (FF01-650/60-25)
Rh6G553–567 (FF01-560/14-25)604–679 (FF02-641/75-25)
SRh101598–613 (FF01-605/15-25)620–680 (FF01-650/60-25)
Table 4. Sensitivity of dyes in ethanol and butanol for one dye approach.
DyesSensitivity (%/°C) in EthanolSensitivity (%/°C) in Butanol
FL1.271.42
EY1.642.06
RhB2.932.89
Rh6G1.521.24
SRh1010.512.03
Table 5. Spectral bands (in nm) selected for two-color LIF (two dyes).
DyesLIF1 Band (Semrock Order #)LIF2 Band (Semrock Order #)
FL/SRh101543–555 (FF01-549/12-25)620–680 (FF01-650/60-25)
EY/SRh101580–591 (FF01-585/11-25)620–680 (FF01-650/60-25)
RhB/SRh101613–627 (FF01-620/14-25)634–686 (FF01-660/52-25)
Table 6. Sensitivity of dyes in ethanol and butanol for two-dyes approach.
DyesSensitivity (%/°C) in EthanolSensitivity (%/°C) in Butanol
FL/SRh1012.051.14
EY/SRh1010.150.27
RhB/SRh1012.392.54

