1. Introduction
In most gear pairs, failure primarily occurs when the tooth loses structural integrity due to material fatigue developing at its root. Gear deterioration associated with this mechanism develops under cyclic loading, where a fatigue crack forms in the tooth root region; with increasing stresses at the crack front, the defect gradually propagates until it reaches a critical size leading to final tooth failure [
1,
2]. Therefore, the gears, as fundamental components of power and motion transmissions, must be designed in such a way that they fulfil the very high reliability and performance requirements [
3]. Gear designers and manufacturers are often confronted with contradictory requirements that cannot be fulfilled simultaneously. Thus, gears are designed to transmit very high loads at high speeds and temperatures, while the transmission housings with all their work components must be as compact as possible, with a lesser mass in order to reduce the manufacturing costs (materials and energy) and achieve environmentally sustainable manufacturing. Such requirements are largely met by thin-rim gears, which are essential elements of power transmission systems in aviation, space applications, and alternative energy technologies such as wind turbines, while in the automotive sector they are particularly used in hybrid and electric drivetrains [
4,
5]. These gears are capable of transmitting high loads while maintaining satisfactory contact stresses on the working tooth flanks, where, due to material fatigue, pitting may occur. However, under variable bending stresses a more critical failure mechanism is the initiation of fatigue damage in the tooth root region. Once initiated, the crack may propagate through the tooth body or into the gear rim, eventually leading to tooth fracture and, in severe cases, catastrophic failure. Therefore, determining the fatigue durability of the gear tooth root due to flexing is often the focus of professional and scientific interest of drive engineers, designers and scientists [
6,
7].
This problem is approached in three ways. The first involves the experimental determination of gear service life, which is very costly and demanding, and is thus used in calculations for complex constructions, such as aircraft and spacecraft. The second approach is characteristic of practical applications, and is based on conventional calculations of the gear service life according to ISO, DIN and AGMA standards. A common feature of these standards is that the tooth is treated as a console with a varying cross-section, while the loading is taken as uniformly distributed across its width. In addition, ISO and AGMA standards evaluate fatigue durability through material strength, whereas the DIN approach treats it solely as an inherent material property. Gear life, expressed in terms of load cycle endurance, is determined from a diagram that shows how the durability factor (
YNT) varies with the cycle count required for the tooth root crack to reach the point of final failure. In practical terms, the durability factor describes the relationship between the normal stress acting at the critical tooth root region and the corresponding material strength parameters. The relevant strength characteristic in the tooth root region is the fatigue limit obtained from tests on model gears, representing the stress level in the tooth root at which 99% of the tested gears reach 3∙10
6 load cycles. Standard procedures for calculating gear durability are relatively coarse and consider only the final fracture of the gear [
8]. The third approach to determining gear service life is linked to the development of computer science and technology and has recently attracted considerable attention from scientists. Studies of crack growth under cyclic loading and the dependable estimation of gear service life are carried out using numerical modelling founded on finite element principles, making use of contemporary findings from fracture mechanics [
9]. The first scientific publications in this field researched how gear rim thickness influences the stress state in the tooth root region, and so, in [
10], a partial two-dimensional model of a one-toothed gear with an assumed planar stress state was considered. At the tooth root where the operating load acts, a tensile zone with positive normal stress was observed, while on the opposite side of the flank of the same tooth, a pressure zone with negative normal stress is found. The results of the study show that, with a reduction in the gear rim thickness (to a value of 1.5∙
mn), the greatest normal stress in the tensile zone exhibits a slight decreasing trend, and that, with further reduction in gear rim thickness, the observed stress rapidly increases. At the same time, a trend of continuous growth of the negative normal stress is noticeable in the pressure zone. This conclusion is supported by the findings reported in [
11], which include experimental testing of a statically loaded lightweight gear and a numerical analysis performed using a 2D partial model, assuming a predominantly planar stress state within the root region of the gear tooth. In addition, the sign of the stress acting at the tooth root region was experimentally varied, and gears with thinner rims exhibited a shorter service life compared with full-rim gears. Similar findings are reported in [
12], although in their numerical study the authors worked with a 3D segment of a gear featuring a reduced rim thickness. According to [
13], when loading along the tooth flank is symmetrically distributed in the tooth root region, the stresses obtained from two-dimensional and three-dimensional gear models are nearly identical. At the same time, significantly less time is required for the creation of the model itself and the obtaining of results with the two-dimensional gear model. Furthermore, according to the same author, for a two-dimensional gear model whose width-to-module ratio is greater or equal to six, it can be assumed that in the area of the root of the analysed tooth, a state of planar deformation exists, while in the opposite case a state of planar stress is present.
Further research on the stress state in the tooth root region of gears with reduced rim thickness analysed the influence of the thickness and the position of a supporting full disc linking the gear rim to the gear hub. The position of the disc across the gear width, together with its thickness, significantly affects both the level and the position of the highest normal stresses that occur in the root region of the tooth. Simultaneously, elastic deformation of the gear rim and the disc occurs [
14], which leads to a non-uniform stress distribution in the root region along the tooth width. Reference [
15] examines the effect of centrifugal force on the stress distribution in the tooth root region of a gear with a reduced rim thickness and a disc positioned asymmetrically along the gear width. In this research, it has been observed that the gear rim elastically deforms with an increase in the rotation rate and the centrifugal force, which influences the engagement of the gear, because the contact stresses along the tooth flank increase. Under such a loading condition, the maximum normal stress in the tooth root region remains approximately unchanged up to a certain rotational speed threshold. After reaching the threshold speed of rotation, an increase in stress in the tooth root region begins, and research has shown that said increase is more pronounced as the gear rim thickness decreases.
The mechanism of fatigue fracture in the root of the teeth of involute gears is examined through four phases of fatigue crack inception. The initial phase involves the appearance of microcracks in the tooth root region, while the point at which they begin to extend marks the start of the second phase, where the cracks remain relatively short but continue to advance. In the third phase, the crack enters its long-crack regime and continues to advance until it reaches a critical size, after which the process shifts into the fourth phase, leading to final failure in the tooth. The onset of material degradation near the root corresponds to the first two phases and marks the stage at which a fatigue crack initiates. As the process advances, the crack enters its long-crack phase and continues to grow toward a critical dimension, at which point the tooth fails; this entire stage is regarded as the crack propagation period. Accordingly, gear life expressed in load cycles (
N) is determined by combining the cycles accumulated during the crack initiation stage (
Ni) with those required for the crack to advance to its critical length, at which point the gear fails (
Np) [
16,
17,
18]. More relevant fatigue crack research papers follow this approach. However, they consider only the crack expansion period, while the initiation period is ignored or is determined experimentally. Such an approach was used in [
19], where the growth of a fatigue fracture with different gear rim thicknesses was researched for the practical application in power transmission in helicopters and turboprop aircraft. In that study, the author accounted for where the crack first appears and for the effect of centrifugal force, while the moment at which the crack initiates was established experimentally. In the research paper, gears without gear rim supports (discs) have been considered, and it was determined that a fatigue crack propagates through the gear rim in cases where the gear rim thickness value is below the threshold thickness and at rotation speeds which are greater than the threshold value.
Many papers on fatigue crack propagation in thin-rim gears can be found in the literature. Thus, in [
20], the effect of different stress distributions along the tooth flank on crack propagation was experimentally researched, while in [
21] a numerical model for predicting the fatigue service life of cylindrical thin-rim gears was proposed, which includes the initiation phase and the fatigue crack expansion phase. In the expansion phase, the paths of fatigue cracks (which propagated through the tooth or the gear rim) and the remaining service life until the final fracture of the gear were researched. The influence of the crack length on the rigidity of the tooth during engagement has been researched in [
22], while in [
23] tribological properties of the gear tooth with a crack at its root have been considered. A study presented in [
24] examined how centrifugal loading influences the service life of gears with thin rims, and it showed that rim thickness plays a more dominant role in determining fatigue resistance than the centrifugal force itself. Study [
25] explored how friction during gear meshing affects where a fatigue crack first appears at the tooth root, while study [
26] examined how variations in load direction, magnitude and point of application during meshing influence both the onset of cracking and the subsequent development of the crack in that region. In [
26], the onset of cracking at the critical point in the tooth root region was estimated using the critical plane approach, while the period needed for the crack to grow to its critical dimension was assessed through fracture mechanics. The crack propagation stage was determined by accounting for variations in stress intensity values, since cyclic contact between mating surfaces during gear engagement causes partial closure of the crack near its tip. It was demonstrated that this approach influences the path followed by the fatigue crack. In this study, this path differed from the one obtained when the load was simplified to an applied force acting at the top point of engagement, which corresponds to a pulsating gear fatigue cycle.
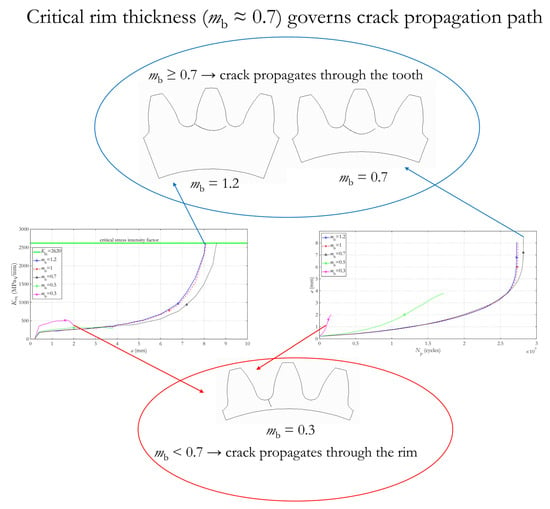
Study [
27] examined fatigue crack growth for various rim thicknesses by combining numerical modelling with principles of linear elastic fracture behaviour, and showed that the crack will pass through the rim when its thickness (
mb) is below 0.38. According to [
28], where a series of simulation models of the expansion of a crack in the root of a tooth was conducted using the expanded finite element method (XFEM), it was shown that the expansion of the crack through the gear rim begins with a gear rim thickness (
mb) of 0.4, and that a significant contribution of it comes from the centrifugal stress which affects the position and direction of expansion of the initiated crack. In their research, the authors took into consideration the gear rim thickness, gear rim support (disc) thickness, and the effect of centrifugal load of the gear.
More recent research papers, refs. [
29,
30], compare the fatigue crack expansion in a symmetric and an asymmetric involute tooth profile for different gear rim thicknesses and engagement angles of the gear (α
w). The results show that flexural stresses in the tooth root region decrease with increasing engagement angle, and that the crack propagation rate in asymmetric profiles is significantly lower than in symmetric profiles. Furthermore, the fatigue strength of asymmetric cylindrical gear profiles is higher.
Recent studies have increasingly focused on the influence of rim thickness and gear geometry on fatigue crack propagation behaviour and bending durability of thin-rim gears [
29,
30]. At the same time, numerical approaches combining crack initiation and crack propagation analyses for fatigue life assessment have attracted growing attention [
16,
17,
18]. However, the combined influence of tooth count and rim thickness on the total fatigue life and crack path behaviour of cylindrical involute gears without rim supports has not yet been sufficiently clarified.
At present, no model provides a reliable prediction of the operational life of thin-rim gears, as the available studies—and the numerical approaches they employ—differ considerably. The differences are primarily contingent on the stress which has a randomly varying amplitude, the geometry of the researched gears (number of teeth, step, profile displacement, degree of overlay, profile modification, etc.), and the form, arrangement and number of supports connecting the gear rim to the hub. A more precise and reliable determination of gear service life also implies a more accurate determination of said input parameters [
31,
32]. Therefore, the greatest novel contribution of this paper compared to those previously published lies in the identified regularity of the shared influence of the number of teeth (
z) and the gear rim thickness (
mb) on the fatigue durability of cylindrical involute gears made without gear rim supports (a disc). The study was carried out numerically under the assumption of a plane-strain condition in the region at the base of the tooth. The onset point (
Ni) was obtained using the critical plane approach, identifying the orientation on which the damage parameter reaches its maximum. The shear and tensile damage parameters are linked to the amplitudes of normal and shear deformation, and these values are derived from the stress-response history at the base of the tooth, obtained through numerical modelling. The propagation of the crack up to its critical length was analysed using linear elastic fracture mechanics, because this phase is controlled by the stress intensity factor evaluated at the crack tip for every load cycle. In this context, the stress intensity value reflects both the opening and sliding components of crack displacement in the region at the base of the tooth. The interval in which the crack grows to its critical length (
Np) is obtained through numerical integration of Paris’s law, which links the growth duration to the effective SIF evaluated at the crack front. When the effective SIF is used, it is taken into account that the actual intensity near the crack front decreases; a short distance behind that point the crack becomes partially closed, which offers some shielding from cyclic loading. The total gear service life (
N) is the sum of load cycles in the initiation phase and in the fatigue crack expansion phase in the tooth root region. To obtain the most realistic load cycle possible, a quasi-static numeric simulation of a partial 2D gear model with three teeth was conducted. Therein, all cases of loads into which the gear engagement is divided were individually analysed.
2. Numerical Models
The overall numerical procedure adopted in the present study is schematically illustrated in
Figure 1.
The methodology combines the crack initiation model and crack propagation analysis in order to estimate the total fatigue life of thin-rim gears. Detailed descriptions of the individual stages of the numerical procedure are presented in the following subsections.
2.1. Initial Phase of Crack Appearance in the Gear Tooth Root
The load cycle count associated with the initial phase of cracking in the tooth root region was obtained through numerical modelling for four Nul gear pairs with external flat gearing and five different rim thickness values. All gears have an ideal surface roughness and are loaded with a temporally variable cyclic load.
Table 1 presents the loading conditions together with the geometry of the investigated gear pairs.
The tooth profile and 2D geometric gear model of the analysed gear pairs were created in Auto CAD. As noted in the introduction, two- and three-dimensional gear models produce nearly identical stresses at the gear tooth root when loading along the tooth flank is symmetrically distributed; under these conditions, constructing a 2D model and obtaining the results requires less time [
13]. In this research, a partial model of a gear with three teeth is analysed, because, according to [
26], the stress difference in the tooth root between this model and a full gear model amounts to just 0.4%. Files representing eight partial three-tooth gear models were imported into the ANSYS environment, where a two-dimensional finite element approach—based on the assumption of planar deformation, justified by the width-to-module ratio exceeding six [
13]—was applied to determine stresses in the tooth root region for all analysed gears. Before the stress analysis, an interlinking of the model with rectangular linearly elastic finite elements with eight nodes was conducted, the material properties, borderline conditions and load were determined, and the convergence of the solution was controlled with the aim of obtaining the optimal number of finite elements in the model. A locally refined finite element mesh was applied in the tooth root region in order to improve the accuracy of the stress evaluation in the critical area and to minimise distorted and skewed elements. Depending on the analysed geometry, the FE models contained approximately 800 finite elements. The displacements at the left and right boundary nodes of the three-tooth partial model were constrained, which is illustrated in
Figure 2.
For every analysed configuration, the shifting position of the load along the flank was examined, since during meshing the load’s magnitude, point of action and direction change continuously across the flank. Accordingly, this phenomenon was assessed by considering 16 individual meshing cases, through which the load cycle of each tooth was characterised. This includes six distinct load positions within the single-tooth meshing interval, during which the entire load is carried by the analysed tooth. Two positions correspond to the region of double-tooth contact when the load is distributed between two pairs of gear teeth in engagement, and four positions correspond to cases where the load is applied to the tooth in front and to the adjacent preceding tooth relative to the analysed tooth. The described load positions, shown on
Figure 3, define the load cycle for all teeth of the considered gear pairs.
The locally based deformation model presented in [
26] makes it possible to estimate the load cycle count associated with the stage in which a crack first forms at the tooth root. Within this framework, the first appearance of a crack is expected at the point in the tooth root region where deformation is most concentrated, arising from repeatedly imposed cycles of local plastic strain. Therefore, the analysis of the stress cycles has been conducted when the gear teeth are located in the external point of single engagement, because it is a case of the most unfavourable load of the analysed tooth. Because a multiaxial stress state prevails at the surface of the analysed tooth root, the crack initiation period was evaluated using Socie’s critical plane models [
33]. The models link the damage parameter to the number of load cycles until crack initiation so that it is necessary to find the plane (critical plane) where said parameter has the greatest value. Critical plane methods provide for two models of fatigue crack initiation. In the first model, crack propagation follows the orientation of maximum shear deformation, whereas in the second model it forms along a line approximately orthogonal to the direction associated with the peak normal stress.
Expression (1) represents the functional relation between time to fatigue crack initiation and the shear damage parameter:
where
γa is the shear deformation amplitude;
k is the gear material constant;
σmax is the peak normal stress acting on the orientation where shear deformation is greatest;
Rt is the gear material yield strength;
τf′ is the parameter describing shear-fatigue strength;
G is the under shear load;
Ni is the load cycle count associated with the moment when a crack first appears;
γf′ is a parameter describing cyclic shear deformation;
b0i is the exponent characterising shear-fatigue strength;
c0i is the exponent of cyclical shear deformation.
Expression (2) represents the functional relation between the time to fatigue crack initiation and the tensile damage parameter:
where:
εa is a measure of the normal deformation amplitude;
σmax is the maximum normal stress;
σf′ is a parameter representing fatigue strength;
E is the material’s elastic property describing stiffness;
Ni is the load cycle count corresponding to the moment when a crack first forms;
εf′ is a parameter characterising cyclic deformation behaviour;
bi is the exponent describing fatigue-strength behaviour;
ci is an exponent characterising cyclic deformation behaviour.
From Expressions (1) and (2) it follows that the shear-related damage parameter depends on the local amplitude of shear deformation, while the tensile counterpart is governed by the local amplitude of normal deformation; in addition, both parameters are influenced by the maximum normal stress evaluated at the critical location along the transitional curve of the tooth under critical loading conditions. Under the assumption of a planar deformation state, the elastic components of principal stresses and strains (with the superscript “e” indicating elastic quantities) are determined from the stress tensor in a plane normal to the transitional curve surface at the critical location in the tooth root region, using standard relations from the strength of the materials, as follows:
On the same plane, the deformation components are then readily determined according to the following formulas:
Then the normal stress on a plane perpendicular to the transitional curve surface is:
The remaining two values of the stress components on the same plane in the tangential and axial direction are:
The deformation components in the normal and tangential directions on the same plane are obtained by substituting Expressions (9)–(11) in (6)–(8) and they are:
The biaxiality ratio of the stress components is determined from Expressions (9) and (11) as follows:
So, from (15), it follows that the stress components ratio on a plane perpendicular to the transitional curve of the tooth root in the axial and normal directions is constant, and since the maximal normal stress is located in the same plane, the angle which its vector closes with the local horizontal axis is constant as well. It follows, then, that the stress field at the critical region near the tooth root region—as well as in the plane normal to the transitional curve surface—is multiaxial and corresponds to a constant-amplitude loading pattern. Within this plane, the tensile-related damage parameter reaches its highest level, making it the critical orientation for assessing tensile damage. For the stress cycle given in (12), the corresponding normal deformation is obtained, and the tensile damage parameter is then evaluated using Expression (2), which relates directly to the moment when a fatigue crack first forms, as follows:
The peak level of the shear damage parameter (1) occurs at the critical location along the transitional surface at the tooth root, where the constant-amplitude stress field is proportional. This maximum lies in a plane inclined by 45° relative to the critical orientation used in the tensile-based model. This plane represents the critical orientation for the shear damage parameter, as the shear deformation amplitude reaches its maximum there; see
Figure 4.
From the components of deformation in the normal and tangential directions (12) and (14), the shear deformation is determined in the critical plane, which is:
From (17) it is evident that the change in shear deformation depends on the normal stress and for a pulsating stress cycle the shear deformation amplitude is:
By including (18) in (1), the shear damage parameter is:
Before estimating the moment at which a crack first forms in the analysed gears, an elasto-plastic correction of local stresses and strains was carried out, since plastic flow develops in the critical region near the base of the tooth. The calculation of local elasto-plastic stresses and deformations was conducted using the Hoffman–Seeger method, which is applied with a multiaxial proportional stress state [
34], where the multiaxial proportional stress is translated to an equivalent uniaxial stress state and the obtained stresses and deformations are substituted in Neuber’s rule. It is then possible to calculate the main stresses and deformations in the elasto-plastic area using Hencky’s flow rule. Firstly, it is necessary to calculate von Mises’ equivalent elastic stress on the tooth root surface, where
σ3e = 0 and the ratio of biaxiality for the proportional load is constant and equal to Poisson’s coefficient (15), and so the equivalent stress is:
Based on Hook’s law, the equivalent deformation is:
Knowing the equivalent stresses and deformations in the elastic area, it is possible to determine equivalent deformations (
εq) and stresses (
σq) in the elasto-plastic area by solving two equations using Newton–Raphson’s numerical process. The first Equation (22) represents an expression for a uniaxial cyclical curve of the dependence of equivalent stresses and deformations in the elasto-plastic area, and the second Equation (23) represents Neuber’s rule.
where
K′ is the coefficient of material hardening under cyclical load;
n′ is the exponent of material hardening under cyclical load.
When equivalent stresses and deformations in the elasto-plastic area are known, the effective Poisson coefficient (ν
eff) can be calculated according to the following expression:
Assuming an equal ratio of the main deformation components for the elastic and elasto-plastic areas
we can also determine the elasto-plastic biaxial ratio as follows:
Using Hencky’s flow law, the local main stresses and the local main deformations are calculated as follows:
Based on Expressions (30) and (32), the normal and shear deformation amplitudes in the elasto-plastic area are obtained, which are then used to calculate the damage parameters. Using the obtained damage parameter values together with the cyclic material data from
Table 2, and applying Expressions (16) and (19), the load cycle count corresponding to the stage when a crack first appears at the tooth root (
Ni) can be derived. The load cycle count is evaluated using whichever damage parameter attains the higher value, which yields a more conservative estimate of the time required for crack initiation and growth.
2.2. Fatigue Crack Propagation Period in the Tooth Root Region and Gear Service Life
The second stage of the numerical analysis concerns the evaluation of the parameter (
Np), representing the load cycle count required for an already-formed crack to advance to its terminal size, the point at which failure of the tooth takes place. This simulation phase was conducted using the FRANC2DL software suite, where it is necessary to determine the location, orientation, and length of the initiated crack. The critical plane approaches used to estimate when a crack first forms also indicate its likely position and orientation along the transitional curve surface in the root region of the tooth, as illustrated in
Figure 4. In this way, the necessary basis was established for continuing the analysis of crack growth and, ultimately, for determining the overall load cycle count that defines the gear’s fatigue life. According to the described fatigue fracture mechanism, the initiated crack expansion begins with an increase in long cracks, so for the length of the initiated crack, the value (
a2) was adopted, which represents the length threshold value when short cracks become long. Thus, this length marks the boundary between the second and third phase of the fracture initiation process in the region near the tooth root. According to [
35], the initiated crack length (
a2) is defined by the following expression:
where
δ is crystallite diameter;
σd is the laboratory sample fatigue limit;
σtd is the gear material dynamic yield strength.
Once the crack length exceeds the value defined by Expression (33), its subsequent behaviour can be described according to the principles of linear elastic fracture mechanics. Based on the data given in
Table 2 and
Table 3, which define the propagation characteristics of the gear material, and in accordance with (33), the initial crack length was taken as 200 micrometres.
As previously stated, the fatigue crack expansion was simulated in the Franc2D/L version 4 program suite, which semi-automatically propagates the crack, that is, the user defines the length of each lengthening of the crack. The analysis is conducted using the finite element method after each lengthening which gives the solution for the crack tip location, further expansion direction, and stress intensity factor (SIF) of the cleaving (
KI) and sliding type (
KII). The effect of the mode II stress intensity factor is accounted for through the equivalent stress intensity factor, as expressed by the following relation:
where
θ0 is the angle describing the direction in which the crack advances.
Expression (34) for the equivalent SIF does not fully capture the mechanisms responsible for crack closure arising from plastic deformation, corrosion effects or surface roughness, conditions that partly shield the crack front from cyclic loading. Accordingly, the effective SIF is defined for the part of the loading cycle in which the crack faces remain separated and the fracture is fully open. The factor is valid for the entire crack growth area, and is calculated according to the expression from [
26]:
where
g′ is the form function, which is:
and parameter
ξ relates the CTOD
plastic strain to the CTOD
max value measured perpendicular to the opening direction, with its magnitude expressed through a fourth-degree polynomial in the load-ratio function (
r), as presented in [
34]:
The crack growth phase concludes once the equivalent SIF from Expression (34) attains the toughness limit (
KIc) of the gear material, given in
Table 3. At the completion of the growth phase, both the crack path and the functional relation between the equivalent SIF and the progressing crack length are established for all gears in the analysed pairs. An effective SIF (∆
Keff), used to modify the standard Paris relation, is obtained from Expression (35) once the equivalent SIF values from (34) are inserted into it. By numerically integrating the corrected Paris relation and applying the material data from
Table 3, the parameter (
Np)—which represents the load cycle span required for a crack to grow from its initial size (
a2) to the critical value (
ac), where failure near the tooth root takes place—is obtained according to the following expression:
The described process was conducted for all gears of the considered gear pairs and the paths of their fatigue cracks in the gear tooth root, critical crack length values, and the numbers of load cycles in the fatigue crack expansion period (Np) were obtained.
The overall fatigue life of the analysed gear pairs is expressed through the parameter (
N), obtained by combining the contribution from the stage in which a crack first forms (
Ni) with the cycle span required for that crack to advance to its critical size, where failure at the tooth root occurs (
Np).
The obtained numerical trends regarding crack propagation behaviour and the influence of gear rim thickness are generally consistent with previously published experimental and benchmark numerical studies [
11,
19,
27,
28,
29,
30], particularly with respect to the transition of crack propagation from the tooth toward the gear rim for reduced rim thickness values, as will be discussed in the following section.


