Article

Effects of Geometry, Joint Properties, and Deterioration Scenarios on the Hydromechanical Response of Gravity Dams


by
Maria Luísa Braga Farinha
*,
Nuno Monteiro Azevedo
and
Sérgio Oliveira
Concrete Dams Department, National Laboratory for Civil Engineering (LNEC), 1700-066 Lisbon, Portugal
*
Author to whom correspondence should be addressed.
Appl. Mech. 2026, 7(1), 8; https://doi.org/10.3390/applmech7010008
Submission received: 6 December 2025 / Revised: 9 January 2026 / Accepted: 12 January 2026 / Published: 15 January 2026

Abstract

An explicit coupled two-dimensional (2D) hydromechanical model (HMM) that can simulate discontinuous features in the foundation, as well as the effects of grout curtains and drainage systems, is employed to evaluate the influence of key parameters such as dam height, foundation behaviour, joint patterns, joint stiffness and strength, hydraulic apertures, and grout curtain permeability. A parametric sensitive study using four gravity dams, and a real case study of an operating dam are presented. The results presented show that dam height influences the relationship between water level in the reservoir and drain discharges, with higher dams showing more pronounced curved nonlinearity. The strength properties of the concrete–rock interface are also shown to have a meaningful influence on the HM response, especially for an elastic foundation and for higher dams, showing the need to properly characterize this interface through in situ testing. The joint aperture at nominal zero stress is shown to be the parameter with the most significant effect on the HM response. The results also show that a progressive degradation scenario of the concrete–rock interface or of the grout curtain permeability is easier to identify through the hydraulic measurements than in the mechanical displacement field.

Graphical Abstract

1. Introduction

Ensuring the safety of dams throughout their service life is a critical concern, particularly for structures whose failure could result in loss of life or significant economic damage. Historically, many concrete dam failures have been attributed to issues within the foundation rock mass [1]. These failure mechanisms are heavily influenced by the geometry and mechanical properties of the foundation discontinuities and of the uplift pressures that build up along these surfaces. The hydromechanical (HM) behaviour of dam foundations involves the coupled response of the solid (rock or concrete) and the pore fluid (seepage flow), where water pressure, seepage, and mechanical stresses influence each other. Understanding this coupled response is crucial for ensuring safety, predicting leakage, and designing effective drainage and grouting systems.
Experimental and numerical studies in dam engineering have mainly focused on the mechanical behaviour modelling. For concrete dams, the finite element method (FEM) has a widespread application [2]. Complex nonlinear finite element (FE) static stability analysis has been employed in 2D, including rock bolts [3], in three-dimensional (3D), considering cracking [4], and has been shown to predict a good agreement with known physical tests [5]. 3D FE models are nowadays employed to predict the dam–foundation mechanical behaviour, including complex foundation geometries [6]. Within static stability analysis, probabilistic methods have also been adopted [7]. Dynamic modelling has also been pursued, mostly using FE models, including coupled fluid–solid models that take into account reservoir effect [8,9] and have been shown to have a good agreement with known in situ seismic records [10].
Thermomechanical coupled FE analysis has also been proposed, which allows the behaviour of the dam during its construction and first filling analysis to be predicted with very good agreement with known in situ measurements [11,12]. The short- and long-term mechanical properties of concrete [13,14] and rock–concrete interfaces in tensile [15], wedge splitting [16] and compression [17] are also well known and greatly ease the process of calibration of complex contact interfaces constitutive laws, including hydromechanical behaviour [18,19] and interface roughness [20,21].
Regarding concrete cracking modelling, both the discrete crack approach [22,23] and smeared crack approach [24,25] have a widespread application. Physical tests are also usually focused on structural analysis only, mostly for the assessment of stability scenarios [26,27,28,29].
Within the activities of safety control of operational dams, most of the statistical prediction models based on the separation of effects model (SEM) [30] or machine learning (ML) techniques [31,32] have also been mostly proposed for the mechanical variables, usually displacements. Very few studies can be found in the literature where prediction models are applied to hydraulic measurements [33,34].
Regarding the hydromechanical modelling (HMM) of gravity dam foundations, less work can be found in the literature. The numerical modelling is either based on porous-media theory with strong coupling [34,35] or with a simple sequential coupling scheme adopting a discrete fracture network [36]. The majority are numerically based and focused on stability issues [37]. Even fewer comparisons between numerical predictions and experimental testing are available [38].
Various numerical techniques are employed to investigate the hydromechanical response: for gravity–dam analyses, 2D and 3D discontinuum hydromechanical coupled models based on the finite element method have been employed within a sequential coupling framework [39,40]. For rock hydraulic fracturing, HMMs based on the coupling between the boundary element method and the FE [41] and the combined finite–discrete element method (FDEM) have been proposed in 2D [42] and 3D [43]; these have been recently extended to include thermal coupling [44,45]. Within the framework of discontinuous deformation analysis (DDA), a 2D HMM has also been proposed and applied to the sliding stability assessment of a gravity dam [46]. A continuum HMM approach based on the extended finite element method (XFEM) that adopts a strong coupling between the mechanical and hydraulic responses has been proposed for the poroelastic media saturated modelling with a compressible fluid [47].
To accurately assess dam foundation behaviour, it is essential not only to adopt a coupled HMM that accounts for the interdependence between stress and strain conditions and the seepage that occurs through the foundation joints, but also to properly simulate foundation discontinuities. In this work, an explicit sequential coupled 2D numerical model that directly considers the discontinuous features present in the foundation, as well as the grout curtains and drainage systems’ effect on the seepage flow, is adopted [39]. Compared with other numerical approaches, the adopted modelling approach has the following advantages: (i) directly represents the foundation discontinuities, which are a key parameter in the safety assessment [48], and (ii) adopts joint finite elements to represent block interaction [49,50], which allows faster and more accurate modelling when compared with discrete element approaches [39].
The adopted HMM has been adopted in the stability safety assessment of concrete gravity dams for overtopping scenarios, considering fracture propagation along the concrete–rock foundation [51] or to both static and seismic loading, adopting simplified concrete–rock interface constitutive laws [39]. Still, the effect of key parameters, such as the orientation and spacing of discontinuities, foundation behaviour, dam height, as well as hydromechanical characteristics like joint stiffness, joint strength, and hydraulic apertures, needs to be better understood.
In this study, four gravity dams are numerically analyzed using an explicit coupled 2D HMM, Parmac2D-Fflow. The dams have different heights, foundation joint patterns, and different foundation behaviour. Numerical simulations are carried out by incrementally increasing the water head at the reservoir bottom and applying the corresponding hydrostatic pressure to the upstream face of the dam, thereby simulating the reservoir filling process. In all cases, this loading phase is followed by an unloading phase, representing the subsequent emptying of the reservoir. Several parametric case studies are presented that show the relevance of each HM key parameter on the overall hydromechanical behaviour. Finally, the adopted HMM is applied to a real dam, showing its potential in the control and safety assessment of operating dams.
The results presented indicate that dam height influences the relationship between the water level in the reservoir and drain discharges. For higher dams, the corresponding relationship displays a stronger nonlinearity. This effect is relevant to developing accurate SEMs for dam safety control. The strength properties of the concrete–rock interface are shown to have a meaningful influence on the HM response, especially for an elastic foundation and for higher dams, showing the need to properly characterize this interface through in situ testing during construction. The joint aperture at nominal zero stress is shown to be the parameter with a more meaningful effect on the HM response, namely, in the measured drain discharges.
The results also show that a progressive degradation scenario of the concrete–rock interface or of the grout curtain permeability is easier to identify in hydraulic measurements than in mechanical measurements of the displacement field, which is relevant for the control and safety of operating dams and for the improvement of early warning systems. Overall, the results presented show that the adopted HMM implementation can be adopted in the design stage, namely in the definition of the drainage system and grout curtains, and in the safety control of operating dams.

2. Hydromechanical Discontinuum Coupled Model

2.1. Mechanical Model

The hydromechanical discontinuum coupled model, Parmac2D-Fflow, used in this study, enables sequential coupling between the mechanical and hydraulic models [39] and is implemented in the computational framework Parmac2D [52]. Parmac2D-Fflow has recently been adopted in the stability safety assessment of concrete gravity dams for overtopping scenarios [51].
The mechanical model employs an explicit solution scheme based on the centred-difference method [52]. As previously noted, joint finite elements (JE) [48,50] are used to represent and simulate the interactions between blocks. These joint elements permit discontinuity in the displacement field, applying a direct relation between stresses and displacements. At each integration point of a joint element, the normal stress, σ n ( t + Δ t ) , and shear stress, τ s t + Δ t , in the local coordinate system, are computed as follows:
σ n ( t + Δ t ) = σ n ( t ) + k n u n t
τ s ( t + Δ t ) = τ s ( t ) + k s u s t
where σ n ( t ) and τ s ( t ) are the normal and shear stresses at time step t ; u n t and u s t are the displacement increments in both normal and tangential joint directions; and k n and k s are the normal and shear contact stiffnesses. To simulate the behaviour of concrete–concrete and concrete–rock discontinuities, either a brittle or a bilinear vectorial softening contact model (BL) is employed in this work. Both approaches have been successfully used in particle-based fracture studies [52]. The mechanical model, built on a joint finite element framework, also accommodates nonlinear elastoplastic and damage formulations [53,54].

2.2. Hydraulic Model

The hydraulic model used in this study was originally introduced in [39]. It closely follows the formulation developed for large-displacement DEM analyses [48] but offers the added advantage that a fully compatible boundary mesh of planar triangular elements is generated during pre-processing. This ensures that interactions between the blocks, representing both the rock mass foundation and the concrete dam, remain strictly edge-to-edge.
The discontinuum hydromechanical approach adopted in this study [39], along with similar discrete models that employ sequential coupling between hydraulic and mechanical analyses [42,43,48], have been validated against benchmark tests. These validations demonstrate that such models are capable of reliably predicting coupled hydromechanical behaviour.
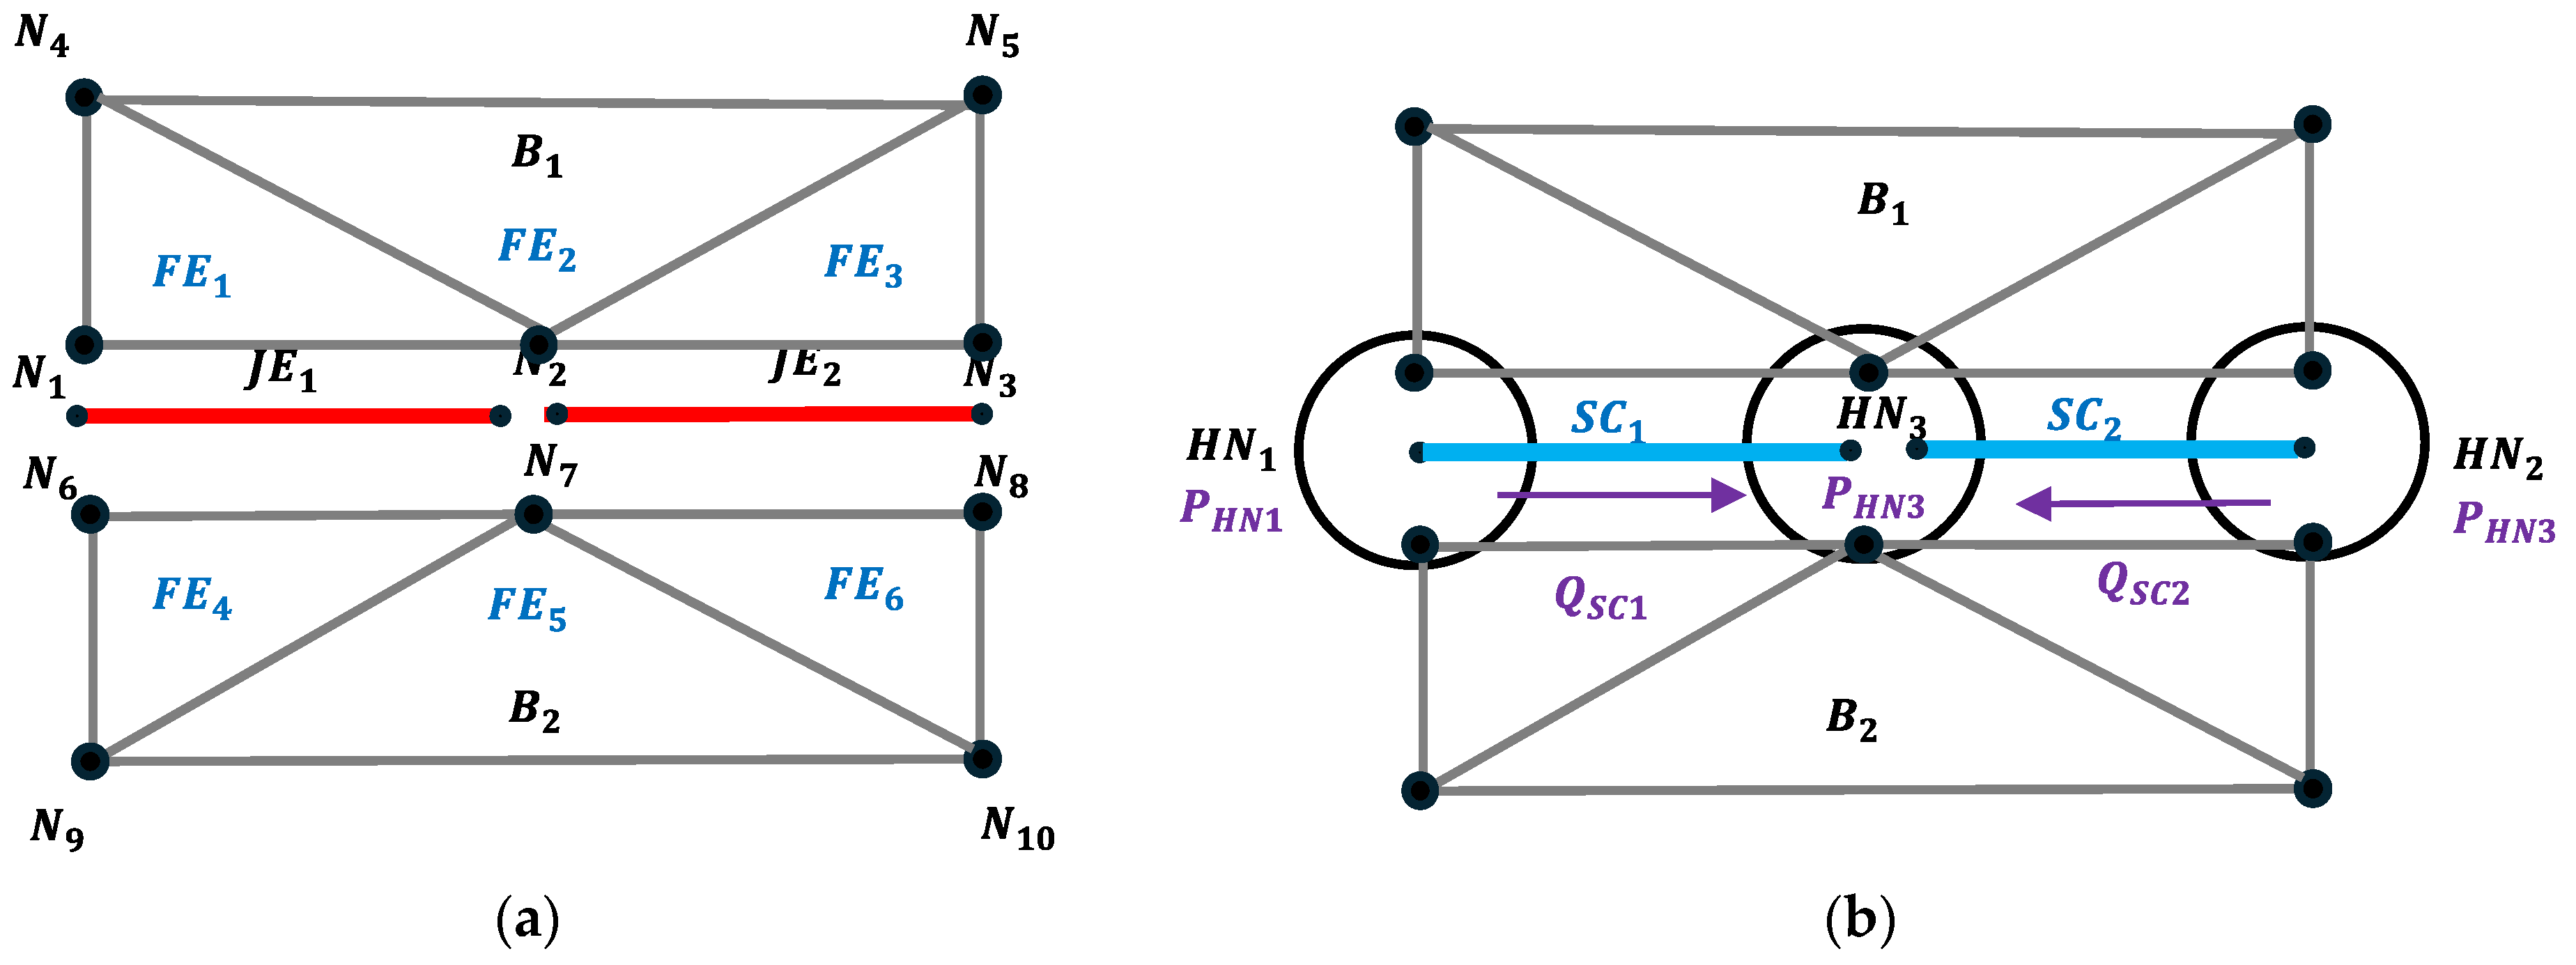
Figure 1a shows the mechanical model for a two-block interaction, where the corresponding joint elements (JE) governing block interaction are also shown. Each block is discretized using triangular finite elements. Figure 1b shows the hydraulic model, which is constructed on top of the mechanical discretization. The seepage channels of the hydraulic model (SC), through which fluid flow is permitted, are aligned with the mid-planes of the joint elements depicted in Figure 1a. The hydraulic nodes (HN), where water pressures are computed, correspond to the mechanical nodes that occupy the same positions at the start of the numerical analysis.
The discharge rate of each SC (m3/s)/(m) is calculated based on the simplified assumption of laminar seepage between parallel plates [55,56,57], and is given by the following equation [58]:
Q S C = 1 12   μ a h . S C 3   ρ w   g Δ H S C L = k S C ρ w   g   Δ H S C
where 1 12   μ is the theoretical value of a joint permeability factor, μ is the dynamic viscosity of the fluid; a h . S C is the hydraulic aperture of the seepage channel; ρ w   is the water density; g is the acceleration of gravity; Δ H S C is the difference in piezometric head between both ends of the seepage channel; and L is the length of the S C .
The volume variation between two consecutive timesteps may be neglected [39,48] under a steady-state condition. Under this hypothesis, the HN water pressure at the next timestep P H N t + Δ t is given as follows:
P H N t + Δ t   =   P H N t +   K W V H N ( t ) Q H N ( t )   Δ t
where K W is the water bulk modulus (N/m2), V H N ( t ) is the volume variation (m3) associated with the HN between two consecutive steps, and Δ t is the timestep used in the hydraulic domain.
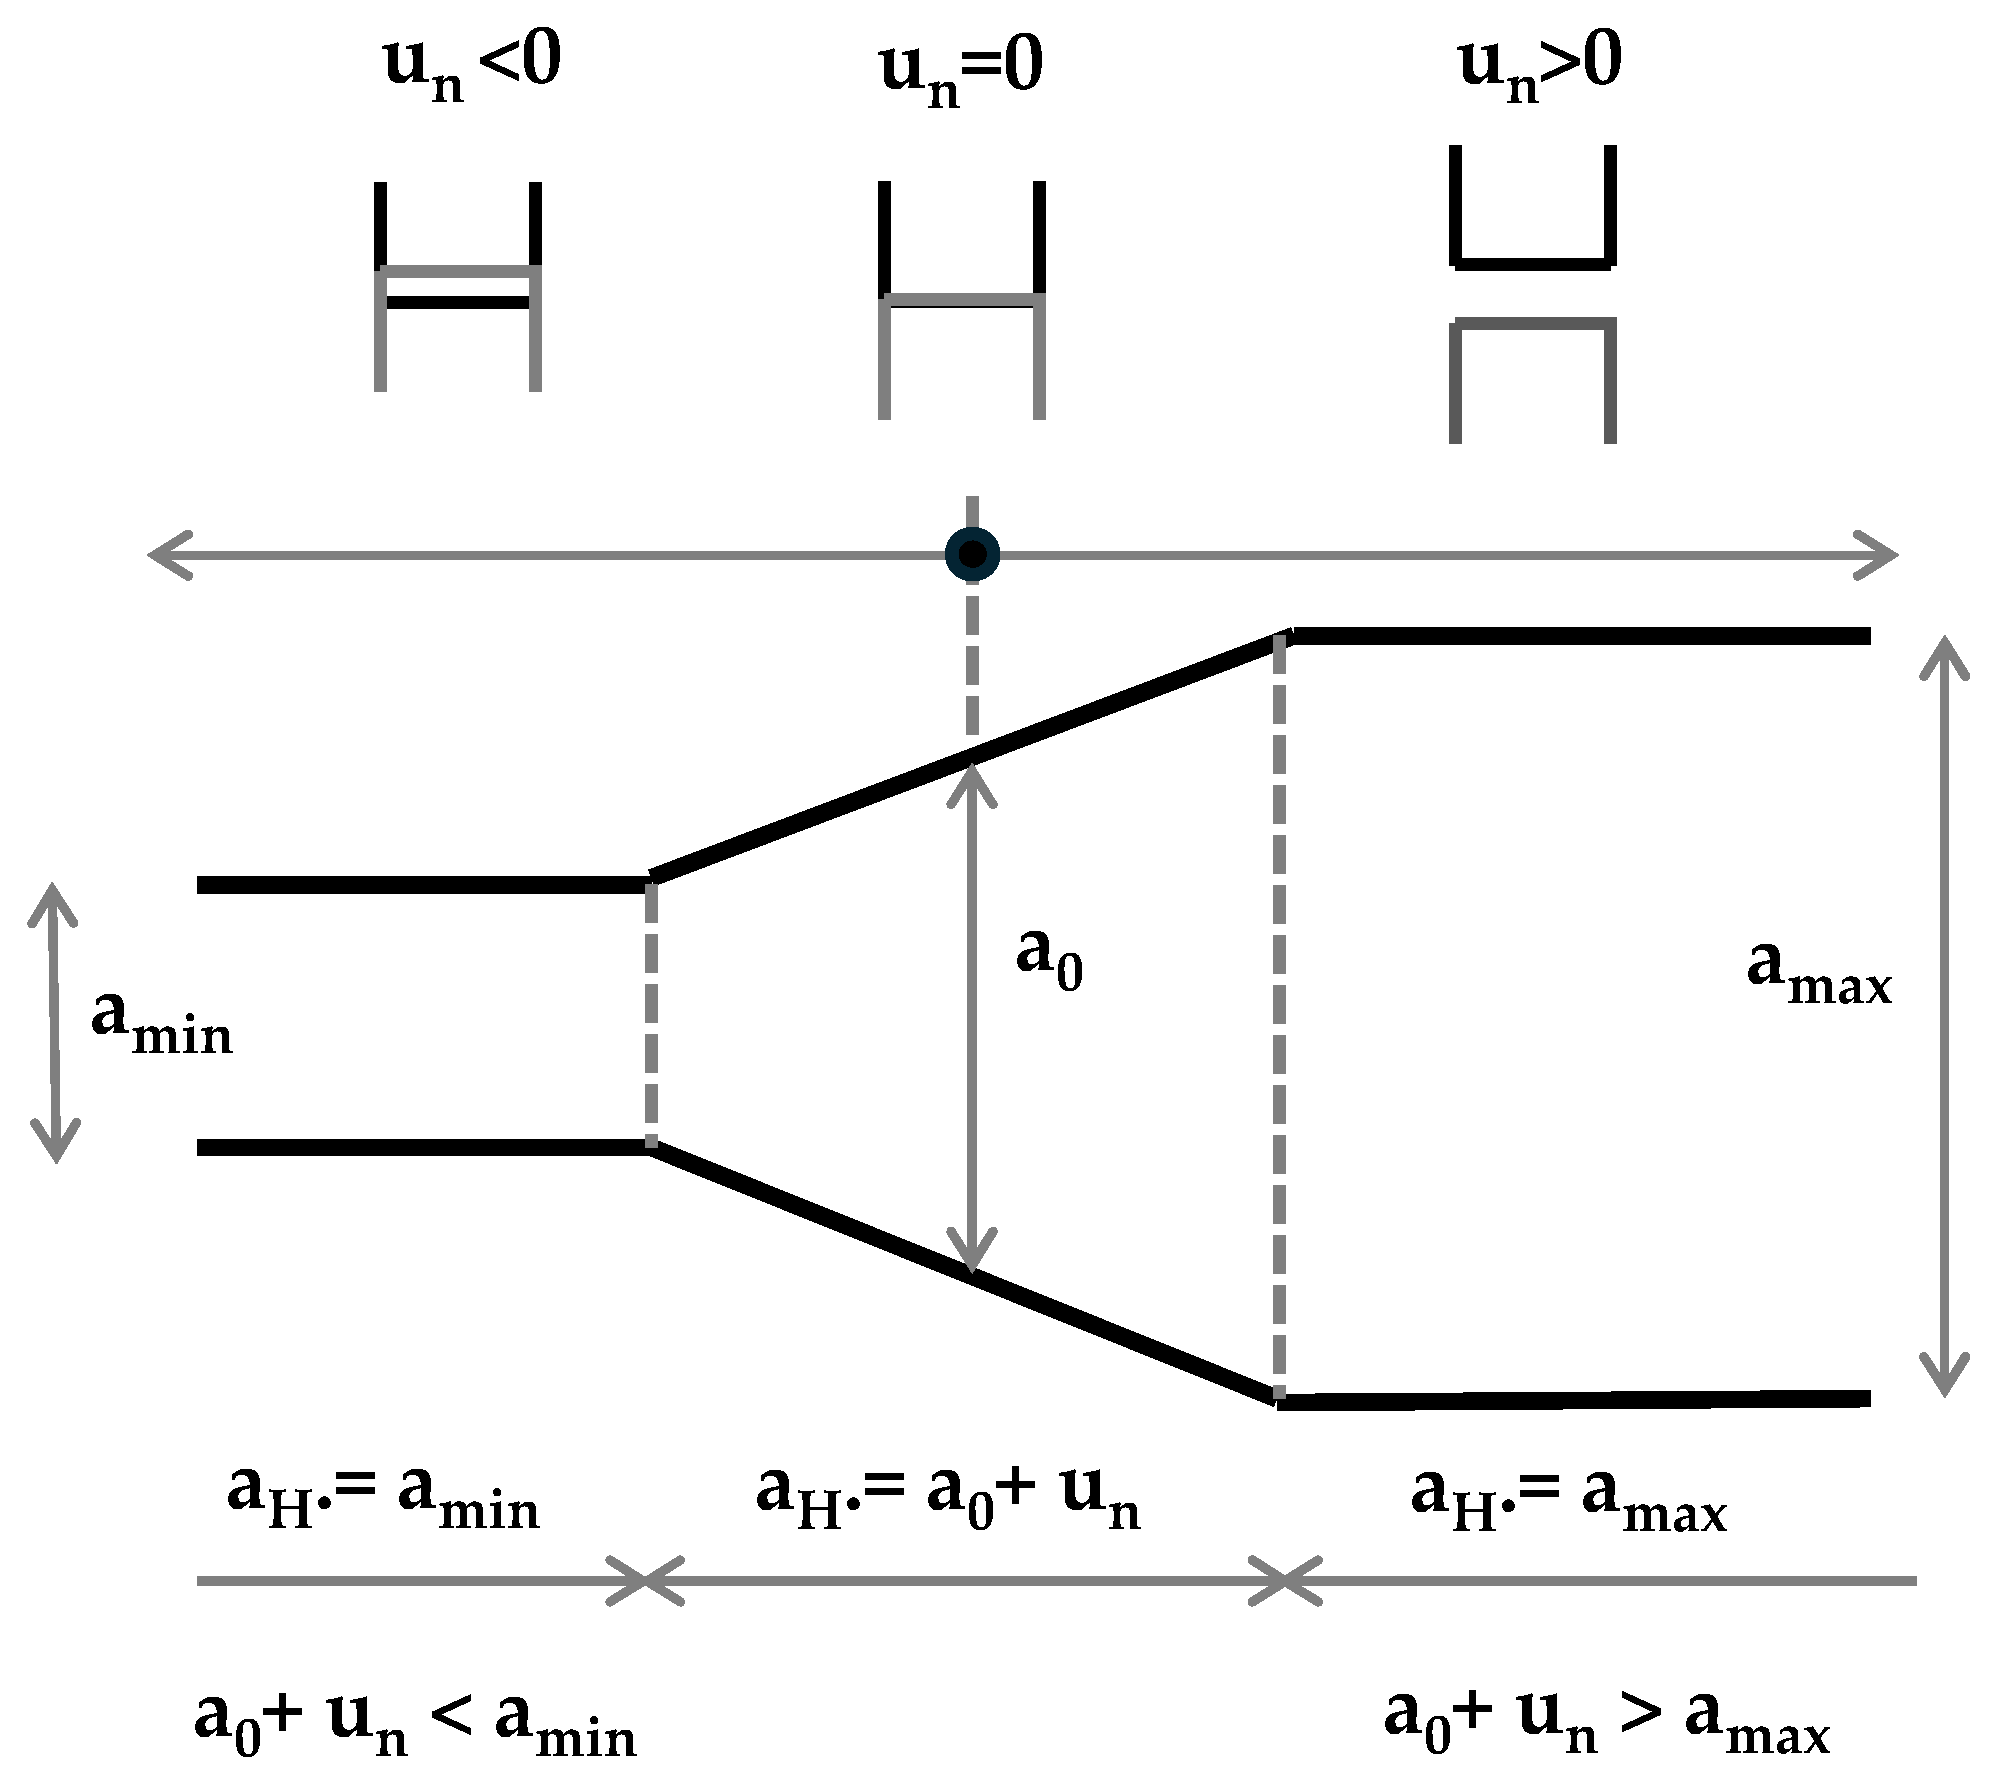
The hydraulic aperture of a given SC ( a h . S C ) is defined by the hydraulic aperture at nominal zero normal stress ( a 0 ) and the joint normal displacement ( u n ):
a h . S C =   a 0 +   u n
As schematically shown in Figure 2, a maximum joint aperture ( a m a x ) is imposed to prevent numerical convergence issues, while a minimum aperture ( a m i n ) is defined, below which further mechanical closure does not influence the contact permeability [39,48]. A 3D hydraulic model based on the same methodology has been proposed for dam foundation hydromechanical analysis [39] and for hydraulic fracture propagation [43]; in the latter, seepage triangular surfaces are adopted instead of cylindrical seepage channels.
At the HNs, a zero-permeability boundary condition can be applied, typically along the bottom and lateral faces of the foundation rock mass. Alternatively, prescribed pressure boundary conditions may be assigned to the HNs, commonly to define water pressures at the top of the foundation, both upstream and downstream of the dam, as well as at the nodes intersected by the drainage system.

2.3. Hydromechanical Coupling

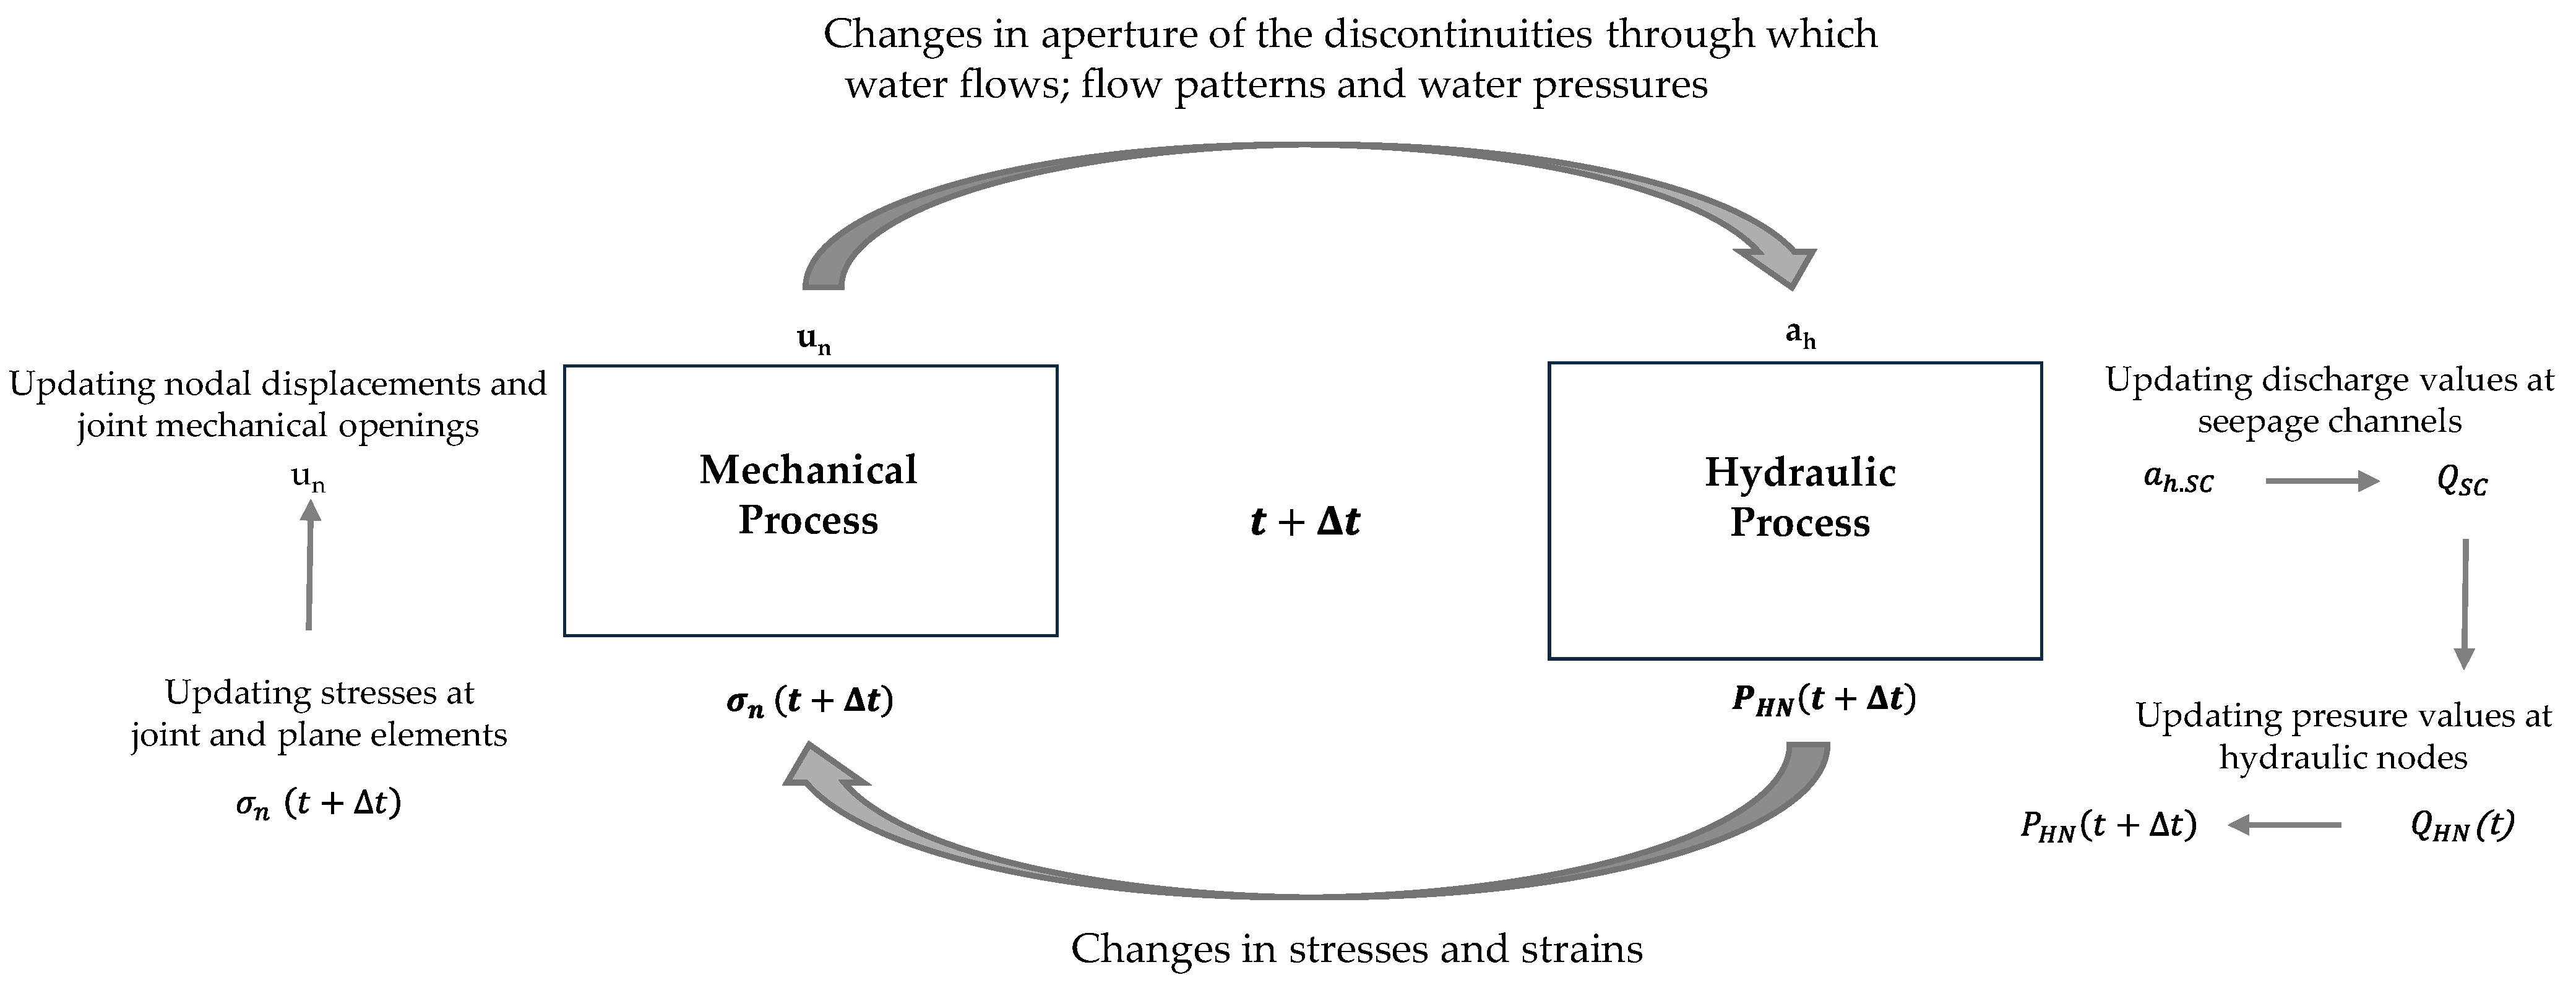
A simple sequential coupling scheme is employed, enabling the interaction between the mechanical and hydraulic models at each timestep, see Figure 3 [39]:
  • The mechanical model normal displacements that are defined at the JEs are transferred to the associated SCs, allowing the calculation of the hydraulic apertures in the hydraulic model;
  • The hydraulic model water pressures that are defined at the HNs are transferred to the mechanical model and considered in the calculation of internal forces in the associated JEs (effective stresses).
Given that an explicit solution algorithm based on the centred difference method is adopted, the hydraulic volumes associated with the HNs and the masses of the mechanical nodal points are scaled assuming a unitary timestep, ensuring numerical stability [39].

3. Objectives, Scope, and Limitations

In this study, Parmac2D-Fflow, an explicit numerical model that considers a sequential coupling between a mechanical and a hydraulic model, and incorporates the discrete nature of the foundation rock mass, as well as the effects of grout curtains and drainage systems, is applied to the hydromechanical parametric study of four gravity dams of different heights and to the hydromechanical analysis of an operating gravity dam.
The main objectives of the present research are as follows:
  • Evaluation of the influence of key parameters, which needs to be fully understood to enable the application of advanced hydromechanical modelling to operating dams for monitoring and safety assessment.
  • Demonstration that the proposed model can be effectively applied to the hydromechanical analysis of operating dams, provided that the suggested calibration methodology is followed.
  • Numerical assessment of scenarios involving progressive degradation of the concrete–rock interface and grout curtain permeability using the HM model, showing that such degradations can be readily detected through hydraulic measurements but are difficult to identify from dam displacement responses.
In order to assess the effect of key parameters, such as the orientation and spacing of discontinuities, foundation behaviour, dam height, as well as hydromechanical characteristics like joint stiffness, joint strength and hydraulic apertures that need to be better understood, four gravity dams of different heights (15 m, 30 m, 60 m and 120 m) are evaluated adopting two foundation fracture geometries and two different foundation behaviours.
The parametric study aims to clarify the dominant and secondary parameters that contribute to the overall hydromechanical behaviour. The parametric studies presented here also help to further understand how degradation scenarios, such as concrete–rock interface strength and grout curtain permeability, can be identified through hydraulic and mechanical measurements.
As shown in the parametric studies that are presented, the calibration of an HMM for dam safety control requires knowledge regarding the following subjects:
  • Dam and foundation mechanical parameters, constitutive behaviour, and possible degradations;
  • Dam and foundation geometries, including the consideration of the main foundation discontinuities;
  • Grout curtain and drainage system positions and conditions;
  • Recorded in situ drain discharges.
An example regarding an operating gravity dam is also presented, which shows that the hydromechanical model can be adopted in the control and safety assessment of operating dams if the proposed calibration methodology is followed.
Overall, it is intended to show that the adopted HM implementation can be used at the design stage, namely in the definition of the drainage system and grout curtain, and in the control and safety assessment of operating dams. The HM implementation can also be adopted to predict long-term performance under deterioration scenarios of both mechanical and hydraulic parameters.
In all numerical study cases, the discrete block foundation geometry was defined using UDEC (Universal Distinct Element Code) [48,59]. It was assumed that the joint permeability in the concrete area was zero, and thus, the seepage channels in the dam body are not represented.
The primary limitation of Parmac2D-Fflowcoupled fluid flow analysis lies in its 2D formulation. Since fluid flow in fractured rock masses is inherently three-dimensional (3D), restricting the analysis to 2D may lead to misleading results, as flow perpendicular to the model plane cannot be represented. However, for gravity dam foundations, groundwater flow is predominantly oriented in the upstream–downstream direction, making 2D analyses generally adequate in many practical applications.

4. Case Studies

4.1. Four Gravity Dams of Different Heights

4.1.1. Numerical Models and Geometry

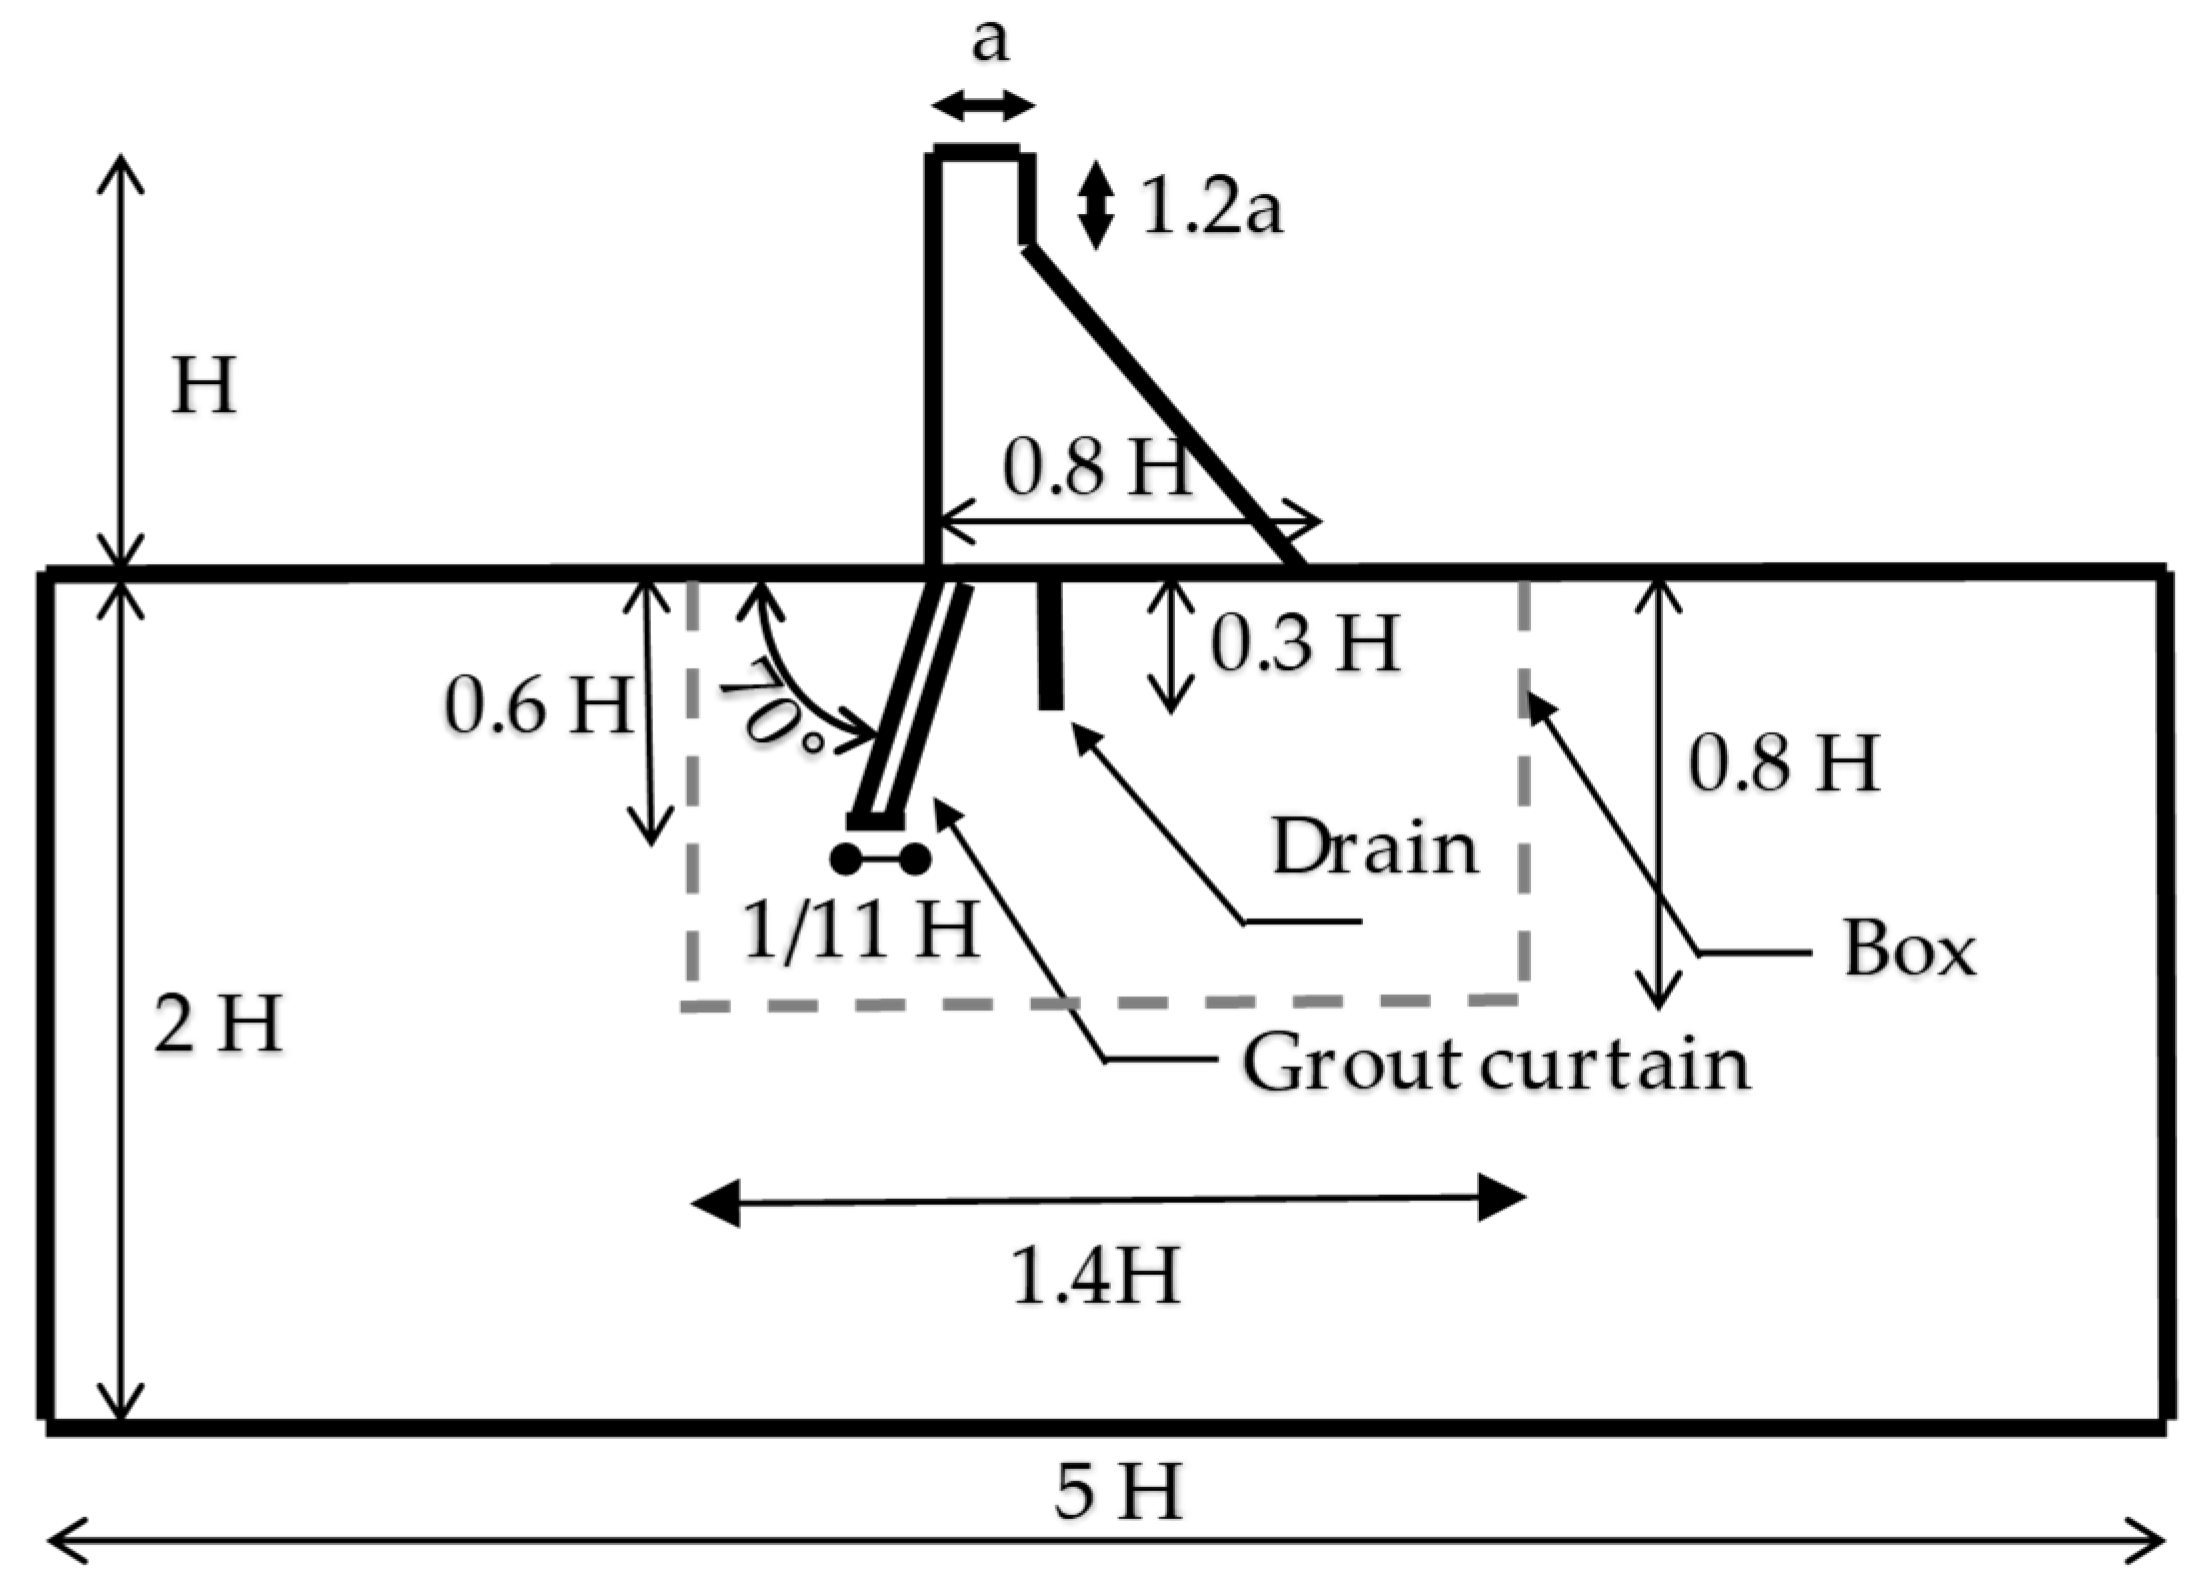
The model dimensions adopted in the four gravity dams of different heights parametric studies are shown in Figure 4. As shown, all the dimensions are defined relative to the adopted dam height (H) and crest thickness (a), see Table 1. The adopted dam cross-section geometry is consistent with the usual ratios that are defined as a function of the dam height. The grout curtain location and geometry, and the location of the seepage curtain were established following the guidelines applied in Portuguese dams. Also presented in Figure 4 is the box within which several statistics for the SCs and JEs are calculated, namely the minimum, mean, and maximum values throughout the loading process.
In the concrete dam, a series of continuous horizontal discontinuities was introduced, and the same number of blocks (15) was adopted independently of the dam height. These discontinuities were included in the model to allow potential failure mechanisms to develop within the dam body; it was not intended to represent the lift joints.
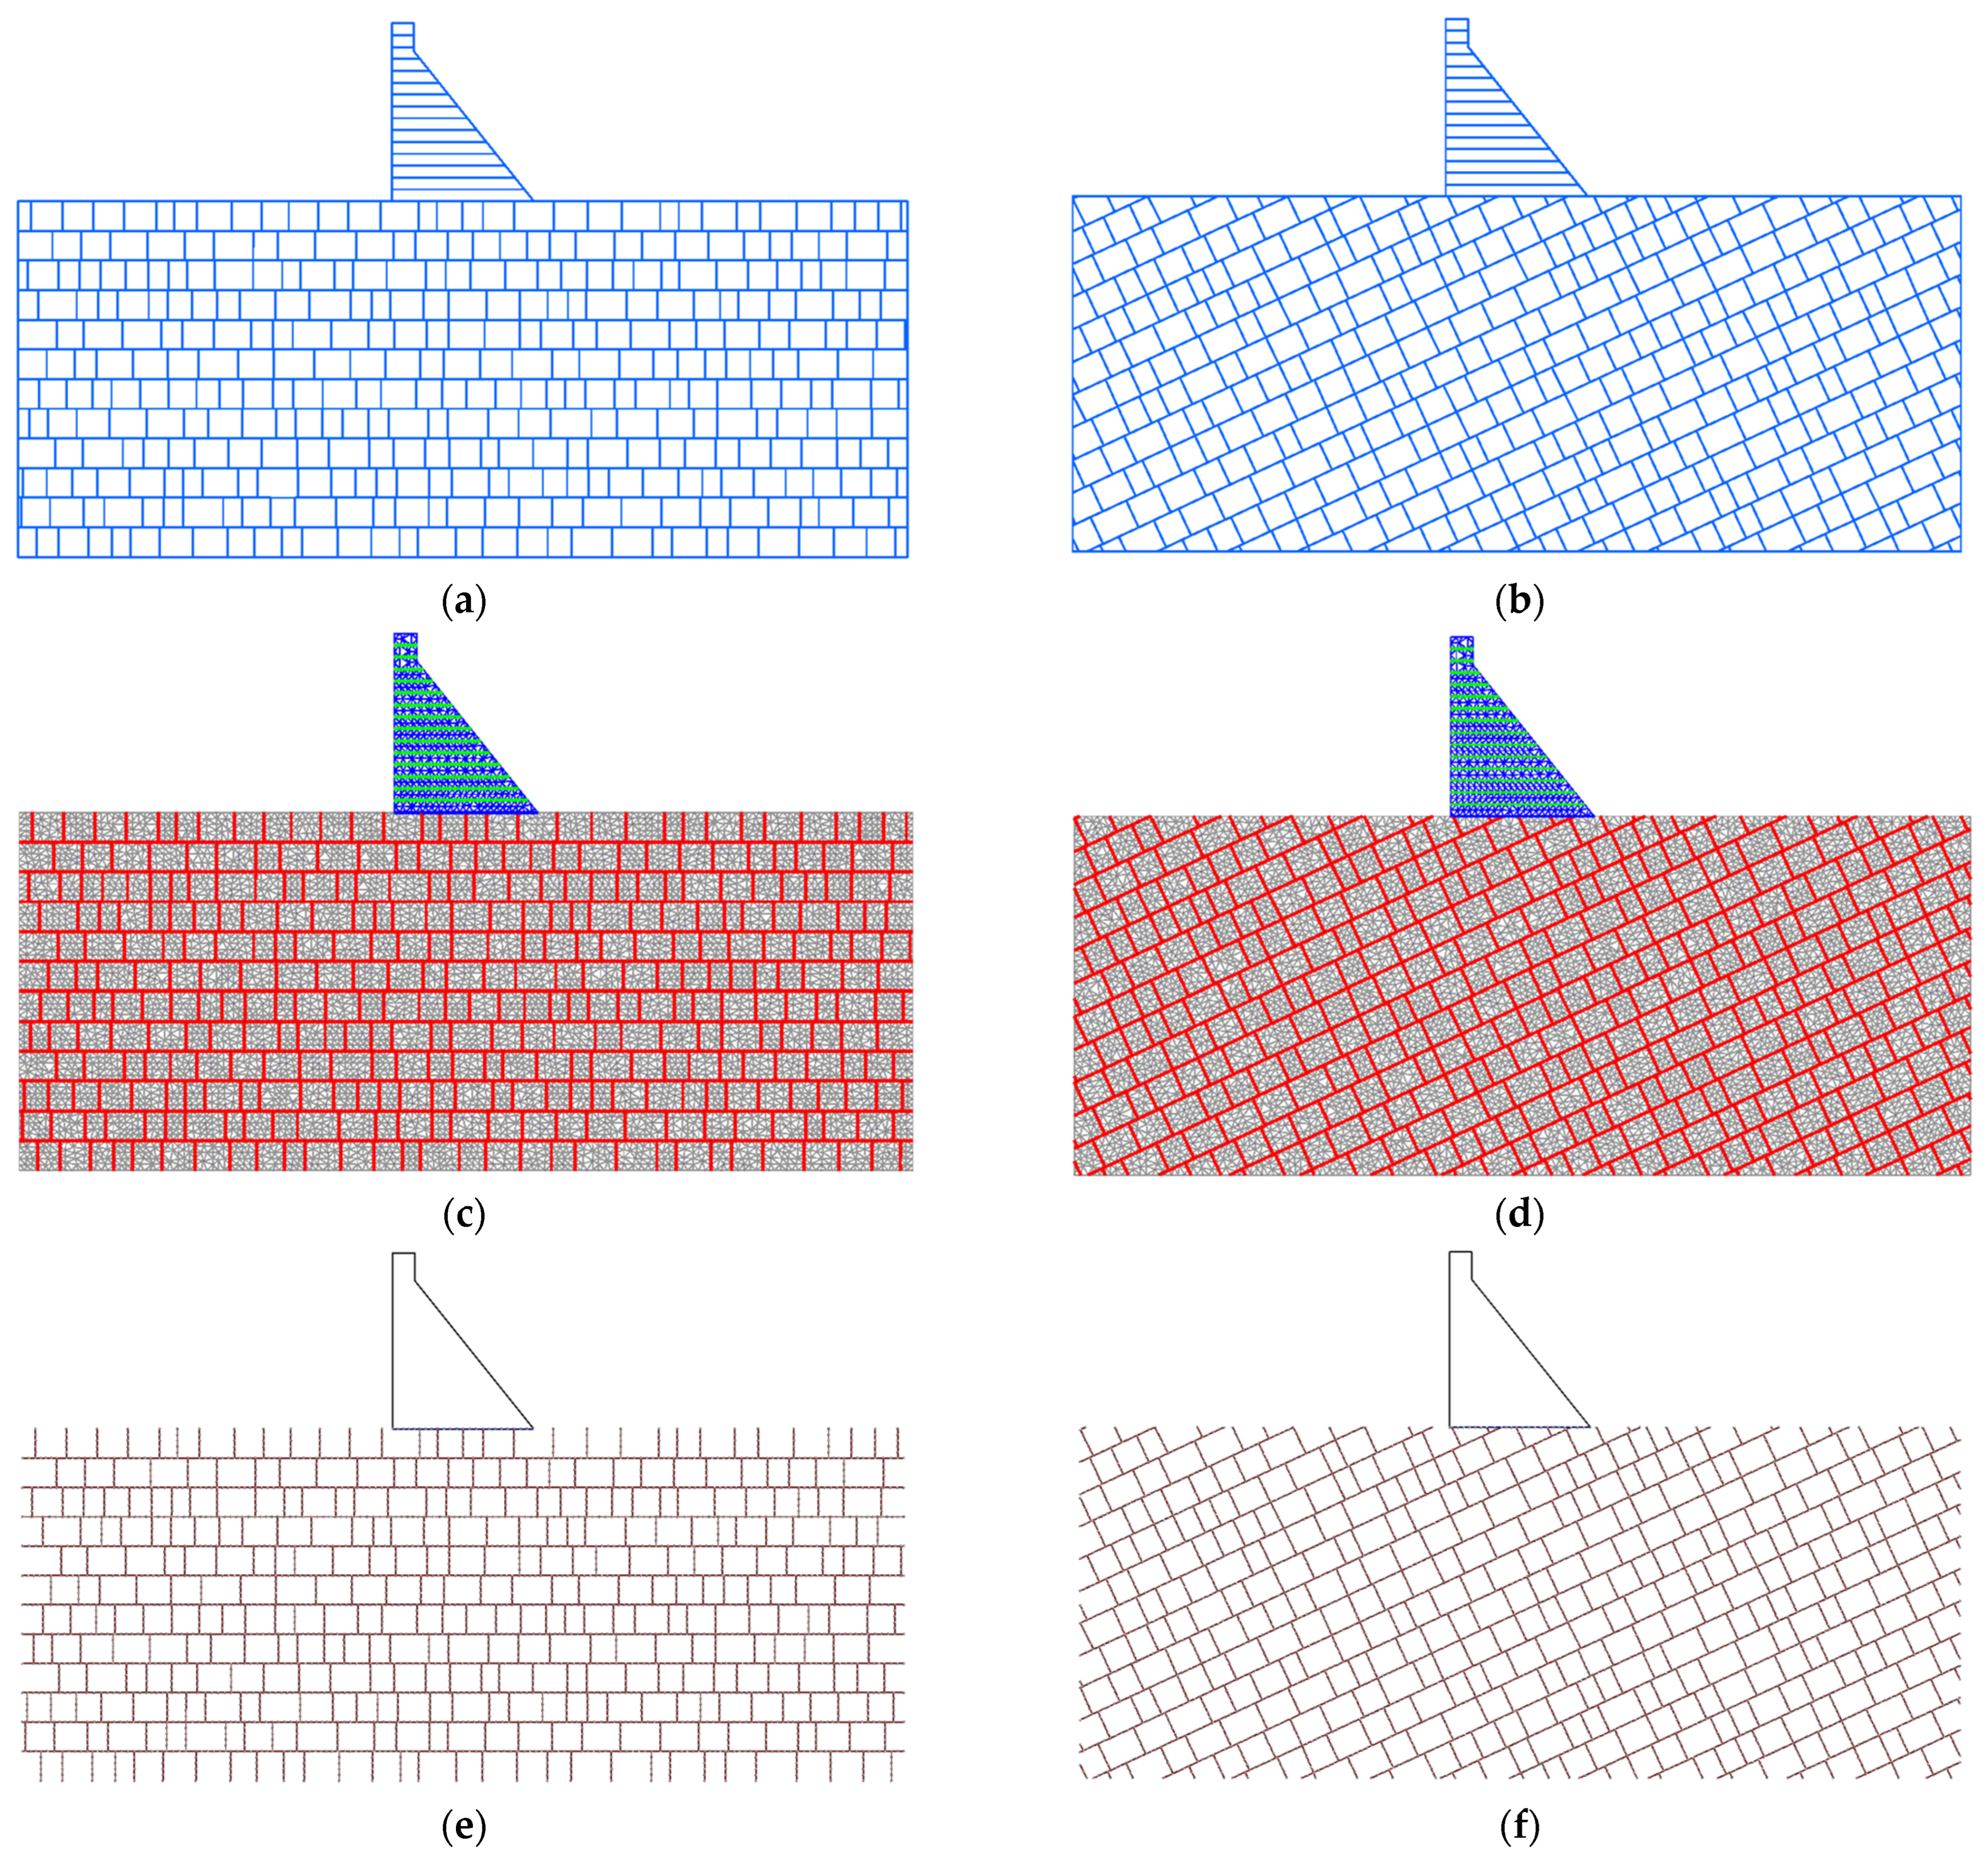
Regarding the dam foundation, two different discontinuity patterns were assumed (Figure 5), one with horizontal and vertical rock joints (models D15, D30, D60, and D120) and the other with inclined orthogonal discontinuities (models D15i, D30i, D60i, and D120i).
In the horizontal and vertical rock joint models (D15, D30, D60, and D120), the following families of discontinuities were adopted:
(i)
Continuous horizontal discontinuities with a spacing of 2.5 m in the 15 m high dam models, 5.0 m in the 30 m high dam models, 10.0 m in the 60 m high dam models, and 20.0 m in the 120 m high dam models.
(ii)
Vertical discontinuities with an average spacing of (a) 2.5 m and a standard deviation of 1.0 m in the 15 m high dam models; (b) 5.0 m and a standard deviation of 2.0 m in the 30 m high dam models; (c) 10.0 m and a standard deviation of 4.0 m in the 60 m high dam models; and (d) 20.0 m and a standard deviation of 8.0 m in the 120 m high dam models.
In the inclined orthogonal discontinuities models (D15i, D30i, D60i, and D120i), there are families of orthogonal discontinuities that make angles of 15° and 105° with the horizontal. The former family is continuous, and the latter is discontinuous. The spacing and standard deviation are similar to those adopted for the models with horizontal and vertical discontinuities.
Figure 5 shows the hydromechanical discontinuum model of the dam/foundation system for the 60 m high dams, namely the adopted discrete blocks, the mechanical model with the triangular plane finite elements adopted in the discretization of each block along with the joint finite elements adopted for the blocks interaction and the hydraulic model with seepage channels and hydraulic nodes built on top of the hydraulic model. Table 2 shows the number of mechanical and hydraulic elements used in the eight dam/foundation models. The average edge length of the triangular elements was set to the following:
  • 0.5 m in the 15 m high concrete dam models (D15 and D15i);
  • 1.0 m in the 30 m high concrete dam models (D30 and D30i);
  • 2.0 m in the 60 m high concrete dam models (D60 and D60i);
  • 4.0 m in the 120 m high concrete dam models (D120 and D120i).

4.1.2. Model Parameters

The concrete and rock foundation properties defined in the experimental study carried out in [15], see Table 3, are adopted for the dam concrete and rock mass block. In both materials, a linear elastic behaviour is assumed.
Table 3b presents the adopted interface elastic and strength contact model parameters for the reference properties. The concrete–concrete and concrete–rock interface behaviours are represented using a bilinear softening law [52]. When a nonlinear foundation model is adopted, a zero tensile strength, a zero cohesion, and a friction coefficient of 1.0 are assumed for the rock–rock interfaces.
The normal stiffness values were defined assuming a fictitious joint thickness of 0.50 m and a normal-to-shear stiffness ratio of 0.4. These values fall within the typical ranges adopted for discrete dam–foundation systems modelling [48,52,59].
The tensile strength ( σ t ) and the fracture energy ( G I ) adopted for the concrete–concrete interface are based on the experimental data defined for concrete in [15]. For the concrete–rock interface, the tensile strength ( σ t ) and the fracture energy in mode I ( G I ) adopted correspond to the properties presented in [15] for specimen TPB 5-5.
For both the concrete–concrete and the concrete–rock interfaces, the cohesive stress ( C m a x ) and the fracture energy mode II ( G I I ) were defined using the following relationships: C m a x = 2.0   σ t and G I = 5.0   G I I . The adopted values are within the range of values usually adopted for BL contact models representing concrete and rock material [52]. As an example in [60,61], a factor of 1.75 is adopted for the cohesive stress, and a factor of 2.0 is adopted for the fracture energy in mode II. A friction angle of 1.0 is adopted for both interfaces, which falls within the range of commonly used values.
In the reference model, a joint aperture at nominal zero normal stress of a 0 = 0.1668 mm, a residual aperture of a r e s = 1 3   a 0 m, and a maximum hydraulic aperture of a m a x = 5   a 0 were used for the SCs [39]. The permeability of the dam–foundation interface was taken as half that of the foundation discontinuities. The grout curtain was assumed to be 10 times less permeable than the surrounding rock mass.
Similar properties were adopted in a recent study that evaluated the stability safety assessment of concrete gravity dams for overtopping scenarios [51].

4.1.3. Hydromechanical Model Boundary Conditions and Analysis Sequence

For the four gravity dams case study, the mechanical boundary conditions include fixed displacements at the base of the model and restricted horizontal movement along the lateral boundaries of the dam foundation. For the hydraulic boundary conditions, zero permeability was assumed along the base and sides of the foundation, see Figure 1 and Figure 5. Additionally, a water pressure equivalent to one-third of the hydraulic head upstream from the dam was applied along the drain axis.
The mechanical effect of gravity loads with an empty reservoir is initially applied to the model. Subsequently, a hydromechanical analysis is carried out, applying successive increments of water head at the reservoir bottom and of hydrostatic pressure at the upstream face of the dam to simulate the rising of water in the reservoir, followed by a gradual lowering of the water level until the reservoir is emptied.
For each dam model, two different foundation behaviours are assessed: an elastic model (E) and a nonlinear brittle model (NL), following the properties presented in Table 3 for the rock–rock contacts.

4.2. Pedrógão Dam

4.2.1. Numerical Model and Geometry

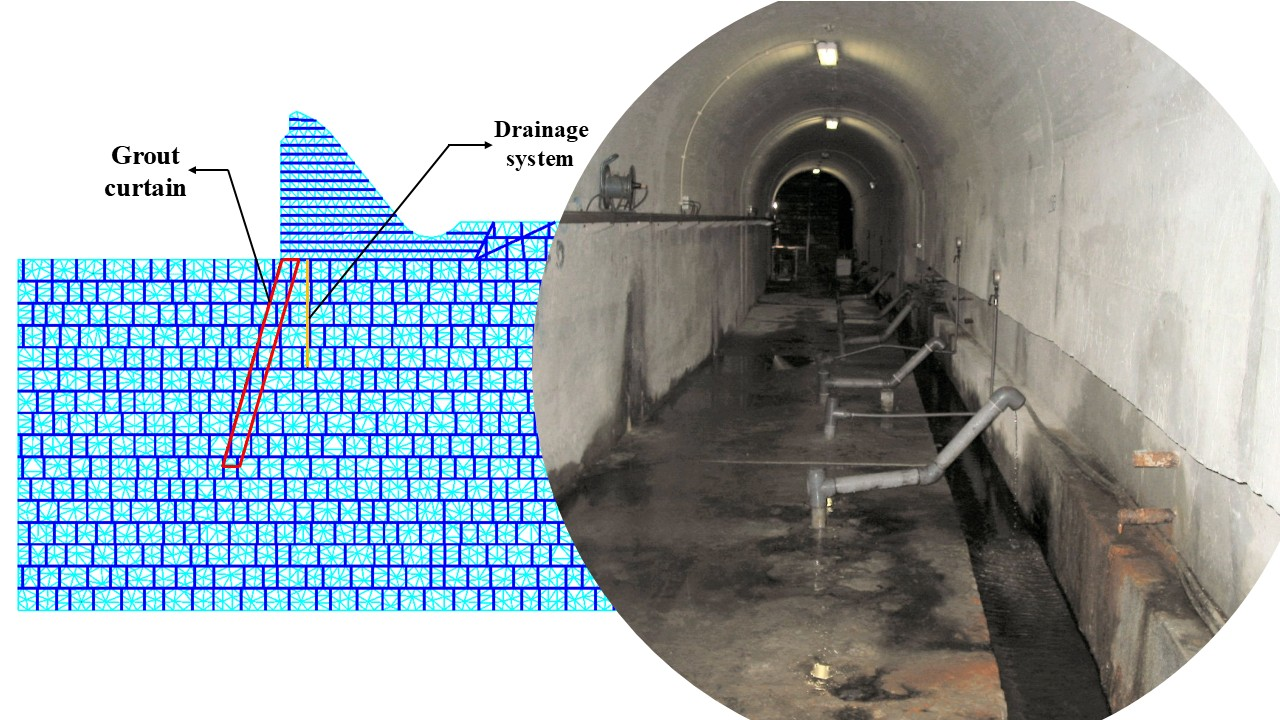
Pedrógão dam is located on the River Guadiana, in the southeast of Portugal, and is part of a multipurpose development designed for irrigation, energy production, and water supply. It is a straight gravity structure with a maximum height of 43 m and an overall crest length of 448 m (125 m constructed in conventional concrete and the remaining 323 m utilizes roller-compacted concrete (RCC)). The dam/foundation interface is at elevation 51.0 m, and the dam features an uncontrolled spillway extending 301 m, with the crest at elevation 84.8 m. The spillway is divided into ten spans, each 28.75 m wide, separated by nine pillars that support a prefabricated access walkway. A drainage gallery runs within the dam body, with floor elevations at 54.0 m and 61.0 m. The spillway crest is at the retention water level, and the maximum reservoir water level reaches an elevation of 91.8 m.
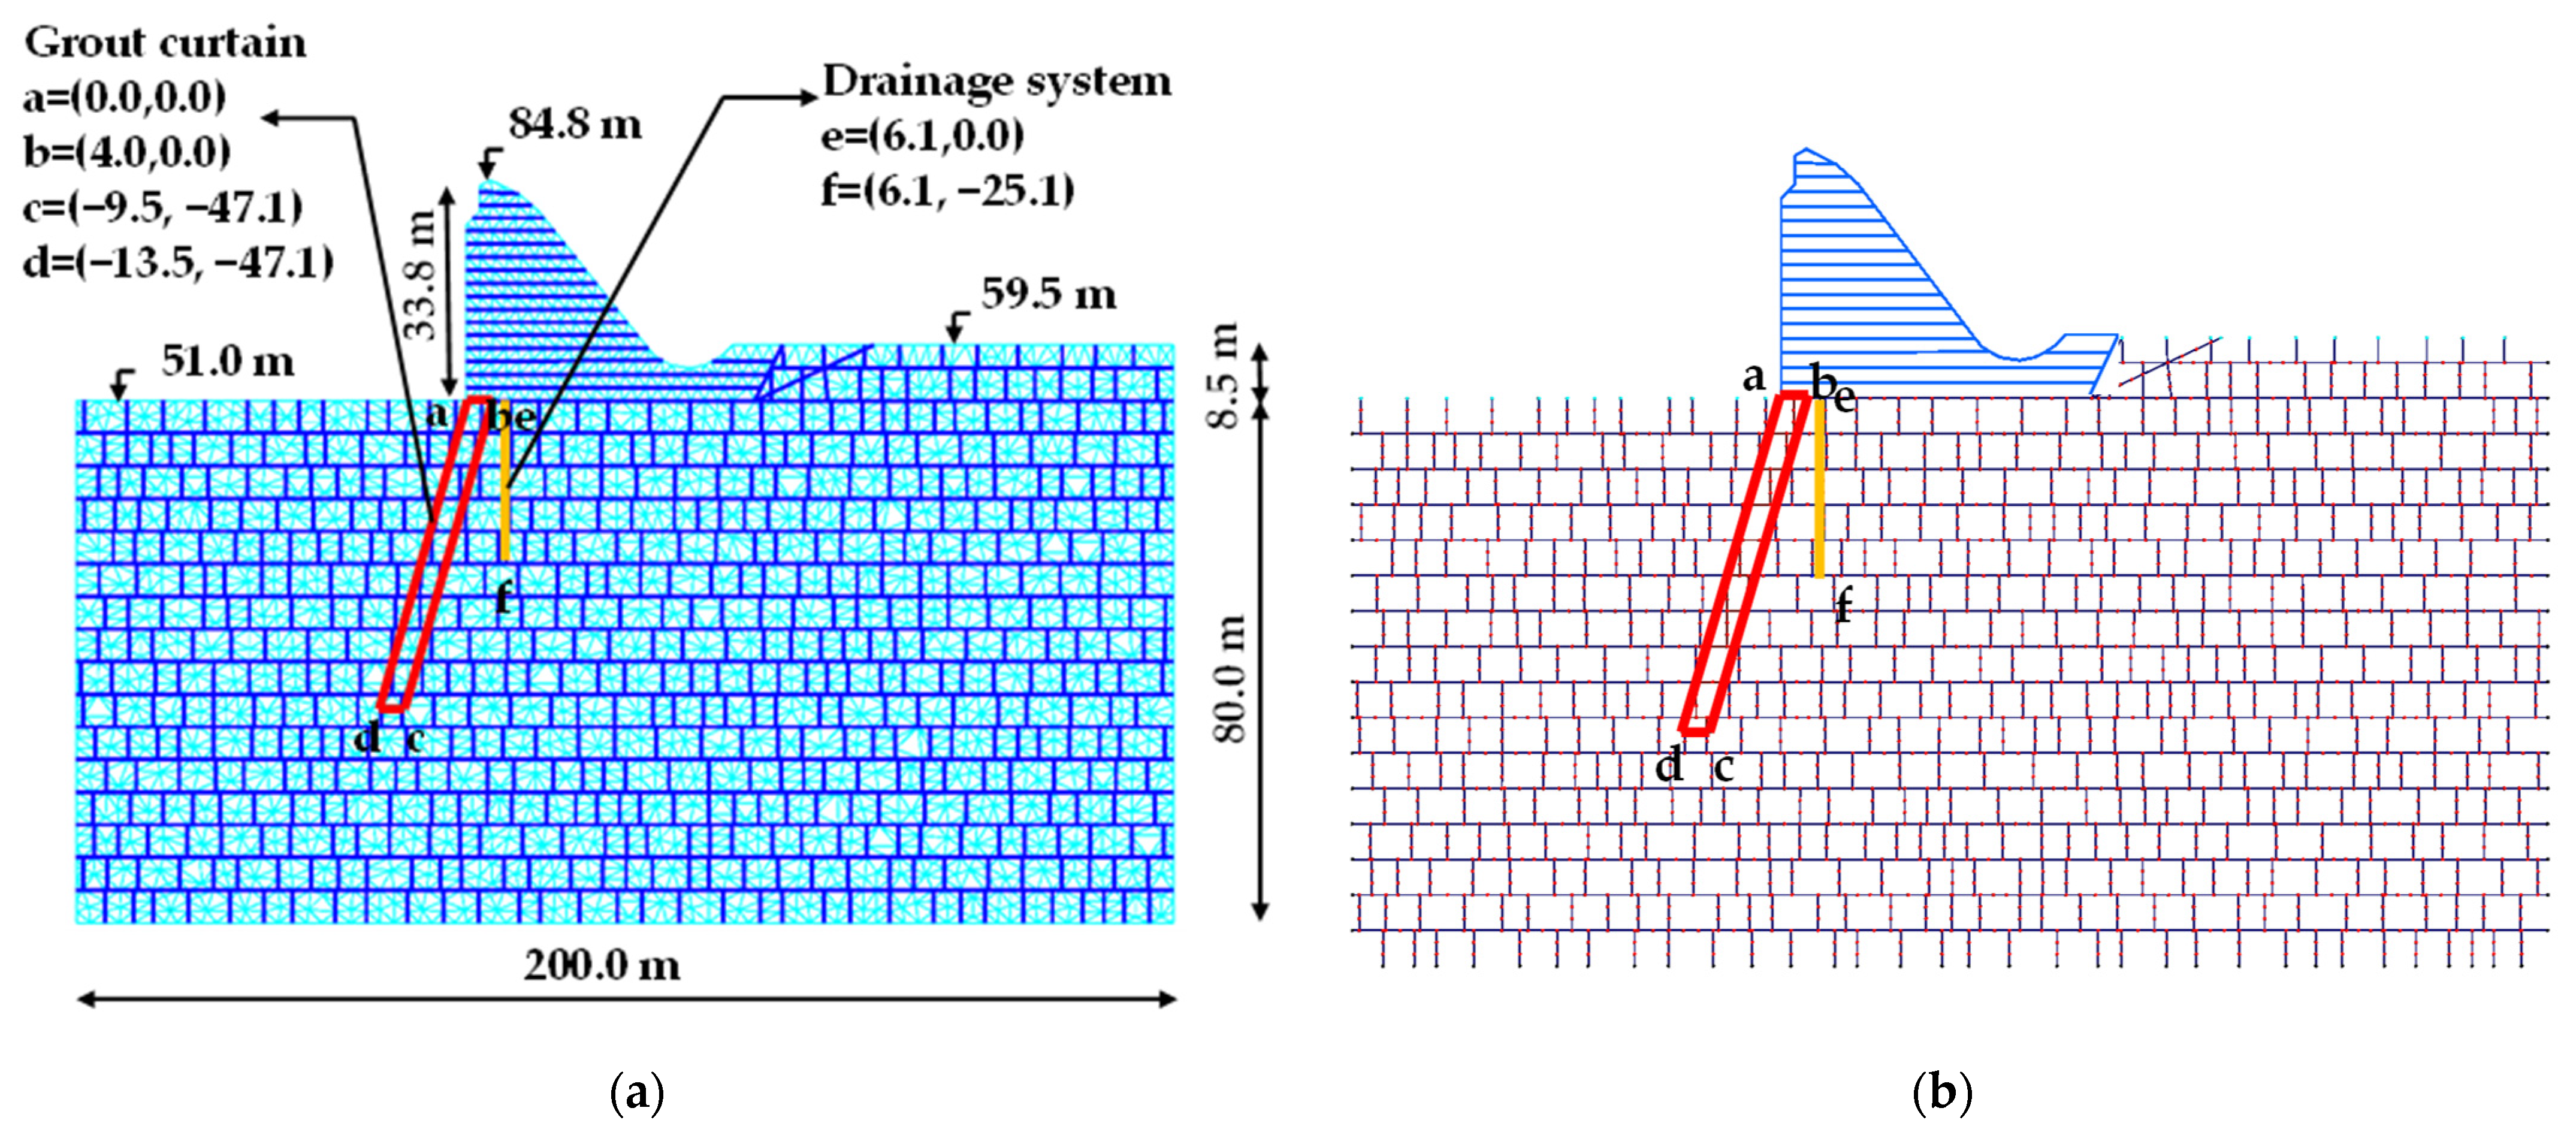
The hydromechanical discontinuum model shown in Figure 6 was used to compare the calculated discharges in the dam block with the highest dam discharges to those recorded in situ on a specific date, with the reservoir at level 80.67 m and the downstream level at 60.43 m. The average discharge in the dam block under analysis was 2.43 × 10⁻⁵ (m3/s)/m, and the average value of the hydraulic head recorded on that date and on that dam block was 64.12 m.
Although five discontinuity sets were identified at the dam site, the numerical model incorporates only two for simplicity, see Figure 6. The first consists of continuous, horizontally oriented joints spaced at 5.0 m intervals. The second comprises vertical cross-joints with an average spacing of 5.0 m, measured normal to the joint traces, and a standard deviation of 2.0 m. In addition, a downstream rock mass joint dipping 25° towards upstream was included in the model.
In the analyzed cross-section, the crest of the uncontrolled spillway is located 33.8 m above the ground surface, and the horizontal part of the dam base is 44.4 m long in the upstream–downstream direction. Within the concrete body, a series of continuous horizontal discontinuities spaced 2.0 m apart was introduced to represent the lift joints.
Figure 6a shows the division into triangular plane finite elements of each foundation and concrete block, and the corresponding joint interface finite elements. Figure 6b shows the hydraulic model. The hydromechanical model has 612 deformable blocks, 18 blocks representing the dam, and 594 blocks representing the foundation. The blocks are divided into 6683 triangular plane finite elements, with 7291 nodal points. The block interaction is represented by 3199 joint finite elements. Figure 6b shows the adopted hydraulic model with 2513 hydraulic nodes and 3017 seepage channels.

4.2.2. Model Parameters

For the dam concrete, a Young’s modulus of 30.0 GPa, a Poisson’s coefficient of 0.20, and a density of 2400 kN/m3 were adopted. For the foundation rock mass, a Young’s modulus of 10.0 GPa, a Poisson’s coefficient of 0.20, and a density of 2650 kN/m3 were adopted.
Regarding the joint plane finite elements stiffness (concrete–concrete, concrete–rock, and rock–rock), two different hypotheses were considered. In hypothesis 1, a normal stiffness value of 10 GPa/m and a normal shear stiffness value of 5 GPa/m were adopted, and in hypothesis 2, a normal stiffness value of 100 GPa/m and a normal shear stiffness value of 50 GPa/m were adopted. The concrete–concrete, concrete–rock, and rock–rock strength interface properties are the same as those adopted in the case study of four gravity dams.
The hydraulic aperture at nominal zero normal stress ( a 0 ) is defined through a calibration procedure for a given set of mechanical parameters, continuum and interface parameters, and foundation behaviours, elastic and brittle, for the numerical model to predict the recorded in situ value. A residual aperture of a r e s = 1 3   a 0 m, and a maximum hydraulic aperture of a m a x = 5   a 0 were used for the SCs [39].

4.2.3. Hydromechanical Model Boundary Conditions and Analysis Sequence

The mechanical boundary conditions include fixed displacements at the base of the model and restricted horizontal movement along the lateral boundaries of the dam foundation. For the hydraulic boundary conditions, zero permeability was assumed along the base and sides of the foundation, see Figure 6. Additionally, a water pressure equivalent to the average value of the hydraulic head recorded (64.12 m) was applied along the drain axis.
The mechanical effect of gravity loads with an empty reservoir is initially applied to the model, following a hydromechanical analysis, carried out by applying the water head at the reservoir bottom and the hydrostatic pressure at the upstream face of the dam to simulate the adopted upstream water level. The downstream water level is also considered in the downstream bottom mechanical pressure and in the hydraulic model.

5. Results and Discussion

5.1. Four Gravity Dams of Different Heights

5.1.1. Reference Hydromechanical Properties

The numerical simulations presented in this section were conducted using the mechanical and hydraulic properties presented in Section 4.2, reference hydromechanical properties, assuming either an elastic or a nonlinear brittle behaviour of the dam foundation.
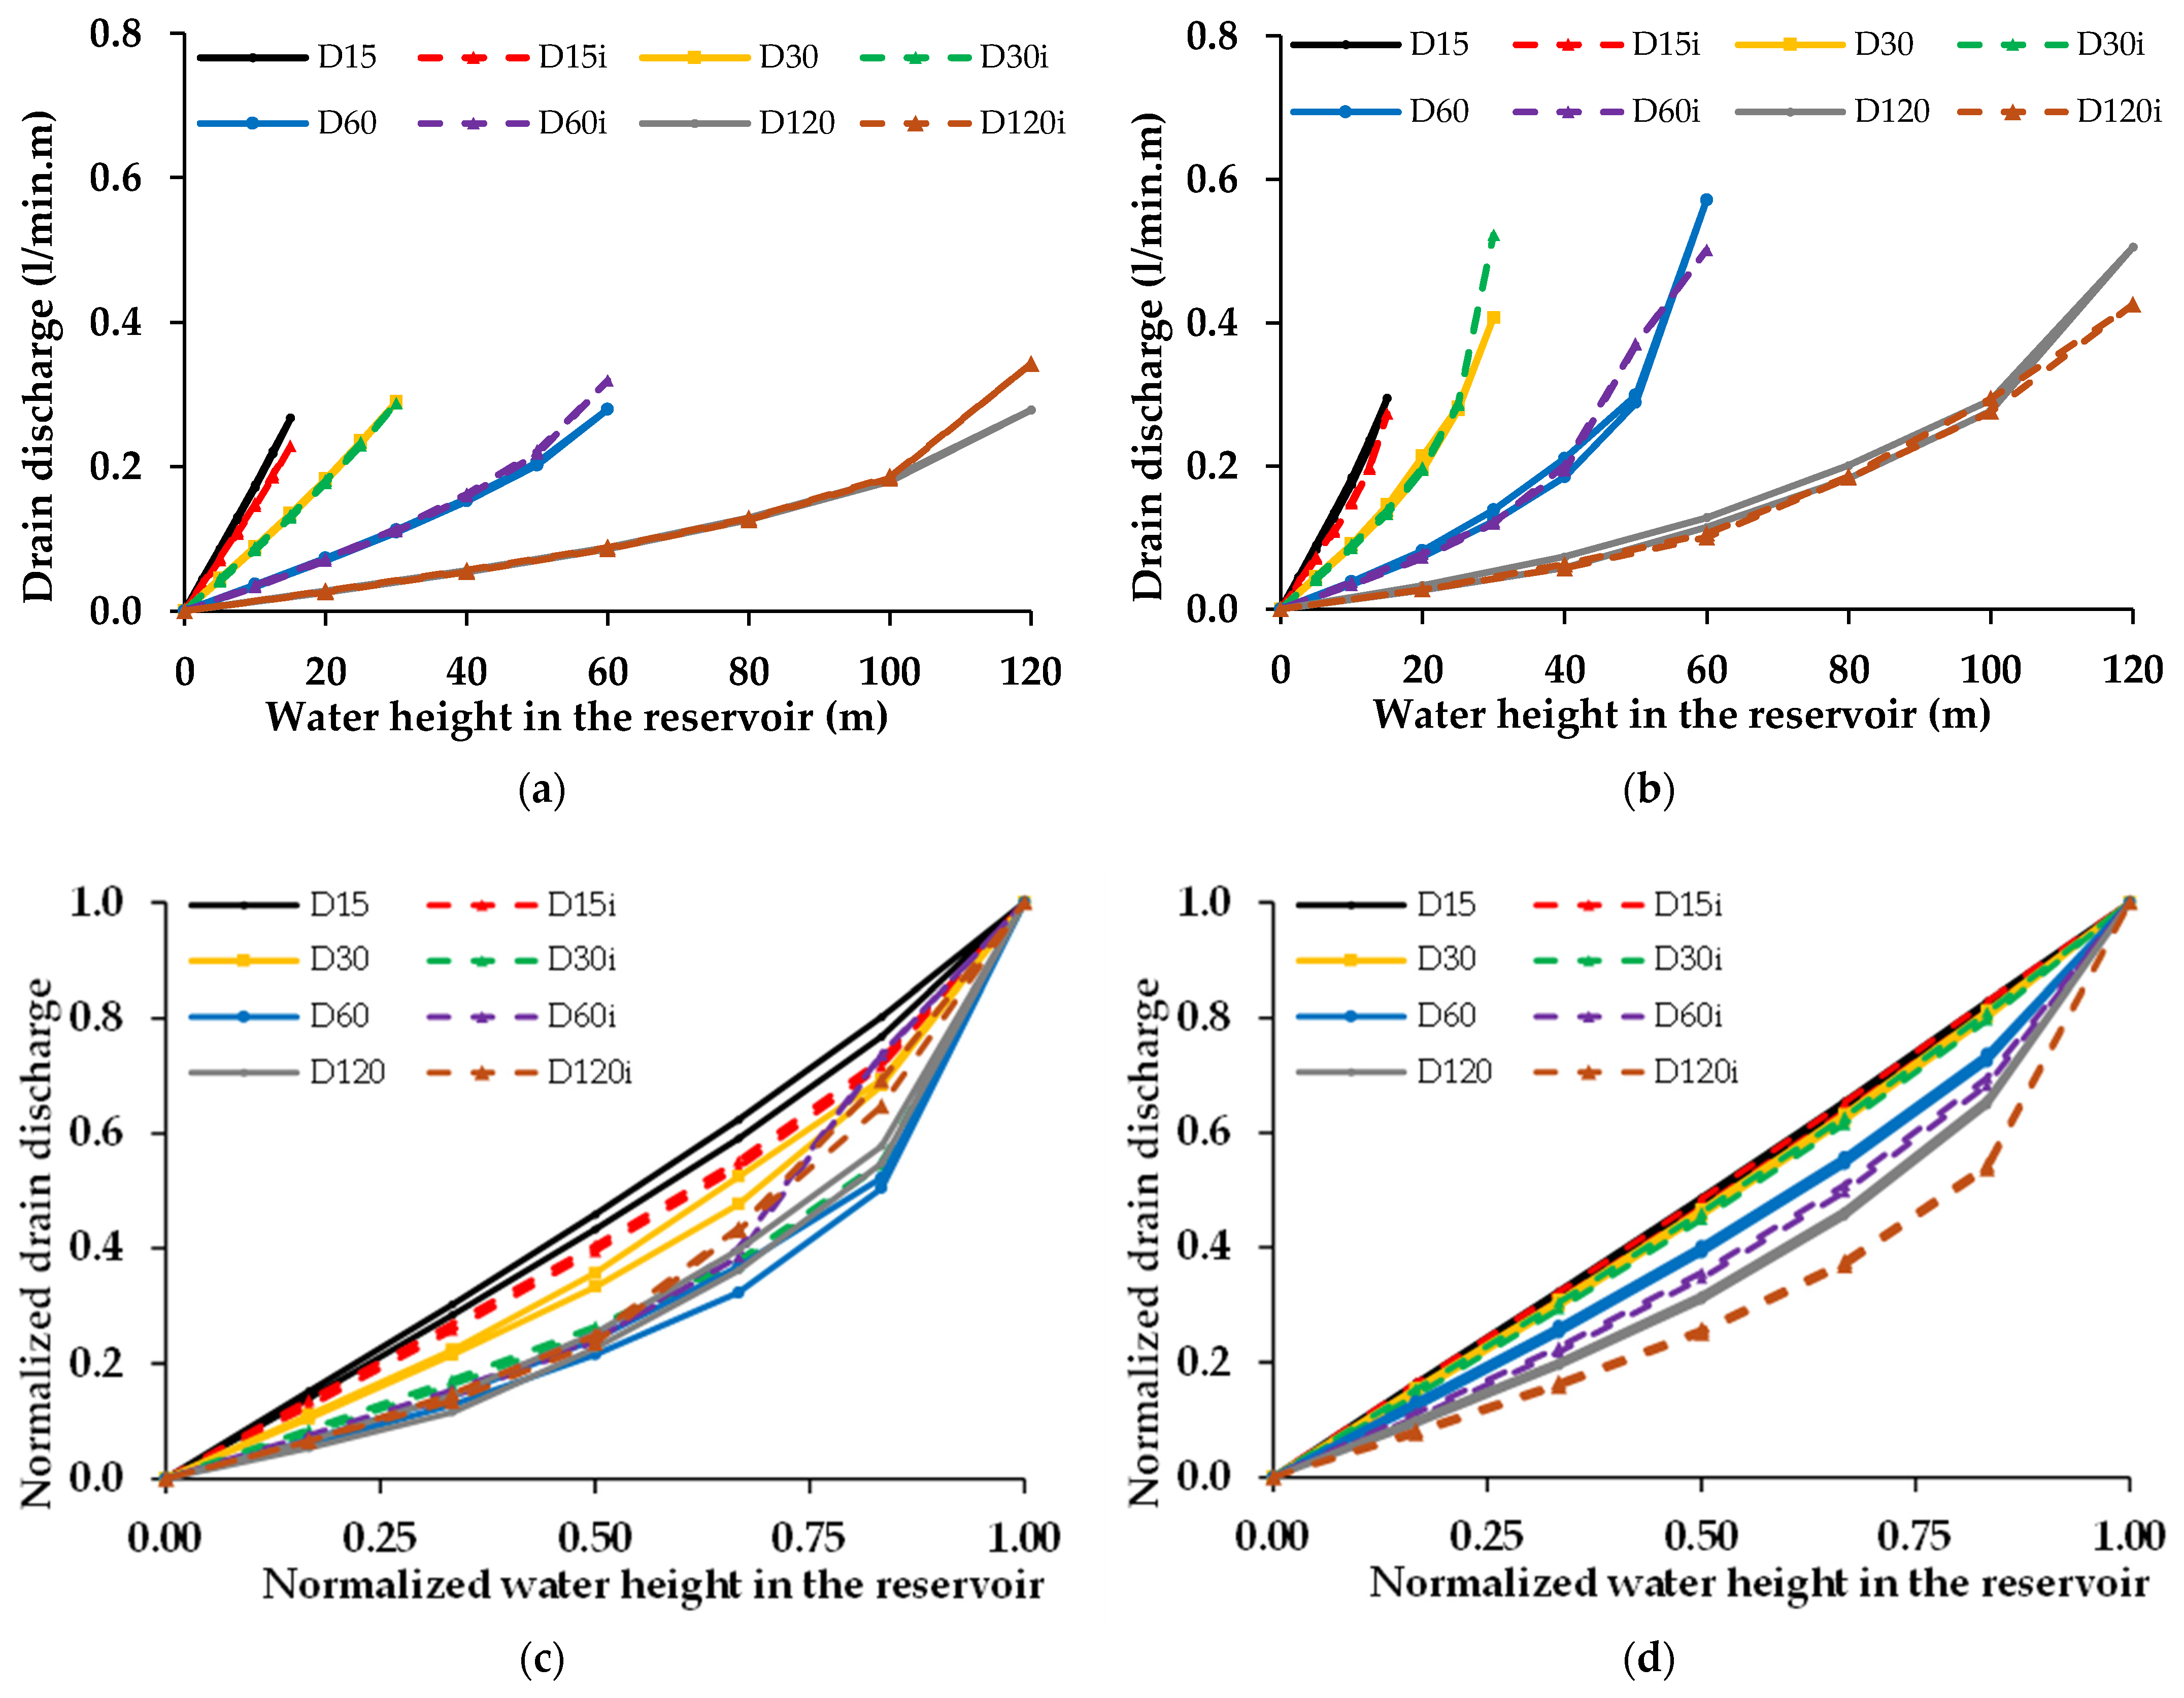
The flow rates through the dam foundation drainage system, calculated using the coupled hydromechanical analyses of the four models with horizontal and vertical rock joints (D15, D30, D60, and D120) and of the four models with inclined orthogonal discontinuities (D15i, D30i, D36i, and D120i), are shown in Figure 7. Table 4 shows the maximum drain discharge values for each numerical model; also presented are the corresponding percentages of increase in drain discharge in the nonlinear foundation behaviour compared with those obtained with an elastic foundation.
As shown in Figure 7, for the elastic foundation model, the drain discharges measured during reservoir filling are very similar to the discharges measured during the emptying phase. The same occurs for a nonlinear brittle foundation when a horizontal and vertical rock joint model is adopted, whereas for the inclined orthogonal discontinuities, dam models, the differences in measured drain discharges are more noticeable, especially for the higher dams (D60i and D120i).
As shown in Figure 7a, for an elastic foundation behaviour, the measured discharges in the regular joint models (D) and in the inclined joint foundation models (Di) are very similar for all dam heights, except for the 60 m and 120 m high dams. For the latter dam models, the discharges are similar up to the reservoir water level, which causes cracking at the dam vicinity of the heel, which causes a sudden increase in the measured discharge. For the nonlinear foundation behaviour, Figure 7b, the change in the calculated drain discharges between the regular joint model (D) and the inclined joint foundation model (Di) is more noticeable when compared with the values predicted with an elastic foundation. For the nonlinear foundations and models with a dam height above 15 m, cracking occurs, usually in the last reservoir water level increment just before the maximum reservoir water level is reached. Like in the elastic model, cracking at the dam heel causes an increase in the measured discharges. It is also interesting to note that this increase in the predicted drain discharges due to cracking in the vicinity of the dam heel is only noticed at water levels close to the maximum water level value; as for the lowest water levels, the predicted drain discharges are similar during the filling and emptying procedure.
In Figure 7c,d, the drain discharges and the dam height are normalized to the maximum values. It is shown that dam height influences the measured hydraulic response for both foundation behaviours, being more noticeable under an elastic foundation. As shown, as the dam height increases, the relationship of the obtained normalized drain discharges to the normalized water level tends to have a higher curvature. In this representation, it is also clear that the effect of cracking in the vicinity causes a change in the drain discharges to the water level, leading to a clear inflexion in the predicted curve. The effect of the dam height on the hydromechanical response is mostly relevant to the development of an accurate separation of effects model (SEM) for the safety control of operating dams. For higher dam heights, the applied hydrostatic pressure in the mechanical and in the hydraulic model is much higher, favouring cracking at the dam–foundation interface, particularly at the dam heel. These cracked interfaces increase nonlinearity not only in the mechanical model but also in the hydraulic measurements. If a BL contact model similar to that used in the concrete–rock interface were adopted for the rock–rock interfaces, an even stronger nonlinear behaviour would be expected with an increase in the dams’ height because higher pressure would lead to real cracks in the vicinity of the dam–foundation interface.
As shown in Table 4, when assuming a nonlinear brittle foundation, behaviour drain discharges under full reservoir conditions are higher than those obtained with an elastic foundation. This increase in drain discharges is more pronounced for higher dams; the main exceptions are the D60i, D120i, and D120 models. The increase in drain discharges in these models does not follow the expected proportionality because under an elastic foundation, the cracking in the vicinity of the dam heel has a higher extension than that predicted under a nonlinear foundation hypothesis.
The results presented highlight the impact of the foundation behaviour, the dam height, and the rock–concrete interface properties on the HM response.
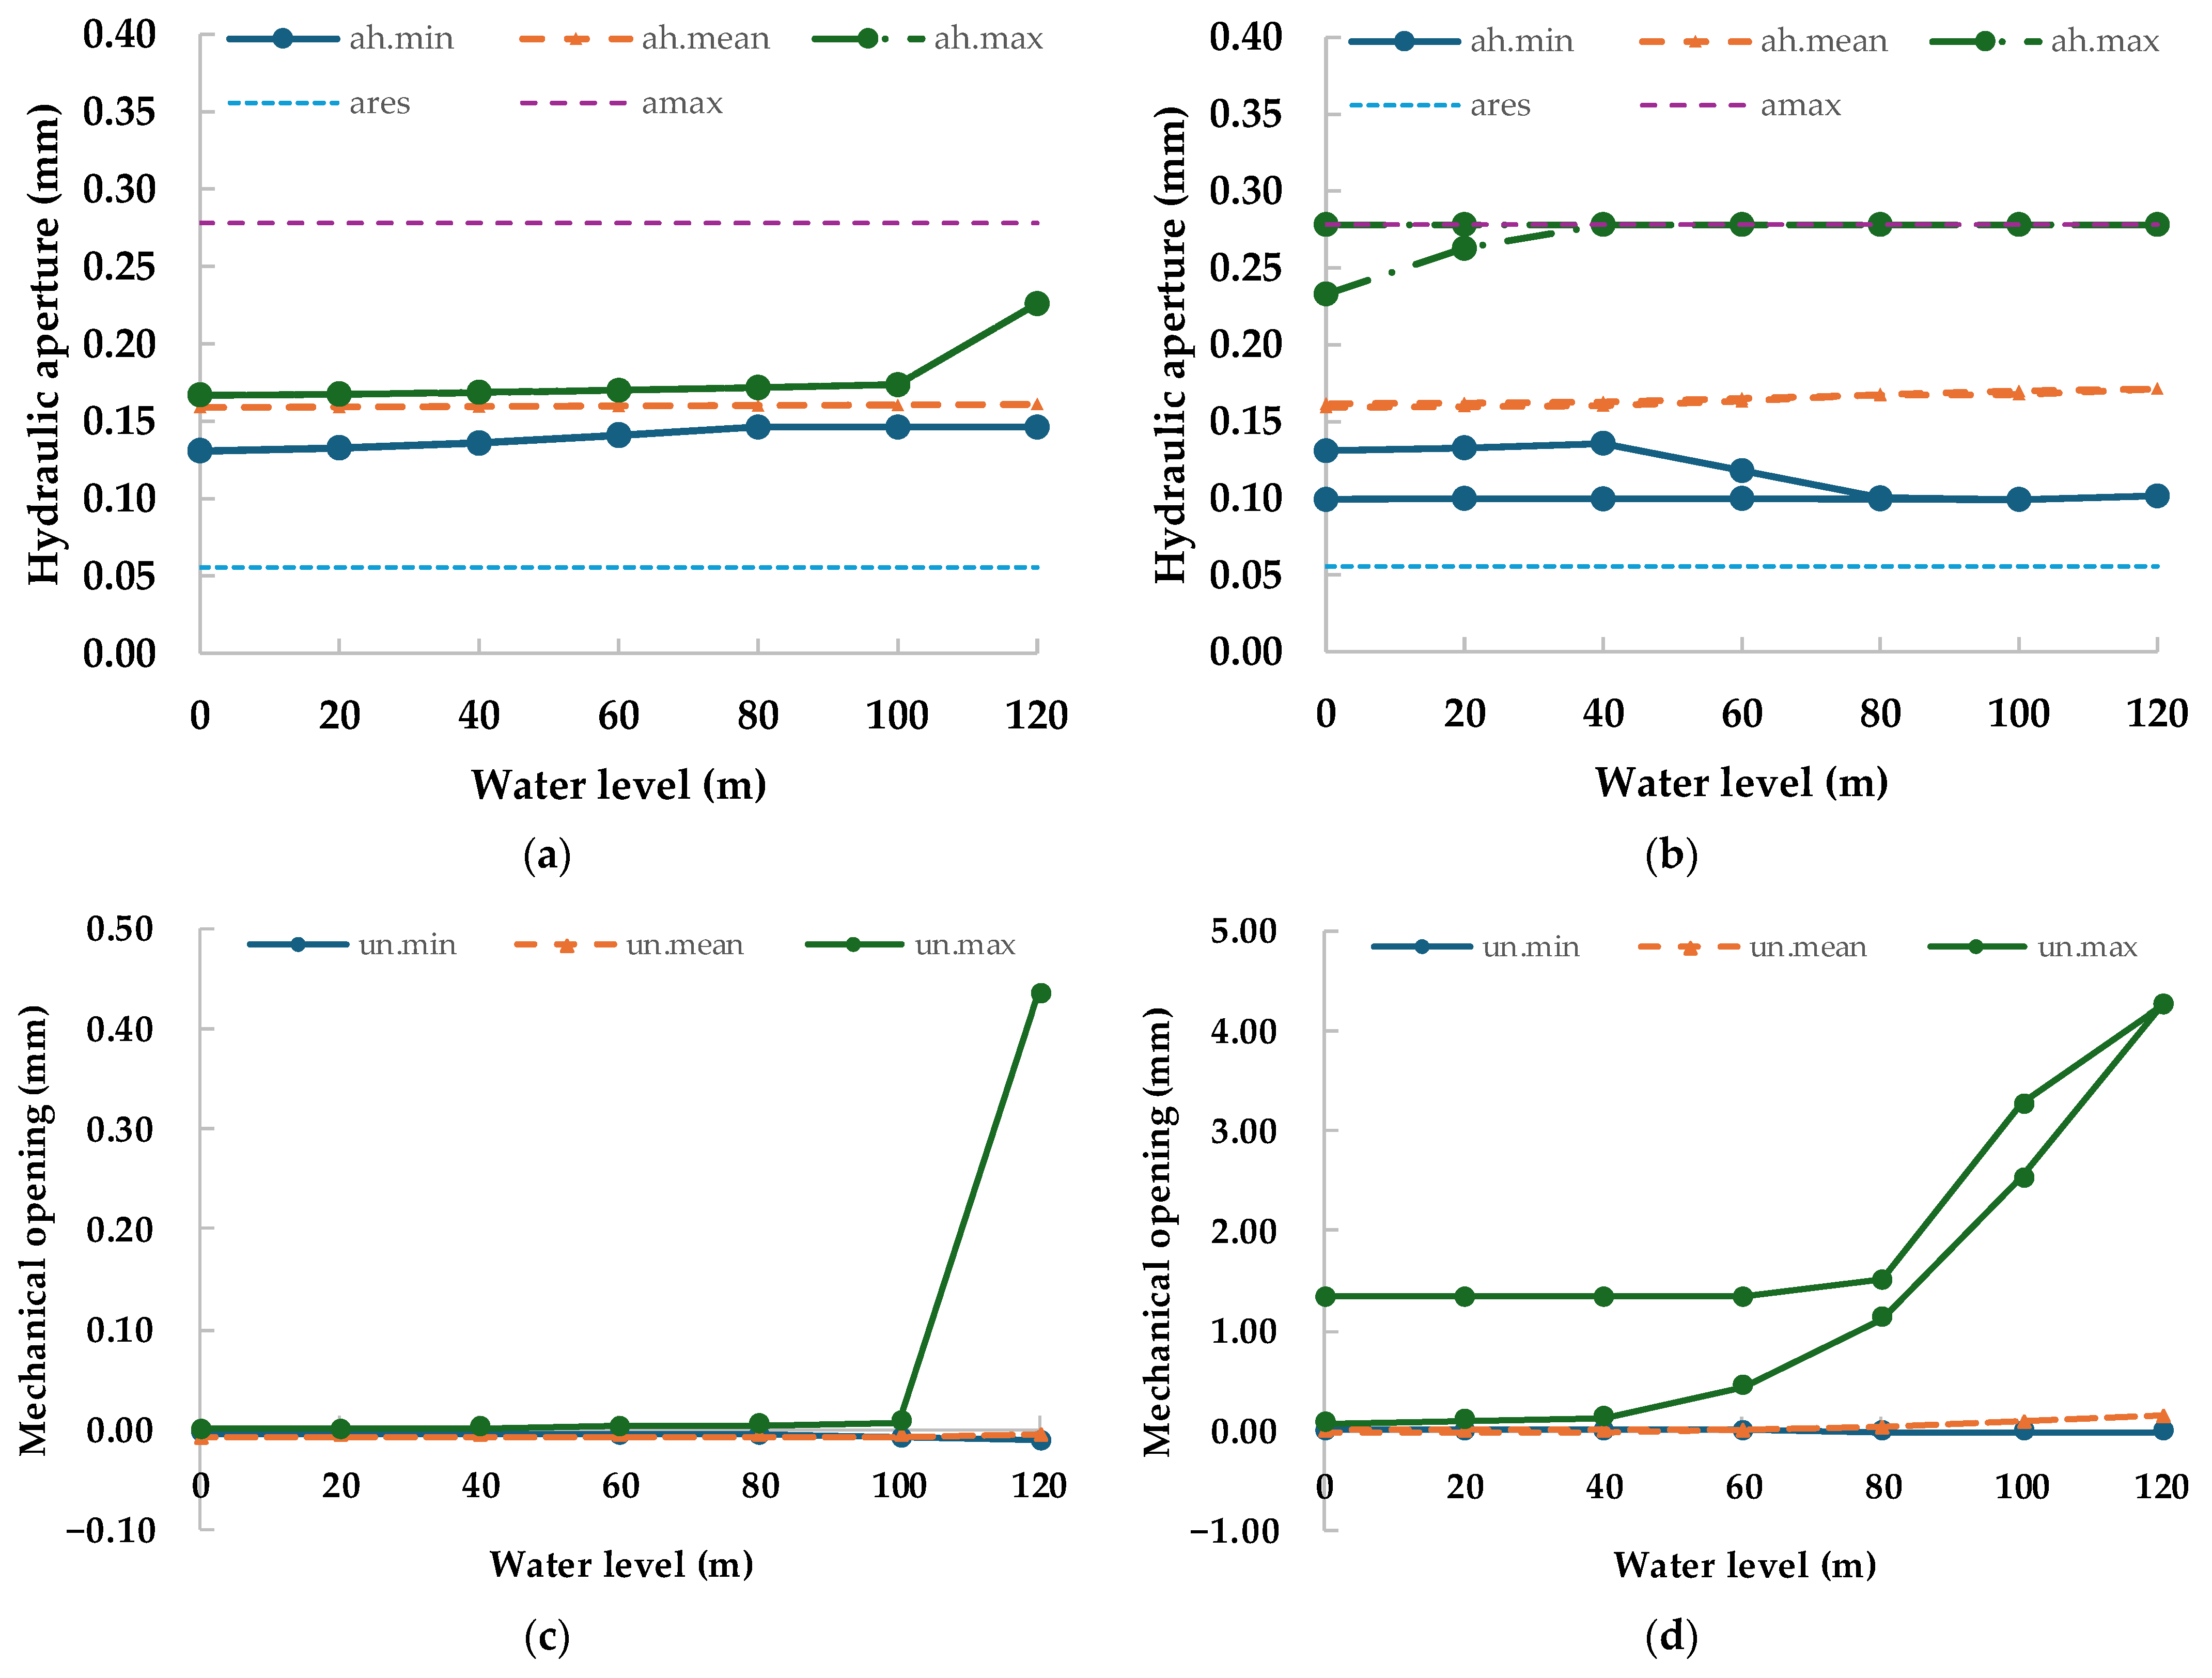
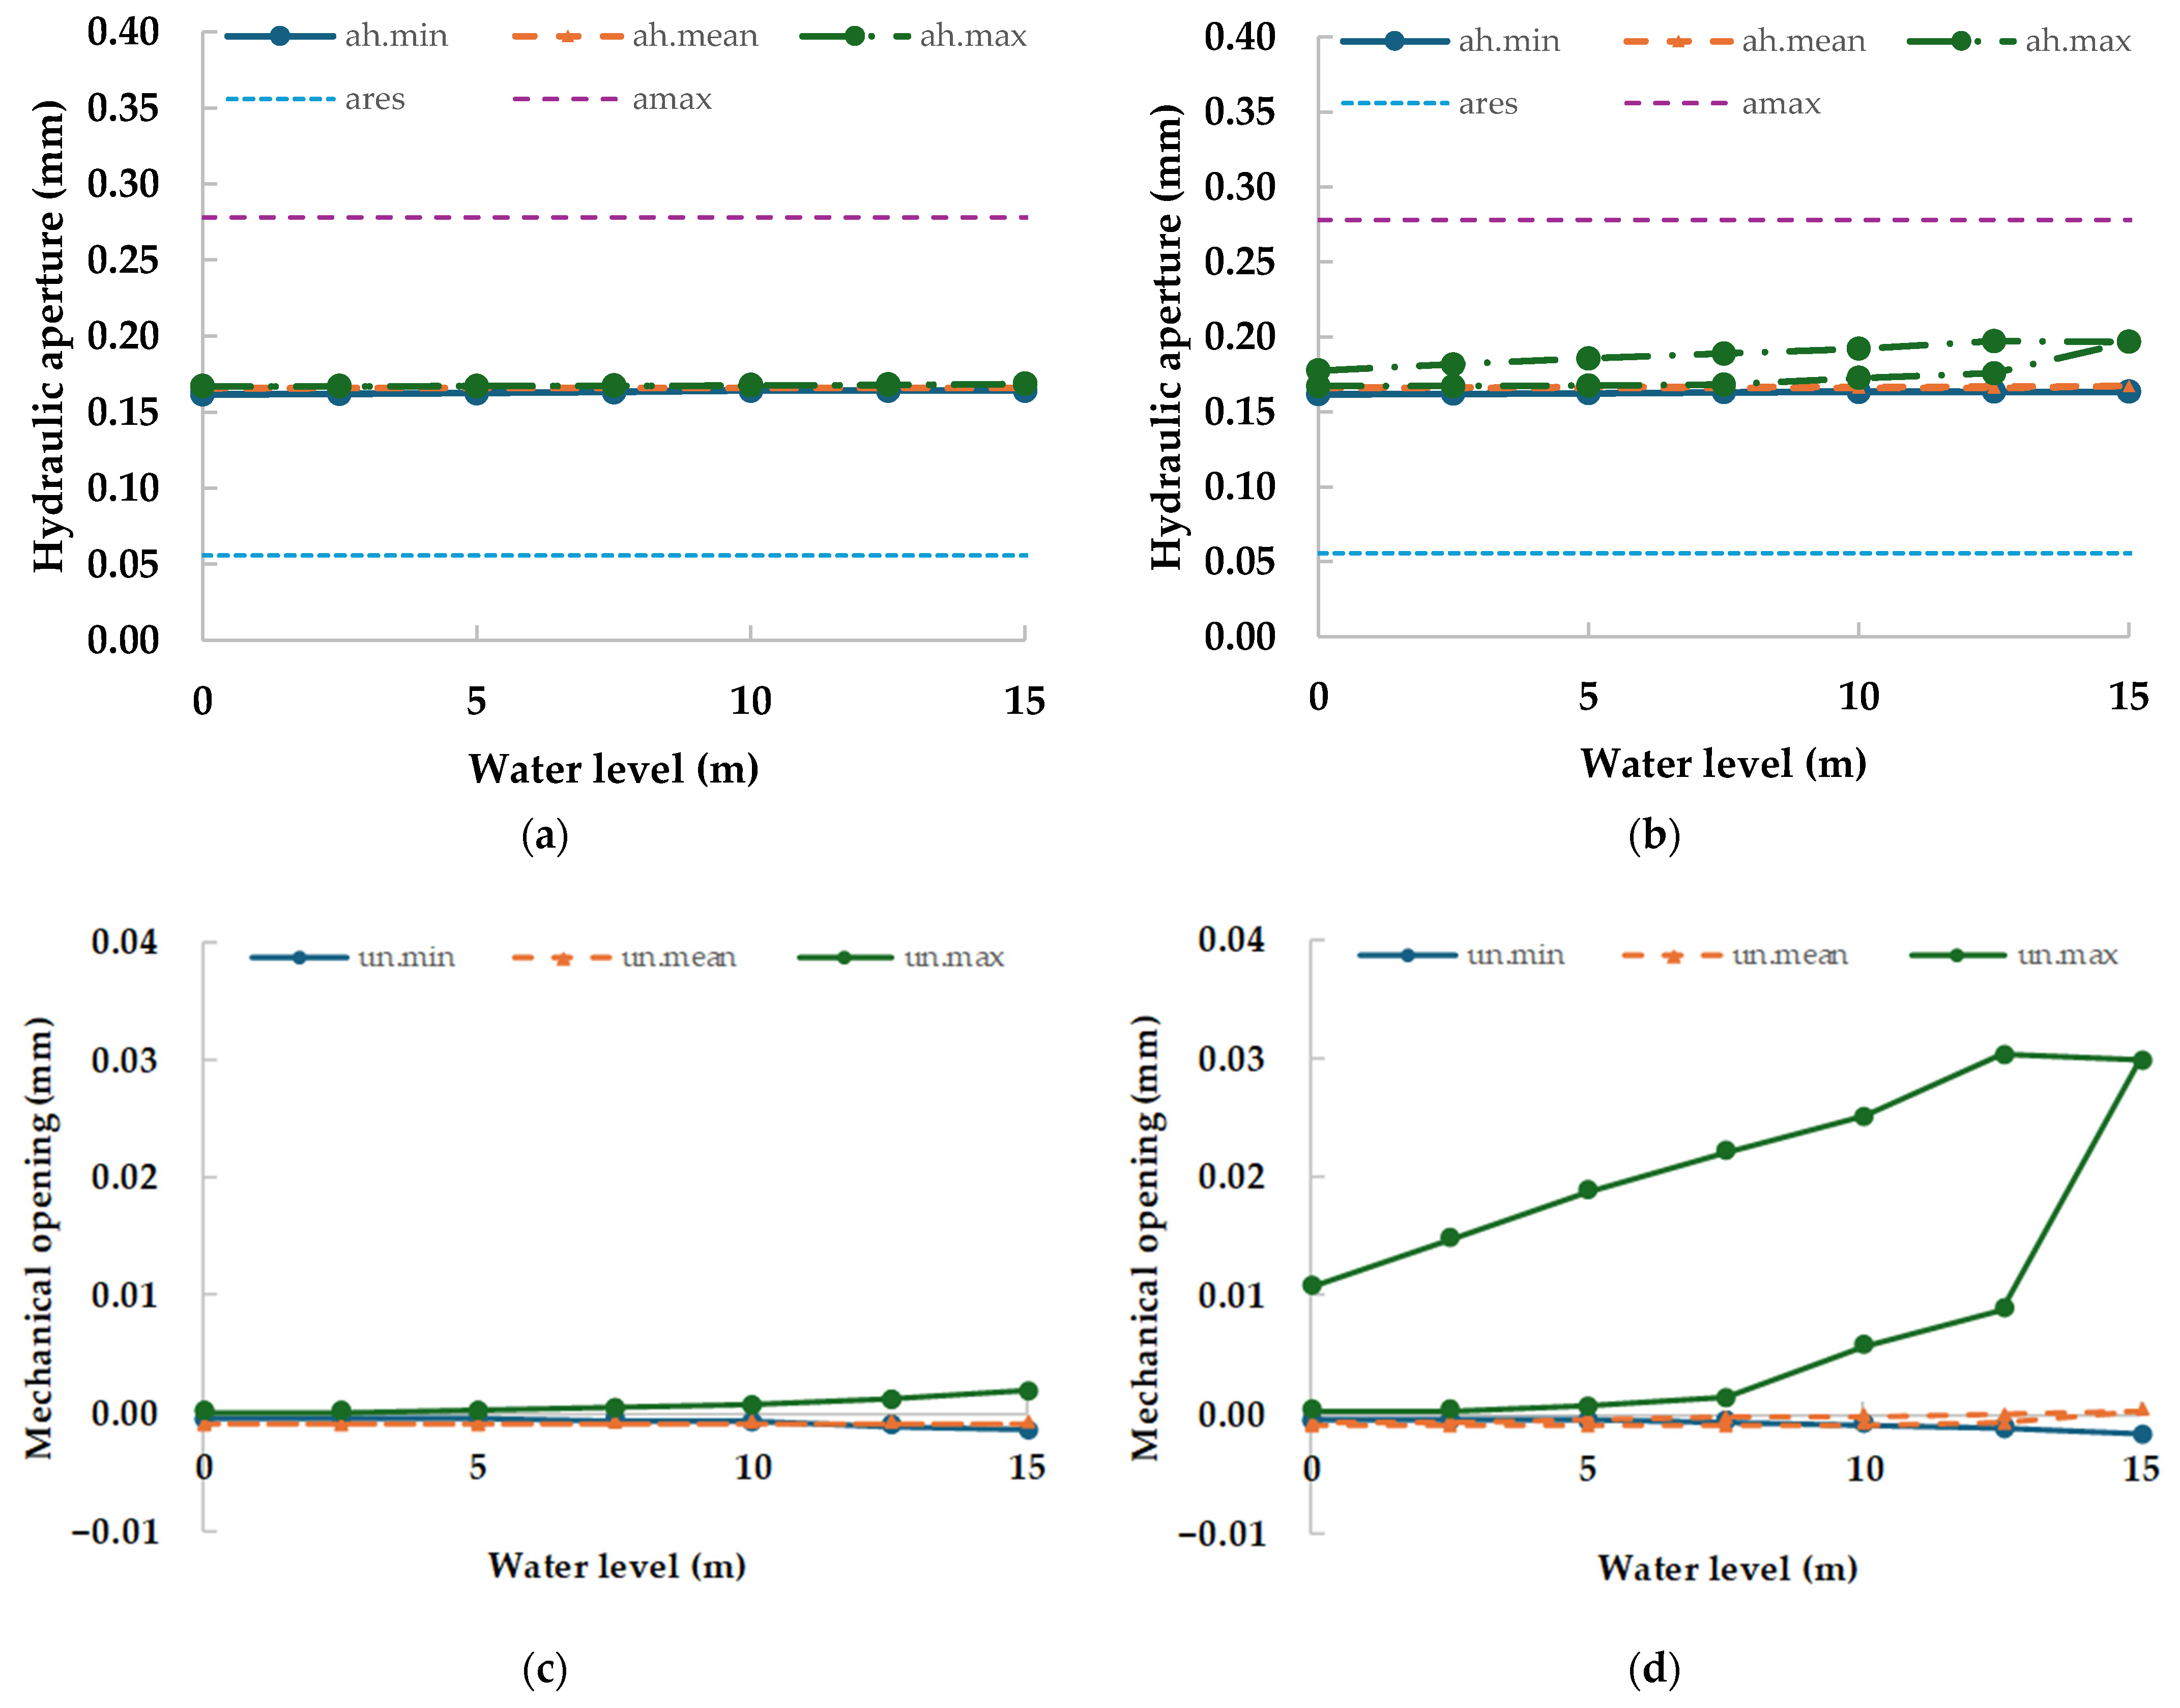
Figure 8a and Figure 8b show the minimum, maximum, and mean hydraulic aperture values during the filling and emptying of the reservoir presented for the D120i model, for elastic and nonlinear brittle foundation behaviours, respectively. Also presented are the adopted residual SC opening and the maximum acceptable SC opening. Figure 8c and Figure 8d show the minimum, maximum, and mean mechanical opening values during the filling and emptying of the reservoir presented for the D120i model, for elastic and nonlinear foundation behaviours, respectively. All the SCs and JEs within a rectangular box with dimensions 35.4 m to each side of the dam heel and dam toe, and with a depth of 93.6 m, are included in the statistics, see Figure 4.
For an elastic foundation behaviour, Figure 8a, it is noticeable that cracking is associated with a sudden increase in the maximum hydraulic opening (ah.max). The effect of cracking is also visible in the mechanical model, with an increase in the maximum predicted mechanical opening (Figure 8c). Figure 8a,c also show that for a water level below 100 m, the cracking effect on the hydraulic behaviour is no longer noticed, and the predicted values in emptying of the reservoir are similar to those in reservoir filling.
A different behaviour is predicted with a nonlinear foundation model, Figure 8b,d. With a nonlinear foundation model, the maximum hydraulic aperture matches the maximum hydraulic opening for a reservoir level of 40 m. Even during the emptying of the reservoir, there is no reversibility of the maximum opening, which remains equal to the maximum value even for an empty reservoir. This explains the difference in the recorded discharges during the filling and emptying of the reservoir for the D120i model with a nonlinear brittle foundation. During reservoir filling, a slight reduction in the minimum hydraulic opening is predicted, and this value is almost kept constant during reservoir emptying. Just like in the elastic model, Figure 8a, there is a slight increase in the mean value of the hydraulic opening during the filling process.
In the maximum predicted mechanical opening, Figure 8d, it is easier to identify the irreversibility of the filling and emptying process that occurs in model D120i due to the nonlinear behaviour of the foundation.
Figure 9 shows results for the D15 model similar to those presented in Figure 8 for the D120i model. All the SCs and JEs within a rectangular box with dimensions 4.4 m to each side of the dam heel and dam toe, and with a depth of 11.7 m, are included in the statistics, see Figure 4. This dam model was chosen because in both foundation behaviours, the concrete–rock interface remains within the elastic stage throughout the reservoir filling and emptying process. As shown in Figure 9a for the elastic foundation, the hydraulic aperture statistics within each SC are very similar (minimum, mean, and average values). It can be seen in Figure 9c that as the water level increases, there is a smooth increase in the minimum, mean, and maximum mechanical openings.
As shown in Figure 9b for the nonlinear brittle foundation, the hydraulic aperture statistics (minimum, mean, and average values) within each SC have some differences, and it is an irreversible behaviour in the maximum SC hydraulic aperture. This irreversible behaviour is also noticeable in the maximum predicted mechanical opening, see Figure 9d.
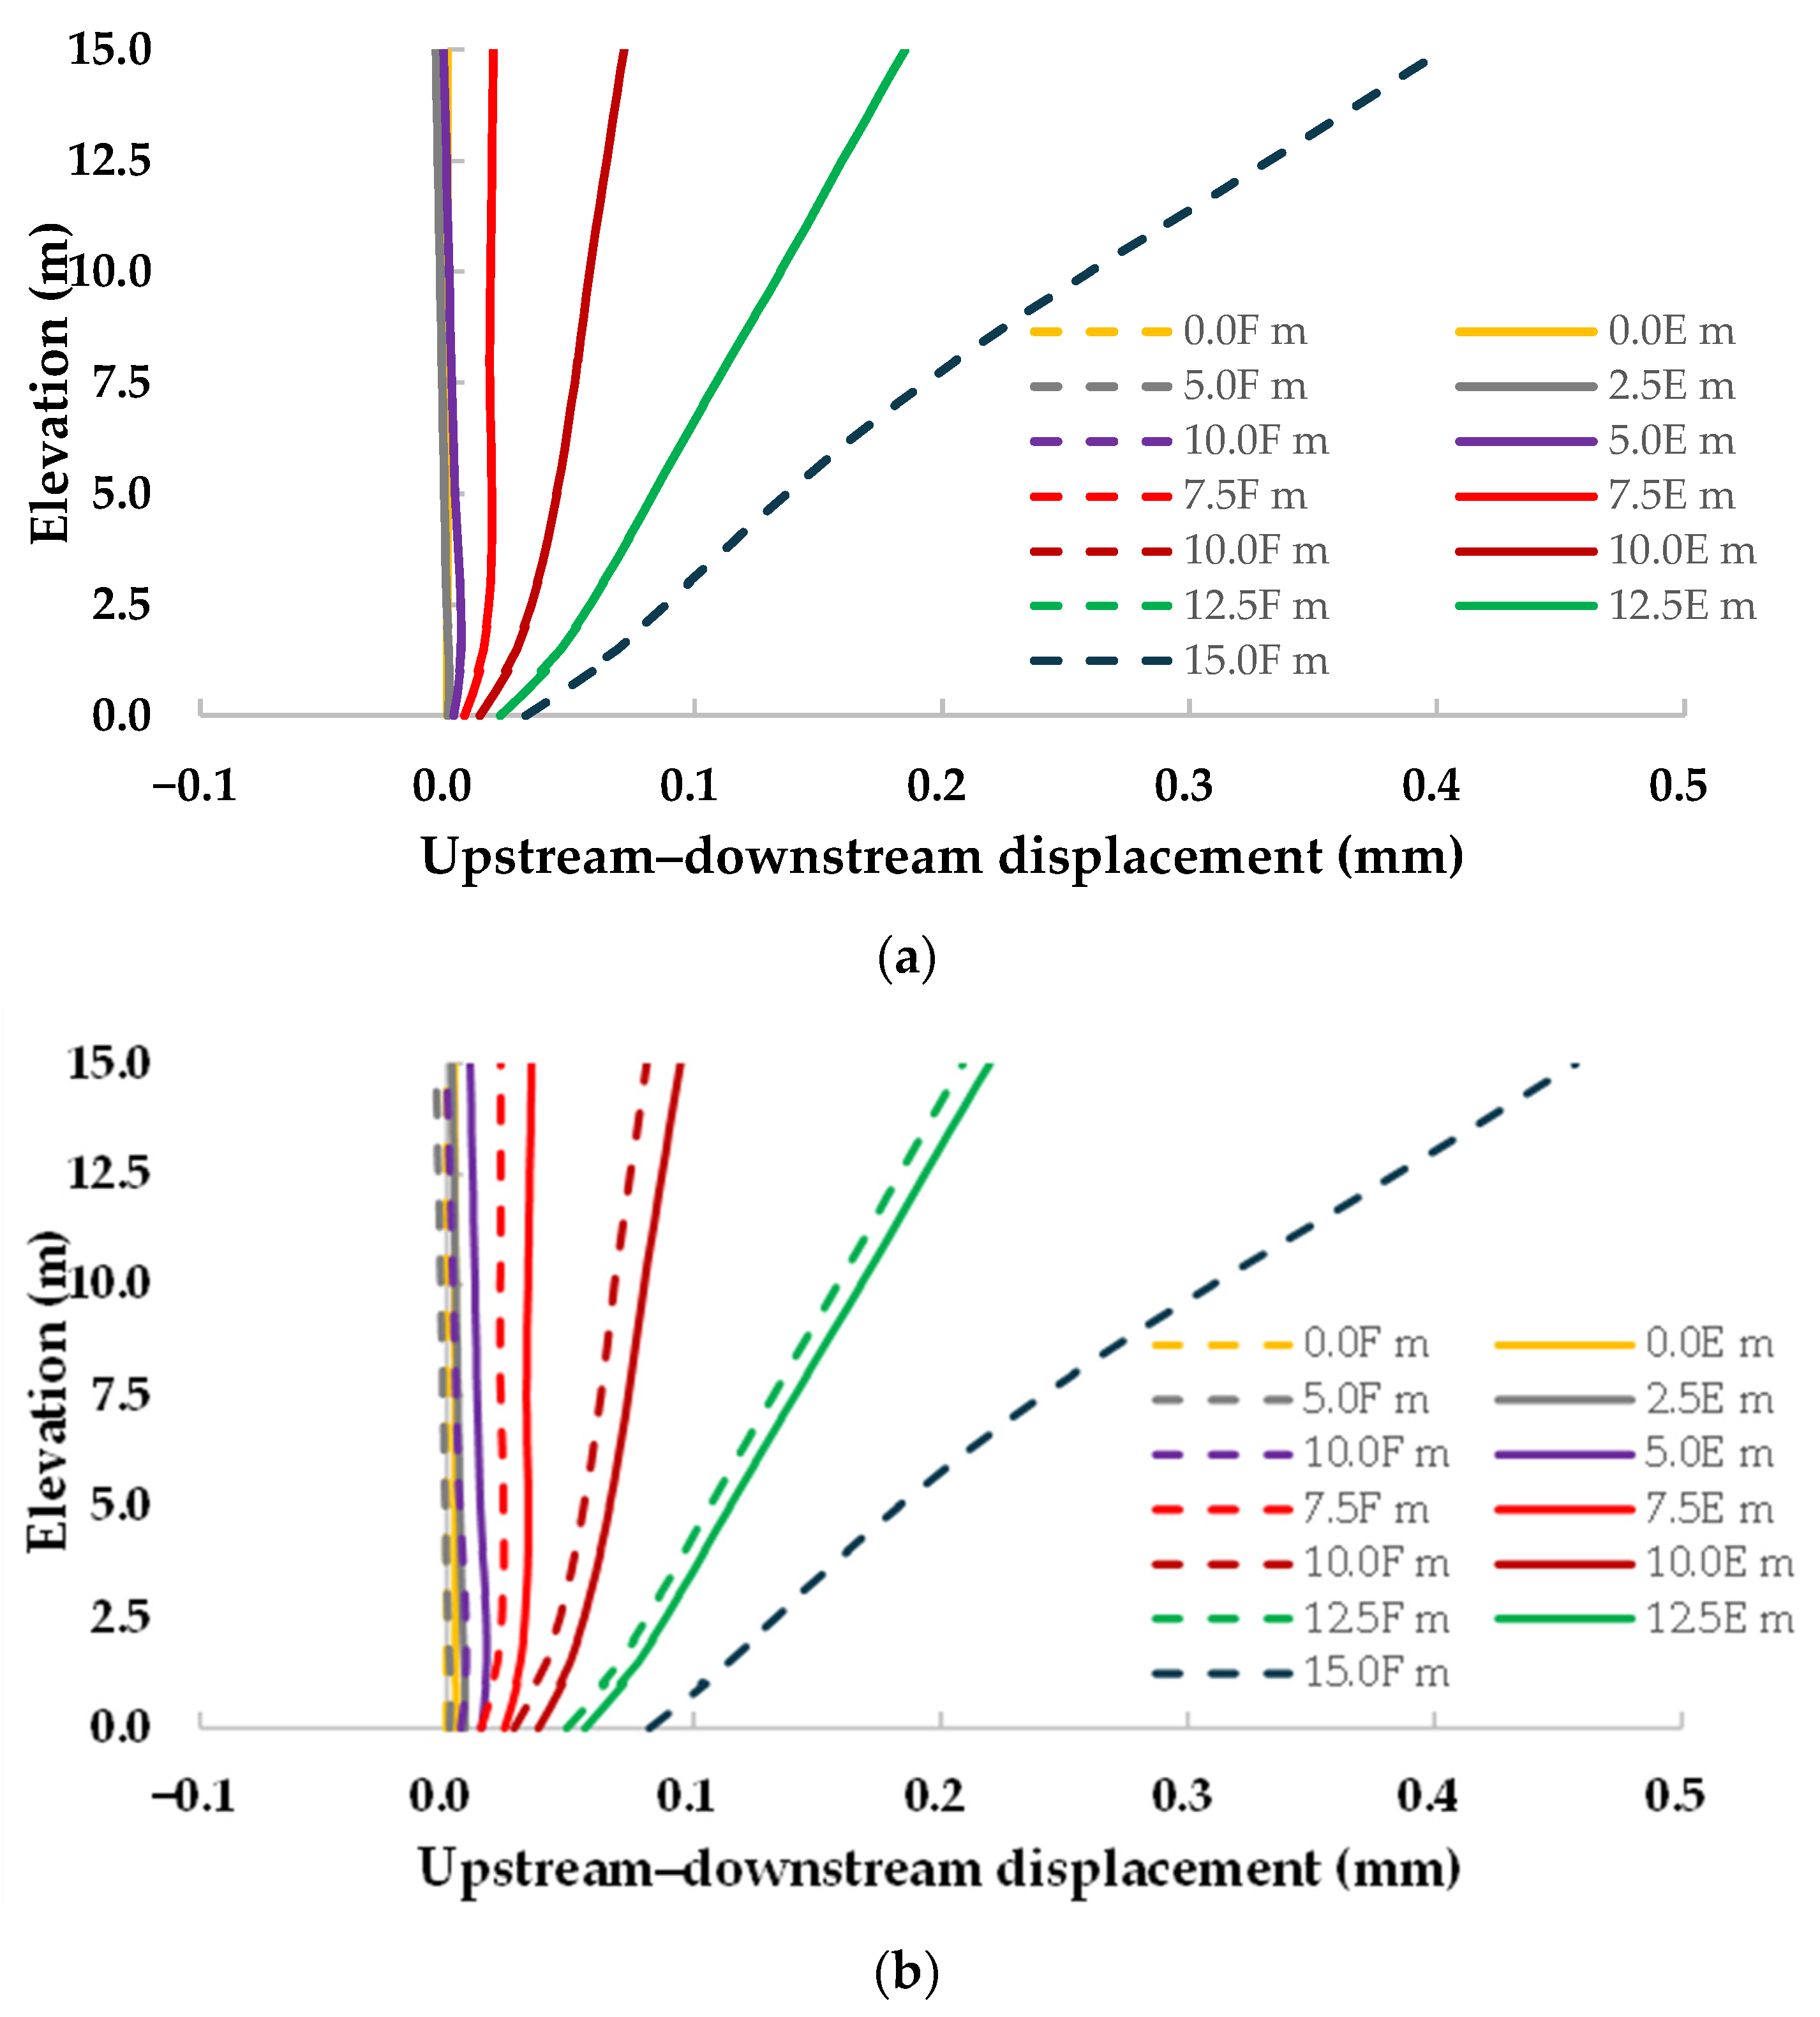
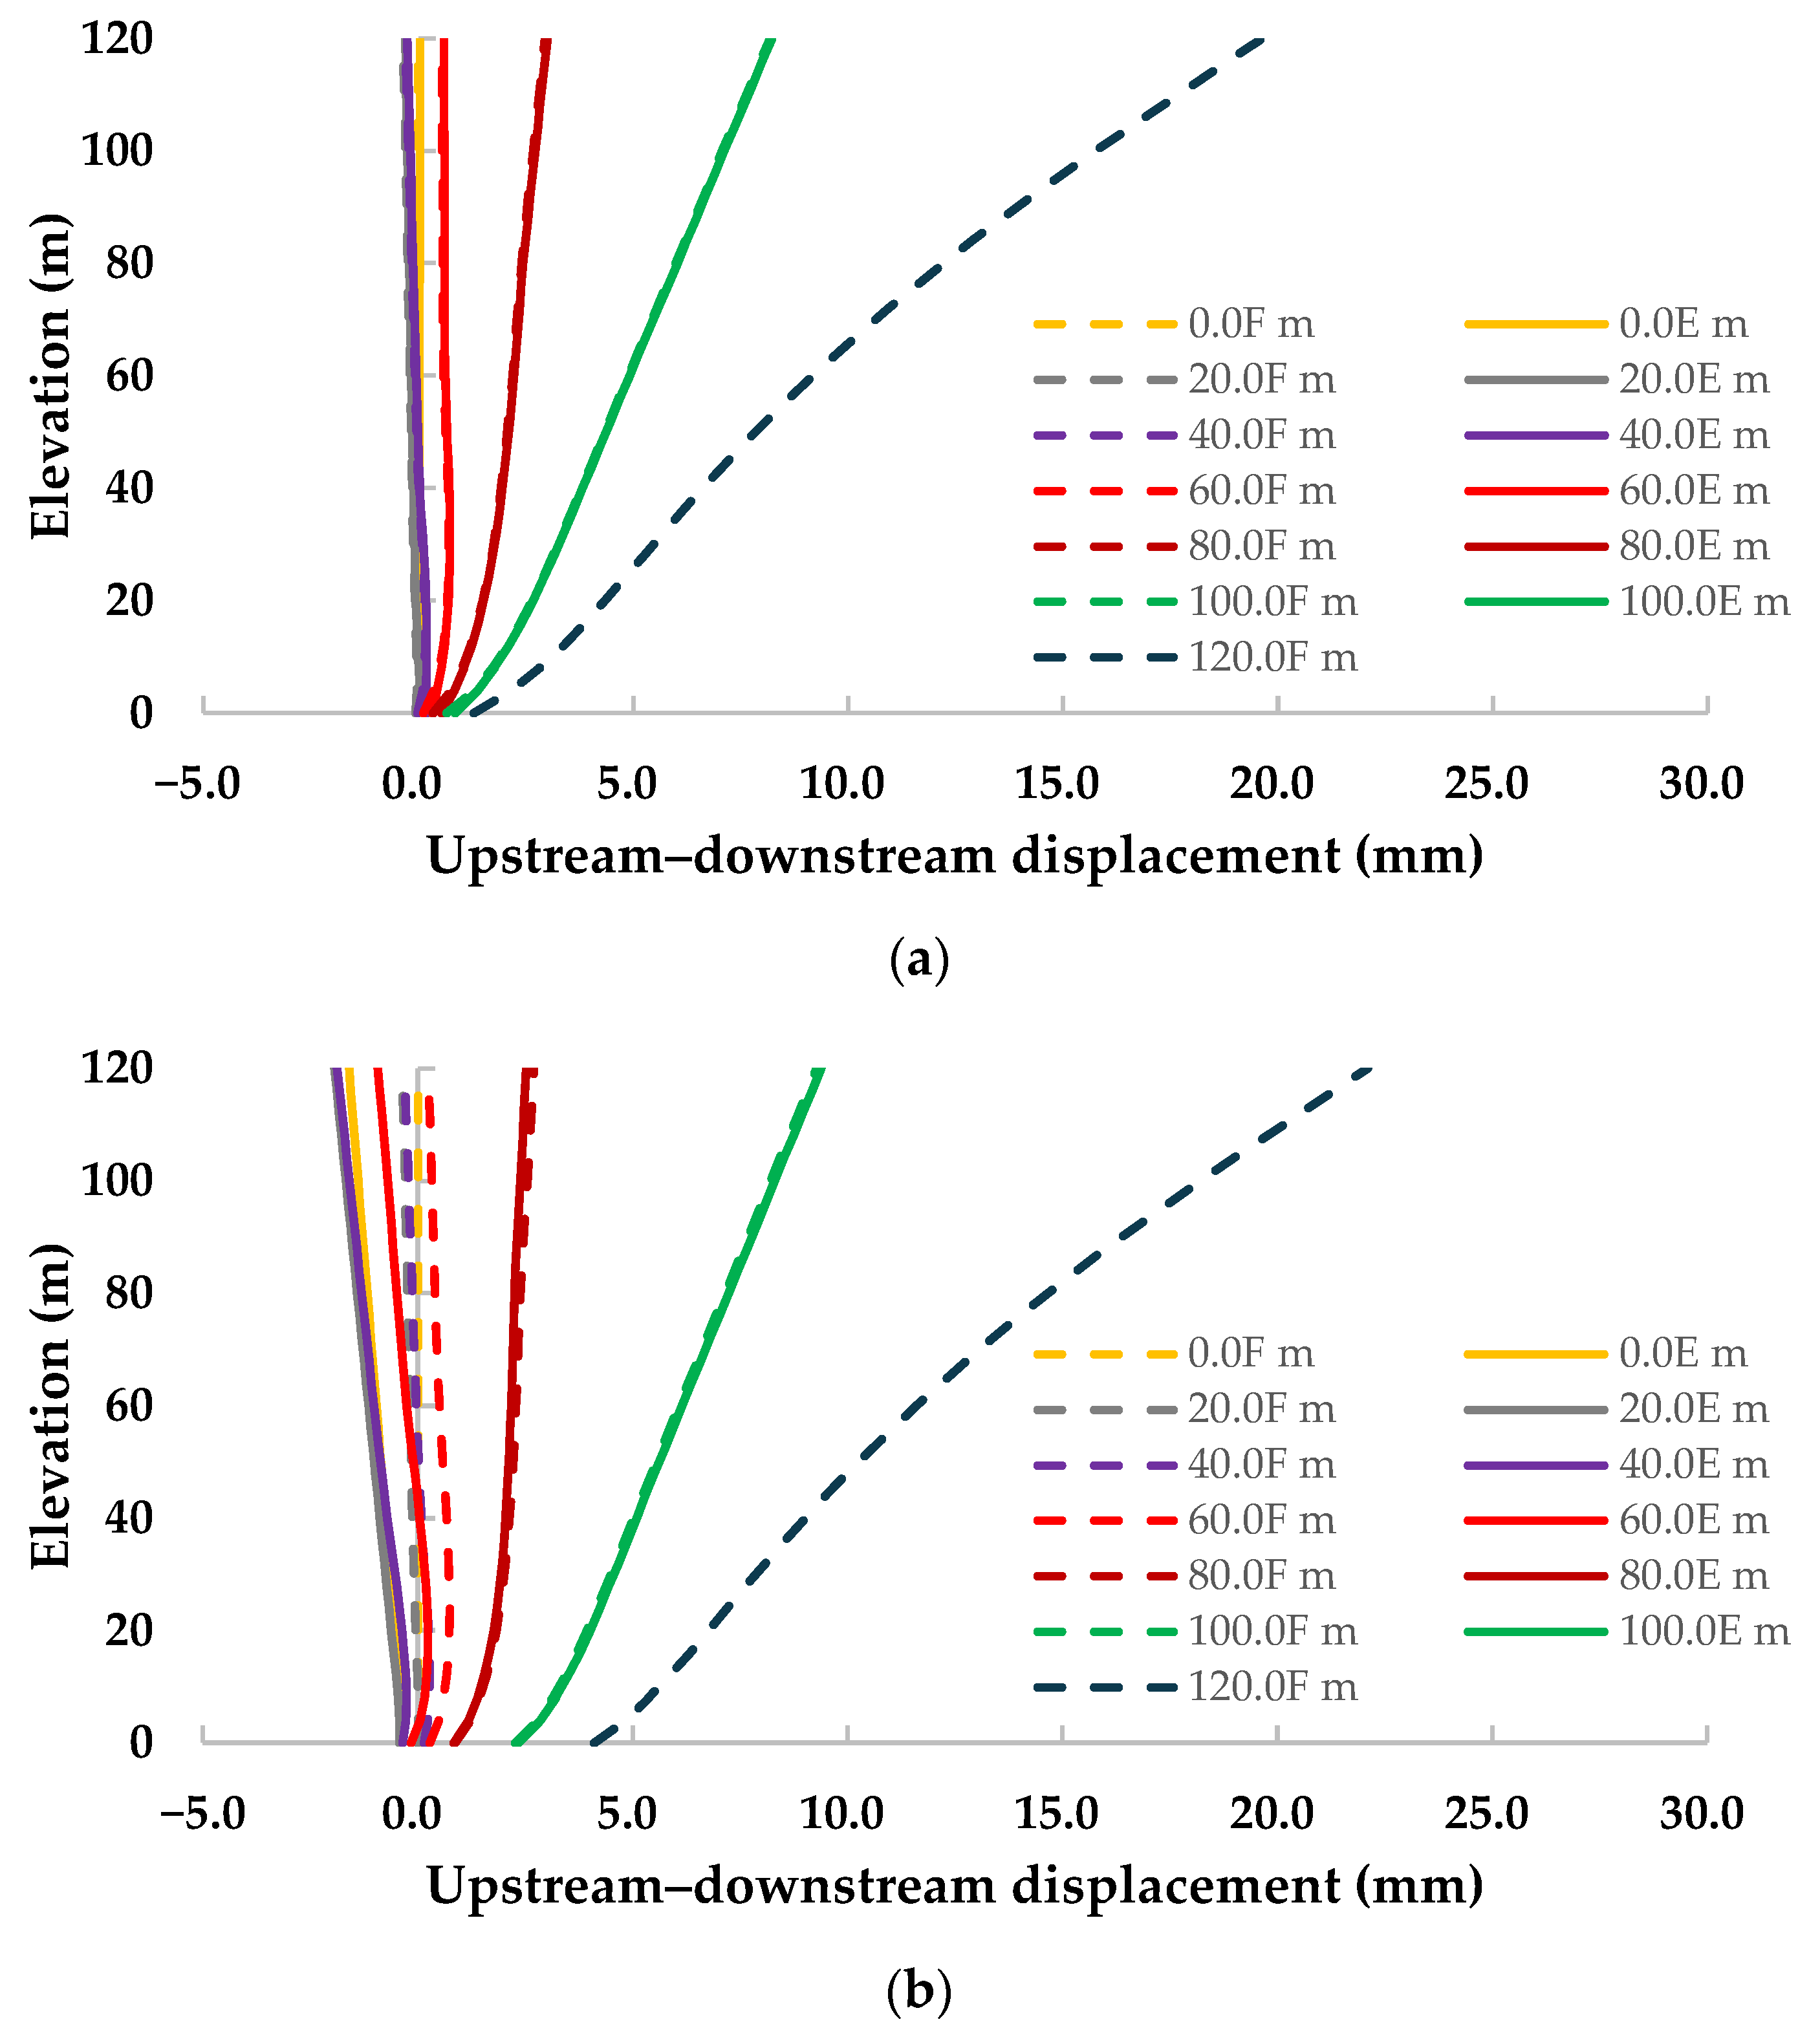
Figure 10a and Figure 10b show the upstream–downstream displacement along the dam upstream surface, positive towards downstream for the D120i model, for elastic and nonlinear brittle foundation behaviours, respectively. As shown, for an elastic foundation, the calculated displacements during the filling of the reservoir are closer to those calculated during the emptying of the reservoir, for similar water levels. The cracking that occurs in the vicinity of the dam heel, which is easily identified in the change that occurs in hydraulic behaviour, does not have a meaningful effect on the dam displacement field.
For a nonlinear foundation for water levels below 80 m, a difference in the calculated displacement field is noticeable between the filling and emptying operations, which is due to the nonlinear behaviour that is also noticed when assessing the hydraulic model variables.
Figure 11 shows results for the D15 model, similar to those presented in Figure 10 for the D120i model. With the D15 model, which is the lowest dam height assessed, a trend similar to that obtained in the D120i model is identified for a linear elastic foundation: the calculated displacements during the filling of the reservoir are close to the displacements measured during the emptying of the reservoir, for similar water levels. For a lower dam height and for a nonlinear foundation behaviour, the difference in the measured displacement field between the filling and the emptying operations is less noticeable.

5.1.2. Influence of the Joint Normal Stiffness

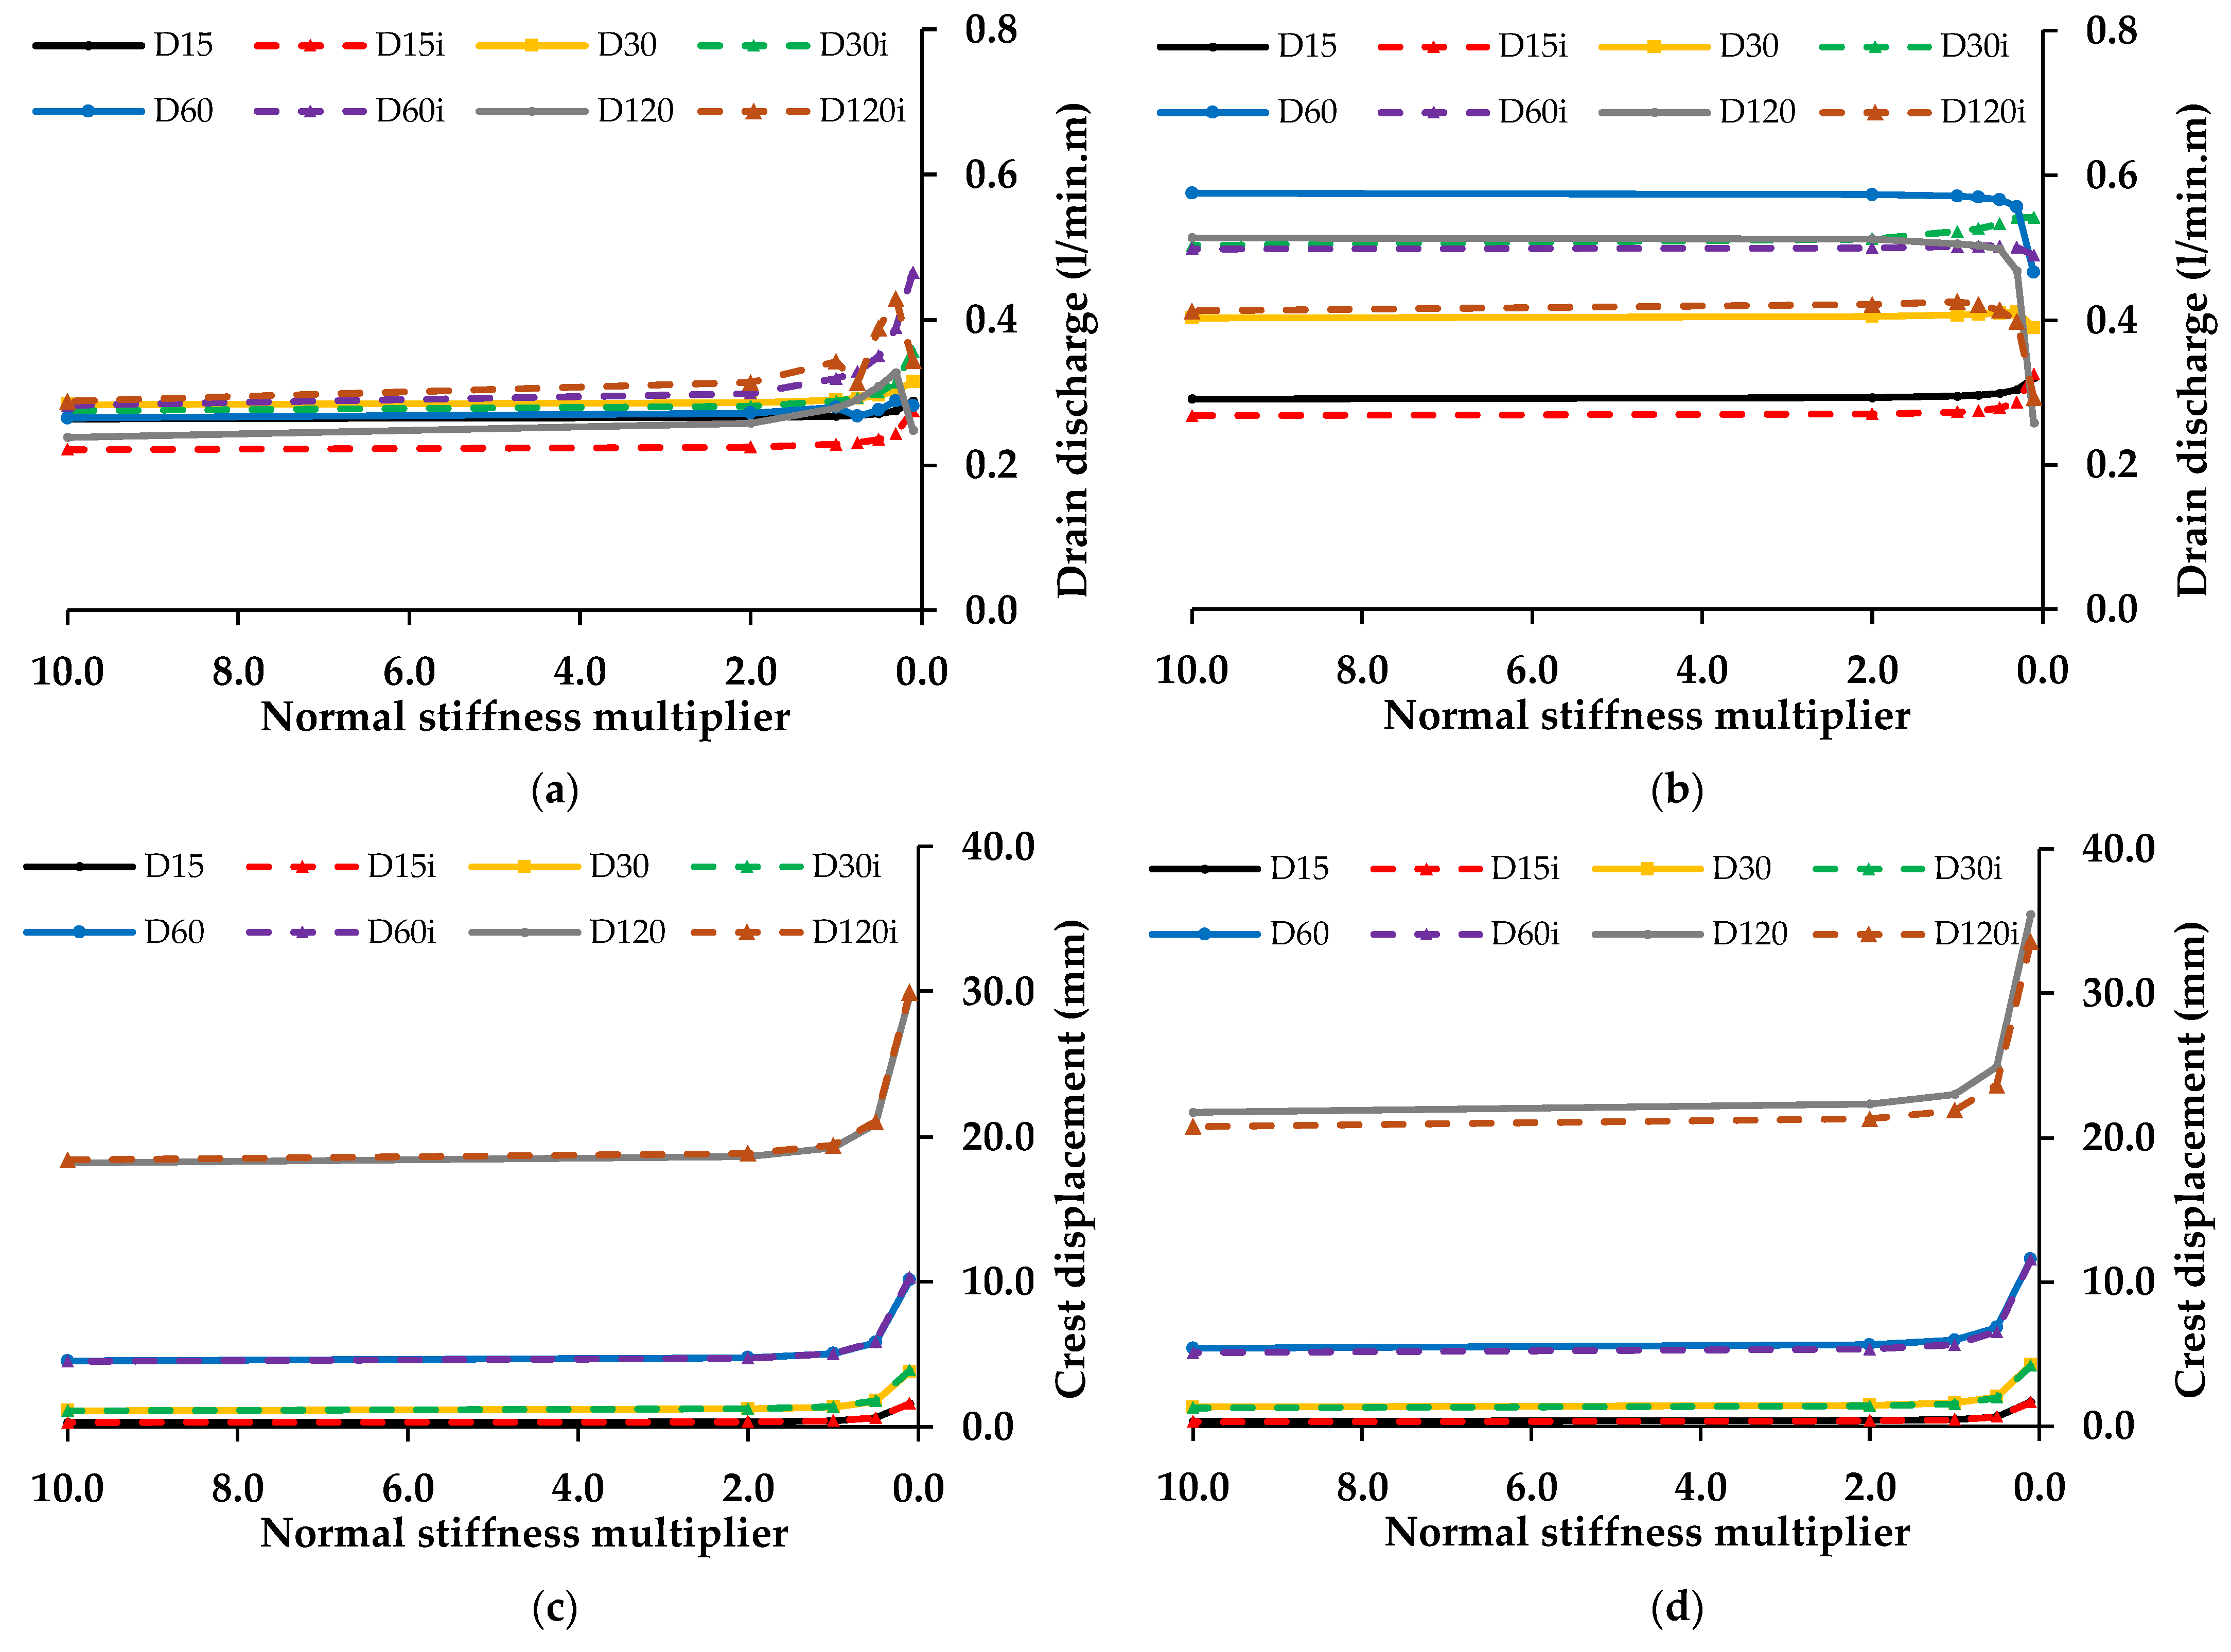
To evaluate the influence of the joint normal stiffness value on the hydromechanical responses, additional simulations were performed assuming rock masses with different deformability, using values 10, 10/3, 2, and 4/3 times lower and 2 and 10 times higher than the normal stiffness reference values defined in Table 3.
The modulus of deformation of the rock mass may be approximated by the following equation:
1 E R M   =   1 E R +   1 k n   s
where E R is the modulus of deformation of the rock matrix, k n is the jointed media’s normal stiffness, and s is the jointed media spacing. Considering the data presented in Table 3 and the spacing between discontinuities, the equivalent deformability of the assumed rock masses for the adopted dam heights is presented in Table 5. As shown, for the 60 m dam, models D60 and D60i, the equivalent deformability is 30.0% lower than that of the reference model when k n / 10 is assumed, and 4.6% higher when 10   k n is adopted.
Figure 12a and Figure 12b show the numerically predicted maximum hydraulic drain discharges for the different adopted normal stiffness values, respectively, for elastic and nonlinear brittle foundation behaviours. For ease of analysis, the normal stiffness multiplier presented on the x-axis (10, 2, 1, 0.5, and 0.1) is demonstrated in reverse order. As shown, only for the smallest normal stiffness value, k n / 10 , there is a noticeable difference in the maximum obtained drain discharges. Figure 12c and Figure 12d show the numerically predicted maximum upstream–downstream displacement at the dam crest for elastic and nonlinear brittle foundation behaviours, respectively. Similarly to the predicted hydraulic response, only for the lowest normal stiffness value, a change in the mechanical behaviour is noticeable.

5.1.3. Influence of Joint Aperture at Nominal Zero Normal Stress

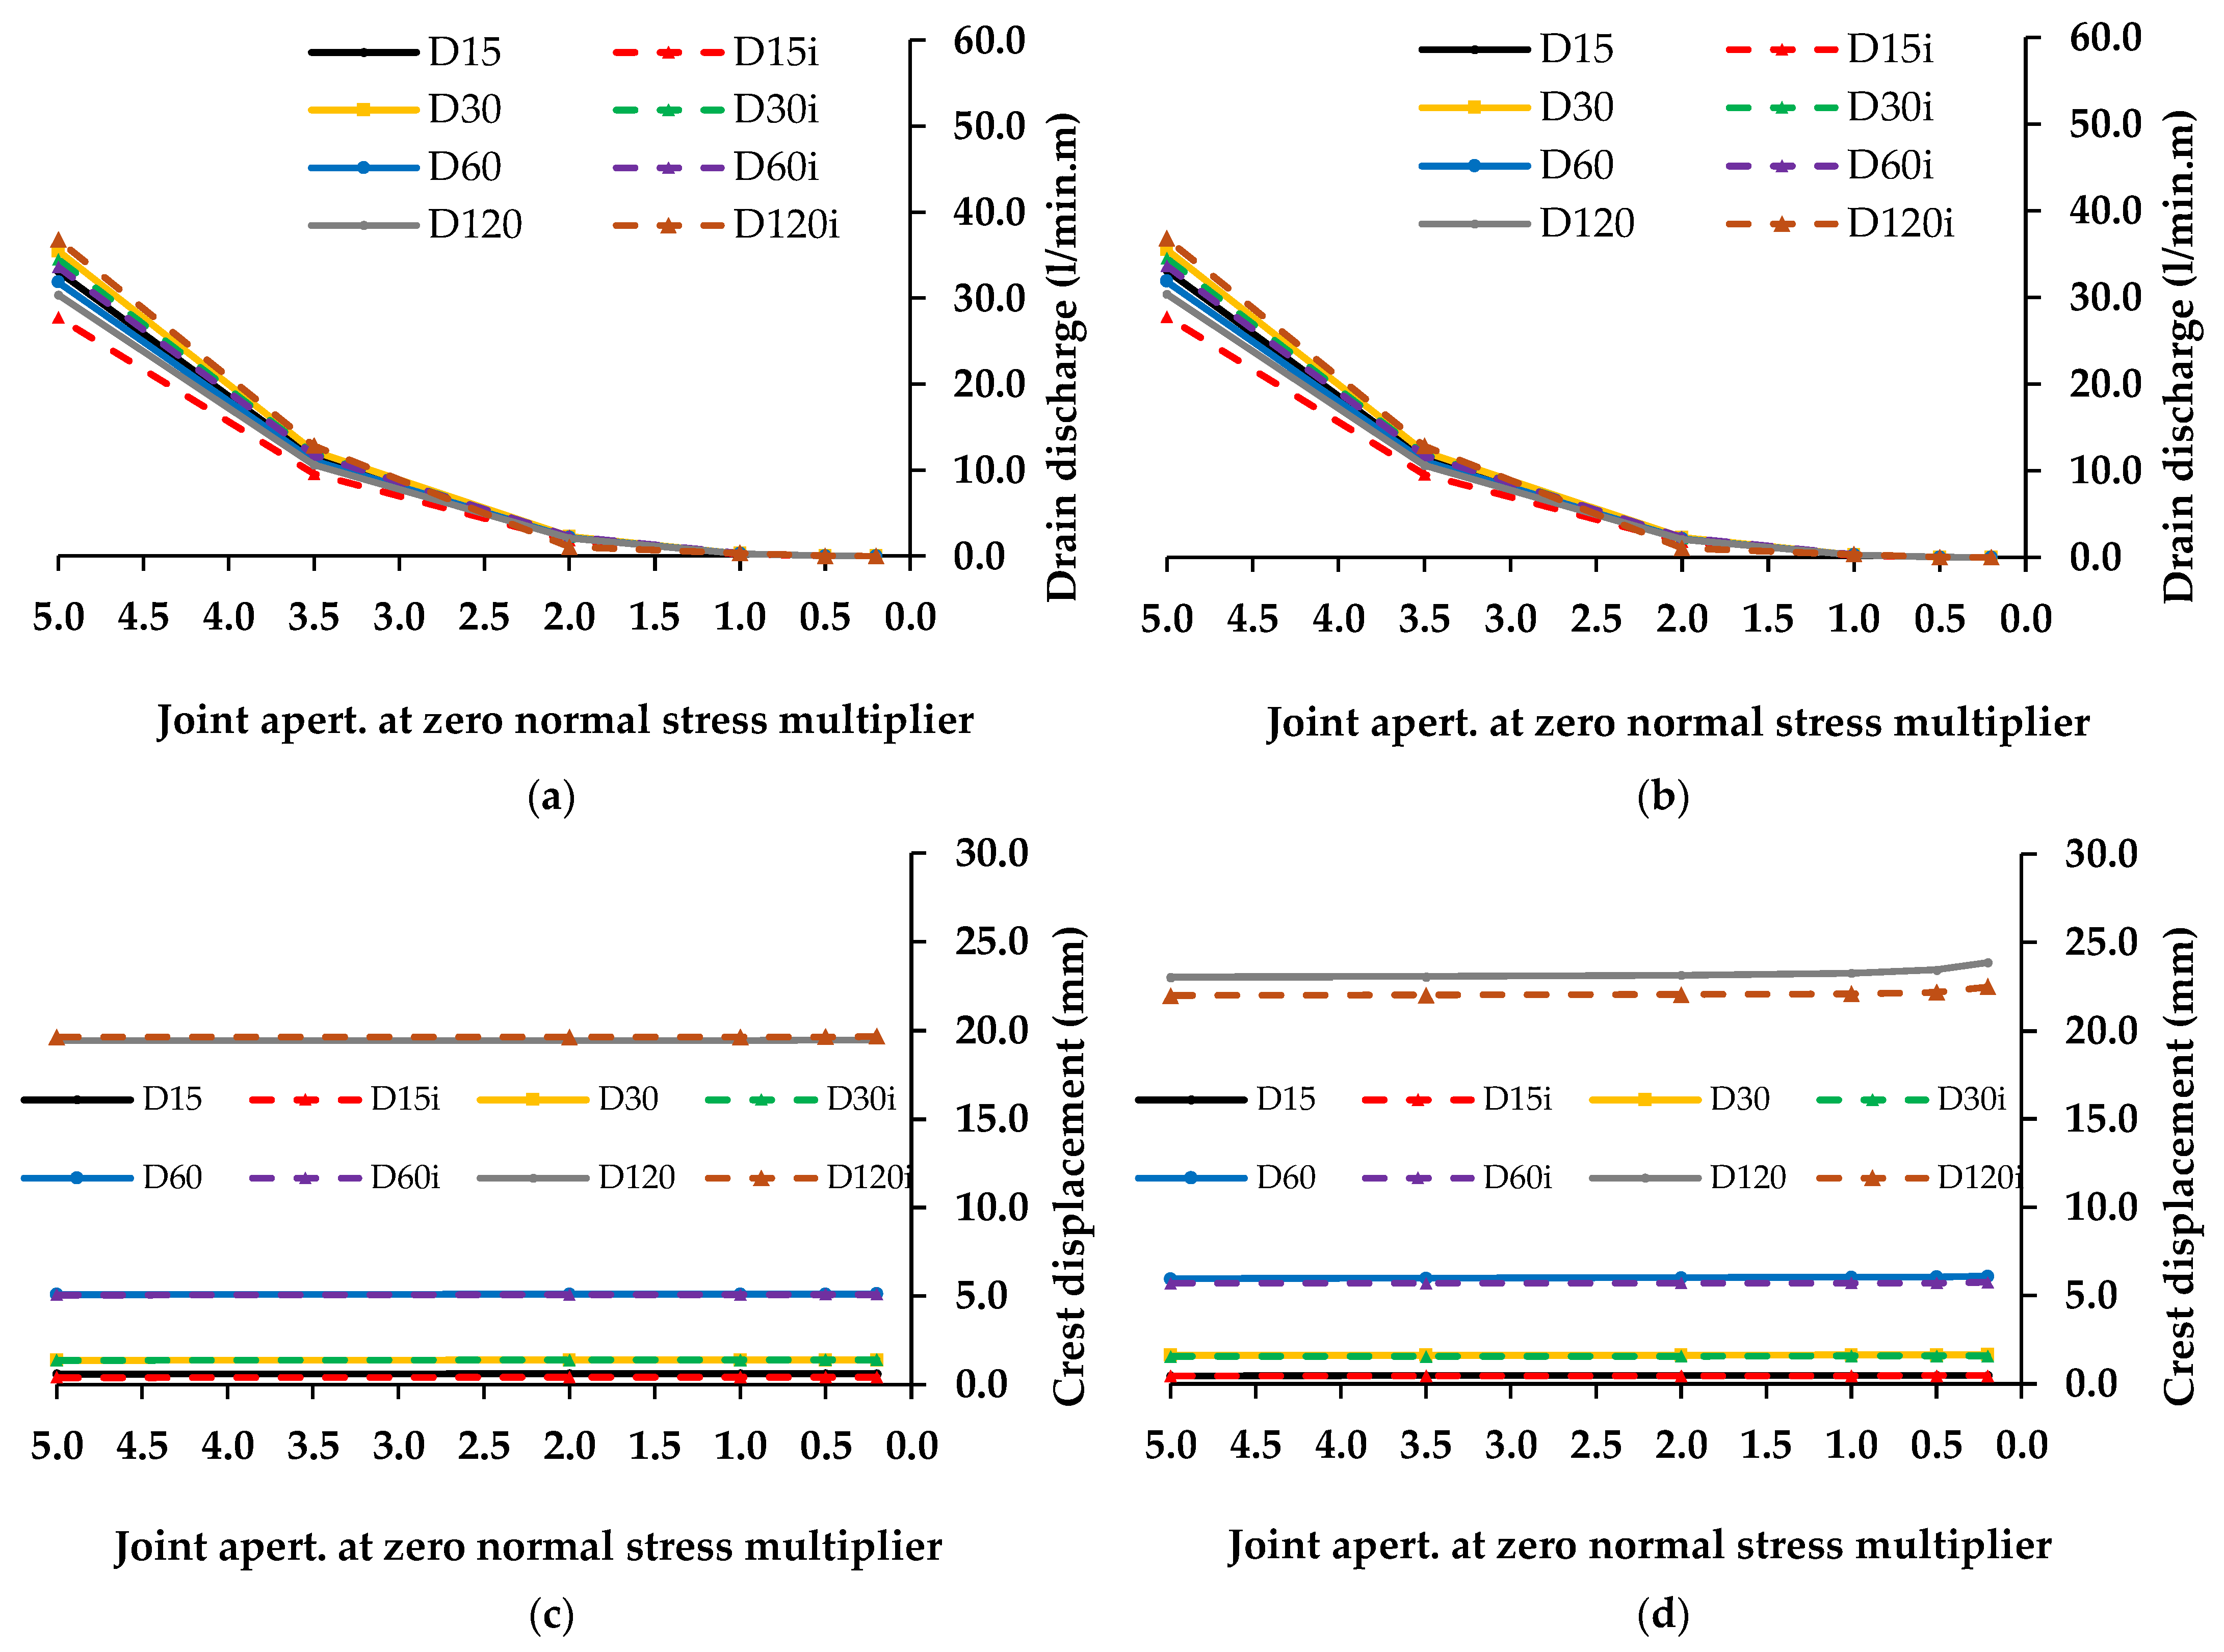
To evaluate the influence of the joint aperture at nominal zero normal stress values on the hydromechanical response, additional simulations were performed assuming different joint apertures: at values 5 and 2 times lower and 2, 3.5, and 5 times higher than the joint aperture at nominal zero normal stress values defined in Section 4.2.2. Note that, as already mentioned, the hydraulic aperture at nominal zero normal stress ( a 0 ) needs to be defined through a calibration procedure given in situ drain discharge measurements.
Figure 13a and Figure 13b show the numerically predicted maximum hydraulic drain discharges for the different adopted joint apertures at nominal zero normal stress values for elastic and nonlinear brittle foundation behaviours, respectively. As shown, an increase in the a 0 value leads to an increase in the obtained drain discharges, which is even more noticeable for a nonlinear brittle foundation. As presented in Section 2.2, the discharge rate of a given SC is proportional to the cubic value of the hydraulic aperture that is directly related to the a 0 . For an a 0 value 5 times higher than that adopted in the reference model, the drain discharges are, for both foundation behaviours, of the order of 100 times higher than the reference drain discharges. Similarly, for an a 0 value 5 times lower than that adopted in the reference model, the drain discharges are, for both foundation behaviours, of the order of 100 times lower, see Table 6.
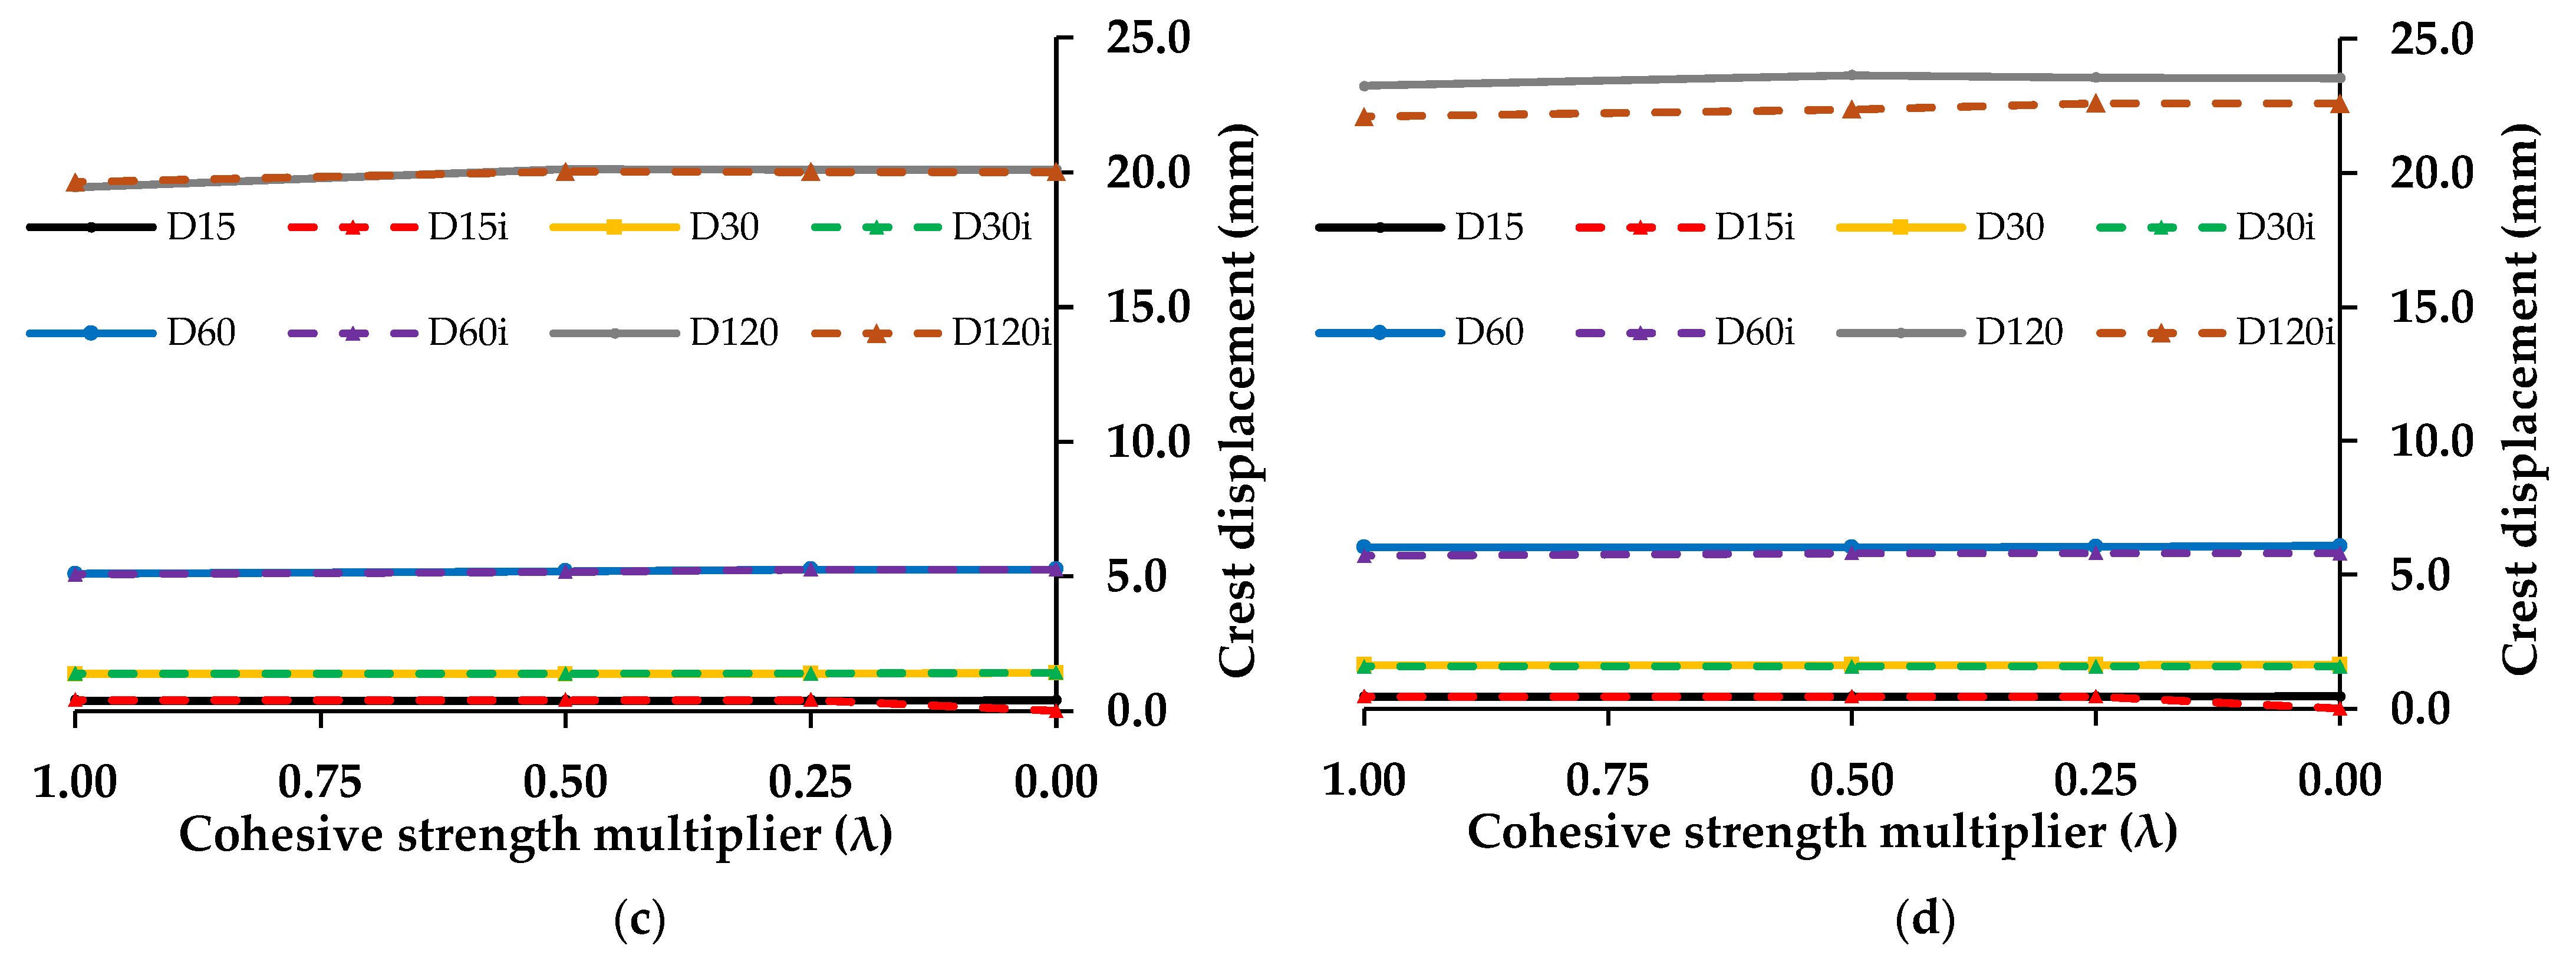
Figure 13c and Figure 13d show the numerically predicted maximum upstream–downstream displacement at the dam crest for the different adopted joint apertures at nominal zero normal stress values for elastic and nonlinear brittle foundation behaviours, respectively. Contrary to the results obtained in the hydraulic response, the variation in the a 0 has little influence on the mechanical response. For an elastic foundation, the predicted responses with the regular joint pattern and with the inclined joint pattern are very similar for different values of joint aperture at nominal zero normal stress, with maximum predicted differences below 0.5%, see Table 6. With the nonlinear foundation model, there are slightly more noticeable differences, especially for the higher dams, with a maximum difference of 3%.
The results presented lead to the conclusion that the joint aperture at nominal zero normal stress has a large effect, mainly on drain discharges. As such, careful calibration of this hydraulic parameter is critical to ensure accurate hydromechanical modelling results.

5.1.4. Influence of the Dam–Foundation Joint Strength

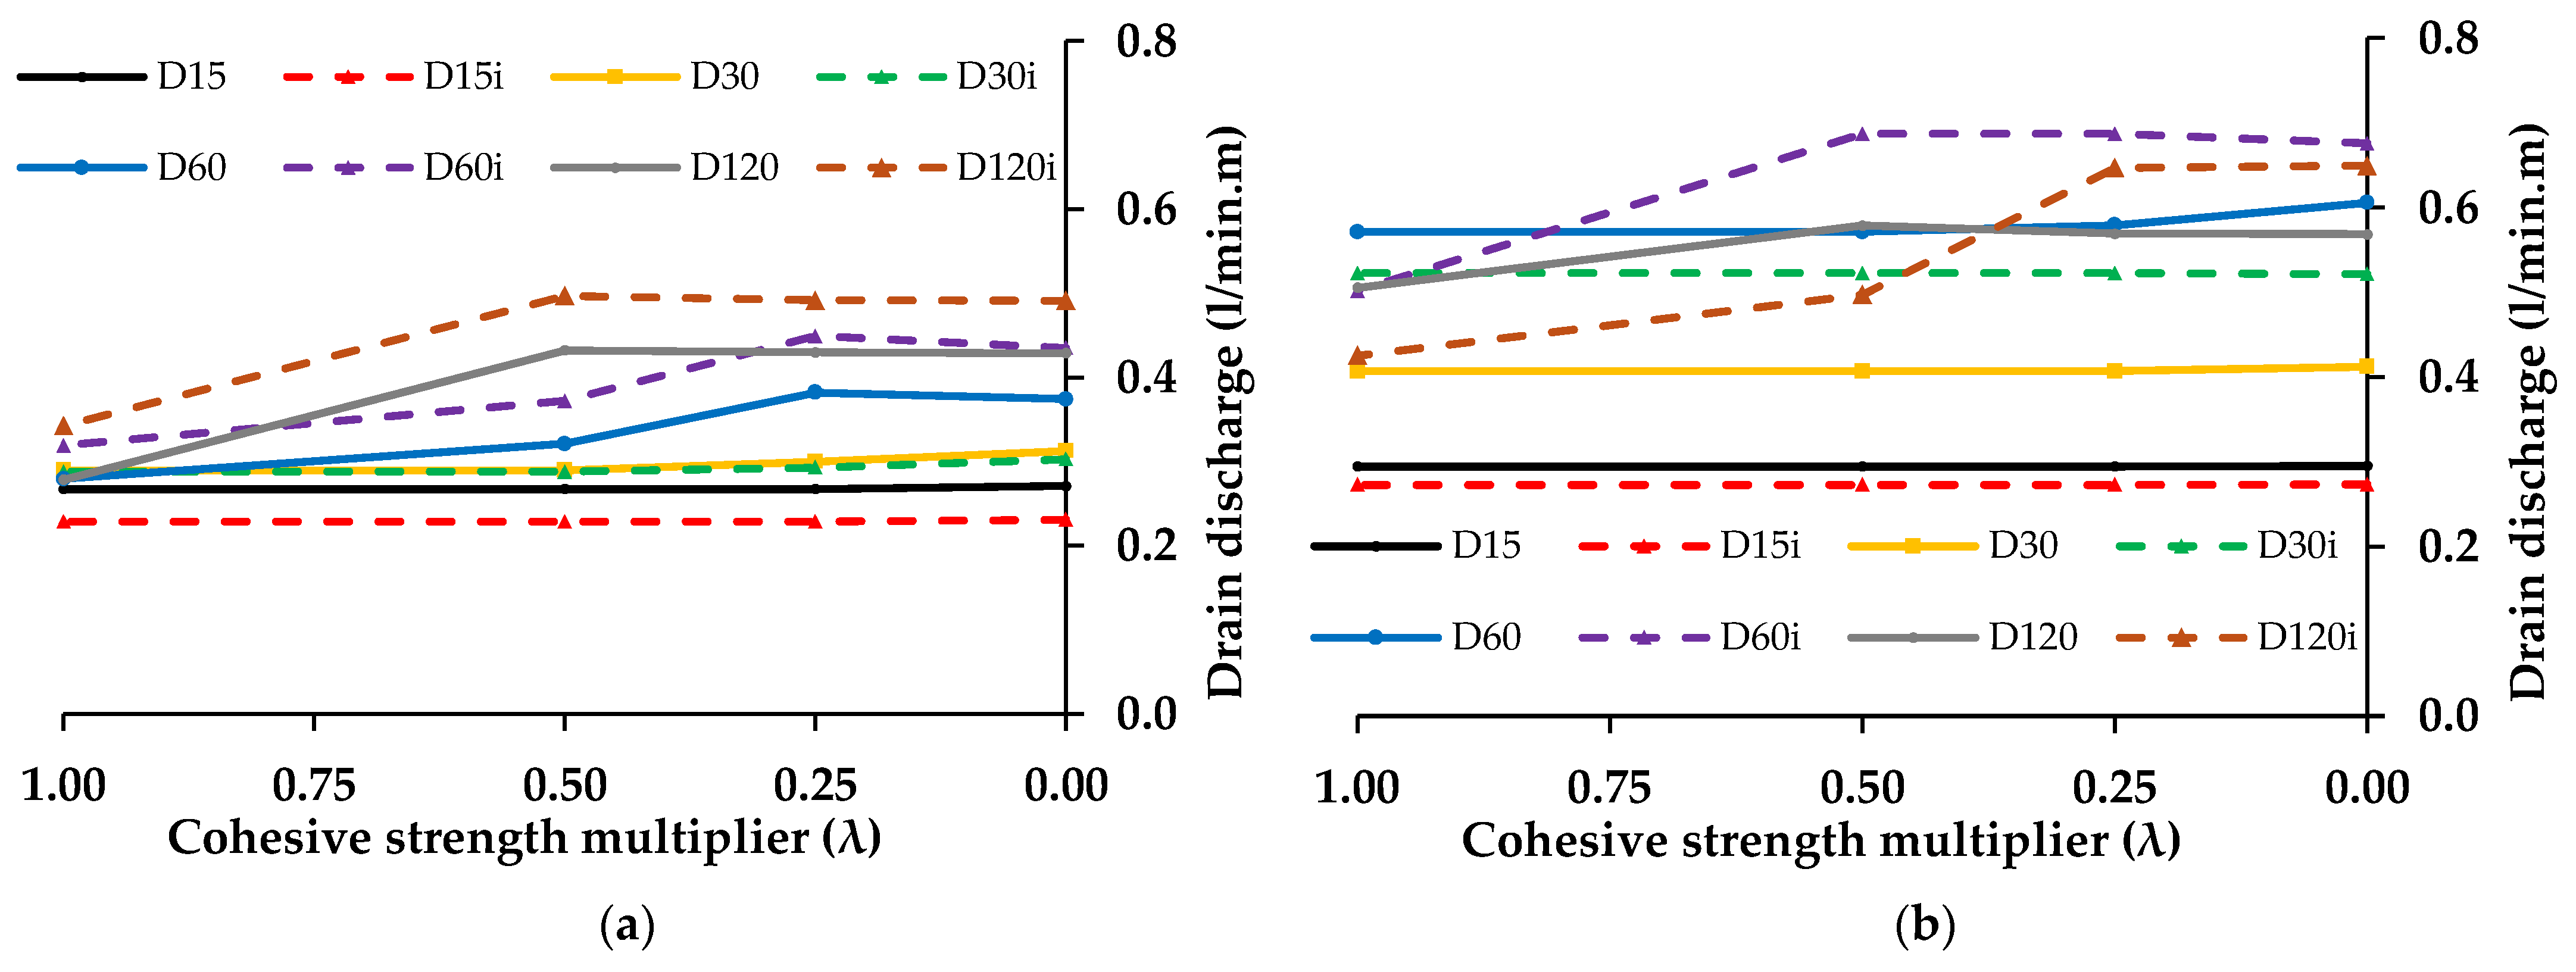
To assess the influence of dam foundation joint strength, numerical analyses were performed assuming at the concrete–rock interface cohesive strength values half and a quarter of those adopted for the reference model, Table 3. An additional calculation was carried out assuming no cohesion or tensile strength at the dam/foundation interface, with a friction angle of 45°, representing a pure friction condition. The variation in the adopted strength parameters can also be understood as the evaluation of a progressive degradation scenario of the concrete–rock interface.
Figure 14a and Figure 14b show the numerically predicted maximum hydraulic drain discharges for the different adopted concrete–rock strength values for elastic and nonlinear brittle foundation behaviours, respectively. As shown, for dam heights higher than 60 m, a degradation of the rock–concrete strength properties leads to a noticeable increase in the predicted drain discharges, which is expected given that the effective stresses are more meaningful in this zone as the dam height increases. The increase in drain discharges is more noticeable for a nonlinear brittle foundation. As presented in Table 7, an increase in the maximum drain discharge of the order of 50% is predicted for the models D120 and D120i for an elastic model and for the model D120i for a nonlinear foundation. The increase in drain discharges is more noticeable when an elastic foundation is considered. This fact may be explained since cracking and associated increase in water seepage at the rock–concrete interface are more influential in an elastic foundation than in a fractured foundation, which has a much higher permeability.
Figure 14c and Figure 14d show the numerically predicted maximum upstream-downstream displacement at the dam crest for the different adopted concrete–rock strength values for elastic and nonlinear brittle foundation behaviours, respectively. Contrary to the response obtained in the hydraulic model, the variation in the concrete–rock strength properties has little influence on the mechanical response. For an elastic foundation, the predicted responses with the regular joint pattern and the inclined joint pattern are very similar; for the nonlinear foundation model, there are slightly more noticeable differences, especially for the higher dams. As shown in Table 7, the differences in the maximum crest displacement to the reference model are below 4% and are more noticeable in the Dam60 and Dam60i for an elastic foundation.
The results presented lead to the conclusion that a degradation of the concrete–rock strength properties has a larger effect on measured drain discharges than on measured displacements, highlighting the relevance of assessing hydraulic measurements in operating dams.

5.1.5. Influence of the Grout Curtain Permeability

In the reference HMM, the grout curtain is assumed to be 10 times less permeable than the surrounding rock mass. The adopted penalty value ensures that the grouted curtain effectively controls the quantity of water that flows through the foundation [39].
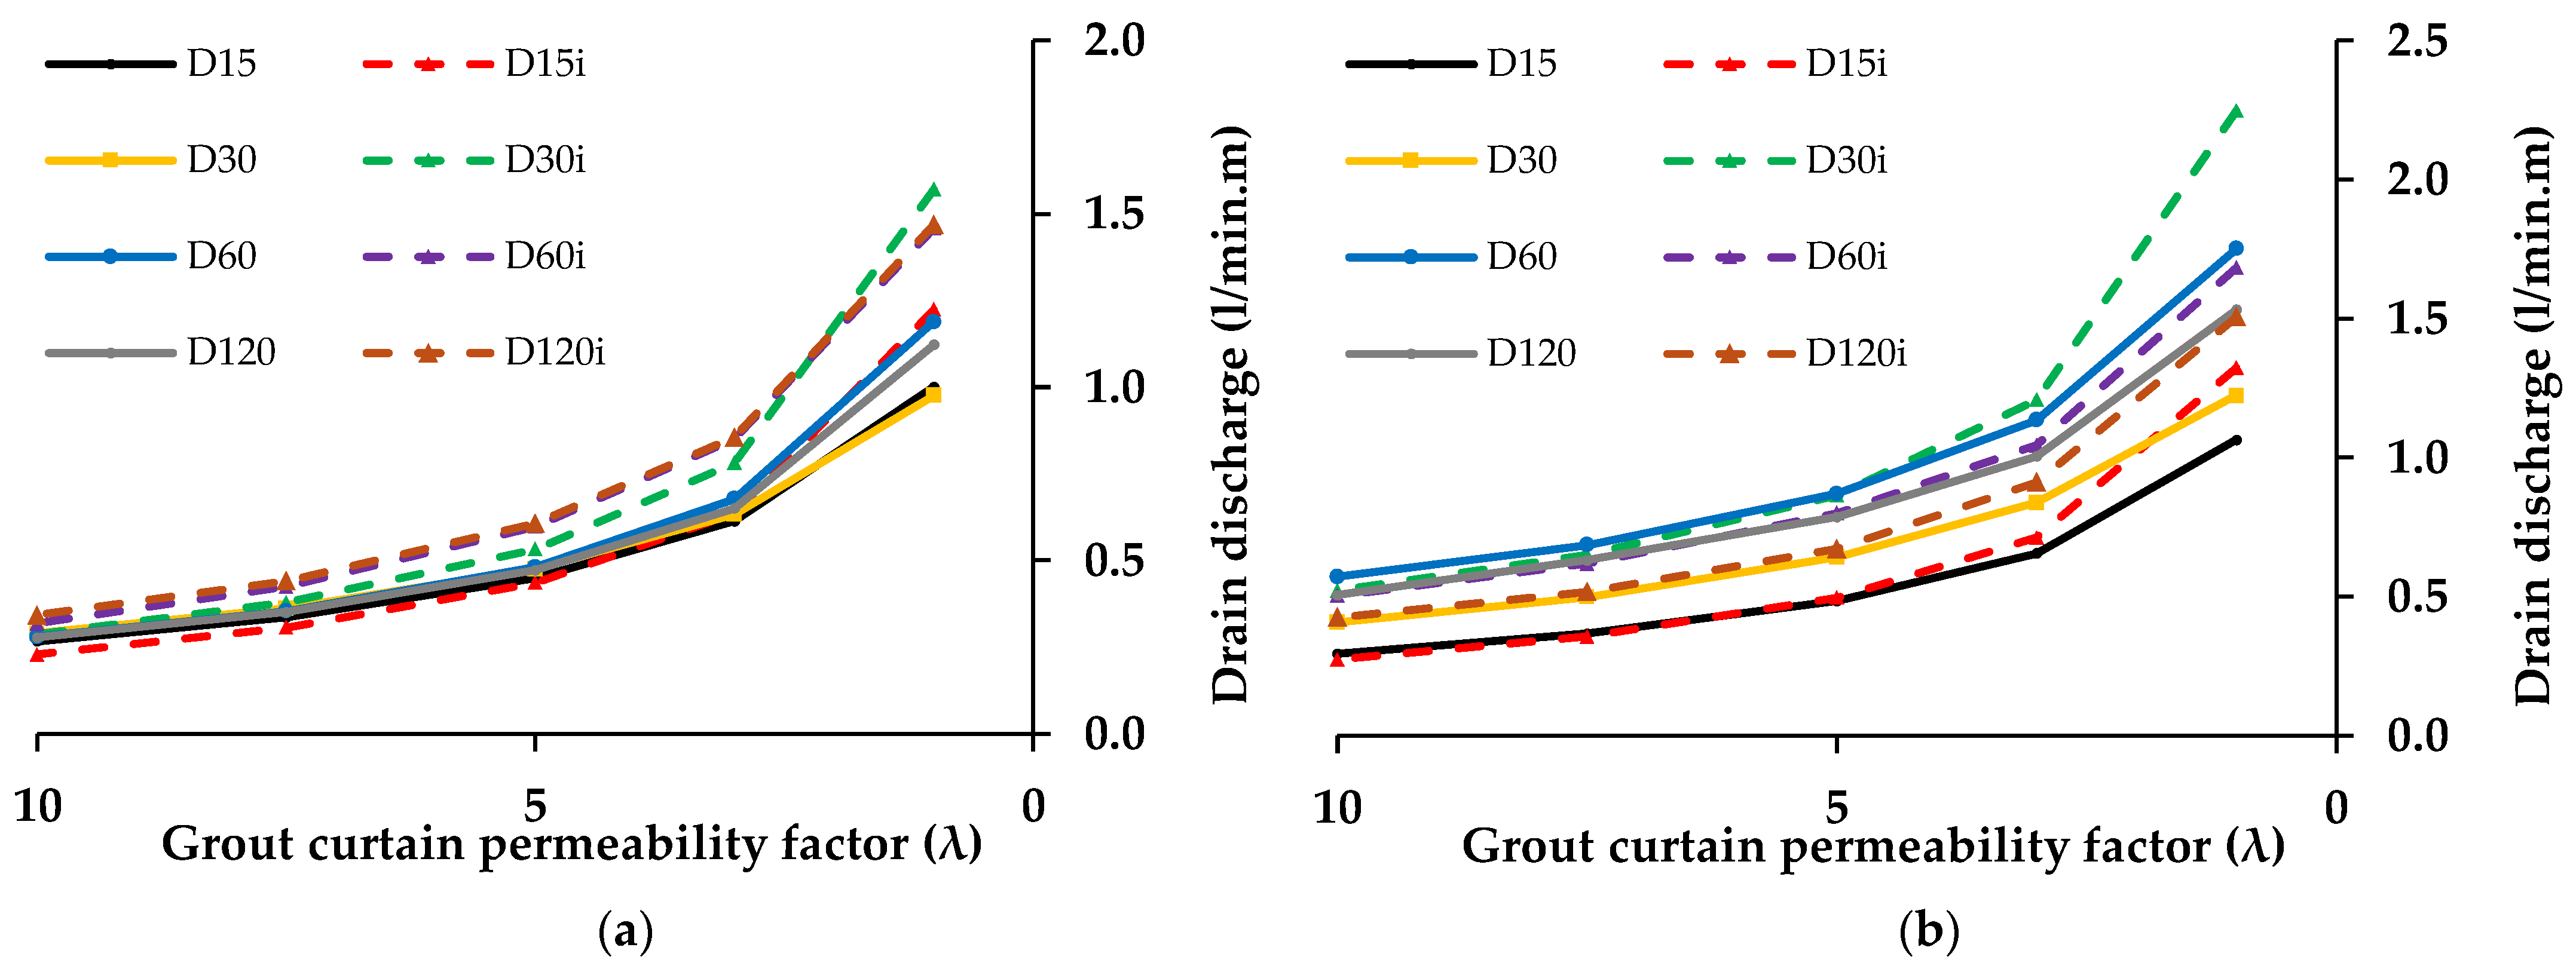
Additional numerical analyses were performed assuming that the grout curtain is 7.5, 5.0, and 3.5 times less permeable than the fractured media and that the grout curtain had the same permeability as that adopted for the rock mass discontinuities (no grout curtain).
Figure 15a and Figure 15b show the numerically predicted maximum hydraulic drain discharges for the different adopted grout curtain permeability multipliers for elastic and nonlinear brittle foundation behaviours, respectively. As shown, a reduction in the grout curtain permeability leads, for both foundation behaviours and in all dam models, to a meaningful increase in the numerically predicted drain discharges. The predicted increase in drain discharges is even more meaningful when the grout curtain reduces from five times less permeable to have a similar permeability to that of the surrounding rock mass (no grout curtain). Table 8 shows the differences in percentage to the maximum drain discharges and to the maximum crest displacement obtained with the grout curtain properties defined in Section 4.2.2. As shown, the highest increase occurs for the elastic foundation behaviour, with approximately 90% increase for a grout curtain five times less permeable and approximately 360% increase for a grout curtain with the same permeability as the surrounding rock mass (no grout curtain).
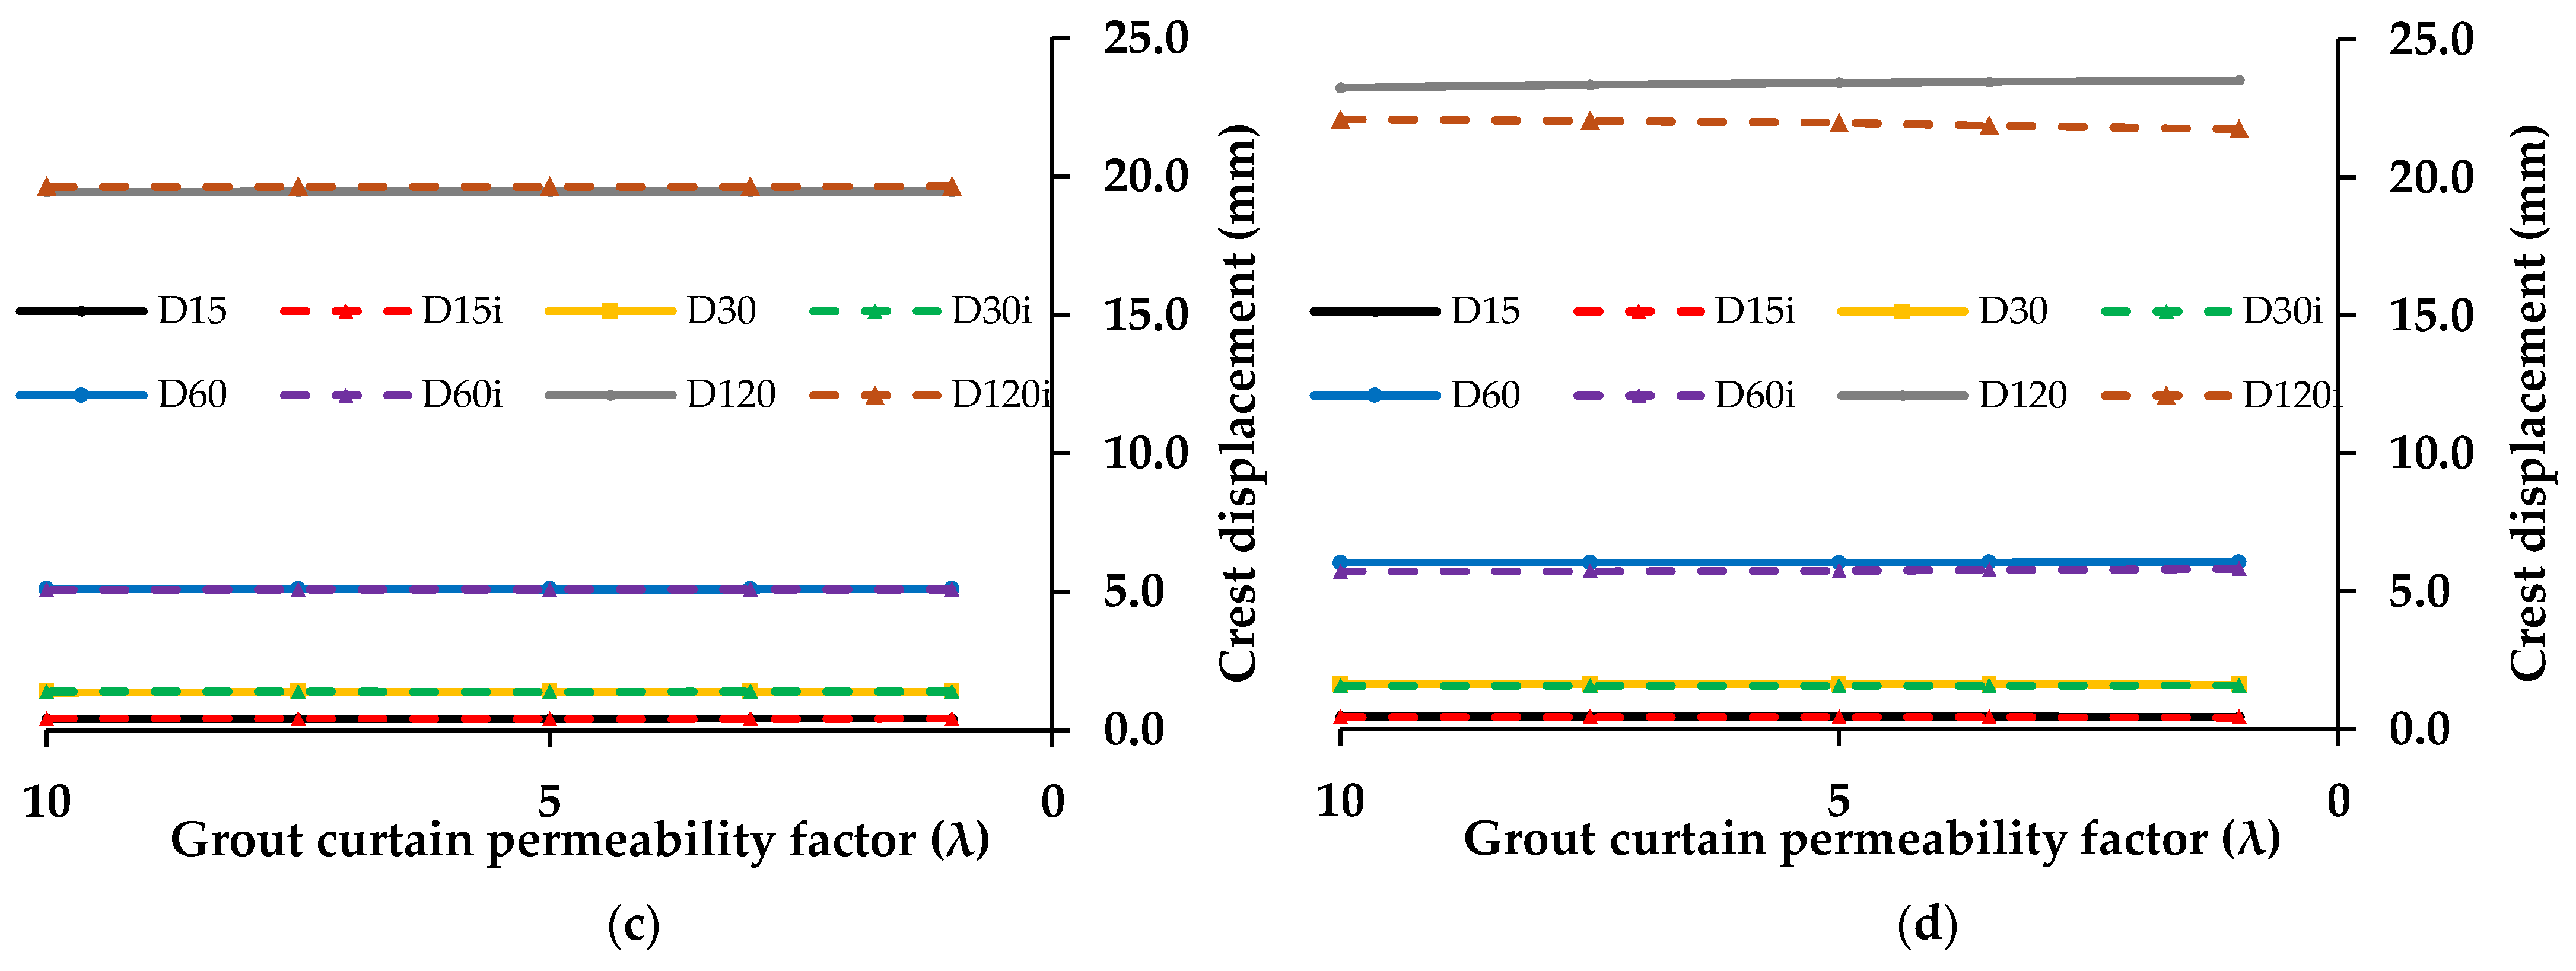
Figure 15c and Figure 15d show the numerically predicted maximum upstream–downstream displacement at the dam crest for different adopted grout curtain permeability values for elastic and nonlinear brittle foundation behaviours, respectively. As shown, the variation in grout curtain permeability has little influence on the mechanical response. For an elastic foundation, the predicted responses with the regular joint pattern and with the inclined joint pattern are similar. With the nonlinear foundation models, there are slightly more noticeable differences, especially for the dam 120 m high. As expected, in higher dams, the installed hydrostatic pressure is associated with higher effective stresses at the dam–foundation interface, namely at the dam heel, and within the dam–foundation in its vicinity, potentiating cracking in these zones. As shown in Table 8b, the differences in the maximum crest displacement to the reference model are below 2% and higher for a nonlinear brittle foundation.
The results presented lead to the conclusion that a degradation of the grout curtain permeability has a larger effect on measured drain discharges than on measured displacements, highlighting the relevance of assessing hydraulic measurements in operating dams. In the long term, the degradation of the grout curtain is associated with higher discharge rates that will deteriorate the elastic and strength properties of the jointed media.

5.2. Pedrógão Dam

For the Pedrógão dam case study, the hydraulic aperture at nominal zero normal stress ( a 0 ) is defined through a calibration procedure for a given set of mechanical parameters. Two foundation behaviours, elastic (E) and brittle (NL), and two normal stiffness values (H1 and H2) were assumed.
As already mentioned in the previous case study, the hydraulic aperture at nominal zero normal stress ( a 0 ) is mostly related to the mechanical interface normal displacement openings, which are directly related to the adopted normal contact stiffness values and to the adopted foundation behaviour.
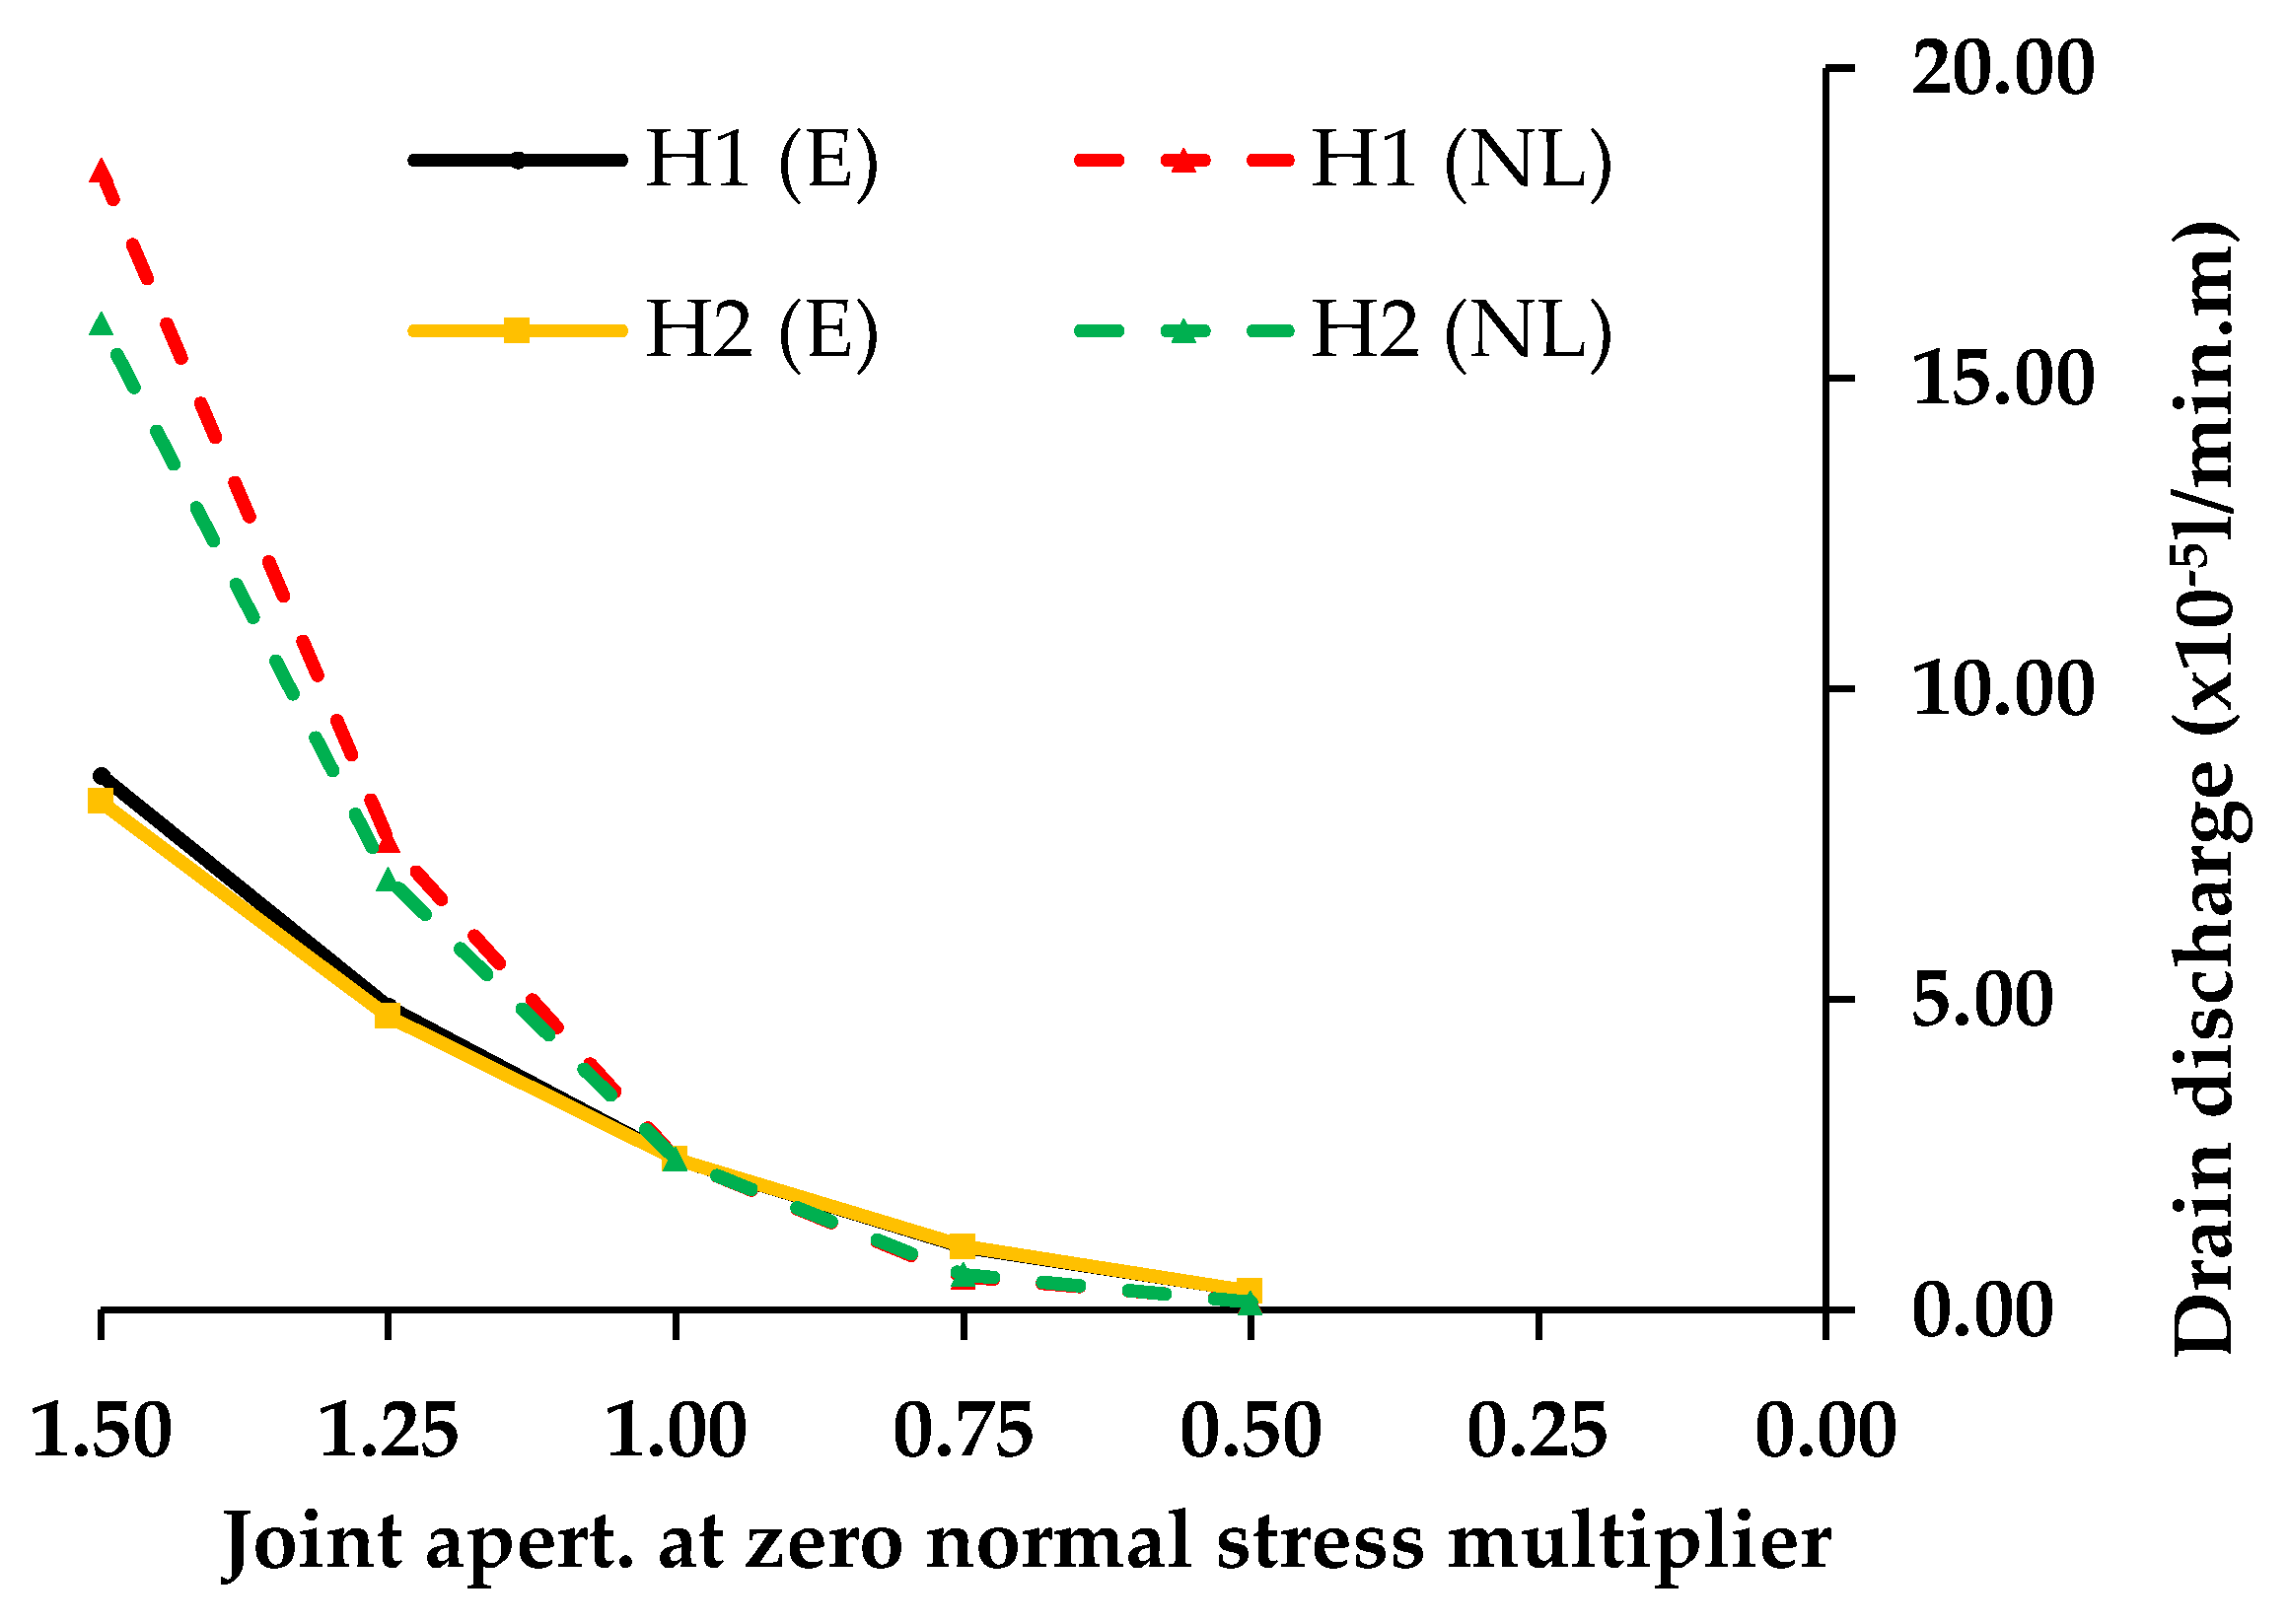
Table 9 presents the calibrated hydraulic aperture at nominal zero normal stress for both foundation behaviours and for normal stiffness values. As shown, it is possible to properly calibrate a 0 to obtain the recorded discharge if the mechanical parameters and the foundation geometry and behaviour are known. Figure 16 shows the numerically predicted drain discharges for a given variation in the calibrated a 0 for both foundation behaviours and normal stiffness values.
As shown in Table 9, for a higher normal stiffness value or for a more brittle foundation, the calibrated values of a 0 are slightly lower. Figure 16 also shows that the adopted foundation behaviour is more influential than the adopted normal stiffness value.
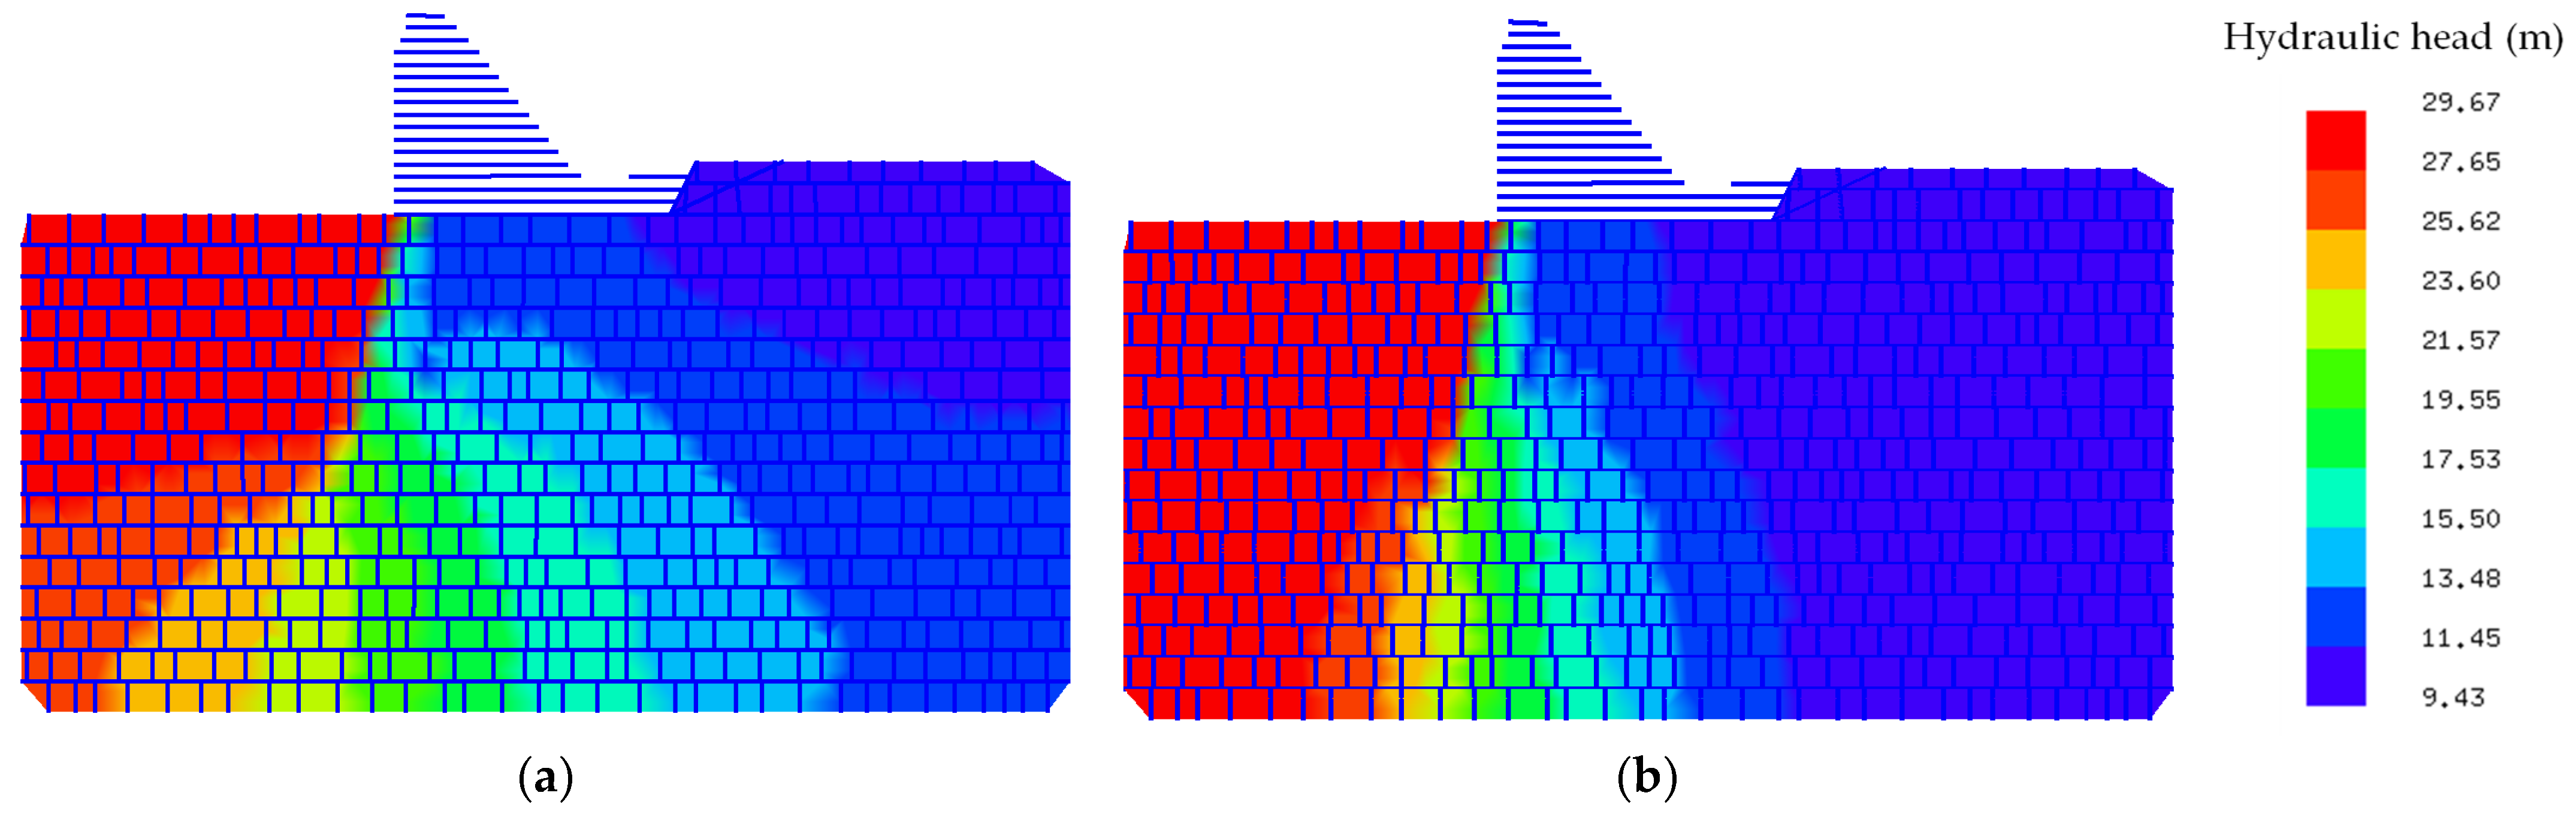
Figure 17 shows the pseudo-equipotentials of piezometric head in the dam foundation obtained for normal stiffness hypothesis H1 for the two foundation behaviours using the calibrated a 0 . The piezometric head is defined using the sea level as the geodetic reference datum. The term pseudo-equipotentials was introduced in [62] and takes into consideration the discrete nature of the flow which occurs along the rock mass foundation discontinuities. The foundation behaviour influence on the hydraulic head distribution is noticeable. As shown, with a nonlinear brittle foundation, higher hydraulic heads are recorded at higher depths and in closer proximity to the dam heel; also, the hydraulic head transition from upstream to downstream conditions is much more localized in a nonlinear brittle foundation. Furthermore, the drainage system also has a visible effect on the hydraulic head.

6. Conclusions

Regarding the case study of four gravity dams of different heights, several key parameters were investigated, including joint pattern, joint stiffness, joint strength, and hydraulic material properties.
With the reference hydromechanical properties, it was found that:
  • The foundation behaviour and the joint pattern influence the HM behaviour. While under an elastic hypothesis, the drain discharges calculated during reservoir filling are very similar to those calculated in the emptying phase, under a nonlinear brittle foundation, and especially for an inclined joint pattern, the differences in the obtained drain discharges during the filling and the emptying of the reservoir are more noticeable, particularly for the higher dams.
  • As the dam height increases, the relationship of the obtained normalized drain discharges to the normalized water level tends to have a higher curvature. The dam height influence on the hydromechanical response is mostly relevant to the development of accurate SEMs, which are used for the safety control of operating dams.
  • The rock–concrete strength properties influence the hydromechanical response. The predicted drain discharges are similar up to the reservoir water level, which causes cracking in the rock–concrete interface at the dam heel, which leads to a sudden increase in the calculated drain discharges. The strength properties are more relevant for an elastic foundation and for higher dams. The results presented highlight the relevance of properly characterizing the dam foundation strength values through in situ testing.
  • Cracking at the rock–concrete interface and nonlinear effects, in general, are easier to identify in the hydraulic parameters, such as drain discharges or hydraulic apertures, than in the predicted displacement field.
Regarding the parametric studies presented here, the following was found:
  • For the ranges of normal stiffness values that were assessed, it was shown that, only for the smallest values ( k n / 10 ), there is a noticeable difference in both hydraulic and hydromechanical response.
  • For the ranges of joint aperture at nominal zero stress that were evaluated, it was found that this parameter has a meaningful effect mainly on the hydraulic model, e.g., drain discharges. It is shown that this hydraulic parameter is critical to ensure accurate hydromechanical modelling results.
  • The variation in the adopted strength parameters, which simulated a progressive degradation scenario of the concrete–rock interface, shows that a degradation of the concrete–rock strength properties has a larger effect on measured drain discharges than on measured displacements, highlighting the relevance of assessing hydraulic measurements in operating dams as a fundamental warning sign for proper control and safety operation.
  • For the ranges of grout curtain permeability penalty values evaluated, it was shown that a potential degradation of the grout curtain permeability has a larger and immediate effect on measured drain discharges than on measured displacements. Like in the strength degradation scenario, this study concerning grout curtain permeability highlights the importance of assessing hydraulic measurements in operating dams for the control and safety of dams. In the long term, the degradation of the grout curtain may be associated with higher discharge rates that will deteriorate the elastic and strength properties of the jointed media.
Regarding the Pedrógão dam case study, it was shown that with the adopted HMM, it is possible to calibrate the hydraulic aperture at nominal zero normal stress ( a 0 ) to predict the in situ measurements of drain discharges given a prior knowledge of the mechanical parameters, namely joint stiffness and strength, the foundation joint pattern, the foundation behaviour, and the location of the grout curtains and drainage system location.
Ongoing research is focused on establishing an SEM that adopts a unified polynomial function that incorporates both the calculated discharge values and the dam height to be used in the control and safety assessment of operating concrete dams.

Author Contributions

Conceptualization: N.M.A. and M.L.B.F.; methodology: N.M.A. and M.L.B.F.; software: N.M.A.; validation: N.M.A., M.L.B.F., and S.O.; writing—original draft preparation: N.M.A. and M.L.B.F.; writing—review and editing: N.M.A., M.L.B.F., and S.O.; supervision: N.M.A. and M.L.B.F.; project administration: N.M.A. and M.L.B.F. All authors have read and agreed to the published version of the manuscript.

Funding

This research received no external funding.

Institutional Review Board Statement

Not applicable.

Informed Consent Statement

Not applicable.

Data Availability Statement

The original contributions presented in the study are included in the article; further inquiries can be directed to the corresponding author.

Acknowledgments

The study presented here is part of the research project StepDam: A step forward for the ability to anticipate and prevent failures of concrete dam foundations (Proc. 0403/1102/24145, included in LNEC’s Research and Innovation Plan 2021–2027).

Conflicts of Interest

The authors declare no conflicts of interest.

Abbreviations

The following abbreviations are used in this manuscript:
BLBilinear vectorial softening contact model
DDADiscontinuous deformation analysis
DEMDiscrete element method
ELElastic behaviour
FDEMCombined finite–discrete element method
FEMFinite element method
HMHydromechanical
HMMHydromechanical model
HNHydraulic node
JEJoint finite elements
MLMachine learning
NLNonlinear brittle behaviour
PPressure on the HNs
QDischarge in SCs
SCSeepage channel
SEMSeparation of effects model
XFEMExtended finite element method

References

  1. ASDSO. Dam Failure and Incident Investigation Guide, Version 2.0; Association of State Dam Safety Officials: Lexington, Kentucky, 2021. [Google Scholar]
  2. Malm, R. Guideline for FE Analyses of Concrete Dams, Stockholm, Sweden, 2016. Available online: www.energiforsk.se (accessed on 14 February 2025).
  3. Hellgren, R.; Malm, R.; Ansell, A. Progressive failure analysis of a concrete dam anchored with passive rock bolts. Infrastructures 2020, 5, 28. [Google Scholar] [CrossRef] [Scilit]
  4. Vulliet, F.; Ftima, M.B.; Léger, P. Stability of cracked concrete hydraulic structures by nonlinear quasi-static explicit finite element and 3D limit equilibrium methods. Comput. Struct. 2017, 184, 25–35. [Google Scholar] [CrossRef] [Scilit]
  5. Enzell, J.; Ulfberg, A.; Sas, G.; Malm, R. Post-Peak Behavior of Concrete Dams Based on Nonlinear Finite Element Analyses. Eng. Fail. Anal. 2021, 130, 105778. [Google Scholar] [CrossRef] [Scilit]
  6. Li, W.; Wu, W.; Zhang, J. Numerical stability analysis of the dam foundation under complex geological conditions at great depth: A case study of Kala Hydropower Station, China. Front. Phys. 2021, 9, 808840. [Google Scholar] [CrossRef] [Scilit]
  7. Wang, D.; Lu, X.; Zheng, C.; Gong, K.; Pan, L.; Pei, L.; Zhao, Z. Influence Analysis of Material Parameter Uncertainties on the Stability Safety Factor of Concrete Gravity Dams: A Probabilistic Method. Buildings 2024, 14, 2435. [Google Scholar] [CrossRef] [Scilit]
  8. Câmara, R.C. A method for coupled arch dam-foundation-reservoir seismic behavior analysis. Earthq. Eng. Struct. Dyn. 2000, 29, 441–460. [Google Scholar] [CrossRef]
  9. Lokke, A.; Chopra, A.K. Direct Finite Element Method for Nonlinear Earthquake Analysis of 3-Dimensional Semi-Unbounded Dam–Water-Foundation Rock Systems. Earthq. Eng. Struct. Dyn. 2018, 47, 1309–1328. [Google Scholar]
  10. Robbe, E.; Kashiwayanagi, M.; Yamane, Y. Seismic Analyses of Concrete Dam, Comparison between Finite-Element Analyses and Seismic Records. In Proceedings of the 16th World Conference on Earthquake Engineering, Santiago, Chile, 9–17 January 2017. [Google Scholar]
  11. Salazar, F.; Vicente, D.J.; Irazábal, J.; De-Pouplana, I.; San Mauro, J. A Review on Thermo-mechanical Modelling of Arch Dams during Construction and Operation: Effect of the Reference Temperature on the Stress Field. Arch. Computat. Methods Eng. 2020, 27, 1681–1707. [Google Scholar]
  12. Leitão, N.S.; Castilho, E. Chemo-Thermo-Mechanical FEA as a Support Tool for Damage Diagnostic of a Cracked Concrete Arch Dam: A Case Study. Eng 2023, 4, 1265–1289. [Google Scholar] [CrossRef] [Scilit]
  13. Electric Power Research Institute. Uplift Pressures, Shear Strengths, and Tensile Strengths for Stability Analysis of Concrete Gravity Dams; Electric Power Research Institute: Palo Alto, CA, USA, 1992. [Google Scholar]
  14. Liu, Y.; Huang, D.; Zhao, B.; Wang, C.; Cen, D. Nonlinear creep behavior and viscoelastic-plastic constitutive model of rock-concrete composite mass. Adv. Civ. Eng. 2020, 2020, 9059682. [Google Scholar] [CrossRef] [Scilit]
  15. Dong, W.; Wu, Z.; Zhou, X. Fracture Mechanisms of Rock-Concrete Interface: Experimental and Numerical. J. Eng. Mech. 2016, 142, 04016040. [Google Scholar] [CrossRef] [Scilit]
  16. Dong, W.; Wu, Z.; Zhou, X.; Wang, N.; Kastiukas, G. An experimental study on crack propagation at rock-concrete interface using digital image correlation technique. Eng. Fract. Mech. 2017, 171, 50–63. [Google Scholar] [CrossRef] [Scilit]
  17. Dong, Z.; Lin, T.; Tang, S.; Lang, Y.; Yuan, R.; Heng, S. Mechanical properties and failure mechanism of concrete-granite composite specimens under compression load. Constr. Build. Mater. 2024, 435, 136768. [Google Scholar] [CrossRef] [Scilit]
  18. Lopez, P.; Thoraval, A.; Buzzi, O.; Rahmani, I.; Boulon, M. Advances in constitutive modelling of jointed rock hydro mechanical interactions at laboratory scale. In Proceedings of the 18. Congrès Français de Mécanique—14. Colloque Franco-Polonais “Mécanique des Sols et des Roches”, Grenoble, France, 27–31 August 2007. [Google Scholar]
  19. Alonso, E.E.; Zandarín, M.T.; Olivella, S. Joints in unsaturated rocks: Thermo-hydro-mechanical formulation and constitutive behaviour. J. Rock Mech. Geotech. Eng. 2013, 5, 200–213. [Google Scholar] [CrossRef] [Scilit]
  20. Zandarin, M.T.; Alonso, E.; Olivella, S. A constitutive law for rock joints considering the effects of suction and roughness on strength parameters. Int. J. Rock Mech. Min. 2013, 60, 333–344. [Google Scholar] [CrossRef] [Scilit]
  21. Li, Y.; Oh, J.; Mitra, R.; Hebblewhite, B. A constitutive model for a laboratory rock joint with multi-scale asperity degradation. Comput. Geotech. 2016, 72, 143–151. [Google Scholar] [CrossRef] [Scilit]
  22. Valente, S.; Barpi, F. On singular points in mixed-mode cohesive crack propagation. Trans. Eng. Sci. 1994, 6, 167–174. [Google Scholar]
  23. Barpi, F.; Valente, S. Numerical simulation of prenotched gravity dam models. J. Eng. Mech. 2000, 126, 611–619. [Google Scholar] [CrossRef] [Scilit]
  24. Shi, Z.; Suzuki, M.; Nakano, M. Numerical analysis of multiple discrete cracks in concrete dams using Extended Fictitious Crack Model. J. Struct. Eng. 2003, 129, 324–336. [Google Scholar] [CrossRef] [Scilit]
  25. Hariri-Ardebili, M.A.; Seyed-Kolbadi, S.M.; Mirzabozorg, H. A smeared crack model for seismic failure analysis of concrete gravity dams considering fracture energy effects. Struct. Eng. Mech. 2013, 48, 17–39. [Google Scholar] [CrossRef] [Scilit]
  26. Carpinteri, A.; Valente, S.; Ferrara, G.; Imperato, L. Experimental and numerical fracture modelling of a gravity dam. In Fracture Mechanics of Concrete Structures, 1st ed.; Science, E.A., Ed.; CRC Press: London, UK, 1992; pp. 351–360. [Google Scholar]
  27. Zhu, H.-H.; Yin, J.-H.; Dong, J.-H.; Zhang, L. Physical modelling of sliding failure of concrete gravity dam under overloading condition. Geomech. Eng. 2010, 2, 89–106. Available online: http://www.paper.edu.cn (accessed on 4 September 2025). [CrossRef] [Scilit]
  28. Ribeiro, P.M.V.; Léger, P. On a Benchmark Problem for Modeling and Simulation of Concrete Dams Cracking Response. Infrastructures 2023, 8, 50. [Google Scholar] [CrossRef] [Scilit]
  29. Enzell, J.; Nordström, E.; Sjölander, A.; Ansell, A.; Malm, R. Physical model tests of concrete buttress dams with failure imposed by hydrostatic water pressure. Water 2023, 15, 3627. [Google Scholar] [CrossRef] [Scilit]
  30. Willm, G.; Beaujoint, N. Les Methods de Surveillance des Barrages au Service de la Production Hydraulique d’Eléctricité de France. Problèms Anciens et Solutions Nouvelles. In Proceedings of the 9th International Congress on Large Dams, Istanbul, Turkey, 4–8 September 1967. [Google Scholar]
  31. Salazar, F.; Morán, R.; Toledo, M.A.; Oñate, E. Data-Based Models for the Prediction of Dam Behaviour: A Review and Some Methodological Considerations. Arch. Comput. Methods Eng. 2017, 24, 1–21. [Google Scholar] [CrossRef] [Scilit]
  32. Li, S.; Zhang, B.; Yang, M.; Li, S.; Liu, Z. A New Prediction Model of Dam Deformation and Successful Application. Buildings 2025, 15, 818. [Google Scholar] [CrossRef] [Scilit]
  33. Santillán, D.; Fraile-Ardanuy, J.; Toledo, M. Dam seepage analysis based on artificial neural networks: The hysteresis phenomenon. In Proceedings of the International Joint Conference on Neural Networks, Dallas, TX, USA, 4–9 August 2013; pp. 1–8. [Google Scholar] [CrossRef] [Scilit]
  34. Callari, C.; Fois, N.; Cicivelli, R. The role of hydro-mechanical coupling in the behaviour of dam-foundation system. In Proceedings of the Computational Mechanics in conjunction with the Second Asian-Pacific Congress on Computational Mechanics, Beijing, China, 5–10 September 2004. [Google Scholar]
  35. Zhang, W.; Li, H.; Shi, D.; Shen, Z.; Zhao, S.; Guo, C. Determination of Safety Monitoring Indices for Roller-Compacted Concrete Dams Considering Seepage–Stress Coupling Effects. Mathematics 2023, 11, 3224. [Google Scholar] [CrossRef] [Scilit]
  36. Rampal, A.; Halder, P.; Manna, B.; Sharma, K.G. Static and Coupled Hydro-mechanical Analyses of Concrete Gravity Dam Resting on Jointed Rock Foundation. Geotech. Geol. Eng. 2020, 38, 4111–4127. [Google Scholar] [CrossRef] [Scilit]
  37. Farinha, M.L.B.; Lemos, J.; Neves, E.M. Analysis of foundation sliding of an arch dam considering the hydromechanical behavior. Front. Struct. Civ. Eng. 2012, 6, 35–43. [Google Scholar] [CrossRef] [Scilit]
  38. Farinha, M.L.B.; Lemos, J.; Neves, E.M. Numerical modelling of borehole water-inflow tests in the foundation of the Alqueva arch dam. Can. Geotech. J. 2010, 48, 72–88. [Google Scholar] [CrossRef] [Scilit]
  39. Farinha, M.L.B.; Azevedo, N.M.; Candeias, M. Small Displacement Coupled Analysis of Concrete Gravity Dam Foundations: Static and Dynamic Conditions. Rock Mech. Rock Eng. 2017, 50, 439–464. [Google Scholar] [CrossRef] [Scilit]
  40. Farinha, M.L.B.; Azevedo, N.M.; Schclar Leitão, N.A.; Rocha de Almeida, J.; Oliveira, S. Sliding Stability Assessment of Concrete Dams Using a 3D Discontinuum Hydromechanical Model Following a Discrete Crack Approach. Geotechnics 2022, 2, 133–157. [Google Scholar] [CrossRef] [Scilit]
  41. Cammarata, G.; Fidelibus, C.; Cravero, M.; Barla, G. The hydro-mechanically coupled response of rock fractures. Rock Mech. Rock Eng. 2007, 40, 41–61. [Google Scholar] [CrossRef] [Scilit]
  42. Yan, C.; Zheng, H. A two-dimensional coupled hydro-mechanical finite-discrete model considering porous media flow for simulating hydraulic fracturing. Int. J. Rock Mech. Min. 2016, 88, 115–128. [Google Scholar] [CrossRef] [Scilit]
  43. Yan, C.; Jiao, Y.Y.; Zheng, H. A fully coupled three-dimensional hydro-mechanical finite discrete element approach with real porous seepage for simulating 3D hydraulic fracturing. Comput. Geotech. 2018, 96, 73–89. [Google Scholar] [CrossRef] [Scilit]
  44. Yan, C.; Xie, X.; Ren, Y.; Ke, W.; Wang, G. A FDEM-based 2D coupled thermal-hydro-mechanical model for multiphysical simulation of rock fracturing. Int. J. Rock Mech. Min. 2022, 149, 104964. [Google Scholar] [CrossRef] [Scilit]
  45. Yan, C.; Zhao, Z.; Yang, Y.; Zheng, H. A three-dimensional thermal-hydro-mechanical coupling model for simulation of fracturing driven by multiphysics. Comput. Geotech. 2023, 155, 105162. [Google Scholar] [CrossRef] [Scilit]
  46. Zhang, Q.-H.; Shi, G.-H. Verification of a DDA-based hydro-mechanical model and its application to dam foundation stability analysis. Int. J. Rock Mech. Min. 2021, 138, 104627. [Google Scholar] [CrossRef] [Scilit]
  47. Deng, Y.; Wang, D.; Jin, Y.; Xia, Y. A fully coupled hydro-mechanical approach for multi-fracture propagation simulations. Energies 2023, 16, 1601. [Google Scholar] [CrossRef] [Scilit]
  48. ITASCA. UDEC—Universal Distinct Element Code, version 4.0; ITASCA: Minneapolis, MN, USA, 2004. [Google Scholar]
  49. Goodman, R.; Taylor, R.; Brekke, T. A model for the mechanics of jointed rock. J. Soil Mech. Found. Div. ASCE 1968, 94, 637–659. [Google Scholar] [CrossRef] [Scilit]
  50. Hohberg, J. A Joint Element for the Nonlinear Dynamic Analysis of Arch Dams; ETH, Institute of Structural Engineering: Zurich, Switzerland, 1992. [Google Scholar]
  51. Farinha, M.L.B.; Azevedo, N.M.; Oliveira, S. Safety assessment of concrete gravity dams: Hydromechanical coupling and fracture propagation. Geosciences 2025, 15, 149. [Google Scholar] [CrossRef] [Scilit]
  52. Azevedo, N.M.; Pinho, F.F.S.; Cismasiu, I.; Souza, B. Prediction of Rubble-Stone Masonry Walls Response under Axial Compression Using 2D Particle Modelling. Buildings 2022, 12, 1283. [Google Scholar] [CrossRef] [Scilit]
  53. Caballero, A.; William, K.J.; Carol, I. Consistent tangent formulation for 3D interface modelling of cracking/fracture in quasi-brittle materials. Comput. Methods Appl. Mech. Eng. 2008, 197, 2804–2822. [Google Scholar] [CrossRef] [Scilit]
  54. Caballero, A.; Carol, C.; López, Z. A meso-level approach to the 3D numerical analysis of cracking and fracture of concrete materials. Fatigue Fract. Eng. Mater. Struct. 2006, 29, 979–991. [Google Scholar] [CrossRef] [Scilit]
  55. Louis, C.A. Study of Groundwater Flow in Jointed Rock and Its Influence on the Stability of Rock Masses. Ph.D. Thesis, Imperial College London, London, UK, 1969. [Google Scholar]
  56. Louis, C.; Maini, Y.N. Determination of in situ hydraulic parameters in jointed rock. In Proceedings of the 2nd International Congress on Rock Mechanics, Belgrade, Serbia, 21–26 September 1970; pp. 235–245. [Google Scholar]
  57. Snow, D.T. A Parallel Plate Model of Fractured Permeable Media. Ph.D. Thesis, University of California, Berkeley, CA, USA, 1965. [Google Scholar]
  58. Bear, J. Dynamics of Fluids in Porous Media; Dover Publications Inc.: New York, NY, USA, 1988. [Google Scholar]
  59. Lemos, J.V. Representation of rock discontinuities in safety analysis of large dams. In Proceedings of the 2014 ISRM European Rock Mechanics Symposium (EUROCK 2014), Vigo, Spain, 27–29 May 2014; Taylor and Francis Group: London, UK, 2014. [Google Scholar]
  60. Zhong, H.; Ooi, E.T.; Song, C.; Ding, T.; Lin, G.; Li, H. Experimental and numerical study of the dependency of interface fracture in concrete–rock specimens on mode mixity. Eng. Fract. Mech. 2014, 124, 287–309. [Google Scholar] [CrossRef] [Scilit]
  61. Dong, W.; Yang, D.; Zhang, B.; Wu, Z. Rock-Concrete Interfacial Crack Propagation under Mixed Mode I–II Fracture. J. Eng. Mech. 2018, 144, 04018039. [Google Scholar] [CrossRef] [Scilit]
  62. Kafritsas, J.C. Coupled Flow/Deformation Analysis of Jointed Rock with the Distinct Element Method. Ph.D. Thesis, Massachusetts Institute of Technology, Cambridge, MA, USA, 1987. [Google Scholar]
Figure 1. Mechanical and hydraulic models for a two-block interaction: (a) mechanical model showing blocks, nodes, plane element finite elements, and joint finite elements; (b) hydraulic model showing hydraulic nodes (HN), seepage channels (SC), pressures on the hydraulic nodes (P), and discharges in seepage channels (Q).
Applmech 07 00008 g001
Figure 2. Hydraulic aperture of a given SC as a function of the hydraulic aperture at nominal zero normal stress a 0   and the mechanical opening u n bounded by a minimum and a maximum value.
Applmech 07 00008 g002
Figure 3. Two-way sequential coupling between mechanical and hydraulic models. Mechanical joint displacements control hydraulic apertures, while hydraulic pressures are fed back to the mechanical model as effective stresses at each timestep.
Applmech 07 00008 g003
Figure 4. Case study of four gravity dams of different heights—dam–foundation model dimensions in terms of the dam height (H) and crest thickness (a).
Applmech 07 00008 g004
Figure 5. Hydromechanical discontinuum model of the dam/foundation system of the 60 m high dams: (a) D60 dam–foundation blocks; (b) D60i dam–foundation blocks; (c) D60 mechanical model: joint finite elements and triangular plane finite elements; (d) D60i mechanical model: joint finite elements and triangular plane finite elements (e) D60 hydraulic model: seepage channels and hydraulic nodes and (f) D60i hydraulic model: seepage channels and hydraulic nodes.
Applmech 07 00008 g005
Figure 6. Hydromechanical discontinuum model of the dam/foundation system of Pedrogão Dam: (a) mechanical model featuring joint finite elements and triangular plane finite elements; (b) hydraulic model featuring seepage channels and hydraulic nodes.
Applmech 07 00008 g006
Figure 7. Calculated drain discharges during the process of filling and emptying the reservoir for the reference model hydromechanical parameters: (a) foundation with linear elastic behaviour; (b) foundation with nonlinear brittle behaviour; (c) foundation with linear elastic behaviour normalized to maximum values; and (d) foundation with nonlinear brittle behaviour normalized to maximum values.
Applmech 07 00008 g007
Figure 8. Statistics regarding calculated hydraulic apertures and mechanical opening during the process of filling and emptying the reservoir for the D120i model with the reference model hydromechanical parameters: (a) hydraulic apertures—elastic foundation; (b) hydraulic apertures—nonlinear brittle foundation; (c) mechanical opening—elastic foundation; and (d) mechanical opening—nonlinear brittle foundation.
Applmech 07 00008 g008
Figure 9. Statistics regarding the calculated hydraulic apertures and mechanical opening during the process of filling and emptying the reservoir for the D15 model with the reference model hydromechanical parameters: (a) hydraulic apertures—elastic foundation; (b) hydraulic apertures—nonlinear brittle foundation; (c) mechanical opening—elastic foundation; and (d) mechanical opening—nonlinear brittle foundation.
Applmech 07 00008 g009
Figure 10. Calculated upstream–downstream displacement along the dam elevation during the process of filling and emptying the reservoir for the D120i model with the reference model hydromechanical parameters: (a) elastic foundation; (b) nonlinear brittle foundation.
Applmech 07 00008 g010
Figure 11. Calculated upstream–downstream displacement along the dam elevation during the process of filling and emptying the reservoir for the D15 model with the reference model hydromechanical parameters: (a) elastic foundation; (b) nonlinear brittle foundation.
Applmech 07 00008 g011
Figure 12. Calculated hydraulic maximum discharges and maximum crest displacements for the adopted normal stiffness variation: (a) hydraulic discharges for elastic foundation; (b) hydraulic discharges for nonlinear brittle foundation; (c) crest displacement for elastic foundation; and (d) crest displacement for a nonlinear brittle foundation.
Applmech 07 00008 g012
Figure 13. Calculated maximum drain discharges and maximum crest displacements for the adopted joint aperture at nominal zero normal stress variation: (a) drain discharges for elastic foundation; (b) drain discharges for nonlinear brittle foundation; (c) crest displacement for elastic foundation; and (d) crest displacement for a nonlinear brittle foundation.
Applmech 07 00008 g013
Figure 14. Calculated maximum drain discharges and maximum crest displacements for the adopted concrete-rock strength values: (a) drain discharges for elastic foundation; (b) drain discharges for nonlinear brittle foundation; (c) crest displacement for elastic foundation; and (d) crest displacement for a nonlinear brittle foundation.
Applmech 07 00008 g014aApplmech 07 00008 g014b
Figure 15. Calculated hydraulic maximum discharges and maximum crest displacements for the adopted grout curtain permeability value: (a) hydraulic discharges for elastic foundation; (b) hydraulic discharges for nonlinear brittle foundation; (c) crest displacement for elastic foundation; and (d) crest displacement for a nonlinear brittle foundation.
Applmech 07 00008 g015aApplmech 07 00008 g015b
Figure 16. Calculated drain discharges for 0.50, 0.75, 1.0, 1.25, and 1.5 times the calibrated value of the hydraulic aperture at nominal zero normal stress ( a 0 ).
Applmech 07 00008 g016
Figure 17. Piezometric head pseudo-equipotential contours of Pedrogão Dam: (a) H1 (E) and (b) H1 (NL).
Applmech 07 00008 g017
Table 1. Case study of four gravity dams of different heights—dam height and crest thickness.
Dam ModelH (m)a (m)
Dam 15154.0
Dam 30306.0
Dam 60607.5
Dam 12012010.0
Table 2. Characteristics of the hydromechanical discontinuum numerical models—four gravity dams of different heights.
Dam ModelMechanical ModelHydraulic Model
BlocksNodesFE Triangular ElementsFE Joint ElementsHydraulic NodesSeepage Channels
D1538311,98915,549359531223411
D15i41111,99915,184375732513573
D3038611,96315,428362531593449
D30i42412,03915,187378432943608
D6038911,96315,389364431793473
D60i43511,96415,091376432673579
D12039012,08415,543368732233518
D120i43111,97015,079376532833596
Table 3. Mechanical model, elastic and strength properties—reference model for four gravity dams of different heights: (a) triangular plane FEs; (b) joint FEs.
(a)
Material E (GPa) υ (-) ρ (kg/m3)
Dam Concrete30.30.242.4
Rock Mass64.40.202.7
(b)
Interface k n (GPa/m) k s (GPa/m) σ t
(MPa)
C m a x (MPa) μ c (-) G I (Nm/m2) G I I Nm/m2)
Concrete–Concrete60.624.22.885.761.087.0435.0
Concrete–Rock128.851.51.372.741.024.7123.3
Rock–Rock128.851.50.00.0---
Table 4. Hydromechanical reference properties: maximum drain discharges for elastic and nonlinear brittle foundation.
Foundation
Behaviour
D 15 D 15 i D 30 D 30 i D 60 D 60 i D 120 D 120 i
EL0.2670.2280.2900.2880.2790.3190.2780.342
NL0.2950.2730.4070.5220.5710.5020.5050.425
% Increase10.219.440.581.5104.557.381.624.2
Table 5. Equivalent deformability of the assumed rock masses 1.
Joint Normal StiffnessEquivalent Deformability (GPa/m)
k n (GPa/m)D15 and D15iD30 and D30iD60 and D60iD120 and D120i
k n / 10 21.5 (−60.0)32.2 (−45.0)42.9 (−30.0)51.5 (−18.0)
3   k n / 10 38.6 (−34.0)48.3 (−21.3)55.2 (−12.1)59.4 (−6.5)
k n / 2 46.0 (−14.3)53.7 (−8.3)58.5 (−4.5)61.3 (−2.4)
3   k n / 4 50.8 (10.5)56.8 (5.9)60.4 (3.1)62.3 (1.6)
k n 53.7 (-)58.5 (-)61.3 (-)62.8 (-)
2   k n 58.5 (9.1)61.3 (4.8)62.8 (2.4)63.6 (1.2)
10   k n 63.8 (18.8)64.1 (9.5)64.2 (4.7)64.3 (2.4)
1 The differences, in percentage, to the equivalent deformability obtained with the reference properties presented in Table 3 are shown in brackets.
Table 6. Joint aperture at nominal zero normal stress influence—differences in percentage to the maximum drain discharges and to the maximum crest displacement obtained with the strength properties defined in Table 3 1: (a) elastic foundation; (b) nonlinear brittle foundation.
(a)
a 0
Multiplier
D 15 D 15 i D 30 D 30 i D 60 D 60 i D 120 D 120 i
0.2−99.1 (0.3)−99.1 (0.1)−99.1 (0.2)−99.1 (0.2)−99.1 (0.2)−98.9 (0.2)−99.1 (0.2)−99.3 (0.2)
0.5−87.0 (0.0)−87.1 (0.0)−87.2 (0.0)−86.9 (0.0)−86.9 (0.1)−85.8 (0.1)−86.2 (0.1)−92.3 (0.0)
1.00.0 (0.0)0.0 (0.0)0.0 (0.0)0.0 (0.0)0.0 (0.0)0.0 (0.0)0.0 (0.0)0.0 (0.0)
2.0699.7 (−0.2)686.2 (0.0)690.3 (0.0)679.9 (0.0)664.3 (0.0)624.3 (0.0)640.1 (0.0)216.4 (0.0)
3.54160.7 (−0.2)4081.7 (0.0)4112.4 (0.0)4032.6 (0.0)3869.8 (0.0)3595.7 (−0.1)3709.4 (0.0)3654.7 (0.0)
5.012,291.6 (−0.2)12,054.3 (0.0)12,153.6 (0.0)11,892.8 (0.0)11,311.6 (0.0)10,450.5 (−0.1)10,813.6 (0.0)10,644.3 (0.0)
(b)
a 0
Multiplier
D 15 D 15 i D 30 D 30 i D 60 D 60 i D 120 D 120 i
0.2−99.0 (1.4)−98.8 (1.2)−99.0 (0.7)−99.0 (0.5)−99.2 (1.0)−99.2 (0.7)−99.3 (2.6)−99.3 (1.8)
0.5−86.3 (0.5)−85.2 (0.4)−86.2 (0.3)−85.0 (0.3)−86.9 (0.3)−87.4 (0.0)−87.2 (0.8)−87.8 (0.4)
1.00.0 (0.0)0.0 (0.0)0.0 (0.0)0.0 (0.0)0.0 (0.0)0.0 (0.0)0.0 (0.0)0.0 (0.0)
2.0658.1 (−0.3)623.7 (−0.2)599.2 (−0.6)536.0 (−0.5)571.2 (−0.5)672.8 (−0.1)621.8 (−0.5)664.9 (−0.2)
3.53865.1 (−0.4)3601.6 (−0.3)3320.5 (−1.0)2744.7 (−1.3)2919.0 (−0.9)3839.9 (−0.3)3483.8 (−0.8)3800.0 (−0.3)
5.011,345.6 (−0.5)10,485.5 (−0.4)9485.1 (−1.2)7609.1 (−1.6)7802.6 (−1.3)10,721.0 (−0.4)9715.8 (−1.0)10,791.7 (−0.4)
1 The differences in percentage to the maximum crest displacement are shown in brackets.
Table 7. Dam–foundation joint strength influence—differences in percentage to the maximum drain discharges and to the maximum crest displacement obtained with the strength properties defined in Table 3 1: (a) elastic foundation; (b) nonlinear brittle foundation.
(a)
Strength
Multiplier
D 15 D 15 i D 30 D 30 i D 60 D 60 i D 120 D 120 i
0.01.4 (1.8)101.1 (0.1)7.9 (2.9)5.1 (2.8)33.9 (3.2)36.4 (3.7)54.0 (3.4)43.5 (1.9)
0.250.0 (0.0)0.0 (0.0)3.5 (1.2)1.9 (1.0)36.8 (3.2)40.9 (3.8)54.4 (3.4)43.6 (1.9)
0.500.0 (0.0)0.0 (0.0)0.0 (0.0)0.0 (0.0)14.9 (1.8)16.6 (1.8)55.3 (3.4)45.2 (2.0)
1.000.0 (0.0)0.0 (0.0)0.0 (0.0)0.0 (0.0)0.0 (0.0)0.0 (0.0)0.0 (0.0)0.0 (0.0)
(b)
Strength
Multiplier
D 15 D 15 i D 30 D 30 i D 60 D 60 i D 120 D 120 i
0.00.1 (0.2)100.1 (0.1)1.3 (0.4)−0.2 (0.0)6.0 (0.8)34.7 (1.6)12.5 (1.3)52.6 (2.3)
0.250.0 (0.0)0.0 (0.0)0.0 (0.0)0.0 (0.0)1.4 (0.3)36.9 (1.6)12.6 (1.4)52.0 (2.3)
0.500.0 (0.0)0.0 (0.0)0.0 (0.0)0.0 (0.0)0.0 (0.0)36.9 (1.6)14.5 (1.7)16.8 (1.2)
1.000.0 (0.0)0.0 (0.0)0.0 (0.0)0.0 (0.0)0.0 (0.0)0.0 (0.0)0.0 (0.0)0.0 (0.0)
1 The differences in percentage to the maximum crest displacement are shown in brackets.
Table 8. Grout curtain permeability influence—differences in percentage to the maximum drain discharges and to the maximum crest displacement obtained with the grout curtain properties defined in Section 4.2.2 1: (a) elastic foundation; (b) nonlinear brittle foundation.
(a)
Grout Curtain
Multiplier
D 15 D 15 i D 30 D 30 i D 60 D 60 i D 120 D 120 i
1.0274.2 (0.0)435.6 (0.0)237.0 (0.0)445.8 (0.0)325.4 (0.0)357.1 (0.1)303.3 (0.0)328.9 (0.0)
3.5129.7 (0.0)178.8 (0.0)118.8 (0.0)171.7 (0.0)142.5 (0.0)167.1 (0.0)133.6 (0.0)150.0 (0.0)
5.068.0 (0.0)90.8 (0.0)64.3 (0.0)85.2 (0.0)72.2 (0.0)87.4 (0.0)69.5 (0.0)77.4 (0.0)
7.525.7 (0.0)33.8 (0.0)24.9 (0.0)31.6 (0.0)26.6 (0.0)33.0 (0.0)26.3 (0.0)28.8 (0.0)
10.00.0 (0.0)0.0 (0.0)0.0 (0.0)0.0 (0.0)0.0 (0.0)0.0 (0.0)0.0 (0.0)0.0 (0.0)
(b)
Grout Curtain
Multiplier
D 15 D 15 i D 30 D 30 i D 60 D 60 i D 120 D 120 i
1.0260.8 (−1.1)384.7 (−0.8)200.5 (−0.6)330.0 (0.8)206.4 (0.5)235.3 (1.7)202.8 (1.1)253.8 (−1.6)
3.5122.6 (−0.8)160.8 (−0.5)105.9 (−0.2)131.0 (−0.2)98.7 (0.3)108.1 (1.0)98.8 (0.9)114.2 (−1.0)
5.064.3 (−0.5)81.9 (−0.3)57.6 (−0.1)65.5 (−0.2)52.2 (0.2)59.6 (0.6)55.7 (0.7)57.8 (−0.6)
7.524.3 (−0.2)30.5 (−0.1)22.3 (−0.1)24.4 (−0.1)19.9 (0.1)23.2 (0.2)24.9 (0.4)21.6 (−0.2)
10.00.0 (0.0)0.0 (0.0)0.0 (0.0)0.0 (0.0)0.0 (0.0)0.0 (0.0)0.0 (0.0)0.0 (0.0)
1 The differences in percentage to the maximum crest displacement are shown in brackets.
Table 9. Calibrated hydraulic aperture at nominal zero normal stress ( a 0 × 10−5 mm).
Foundation BehaviourNormal Stiffness
Hypothesis
H1H2
E1.4541.399
NL1.0400.998
Disclaimer/Publisher’s Note: The statements, opinions and data contained in all publications are solely those of the individual author(s) and contributor(s) and not of MDPI and/or the editor(s). MDPI and/or the editor(s) disclaim responsibility for any injury to people or property resulting from any ideas, methods, instructions or products referred to in the content.