Article

Influence of Post-Curing Time and Print Orientation on the Mechanical Behavior of Photosensitive Resins in mSLA 3D Printing

by
Geraldo Cesar Rosario de Oliveira
1,
Vania Aparecida Rosario de Oliveira
1,
Carla Carvalho Pinto
1,
Luis Felipe Barbosa Marques
1,
Tuane Stefania Reis dos Santos
1,
Antonio dos Reis de Faria Neto
1,
Carlos Alexis Alvarado Silva
2,
Marcelo Sampaio Martins
1,
Fernando de Azevedo Silva
1 and
Erick Siqueira Guidi
1,*
1
Faculdade de Engenharia e Ciências, Campus Guaratinguetá, Universidade Estadual Paulista “Julio de Mesquita Filho”—UNESP, Guaratinguetá 12516-410, São Paulo, Brazil
2
Departamento de Ingeniería Industrial, Universidad Tecnológica del Perú, Trujillo 13001, Peru
*
Author to whom correspondence should be addressed.
Appl. Mech. 2025, 6(3), 71; https://doi.org/10.3390/applmech6030071
Submission received: 29 July 2025 / Revised: 31 August 2025 / Accepted: 8 September 2025 / Published: 11 September 2025
(This article belongs to the Special Issue Cutting-Edge Developments in Computational and Experimental Mechanics)

Abstract

This study investigates the mechanical behavior of water-washable photosensitive resins used in masked stereolithography (mSLA) 3D printing, evaluating the effect of post-curing time (0, 5, 10, 30, and 60 min) and printing orientation (Flat [XY], Vertical [Z], and On-edge [XZ]) on the material characteristics. Specimens were manufactured according to ISO 527-2 type 1B and ISO 178 standards for tensile and bending tests, respectively. A Matlab algorithm was developed to automate the processing of experimental data. This tool enabled the extraction of parameters to fit distinct mathematical models for the elastic (linear) and nonlinear (polynomial) regimes, allowing the material response to be characterized at different curing times and print orientations. These models were implemented in Ansys Workbench for comparison with experimental results. The results show that increasing the post-curing time from 0 to 60 min raises the elastic modulus from 964.5 to 1892.4 MPa in the Flat [XY] orientation and from 774 to 1661.2 MPa in the Vertical [Z] orientation for tensile testing. In bending testing, the Flat [XY] orientation presented the best mechanical properties, while the Vertical [Z] and On-edge [XZ] orientations showed similar behavior. The numerical simulations adequately reproduced the experimental results, validating the developed constitutive models. Finally, a stress–strain correlation model is presented that enables estimation for any post-curing time between 0 and 60 min. This study provides essential data for optimizing 3D printing processes and developing structural applications with photopolymer resins.

1. Introduction

Additive manufacturing (AM) has revolutionized production processes due to its ability to fabricate complex geometries with reduced production times and competitive costs [1,2]. With technological development and the expiration of patents, there has been a rapid diffusion of additive manufacturing technologies in recent years [1]. Data from 2019 indicate that 33% of the profits in the additive manufacturing industry come from the automotive and aerospace industries [3]. Boeing, for example, has manufactured more than 20,000 parts using additive manufacturing [4]. The study by Turkcan and collaborators points out that the use of additive manufacturing in companies improves their competitive advantage in the market [5].
Among AM technologies, masked stereolithography (MSLA) stands out for its high resolution and surface quality of the components produced, using photopolymer resins that cure under ultraviolet light exposure [6,7]. This technique has been used in different applications such as microelectromechanical [8] systems and biomaterials [9].
Photosensitive resins represent an important class of materials for MSLA, offering superior mechanical properties compared to conventional acrylic resins [10]. A large part of commercially available resins has confidential formulations. However, it is known that most of them are composed of multifunctional methacrylates and epoxy [11].
The composition of photocurable polymer consists of monomers and photoinitiators. It is a process in which the liquid monomer solution is converted into a solid polymer through its exposure to UV light. The light is responsible for transforming free radicals present in the photoinitiator into active radicals that, through bonding with monomers, initiate the formation of long chains. In this way, as the chains connect, a network structure is formed, transforming from the liquid state to the solid state. The amount of light energy absorbed directly affects the mechanical properties of the polymer since it impacts the degree of conversion of the monomers and the crosslinking density [12].
The final macroscopic mechanical properties of the material, such as shear modulus, relaxation time, and deformation behavior, are directly related to the polymerization process at the microscopic level. [13]. However, these properties depend significantly on the processing parameters, particularly the post-curing time and the printing orientation [14,15].
The post-curing process is essential for achieving optimal mechanical properties, as the degree of conversion immediately after printing is approximately 80% [16]. Studies show that inadequate post-curing times can result in suboptimal mechanical performance or material degradation [17]. Staffová et al. [14] observed an exponential increase in thermomechanical properties during the first 5 min of post-curing, with stabilization after 60 min. Nowacki et al. [15] recommended a minimum post-curing time of 30 min.
Print orientation also exerts a significant influence on mechanical properties due to the layer-by-layer construction process, which can introduce anisotropy into the material [18]. Understanding this anisotropy is crucial for applications where directional properties are critical for structural performance. Different loading types (tensile and bending) may exhibit varying sensitivities to print orientation, requiring specific characterization for each mechanical loading condition.
Print orientation affects mechanical properties due to the lamellar structure resulting from the layer-by-layer construction process. Studies indicate that different orientations produce significant variations in mechanical properties, with this anisotropy being dependent on the type of loading applied (tensile, bending, compression). Proper characterization requires specific evaluation for each loading mode and relevant orientation.
The objective of this work is to evaluate the mechanical behavior of water-washable photosensitive resin specimens processed via mSLA, considering the effects of post-curing time and print orientation.

2. Materials and Methods

The resin used by the manufacturer Anycubic (Shenzhen, China), type Water Wash Resin+, which eliminates the need for isopropyl alcohol in the washing step. The specimens were prepared using the Chitubox slicing software V.1.9.4 and manufactured with the model Satur 2 8k, mSLA printer from the manufacturer by Elegoo (Shenzhen, China), using the following printing parameters:
  • Exposure time: 2.2 s;
  • Base exposure time: 20 s;
  • Number of base layers: 5;
  • Layer height: 0.05 mm.
The FTIR (Fourier Transform Infrared Spectroscopy, Figure 1) analysis was conducted to evaluate the curing behavior of the 3D printing resin under different UV exposure times. Spectra were obtained for uncured samples and for samples cured at 5, 10, 30, and 60 min. Similar to the findings of Bednarczyk, Walkowiak, and Irska [19] and Štaffová et al. [14], the main functional groups identified by absorption correspond to hydroxyl (-OH), carbonyl (C=O), and ether (C–O–C), as well as C=C and C–H bonds. An increase in peak intensity was observed between 5 and 10 min of curing, followed by a gradual decrease at longer curing times (30–60 min). This behavior indicates the progression of polymerization and the conversion of functional groups, confirming a satisfactory curing process. Epoxy groups (915 cm−1) showed a substantial decrease in intensity with curing time, which is consistent with epoxy ring opening and the development of a polymeric network. Acrylate groups (809 cm−1) also exhibited a progressive reduction in peak intensity, suggesting the polymerization of acrylate double bonds. Normalized peak analysis further confirmed a clear reduction in the C=C band (1400–1350 cm−1), in agreement with the polymerization mechanism of acrylate groups. Overall, the photocuring process resulted in a decrease in the characteristic bands between 1607 and 1635 cm−1 and at 809 cm−1, while some epoxy groups persisted. These findings are consistent with previous reports [14,19], supporting the occurrence of polymerization through unsaturated bonds derived from double bonds.
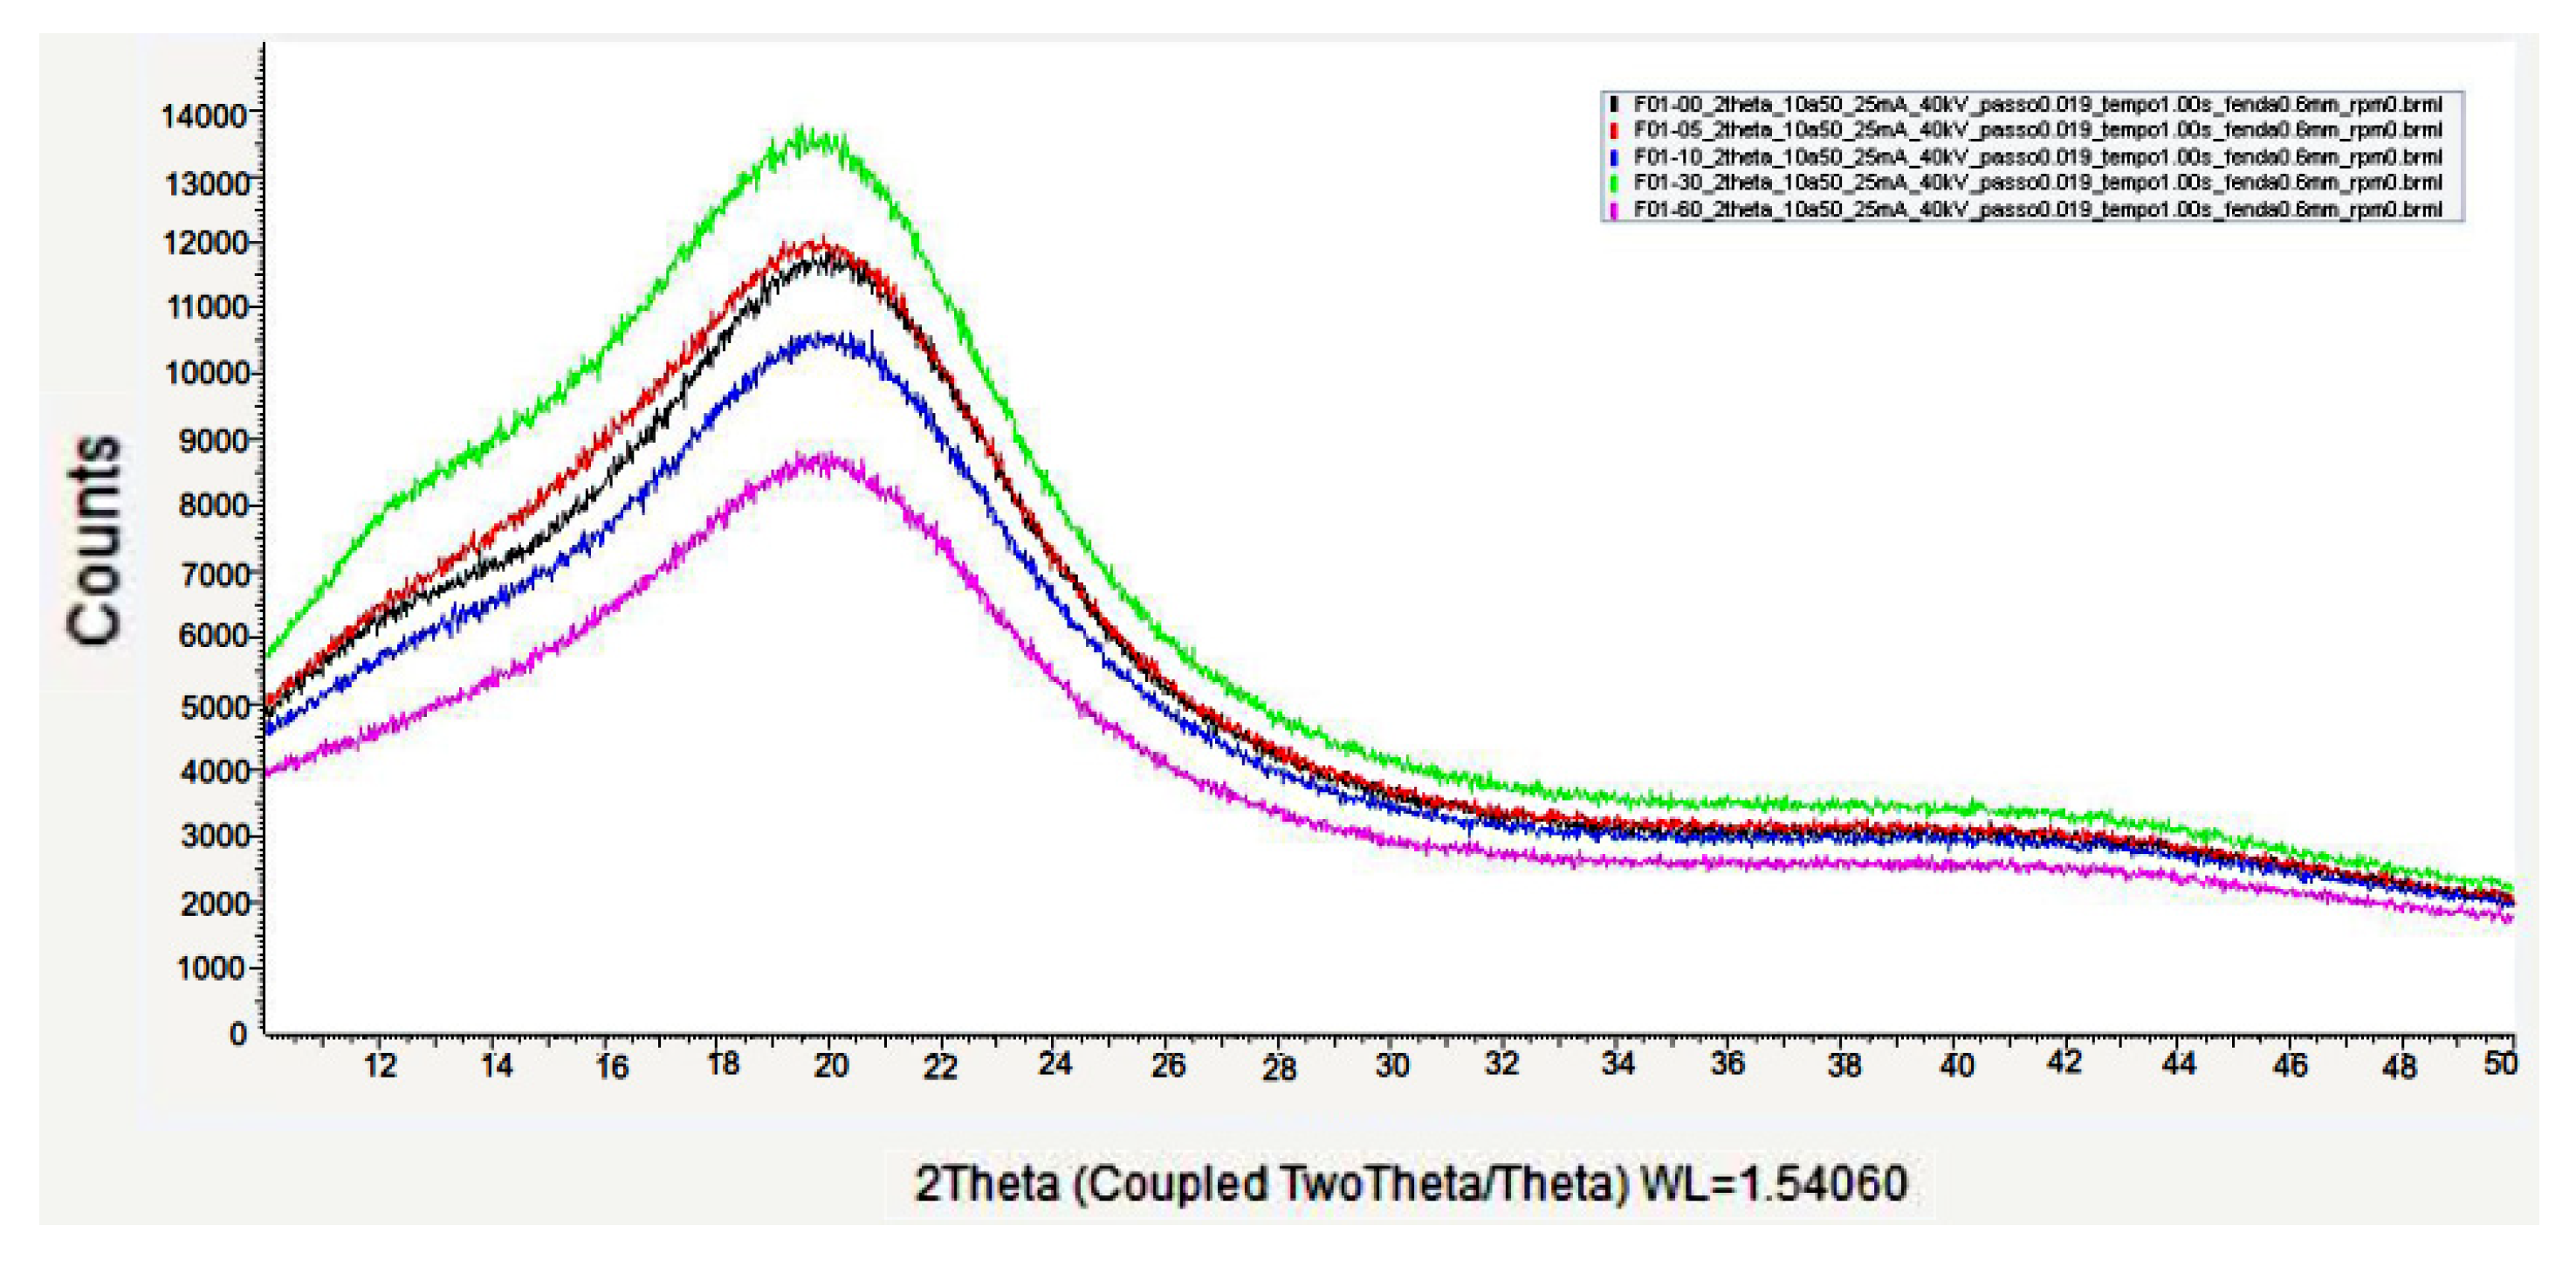
Figure 2 presents the X-ray diffraction (XRD) analysis. It can be observed that variations in post-curing time did not alter the crystalline structure of the material, which remained amorphous regardless of the curing duration, maintaining the same diffraction pattern.

2.1. Specimen Preparation

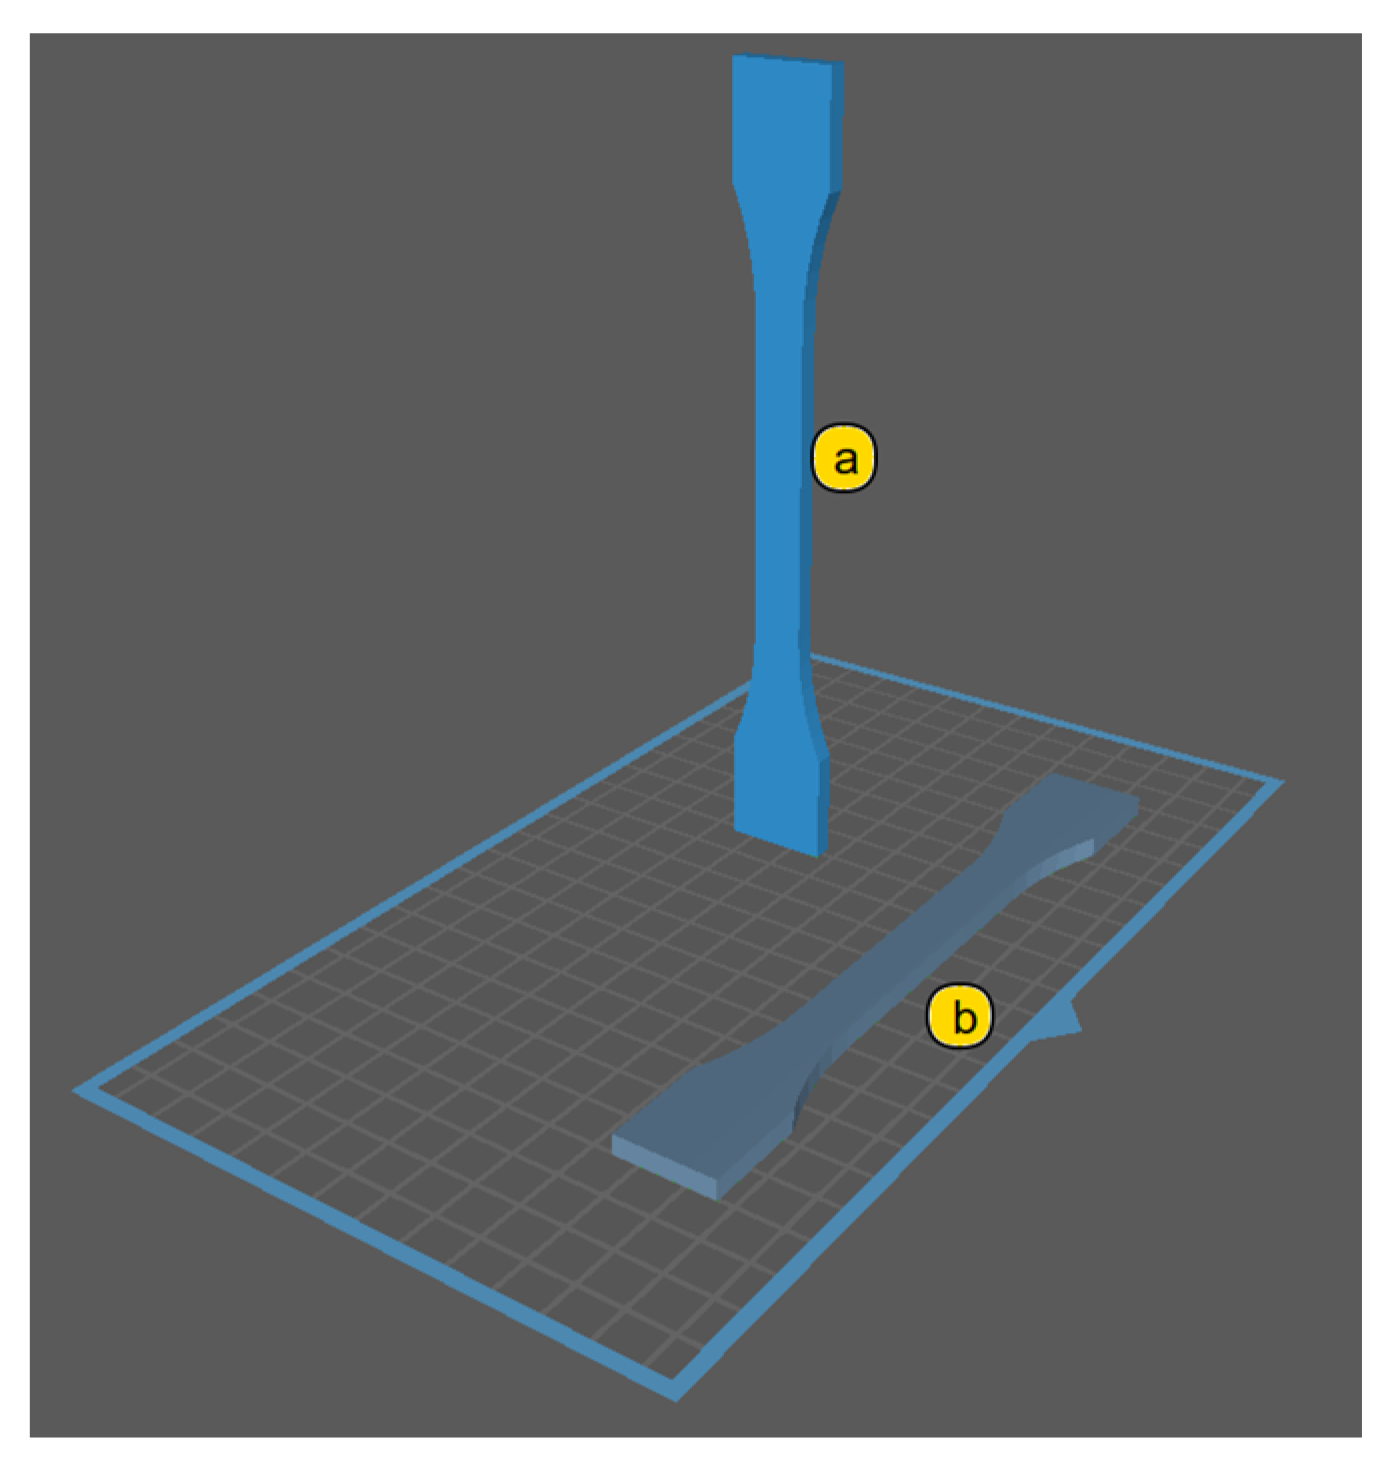
The specimens were prepared according to ISO 527-2 type 1B (tensile) [20] and ISO 178 (bending) standards [21]. The positioning of the parts on the printing platform is shown in Figure 3, which illustrates the different orientations. For the tensile tests, two orientations were evaluated:
  • Flat [XY] (a): specimen perpendicular to the printing platform.
  • Vertical [Z] (b): specimen parallel to the platform, with its longitudinal axis perpendicular to the printing direction.
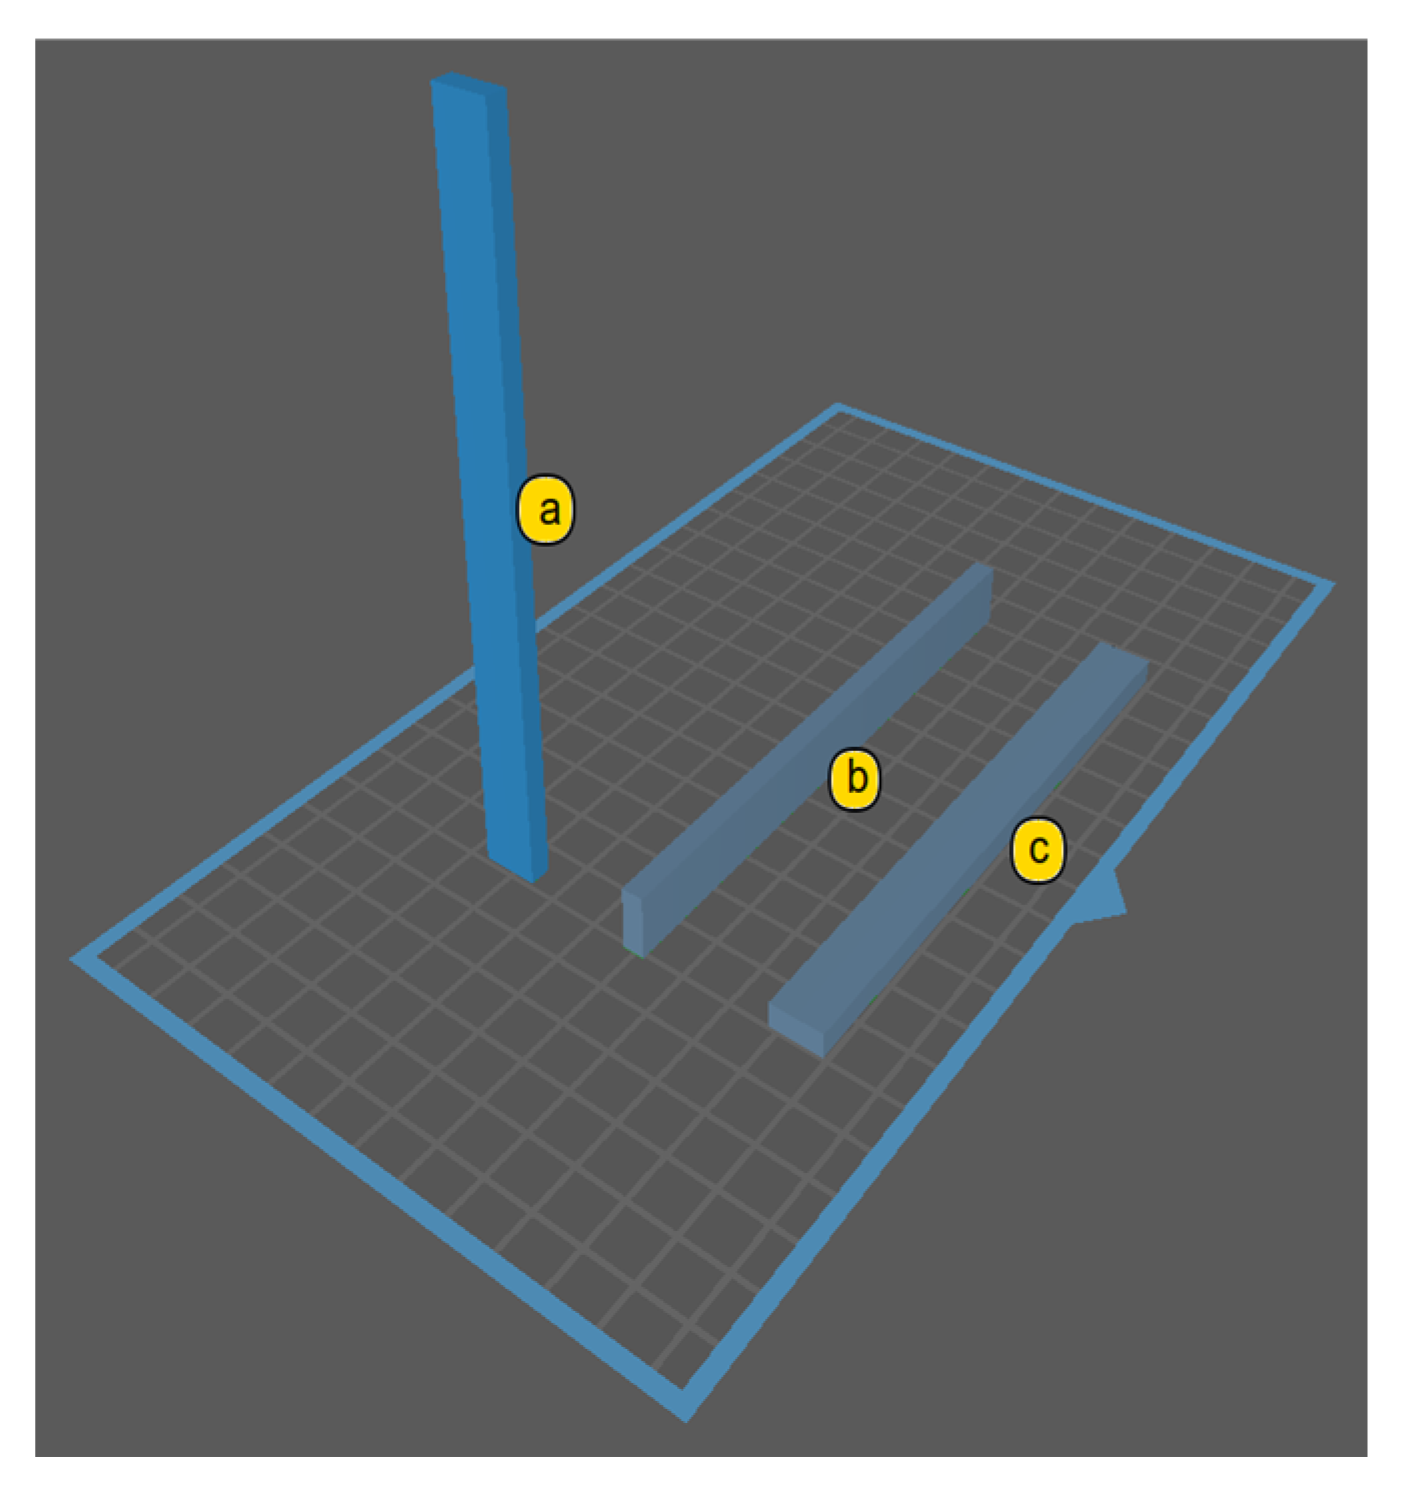
For the bending tests, three orientations were evaluated:
  • Flat [XY]: specimen perpendicular to the printing platform;
  • On-edge [XZ]: specimen parallel to the platform, with its longitudinal axis perpendicular to the printing direction;
  • Vertical [Z]: specimen parallel to the platform, with its longitudinal axis parallel to the printing direction.
The print direction of the specimens is shown schematically in Figure 4 for tensile tests and in Figure 5 for bending tests.

2.2. Post-Processing

After printing, the specimens underwent:
  • Washing: using the Wash and Cure 3.0 chamber manufactured by Anycubic (Figure 6a) to remove uncured resin.
  • Post-curing: UV exposure for 0, 5, 10, 30, and 60 min in a UV curing chamber manufactured by Anycubic (Figure 6b).
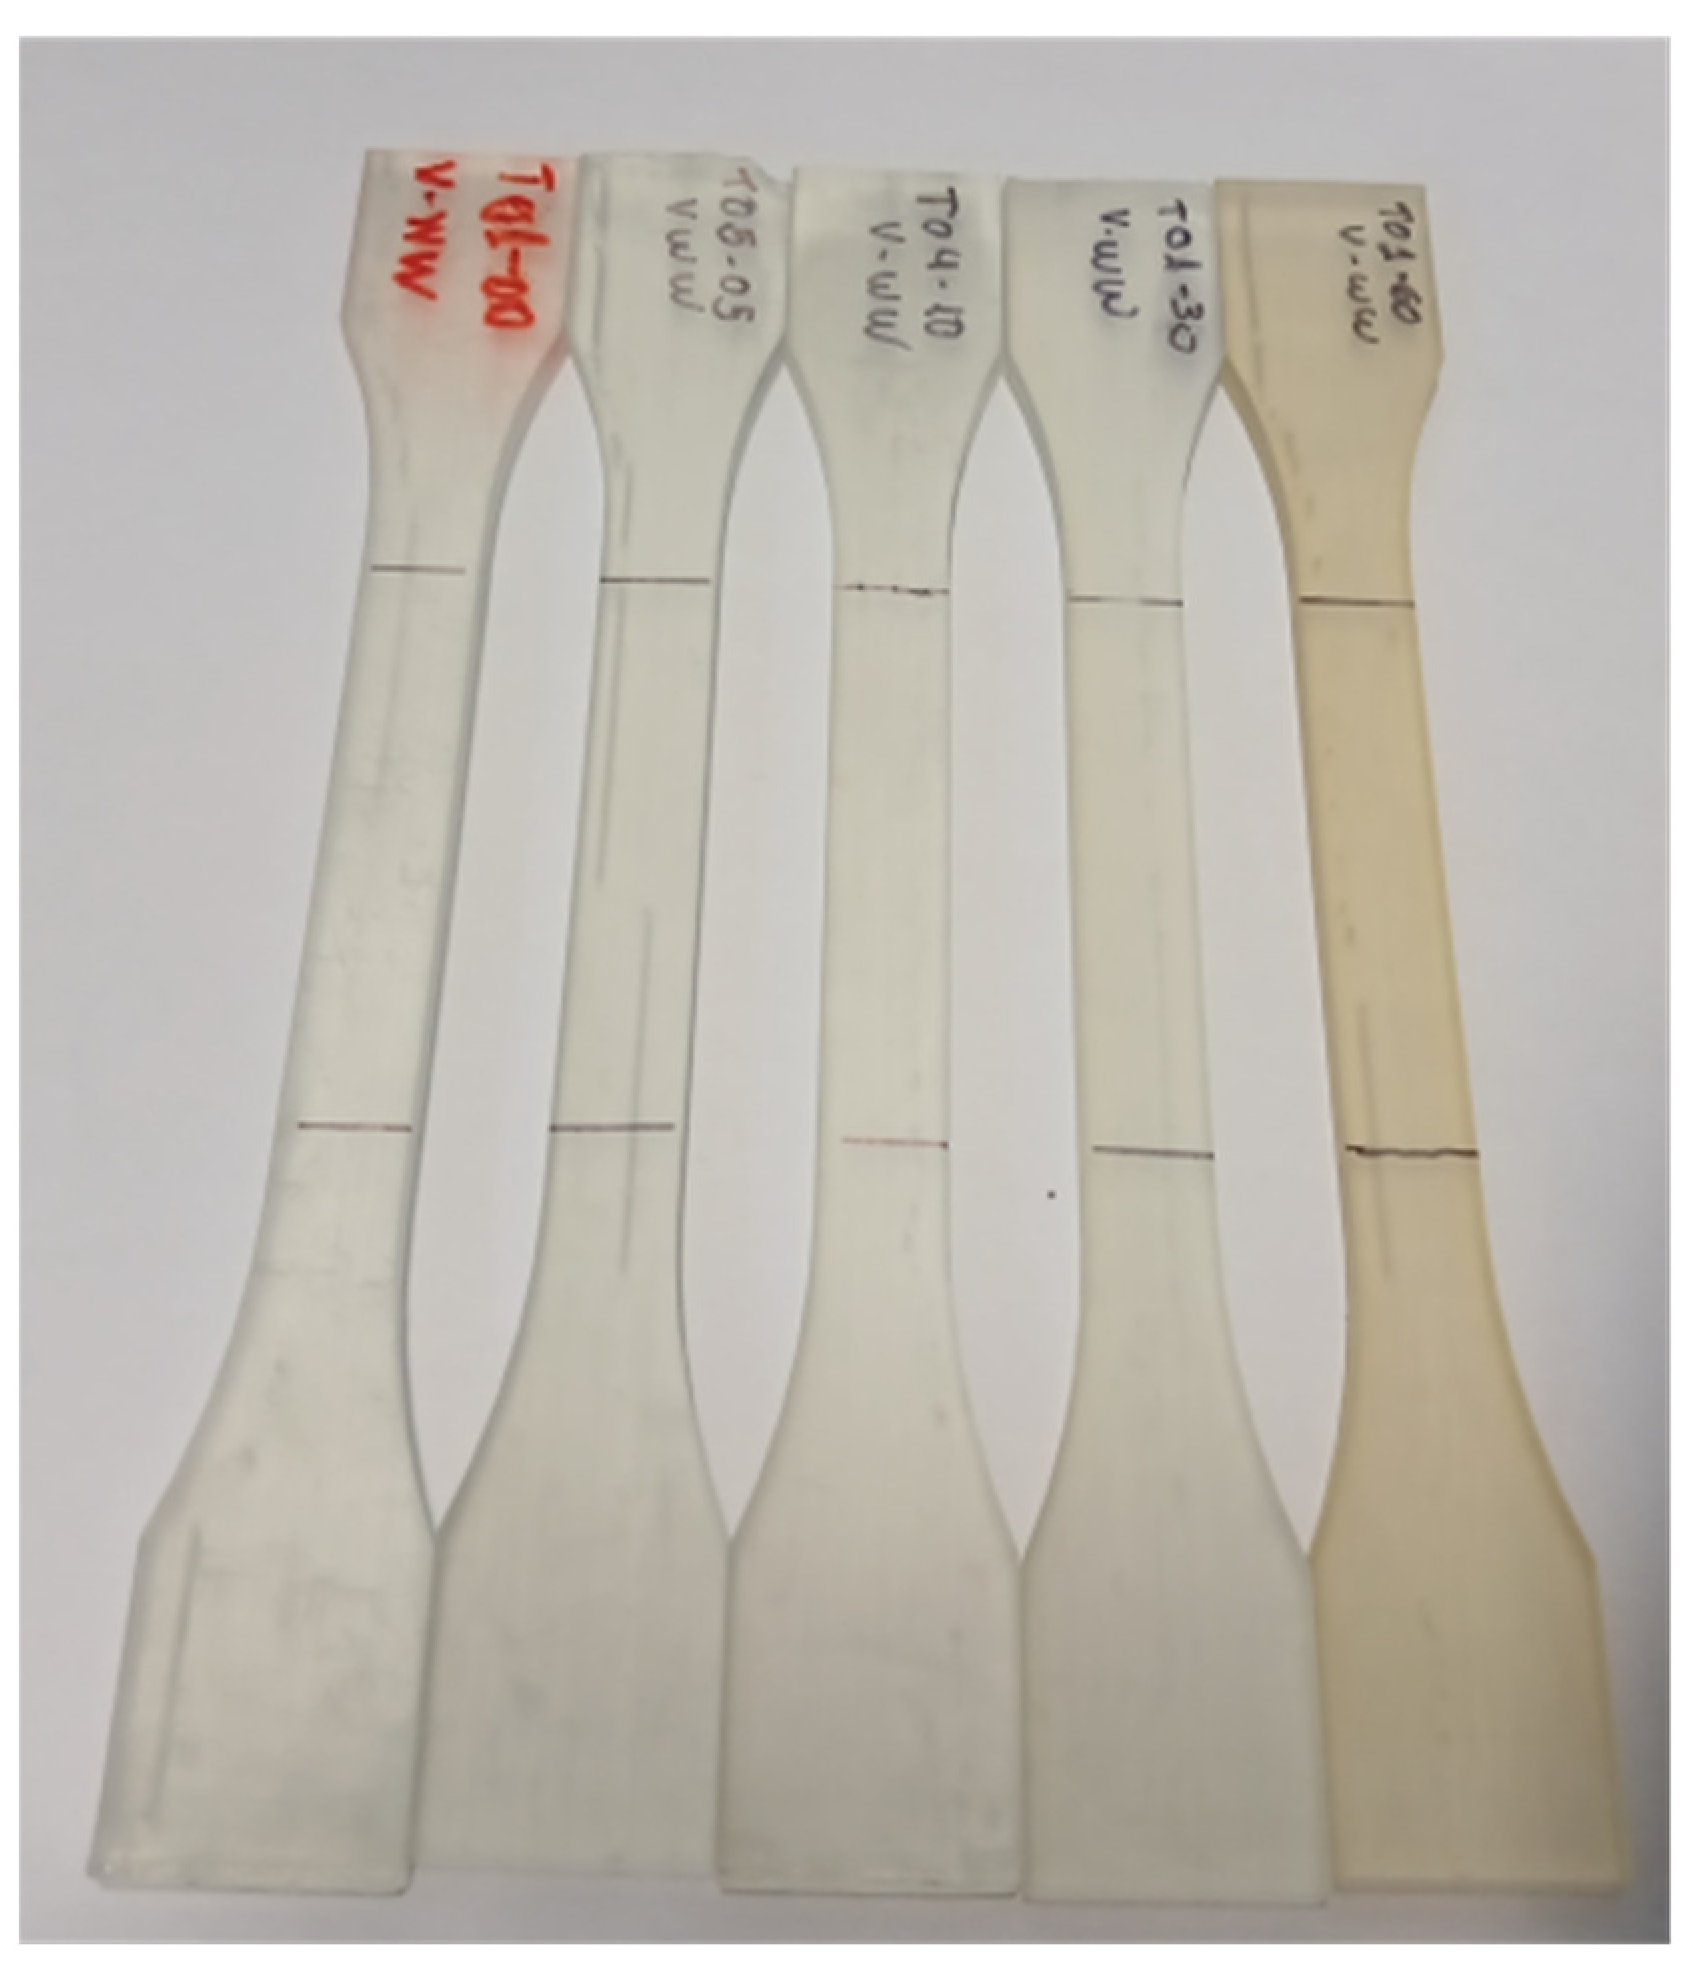
The visual change in the specimens as a function of post-curing time can be seen in Figure 7, where a progressive color change from transparent (0 min) to amber (60 min) is noticeable.
The yellowish in post-cured parts occurs mainly due to photochemical oxidation induced by UV radiation, which generates conjugated carbonyl compounds acting as chromophores and absorbing in the blue region of the visible spectrum [22,23,24]. In addition, the degradation of photoinitiators can lead to the formation of quinones and yellowish by-products [25,26], further intensifying the effect. In many cases, this phenomenon can reduce optical transmittance and, in the long term, compromise mechanical properties [27]. However, for the curing time adopted in the present study, the observed yellowing is merely aesthetic and does not cause losses in mechanical performance. Prevention strategies include optimizing curing time to avoid overcuring [27], using an inert atmosphere during the process [28,29], incorporating UV stabilizers and antioxidants [30,31], and selecting more stable photoinitiators such as acylphosphine oxides [32,33]. These measures reduce degradation, preserve transparency, and prevent functional impacts in critical applications.

2.3. Mechanical Testing

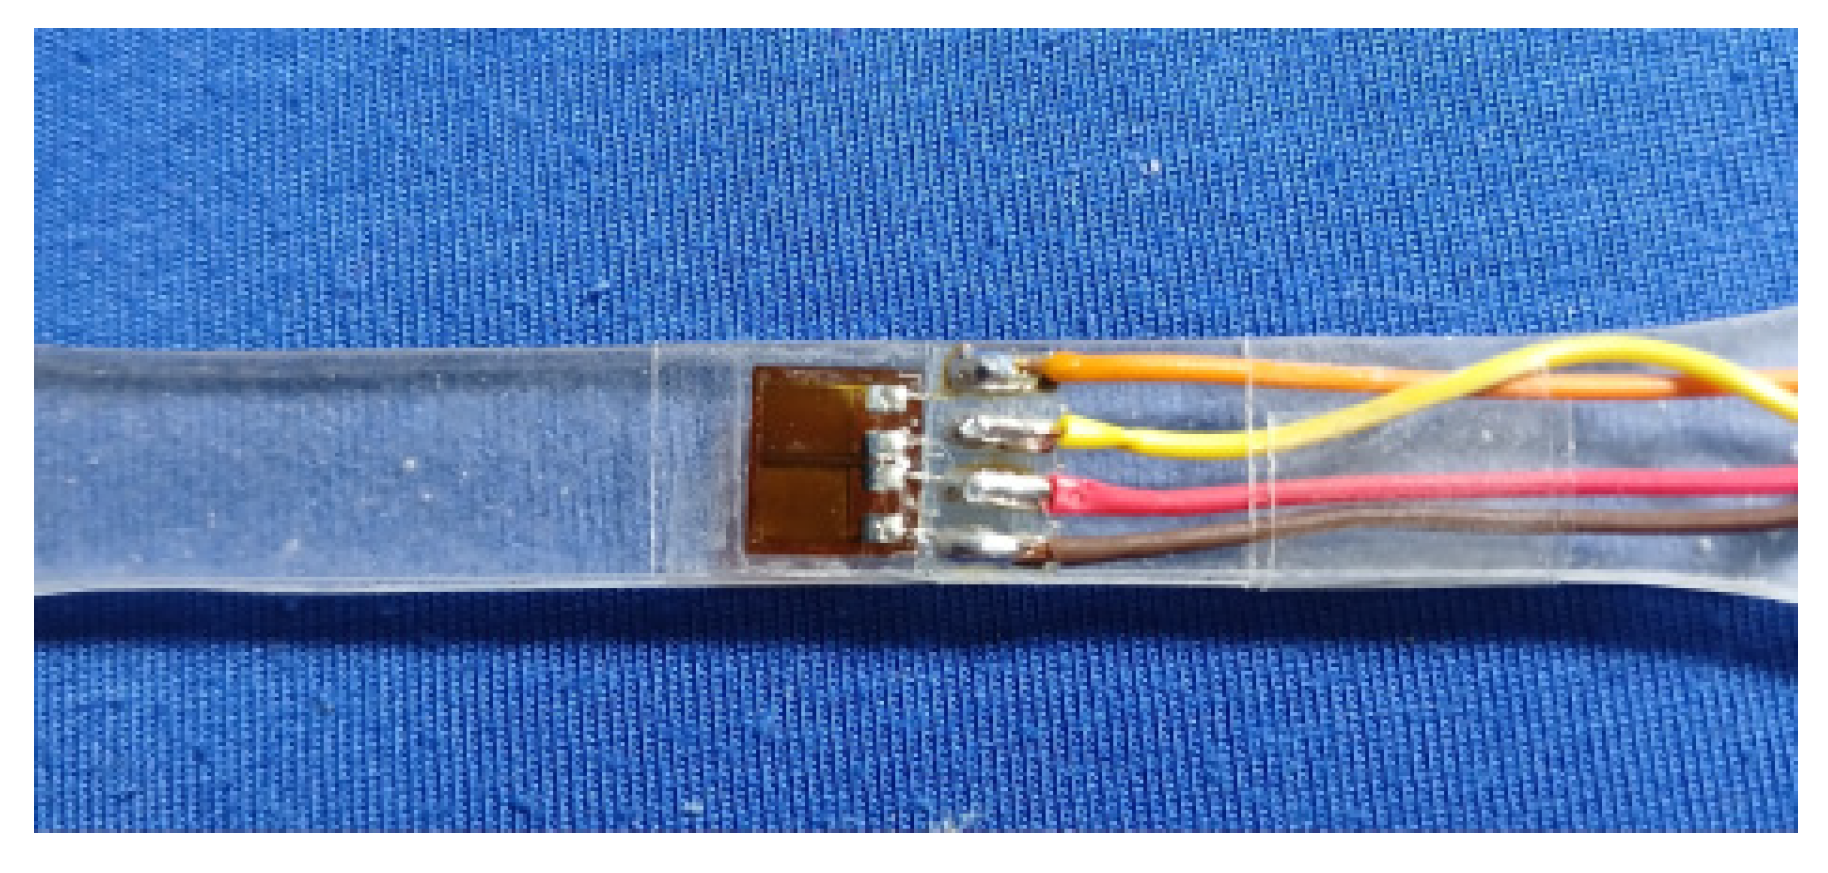
The tests were performed on a Shimadzu universal testing machine, AG-X model with 5 kN load cell (Figure 8), following ISO 527-2 type 1B (2019) and ISO 178 (2019) standards for plastics materials. For the tensile tests, a speed of 5 mm/min was used and in the bending tests, a speed of 2 mm/min was used. To determine Poisson’s ratio, dual extensometers BF350-4BB-11 (YN, Shenzhen, China)were installed on the tensile specimens (Figure 9), simultaneously measuring longitudinal and transverse strains with the following characteristics: resistance 349.9 ± 0.2 Ω, gage factor 2.11 ± 1%, and grid length 4.0 × 4.1 mm. Poisson’s ratio obtained was 0.34 ± 0.007.

2.4. Data Processing and Numerical Simulation

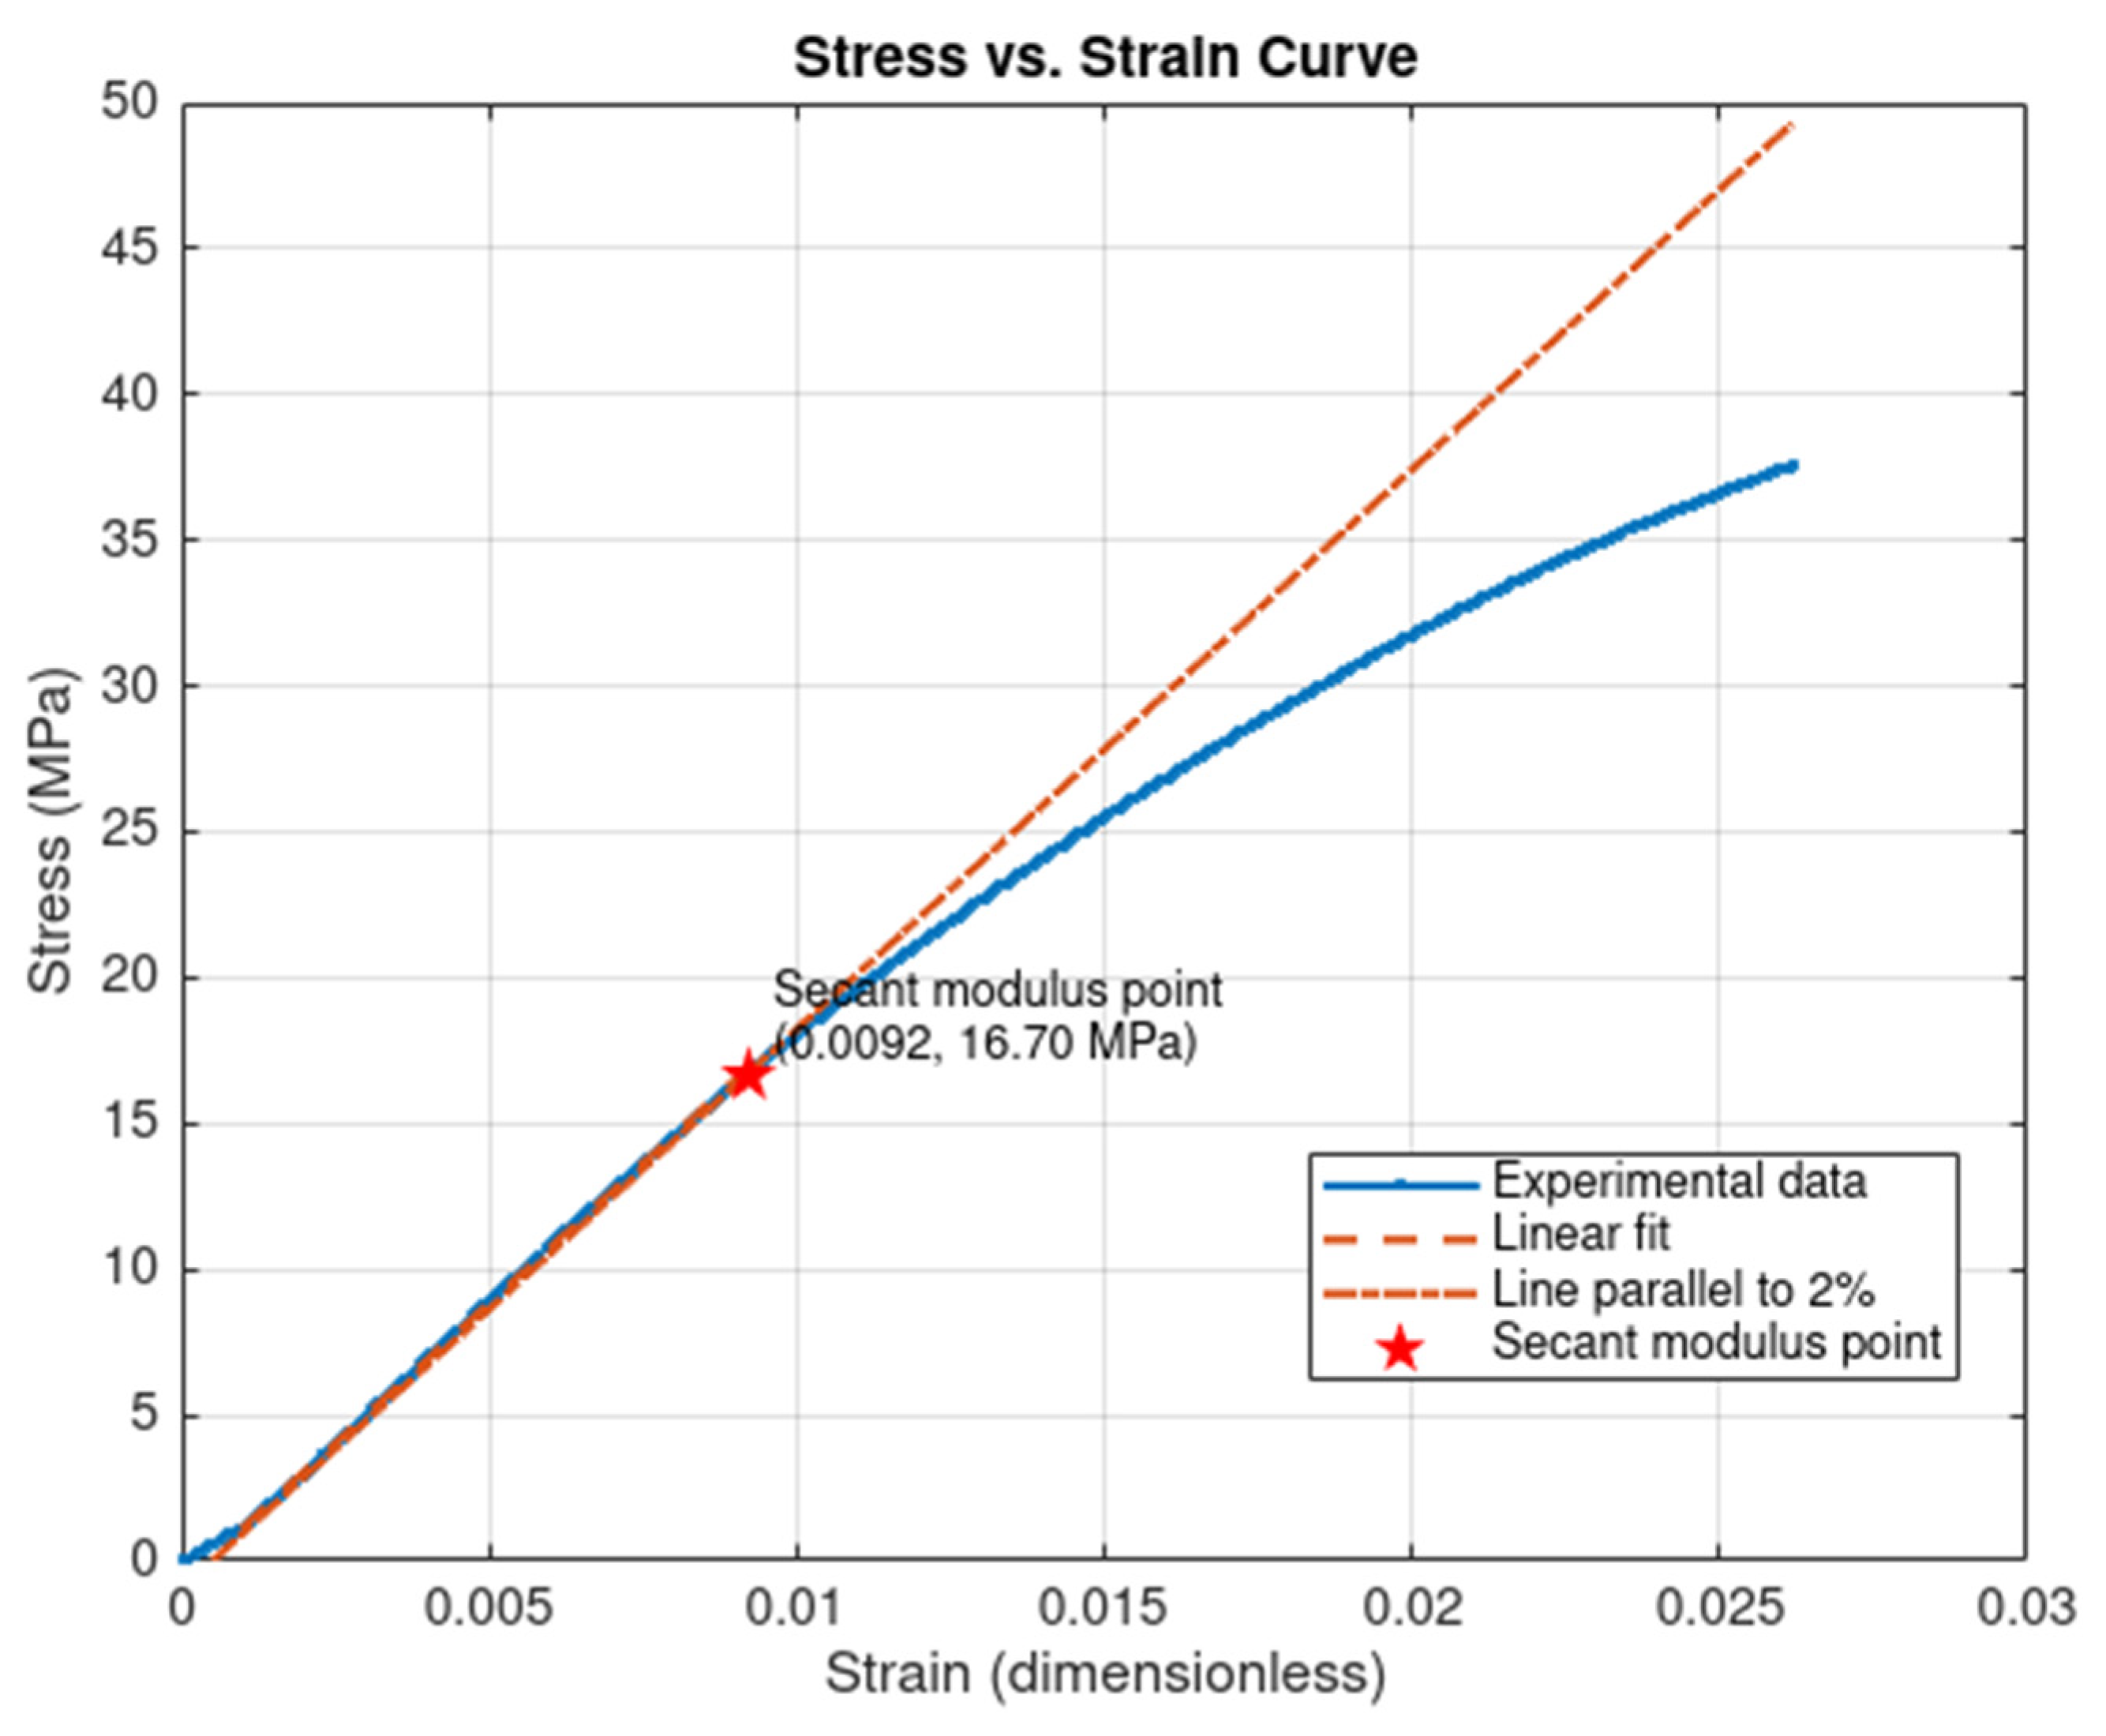
A Matlab script was developed to automate the conversion of force-displacement data, obtained directly from tensile tests, into stress–strain curves. This computational tool was used for extracting parameters that reflect the material’s behavior. In the context of polymers, the Secant Modulus assumes particular importance. To determine it, the script draws a line parallel to the linear-elastic portion of the stress–strain curve, starting from a predefined strain value known as “offset”, which is 0.2% for polymers. The point where this line intersects the stress–strain curve is considered the limit of the material’s elastic behavior.
After obtaining the experimental curves, the data were fitted using Matlab V. r23a (script available in Appendix A). A sixth-degree polynomial was employed for this regression. Subsequently, average curves for each curing time were generated.
The algorithm performs the following operations:
  • Data conversion: Automatic transformation of force–displacement into stress–strain.
  • Linear region identification: Interactive interface for the user to define the start and end of the linear elastic region.
  • Elastic modulus calculation: Least-squares linear fit to the identified elastic region.
  • Secant modulus determination:
Implementation of the offset method with a strain of 0.2%, following polymer material testing standards. Considering the initial length (L) as 118 mm and the average ΔL (length variation) of the samples as 3.12 mm, the strain (ε) is presented in Equation (1).
ε = L L = 3.12 118 = 0.025
Thus, 2% of the strain (ε) for use in the script will be:
0.2 % × ε = L L = 0.025 × 2 100 = 0.0005
5.
Interpolation and intersection: Automatic location of the intersection between the interpolated experimental curve and the offset line, defining the proportionality limit.
6.
Graphical visualization: Automatic generation of plots showing the experimental curve, linear fit, offset line, and clearly marked secant modulus point, as illustrated in Figure 10 for the 60 min curing time in the Flat [XY] orientation.
Being the photopolymeric resin a thermosetting polymer, monotonic tests under quasi-static regimes, combined with the use of the secant modulus, allow capturing the initial nonlinearity typical of such materials. Thus, it is inferred that, after the proportionality limit, the response becomes inelastic and dominated by viscoelasticity, rather than “plastic” in the metallurgical sense. For this reason, the point obtained by the 0.2% offset method was adopted solely as a pseudoyield point, delimiting the end of the linear elastic response without implying the occurrence of intrinsic plastic yielding. Review studies confirm that the mechanical properties of polymers and polymer composites, such as stiffness, strength, and failure strain, are highly dependent on strain rate, exhibiting hardening under higher loading rates and, in many cases, a ductile-to-brittle transition [34]. This behavior is characteristic of nonlinear viscoelasticity.
In addition, stress–strain curves of thermosetting resins and fiber-reinforced composites often exhibit a bilinear relationship between stiffness and strength, with response segments that cannot be described by a simple elastic linearity. This justifies the adoption of multilinear models, which are capable of representing different segments of the stress–strain curve, simulating more accurately both hardening and softening of the material under load. In this context, the MISO model (Multilinear Isotropic Hardening) proves suitable to represent this behavior. In particular, the assumption of isotropic hardening is considered acceptable for pure resins, as it is associated with the tetrahedral supramolecular organization typical of these materials, as discussed in finite element models applied to thermosets [35].
From a molecular perspective, computational simulations reinforce the adequacy of the multilinear approach. Recent studies demonstrate that the hardening of thermosetting polymers does not occur homogeneously, but rather involves localized reactive events and topological redistribution, leading to different deformation regimes [36]. Likewise, the low cure shrinkage of polybenzoxazine resins, explained by atomistic simulations, illustrates how supramolecular rearrangements generate nonlinear viscoelastic–plastic responses, which are compatible with modeling via MISO [37].
In the present study, the focus is on static characterization under monotonic short-term loading. Accordingly, the evolution of the elastic modulus and strength with post-curing time can be adequately represented by multilinear models. Each post-curing time was treated as an independent set of constitutive properties, consistent with the approach adopted in thermoset composite simulations for discrete curing stages [38]. This choice enables the direct calibration of the experimental stress–strain curves and the validation of the numerical response against the test results.
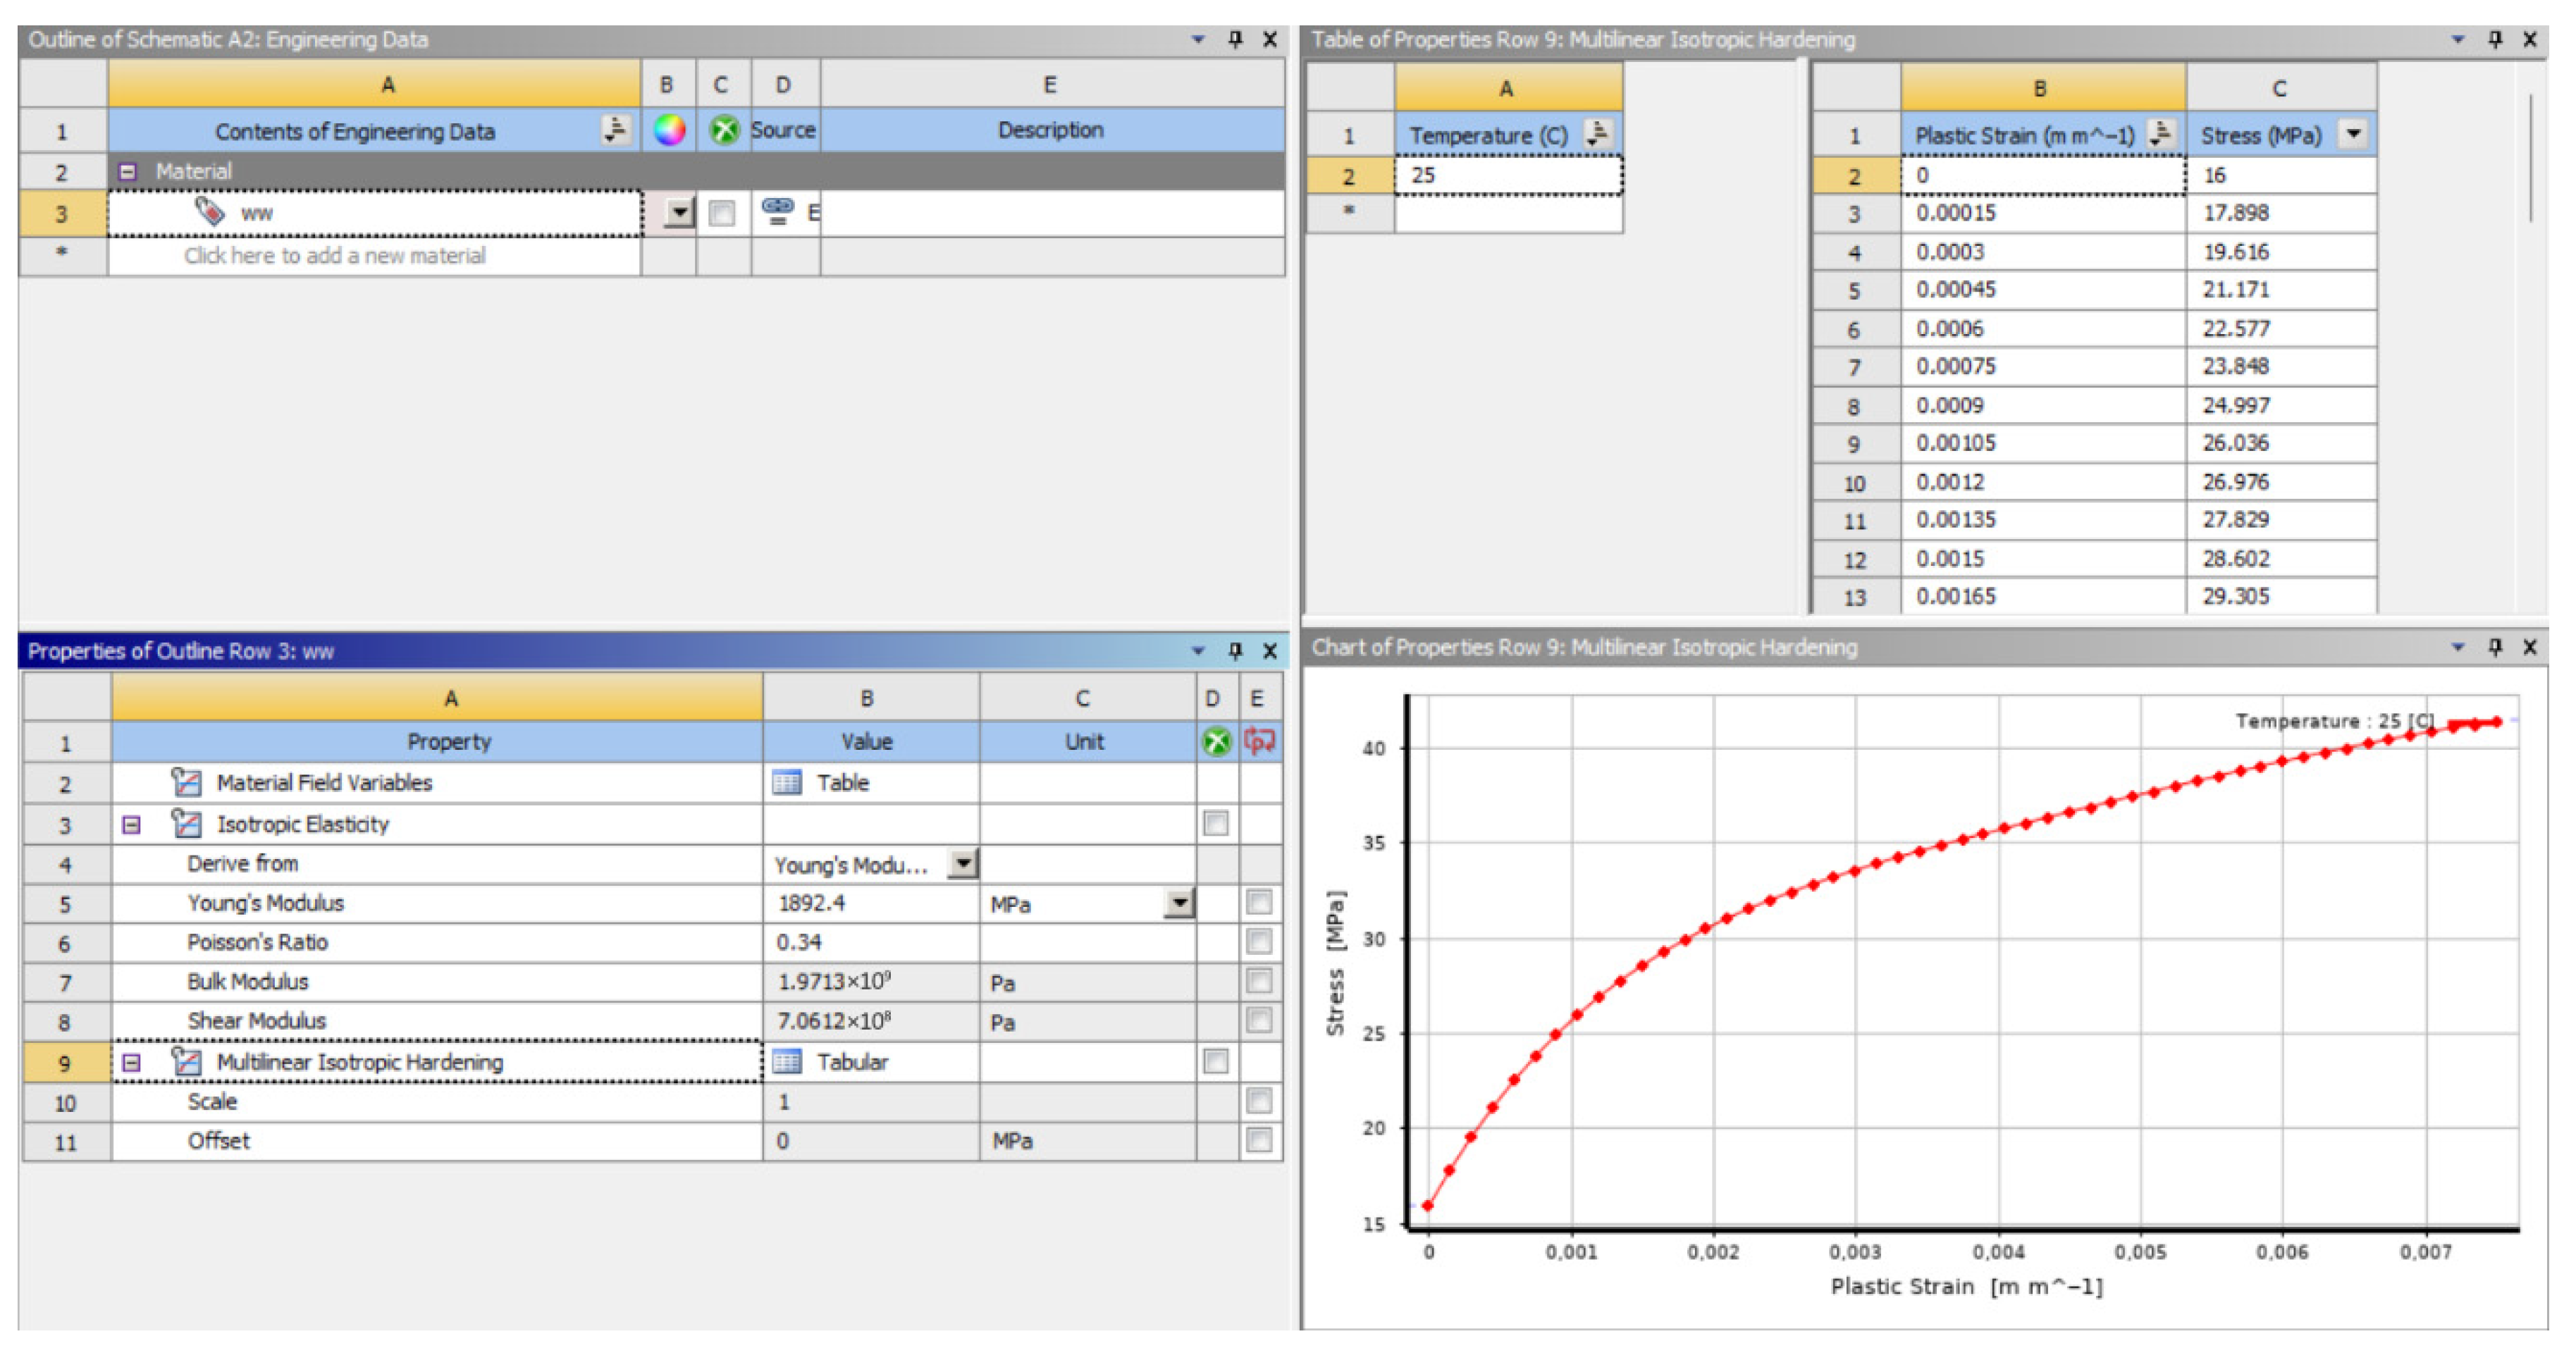
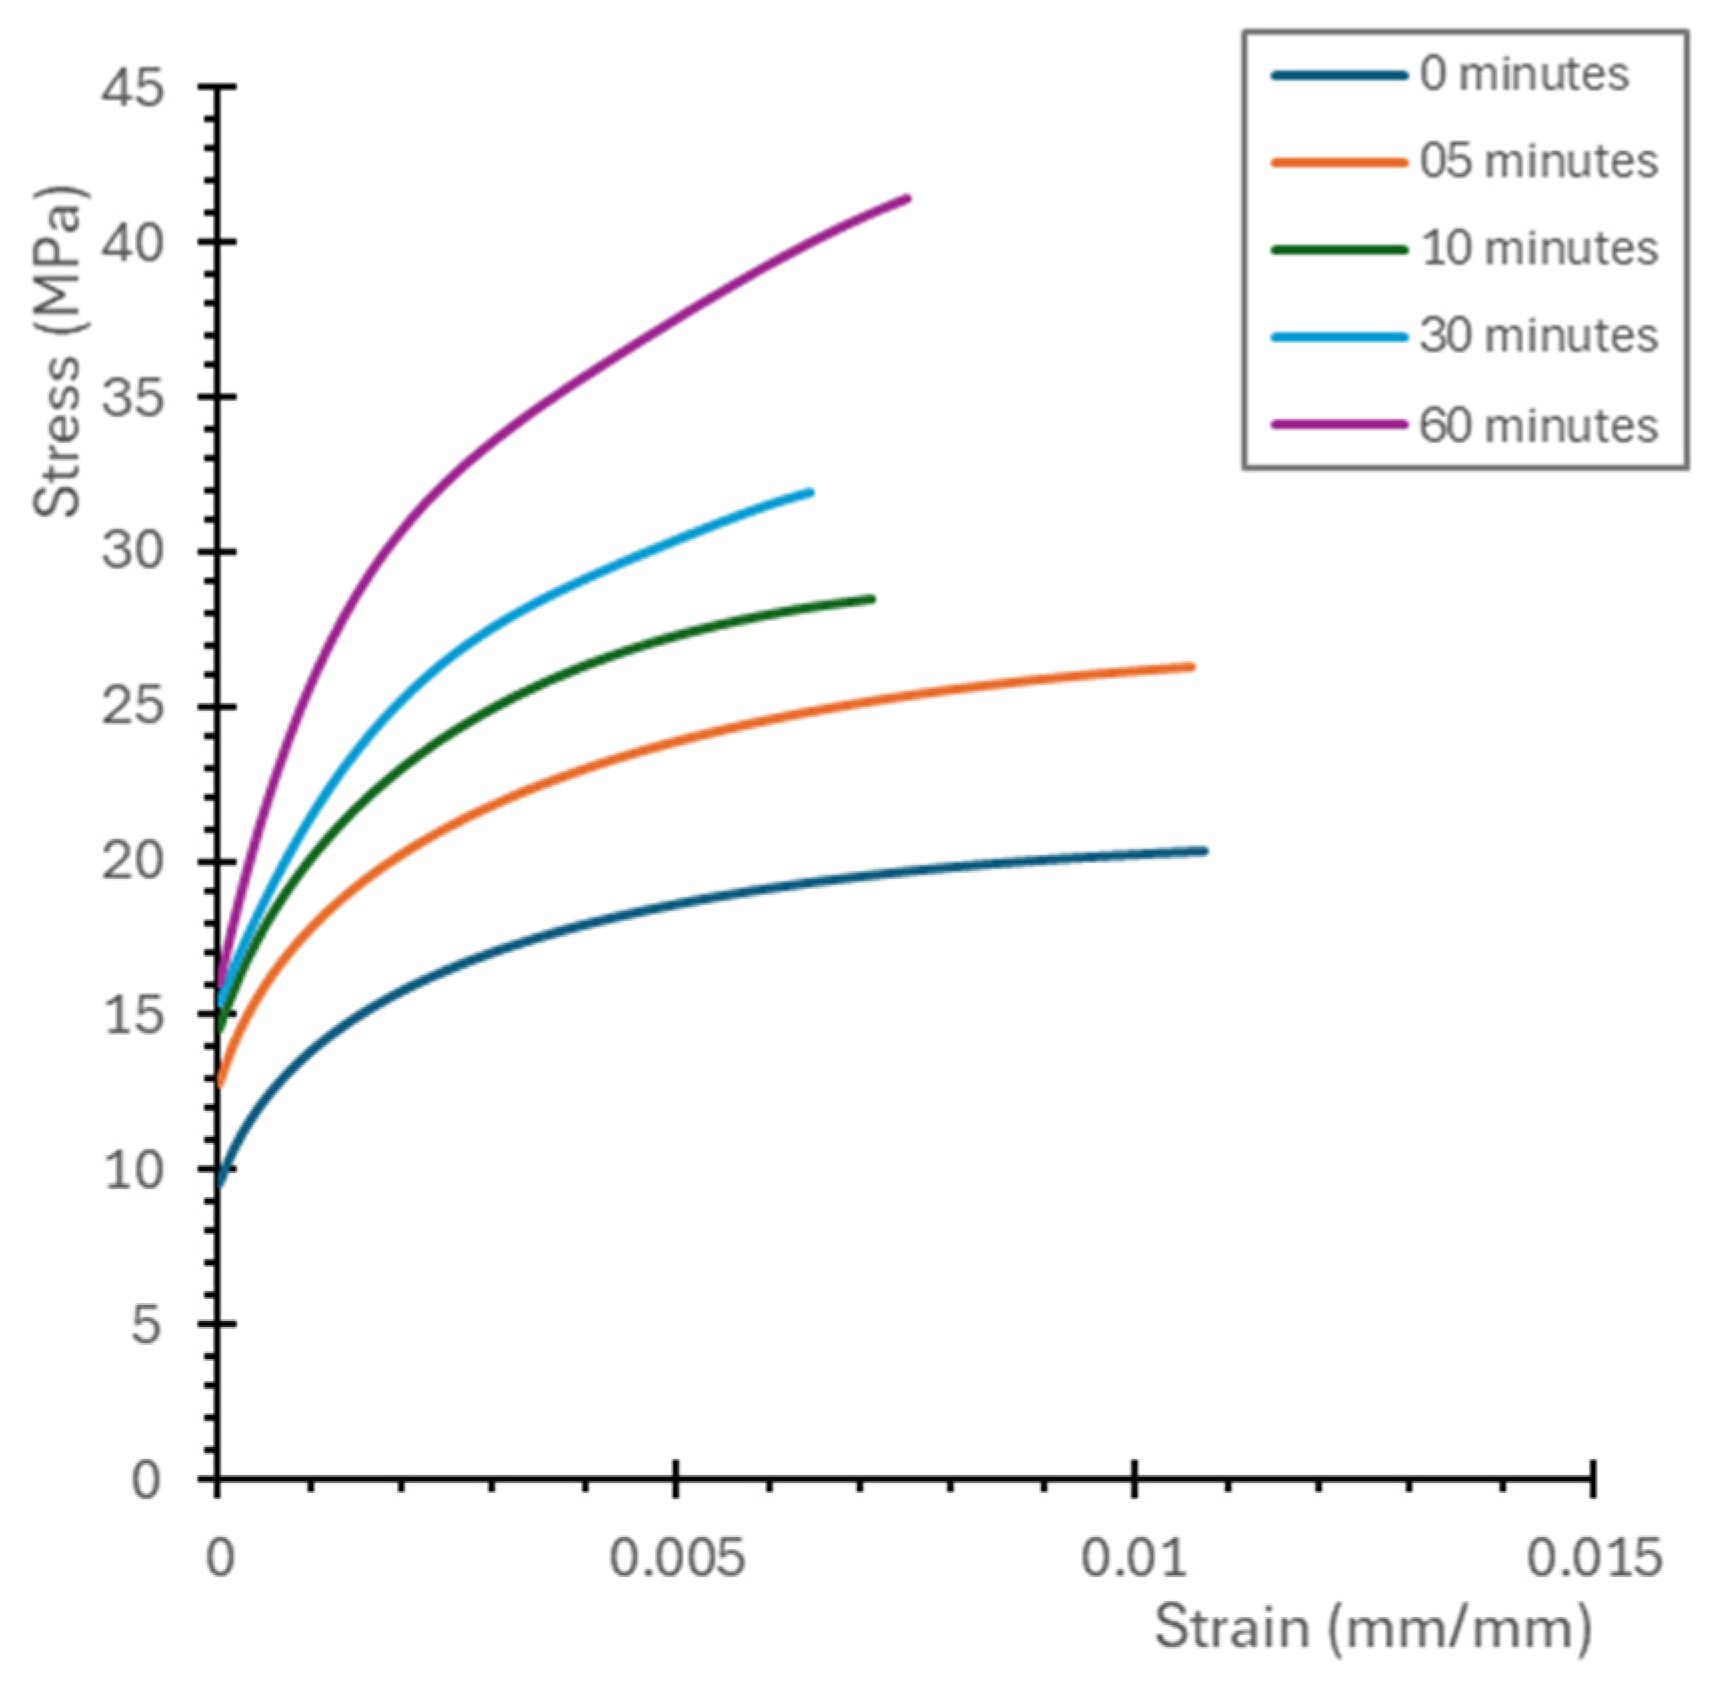
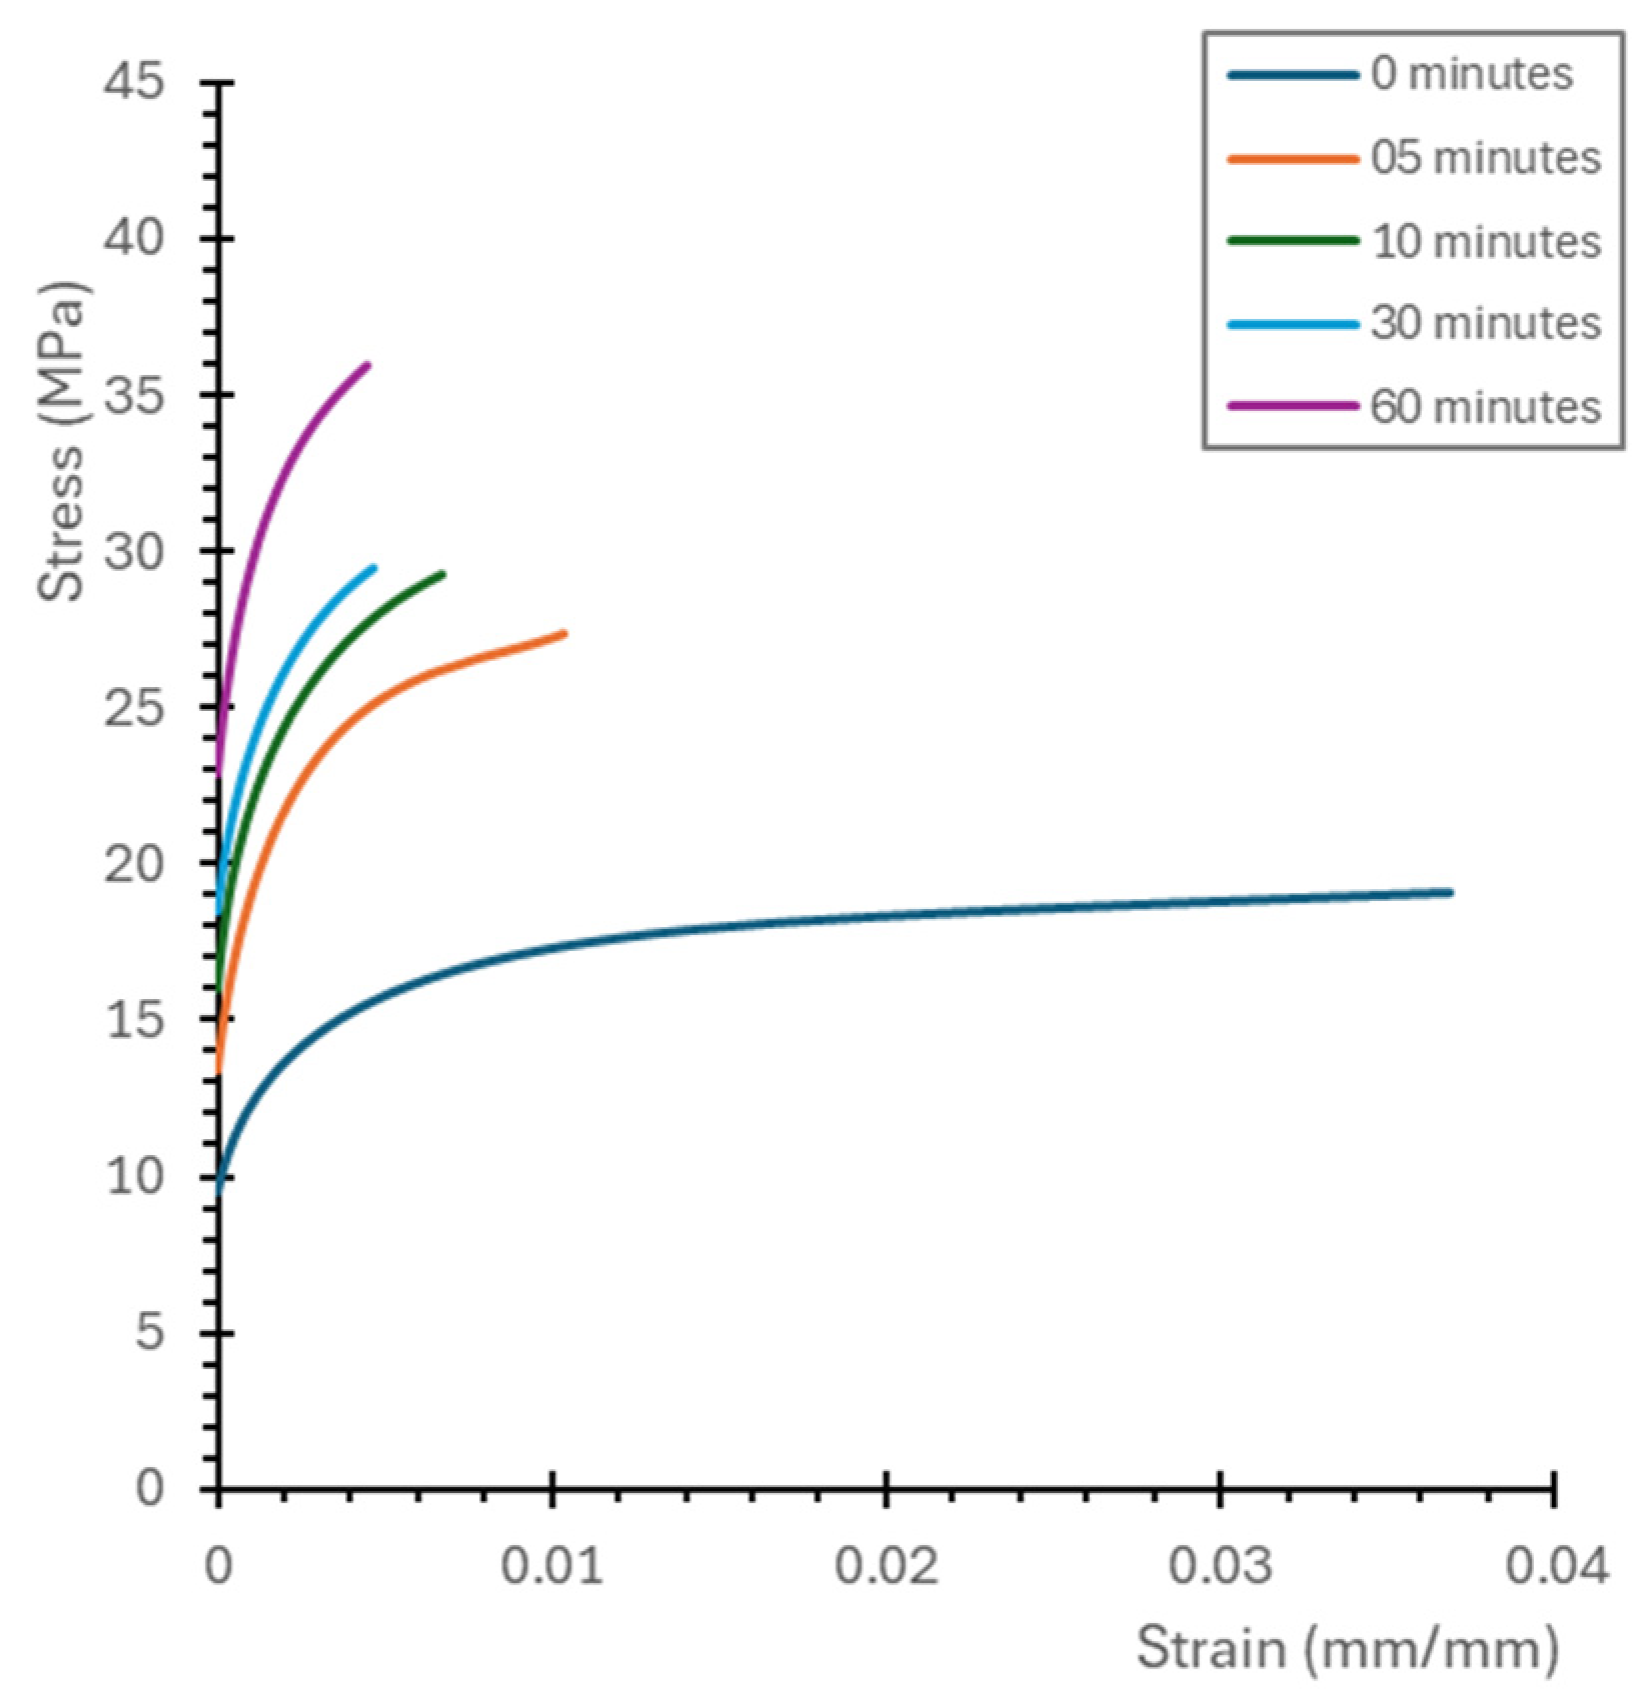
The three-dimensional models of the specimens were developed and subjected to simulations using the Static Structural module of Ansys Workbench 2024 R1. In the material library, as referenced by Bonhin et al. [39] and Oliveira et al. [40], a material called “WW” was created using the properties obtained from the tensile mechanical tests of the specimens, as listed in Table 1 and Table 2 and shown in Figure 11. Figure 11 also displays the MISO curve obtained from the mechanical tests. Figure 12 presents the MISO curves for each post-curing time in the Flat [XY] orientation, and Figure 13 shows the MISO curves for the Vertical [Z] orientation.
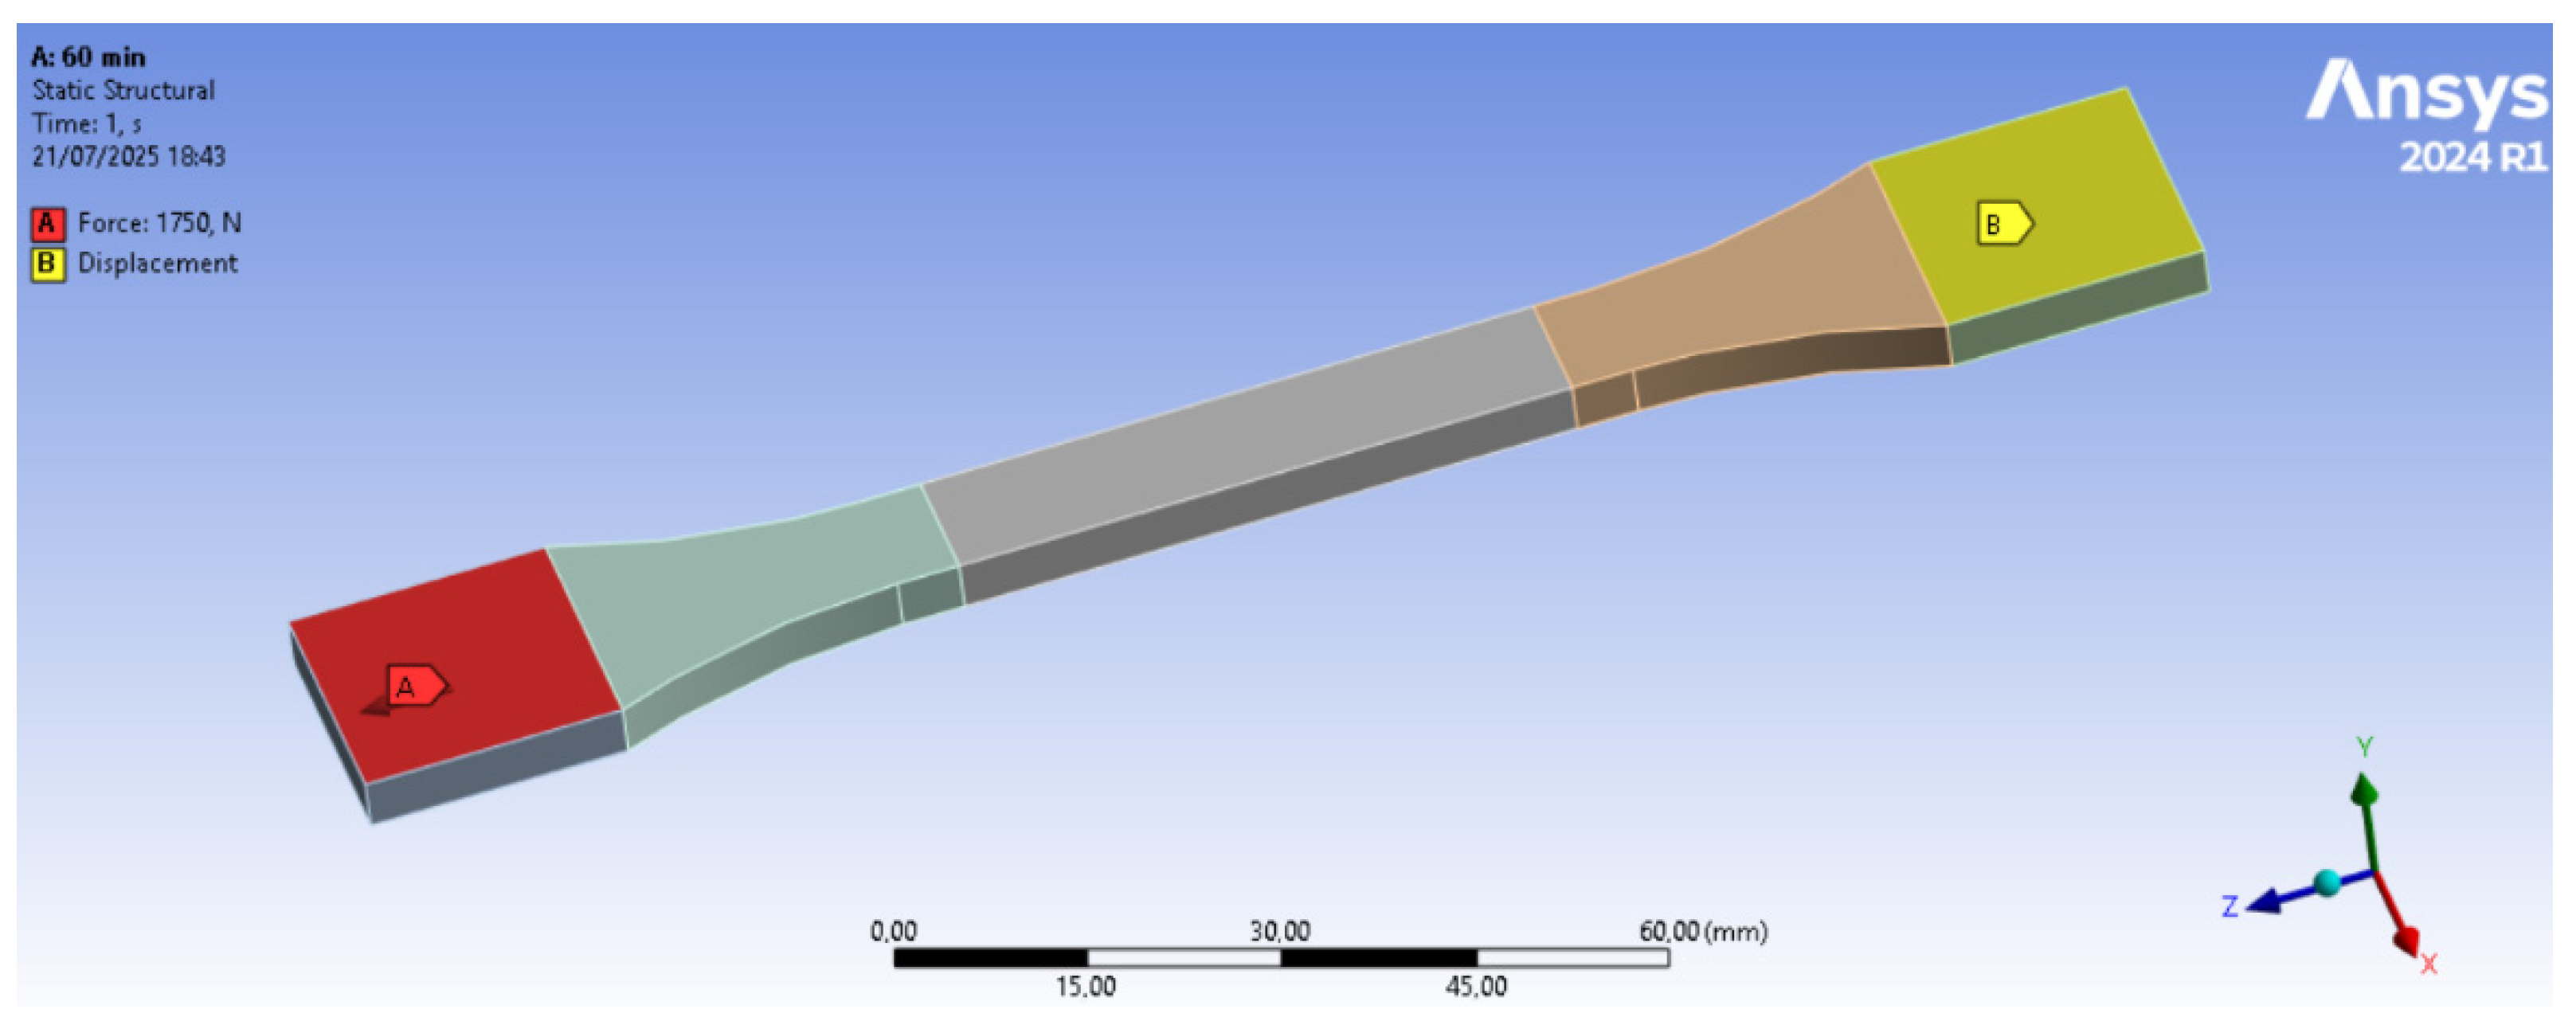
The construction of the tensile specimen model was carried out using ANSYS Workbench, with the specimen modeled as a homogeneous part divided into five sections. This division was made to represent the regions clamped by the grips of the testing machine and the gripping zone. The boundary conditions (application of constraints and loads) are shown in Figure 14. The contacts between the parts of the specimen were defined as bonded, allowing the application of boundary conditions without compromising the continuity of the specimen.
For the bending model, also developed in ANSYS Workbench as shown in Figure 15, four essential motion constraints were implemented to represent the test. Two of these were applied to the supports (displacement D and fixed support). The constraint defined by displacement C refers to the transverse displacement of the specimen (Y-axis), while displacement B refers to the punch movement, allowing displacement only along the vertical axis (Z).
Similar to the tensile model, the contact between the divided sections of the specimens was defined as bonded, while the contact between the specimen and the supports was set as frictionless. This configuration allowed the specimen to slide over the supports during the punch displacement, as occurs in the actual bending test. Table 3 presents the displacement values applied to the punch for the Flat [XY], On-edge [XZ], and Vertical [Z] orientations.
The finite element mesh was developed using SOLID186, CONTA174, TARGE170, and SURF154 elements for both cases (tensile and bending). The total number of nodes and elements generated was approximately 51,700 and 10,400, respectively, for the tensile model, and 87,200 and 18,200, respectively, for the bending model. The resulting mesh is shown in Figure 16 (tensile) and Figure 17 (bending).

3. Results

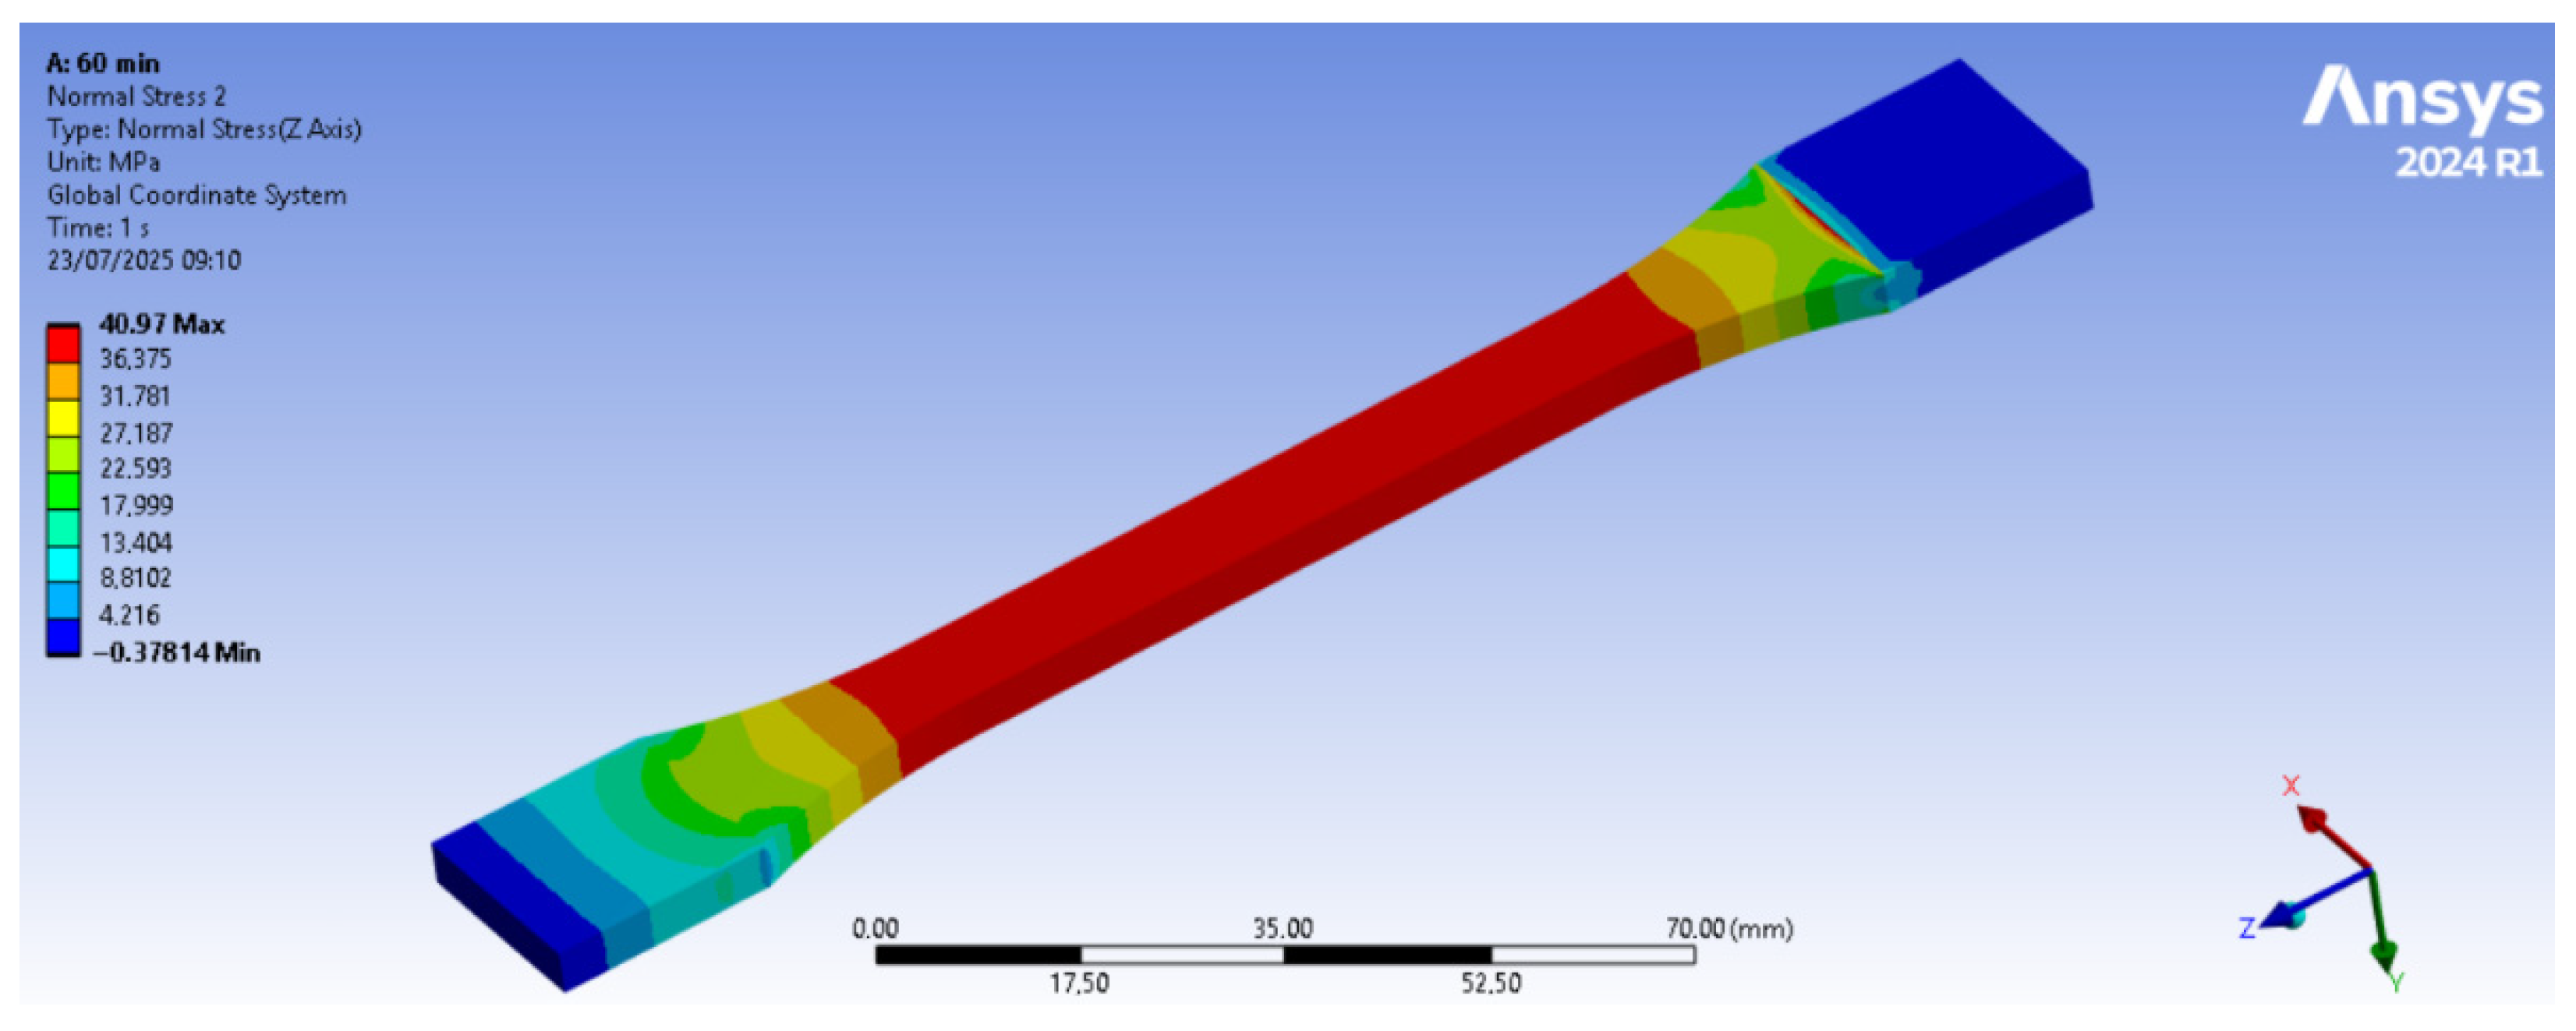
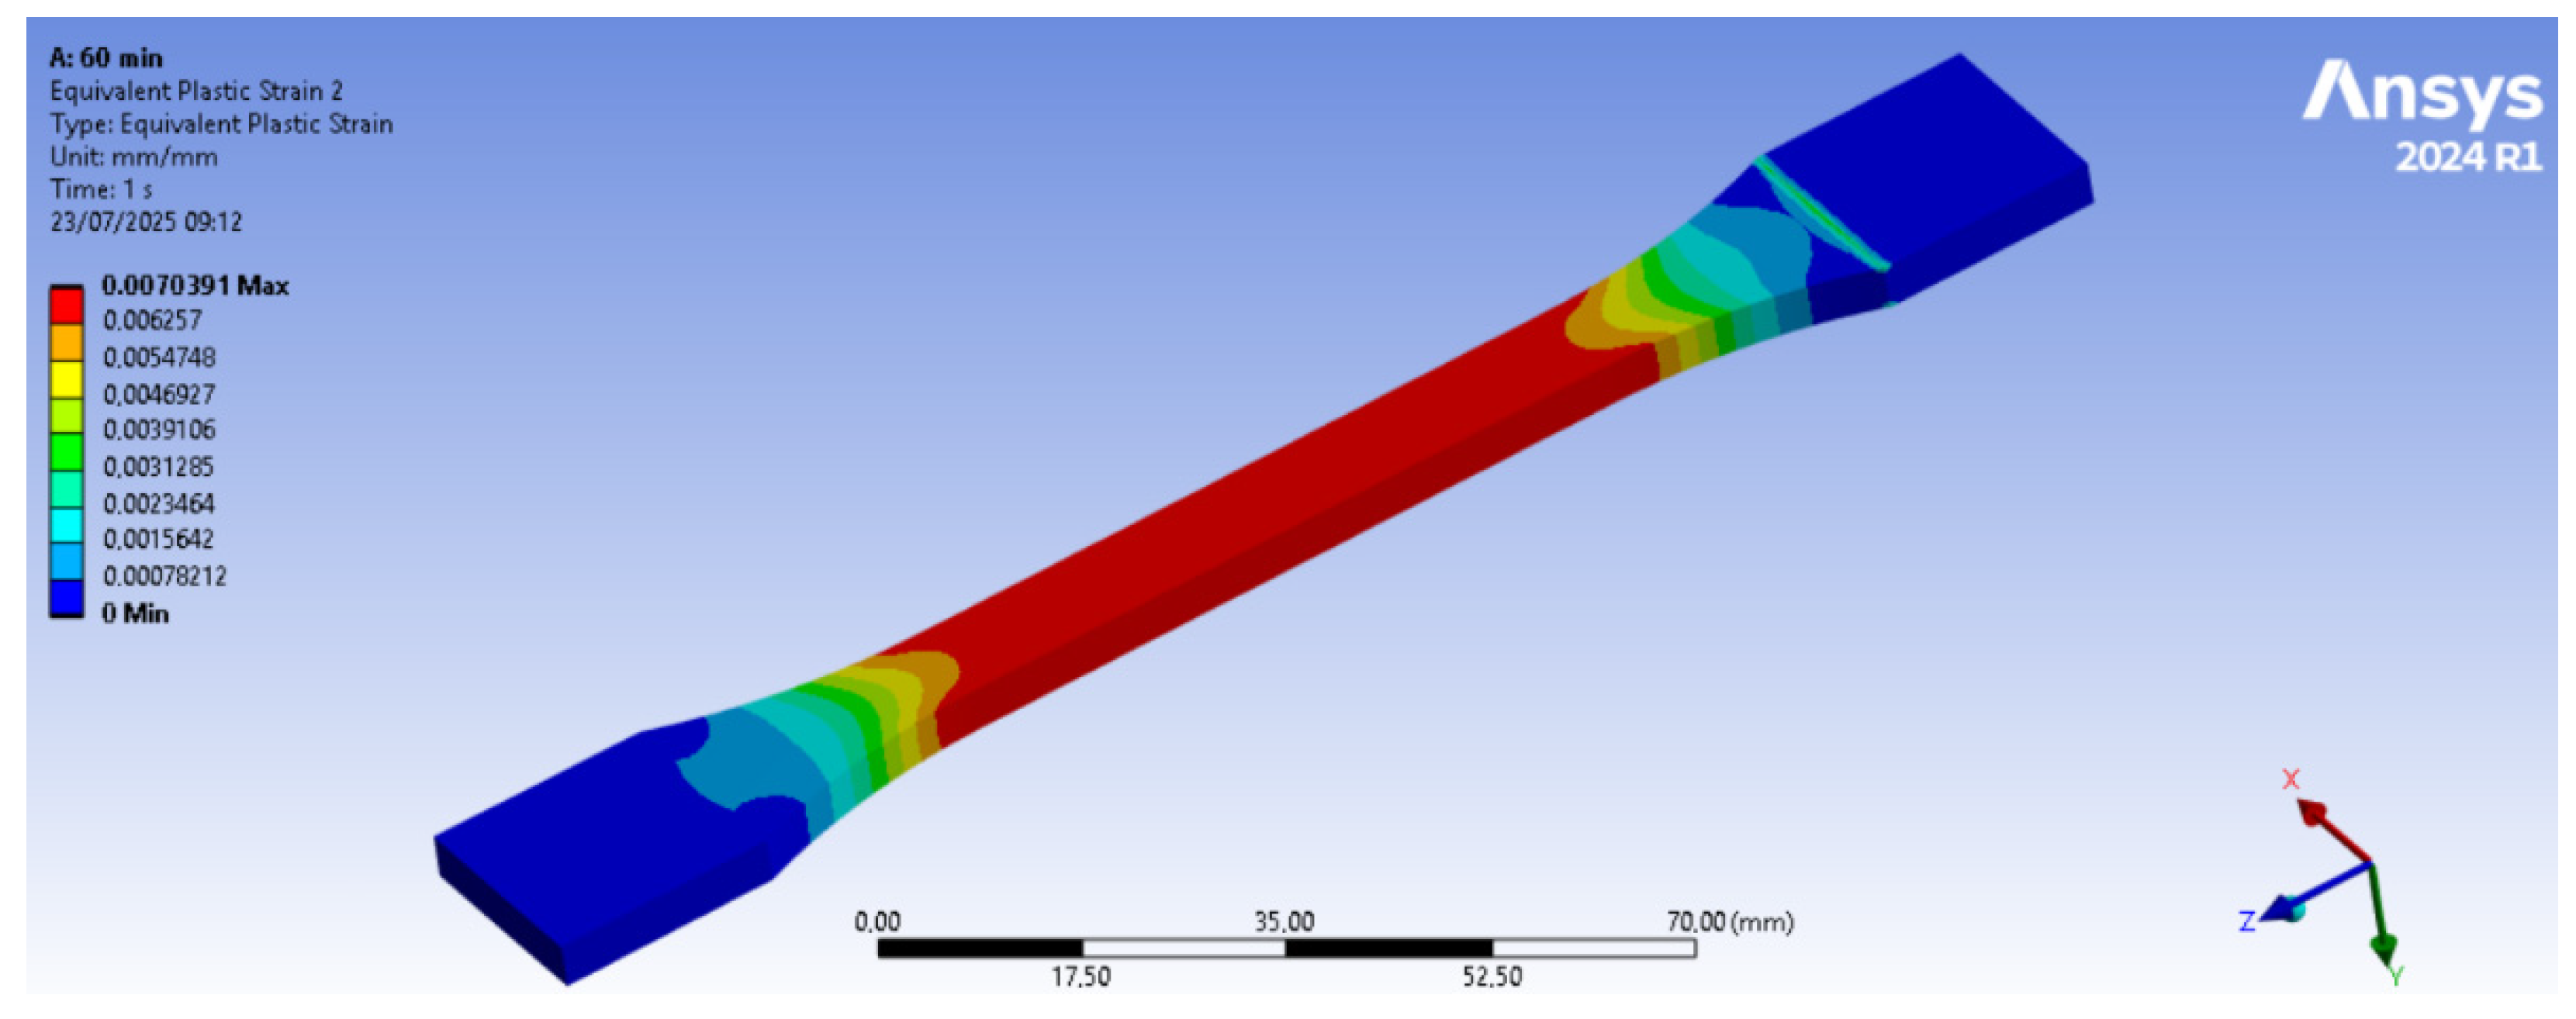
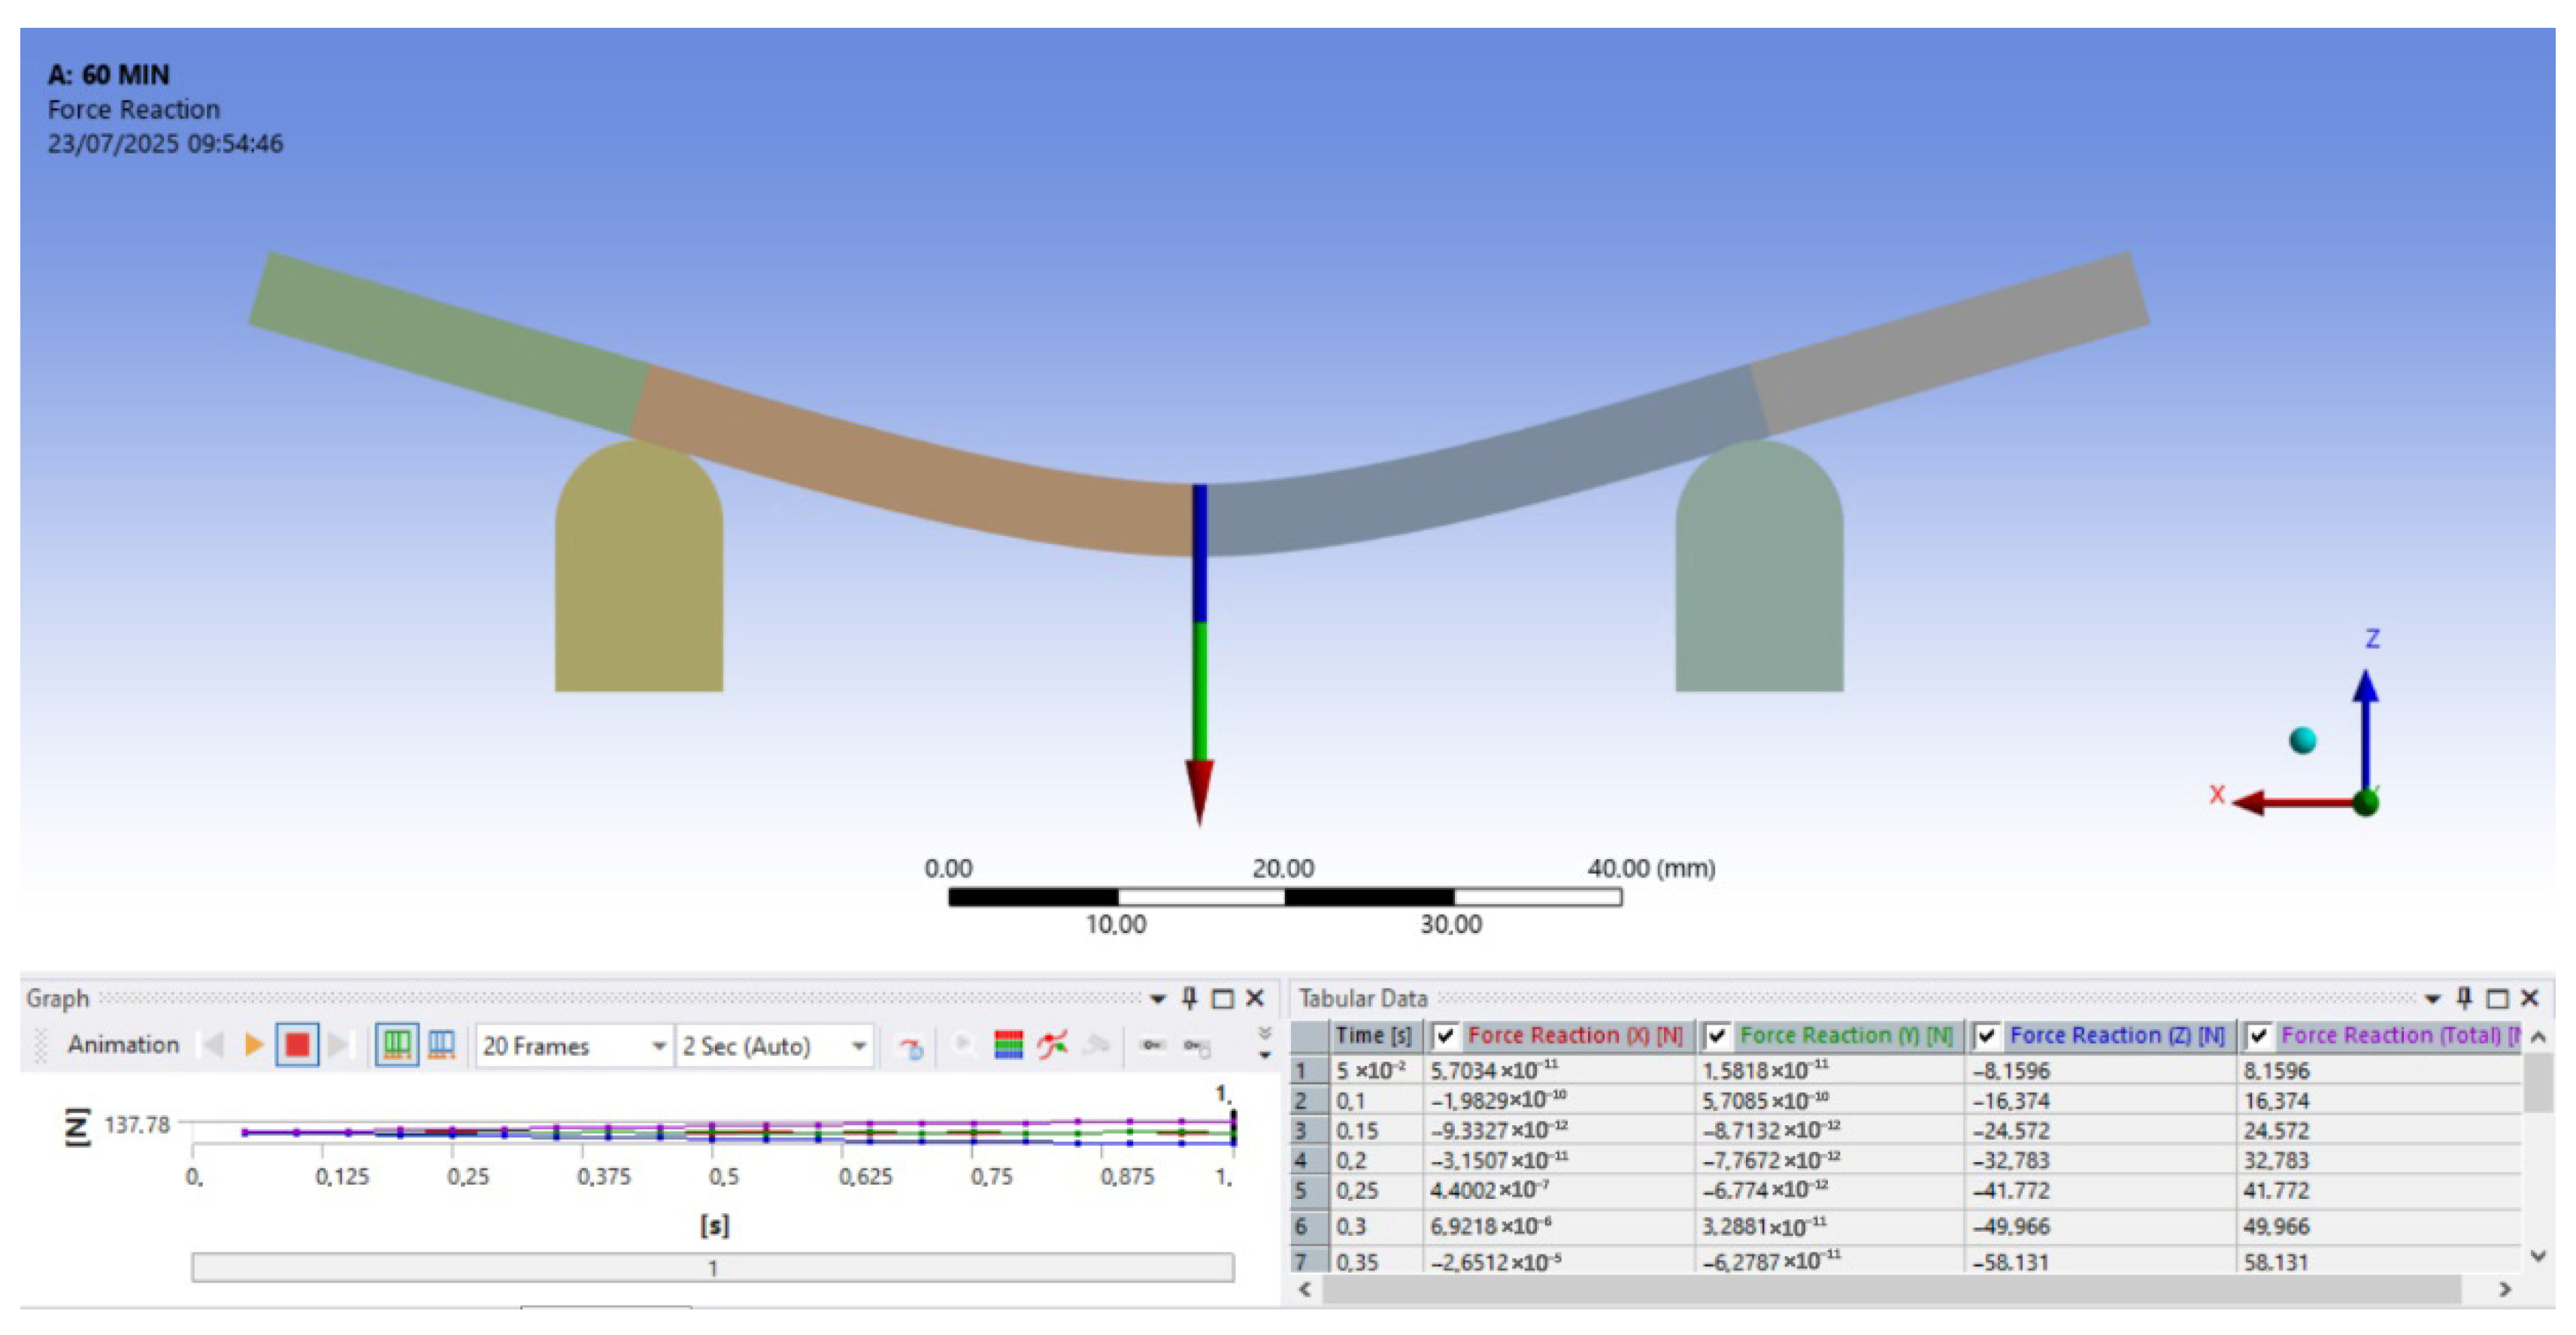
The data analyzed in the computational numerical simulation models included Flat [XY] stress (Figure 18), elastic strain (Figure 19), and plastic strain (Figure 20) for the tensile tests. For the bending tests, displacement (Figure 21) and the force applied by the punch (Figure 22) were analyzed. These examples are presented for the model with 60 min post-curing time in the Flat [XY] orientation. The same procedure was followed for all curing times for comparison with the experimental method, both in tensile and bending tests.
For the bending tests, the displacement and force applied by the punch were analyzed for all curing times. As an example, Figure 21 and Figure 22 show the displacement and punch force values, respectively, for the model with 60 min post-curing time in the Flat [XY] orientation.
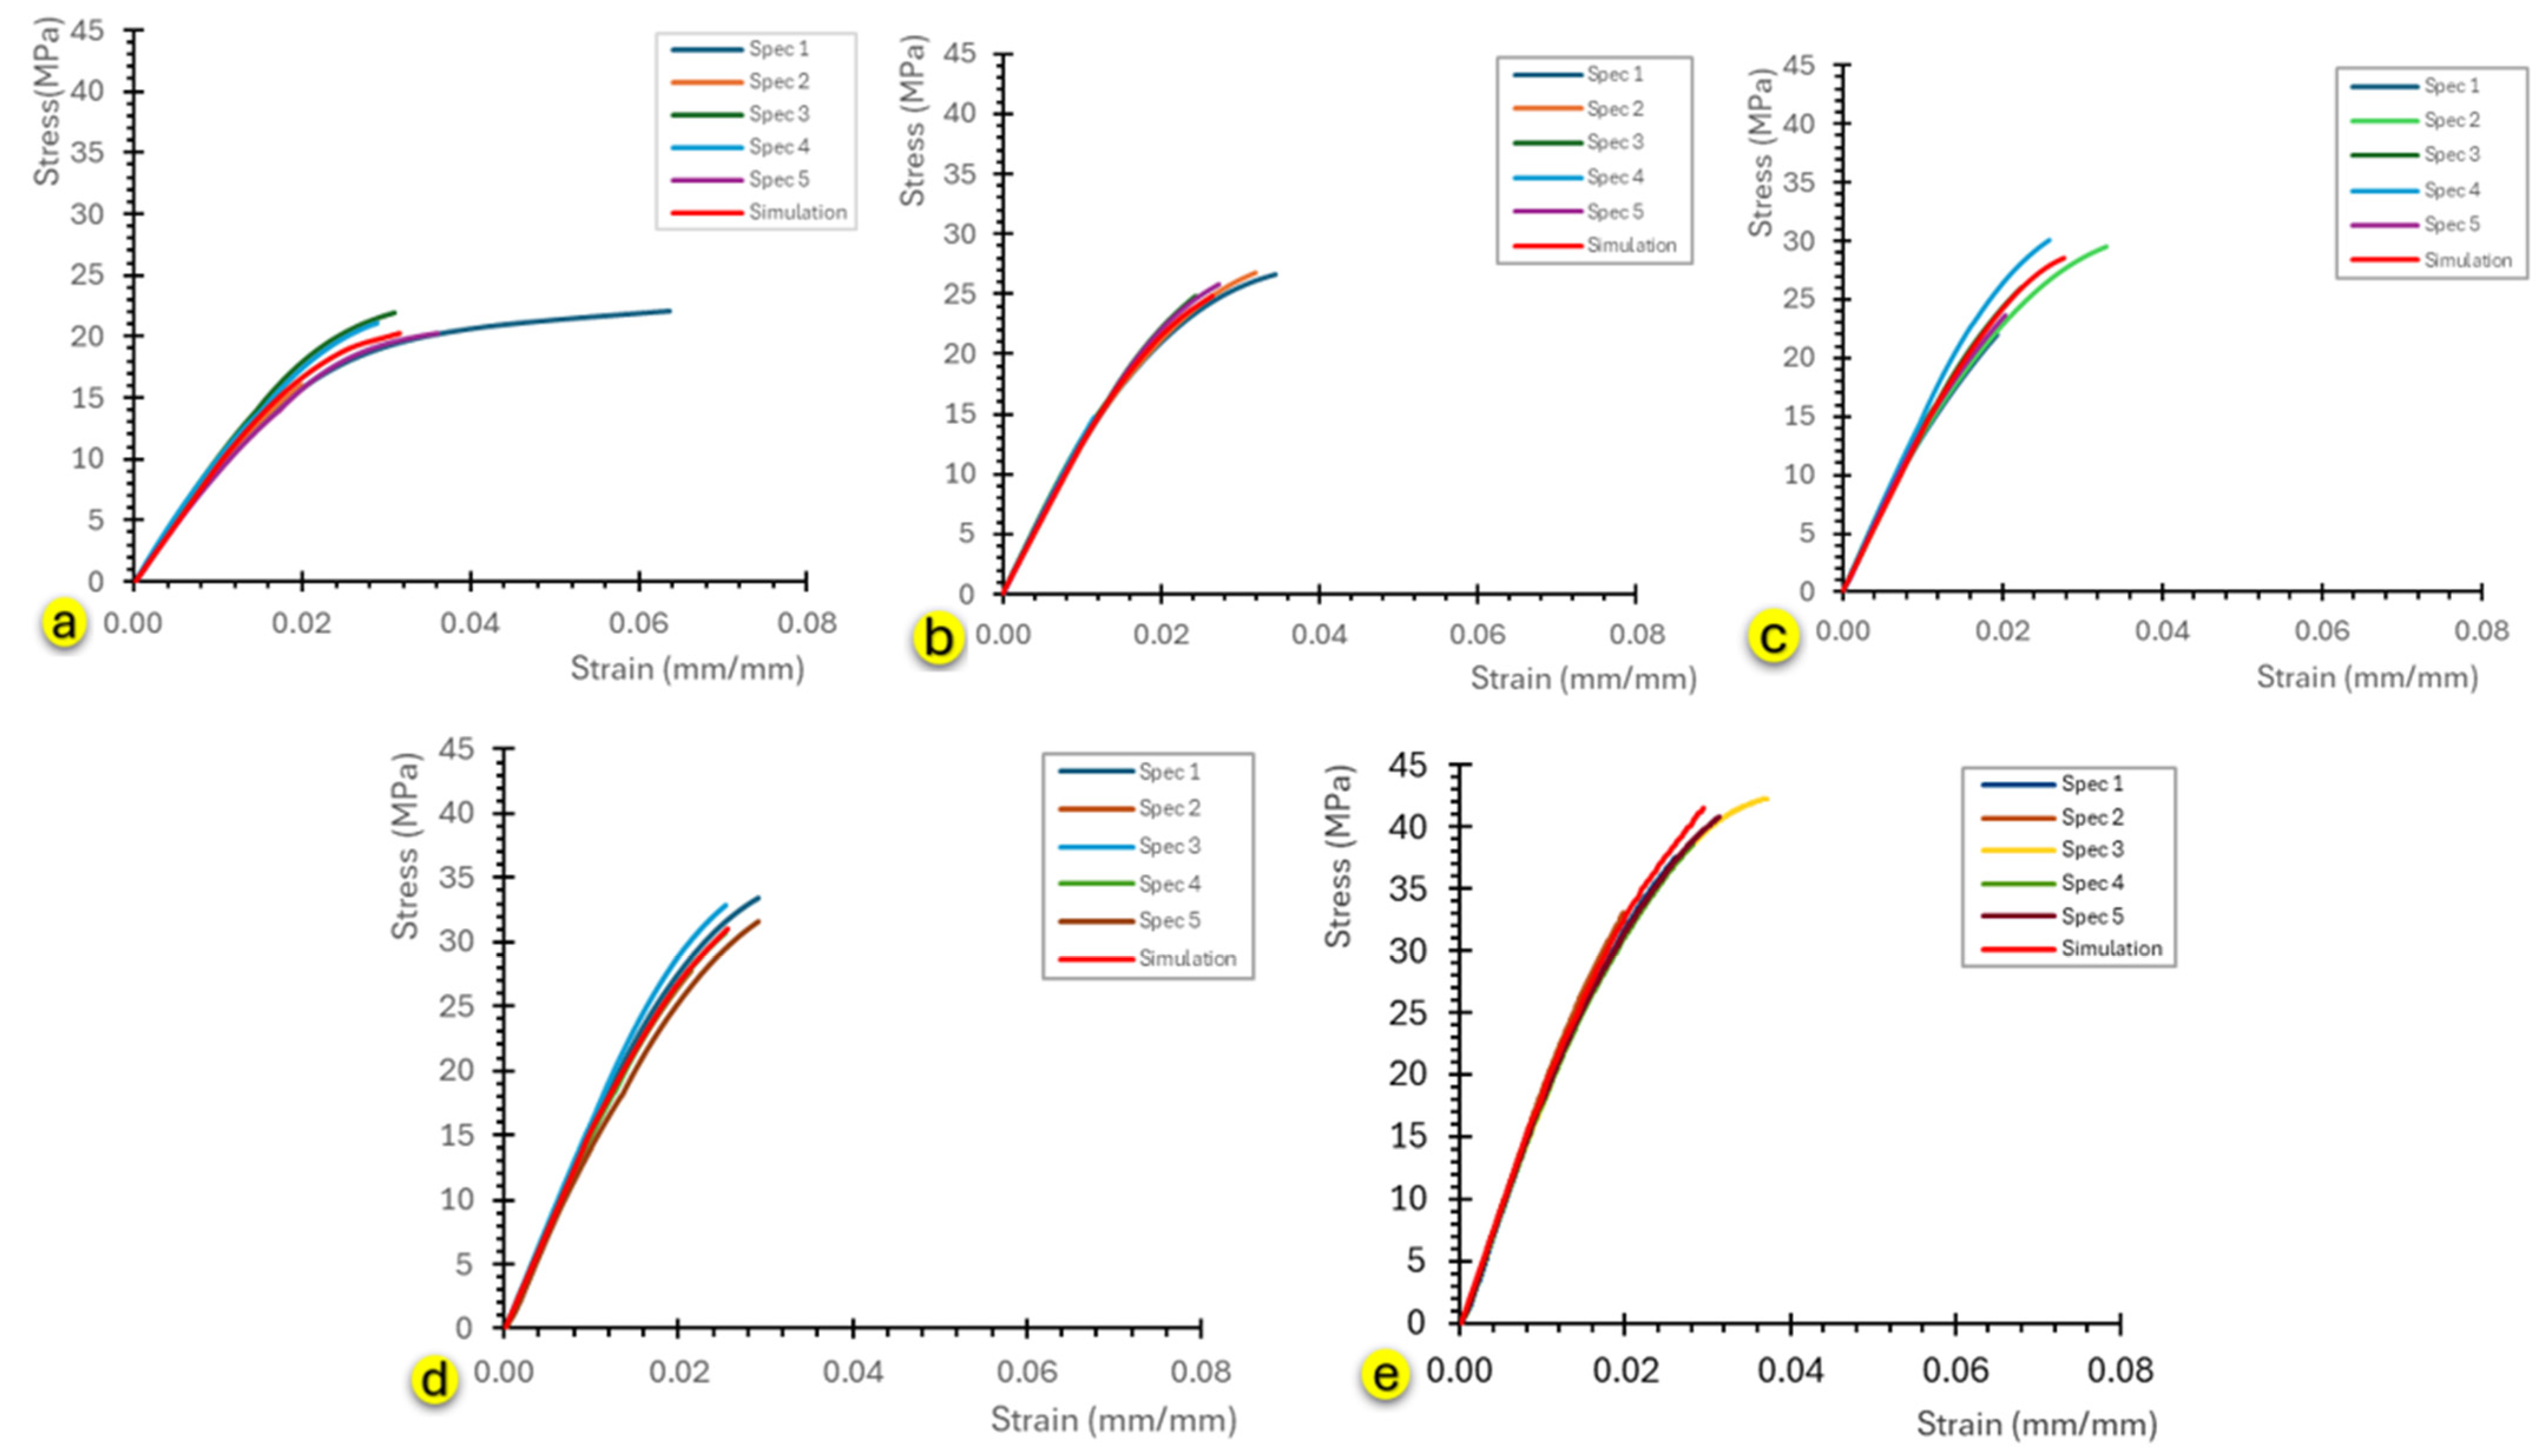
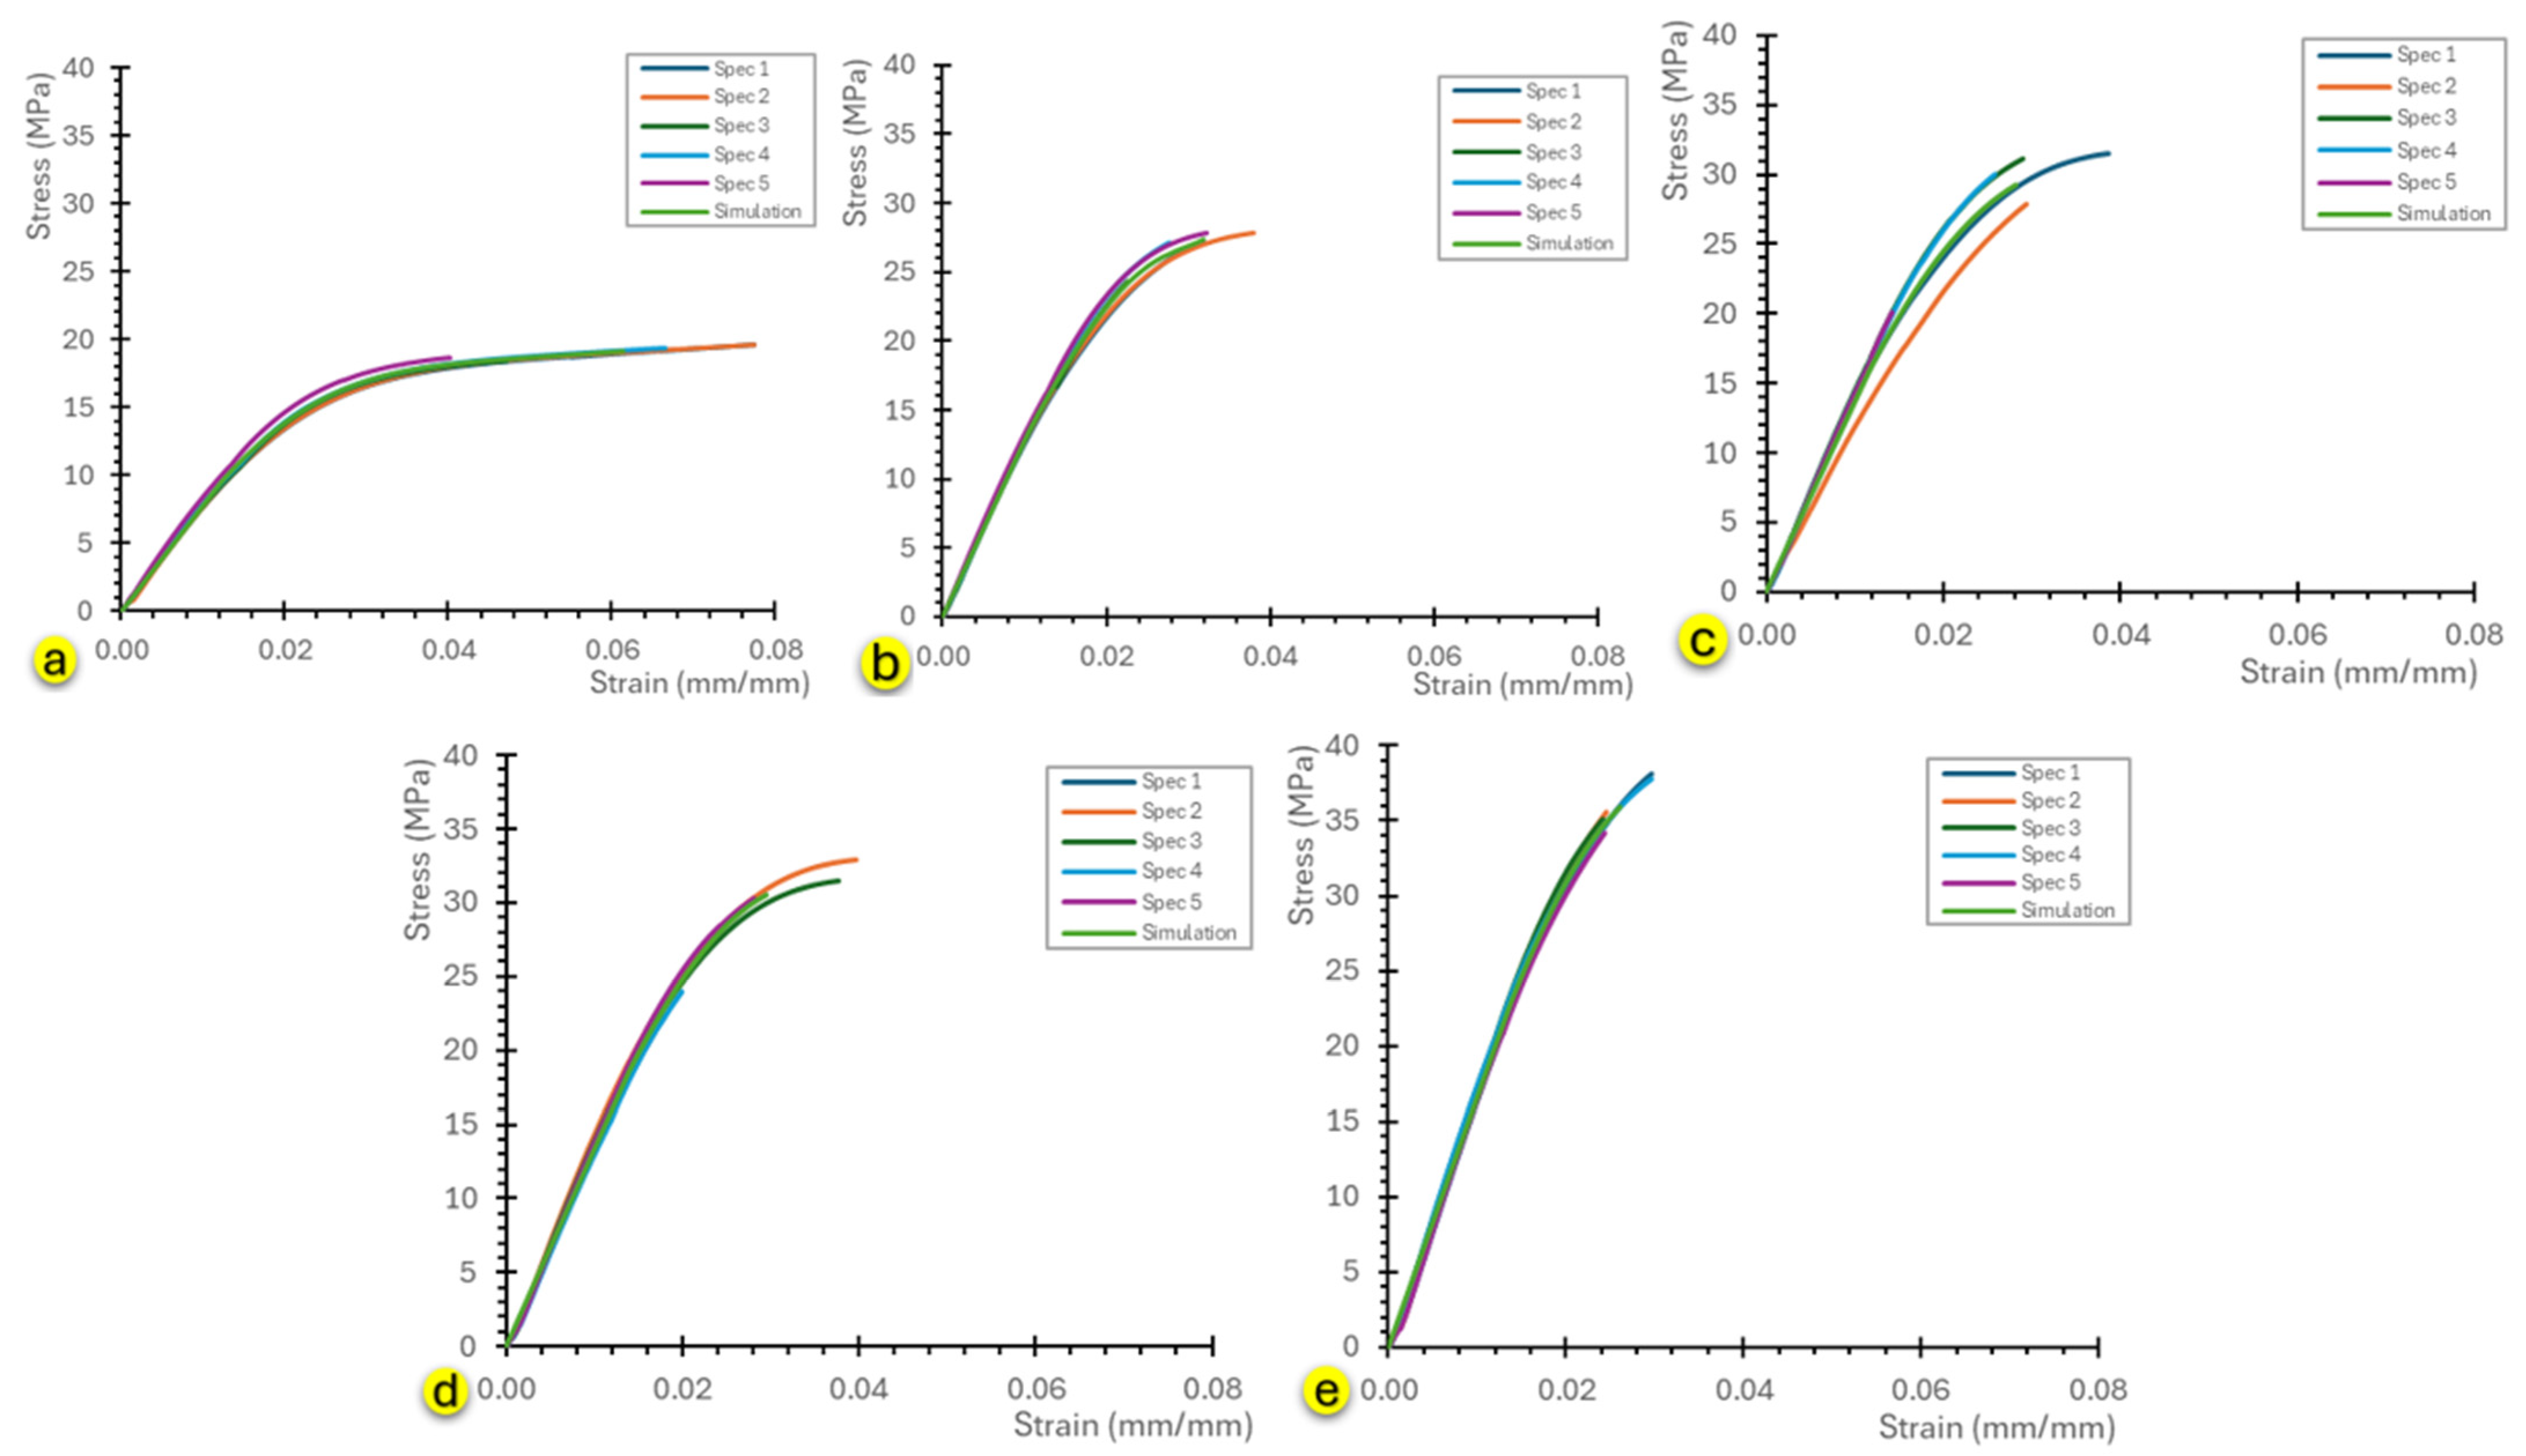
The results obtained from the tensile tests in the Flat [XY] direction, along with the curves from the computational numerical simulation performed in Ansys, are shown in Figure 23a (0 min), Figure 23b (5 min), Figure 23c (10 min), Figure 23d (30 min), and Figure 23e (60 min). Similarly, for the Vertical [Z] direction, the results are shown in Figure 24a–e. As can be seen in Figure 23a–e and Figure 24a–e, the stress–strain behavior of the simulation models reproduces the average experimental tensile curves for all curing times and orientations, demonstrating the reliability of the generated models. Also, in Figure 23a–e and Figure 24a–e, it is evident that the 60 min post-curing time produced less variation among specimens (lower curve dispersion), indicating that the material reached the final stage of the curing process.
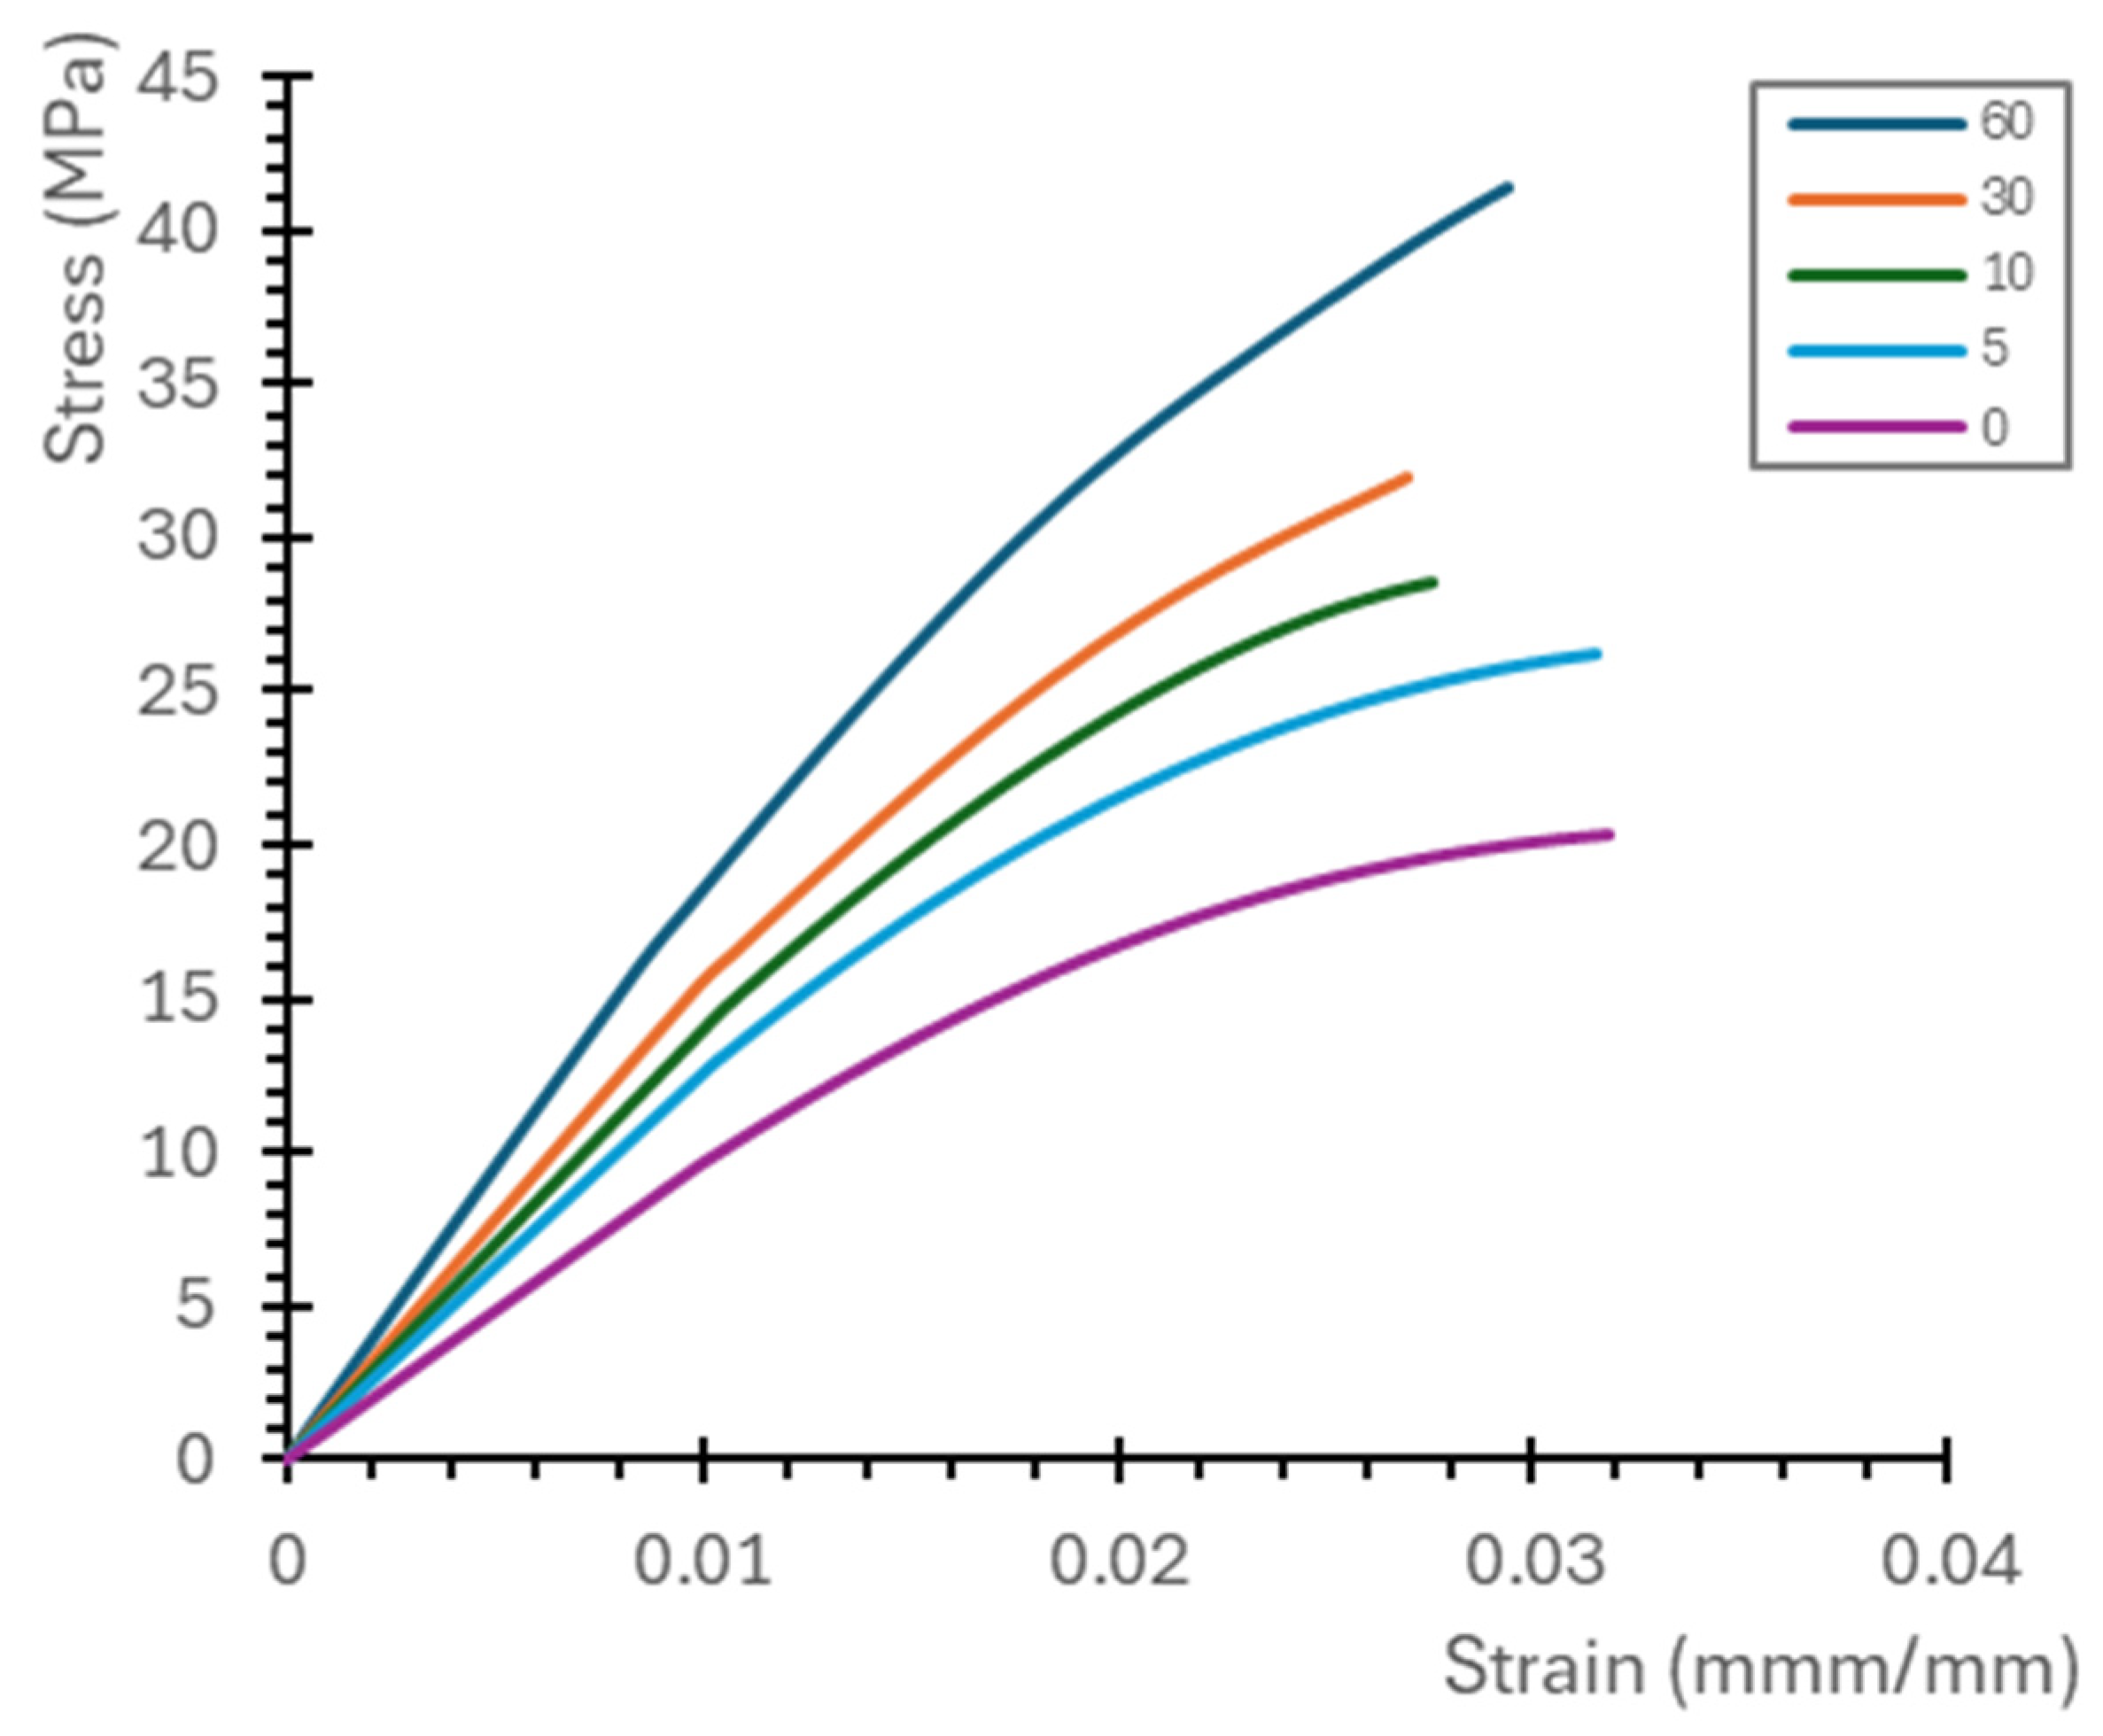
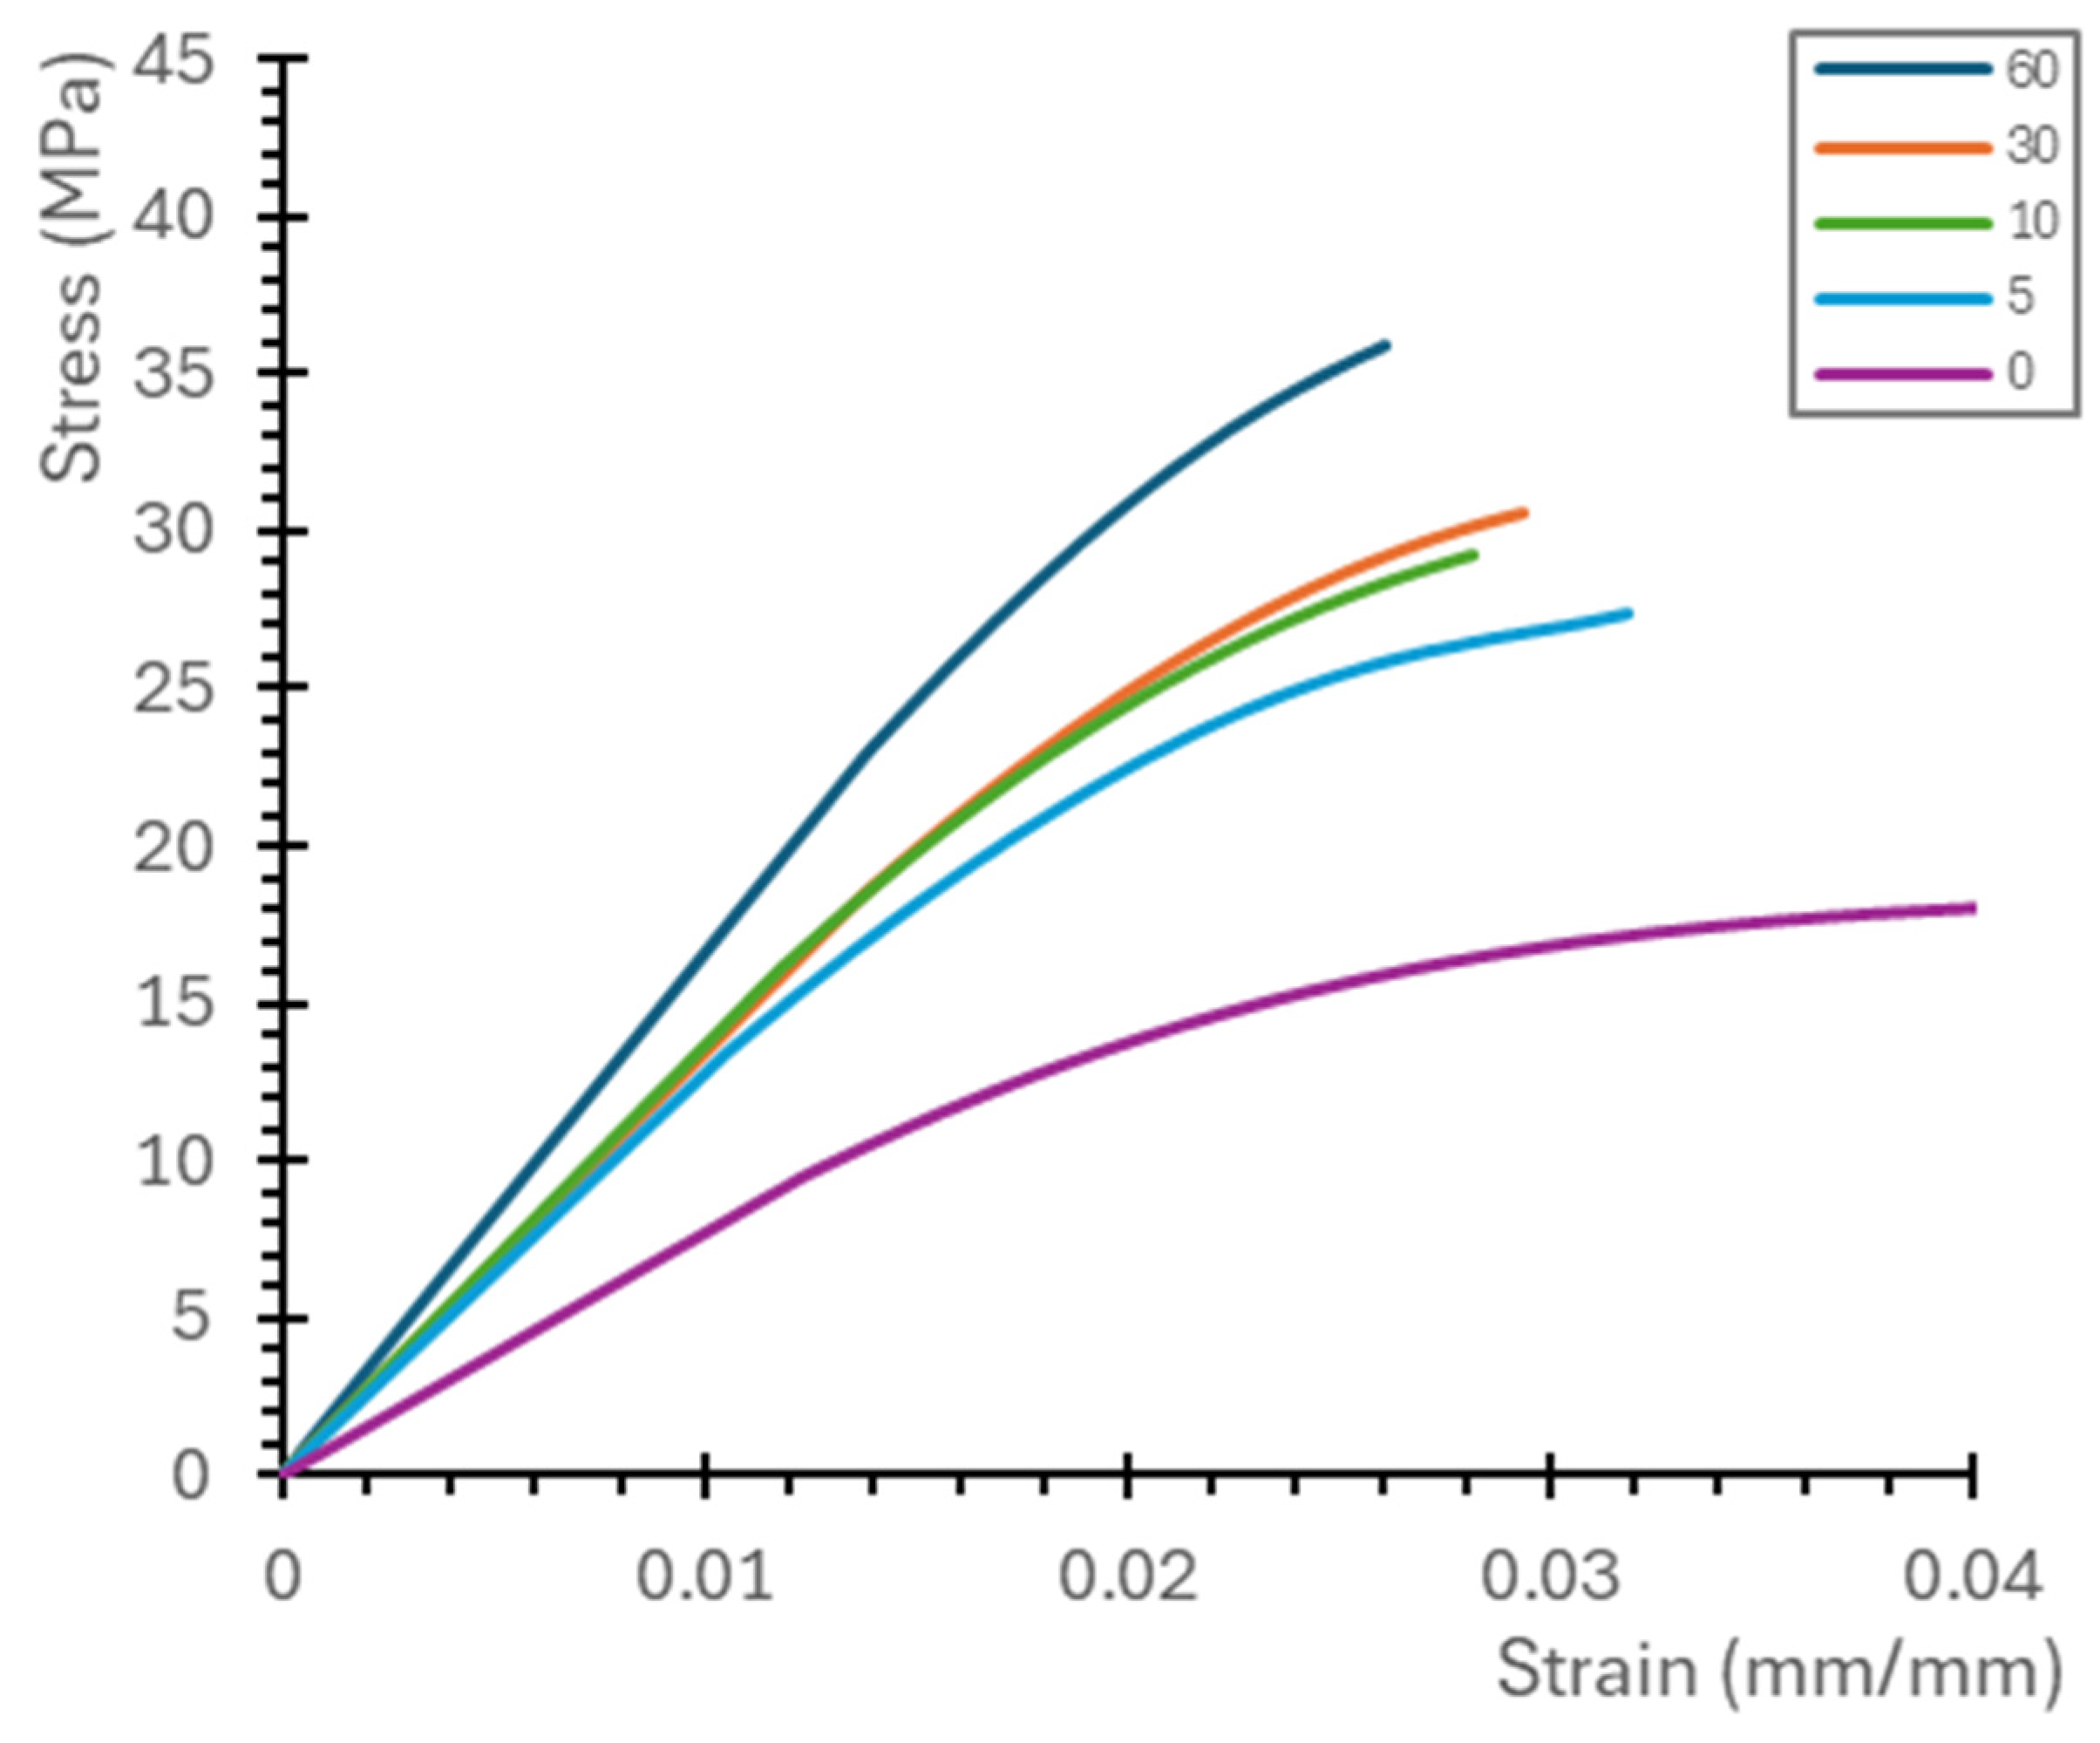
Figure 25 and Figure 26 show the average simulated curves for all curing times in the Flat [XY] and Vertical [Z] directions, respectively. In both cases, it is clear that longer post-curing times result in higher material strength and elastic modulus, and consequently lower elongation. In Figure 26, a closer proximity between the 10 and 30 min curves can be observed, probably due to the use of more than one bottle of resin during sample production, in this batch specifically. Different batches may present small variations in the photoinitiator component, making the resin more reactive to UV light.
Table 4 and Table 5 present the coefficients of the average equations obtained from the experimental data for each curing time in the Flat [XY] and Vertical [Z] orientations, respectively, according to the general equation shown in Equation (2), where “y” is the stress and “x” is the strain.
y = a 0 x 6 + a 1 x 5 + a 2 x 4 + a 3 x 3 + a 4 x 2 + a 5 x
Table 6 and Table 7 show the Young’s modulus values obtained using the proposed Matlab script for the Flat [XY] and Vertical [Z] orientations, respectively.
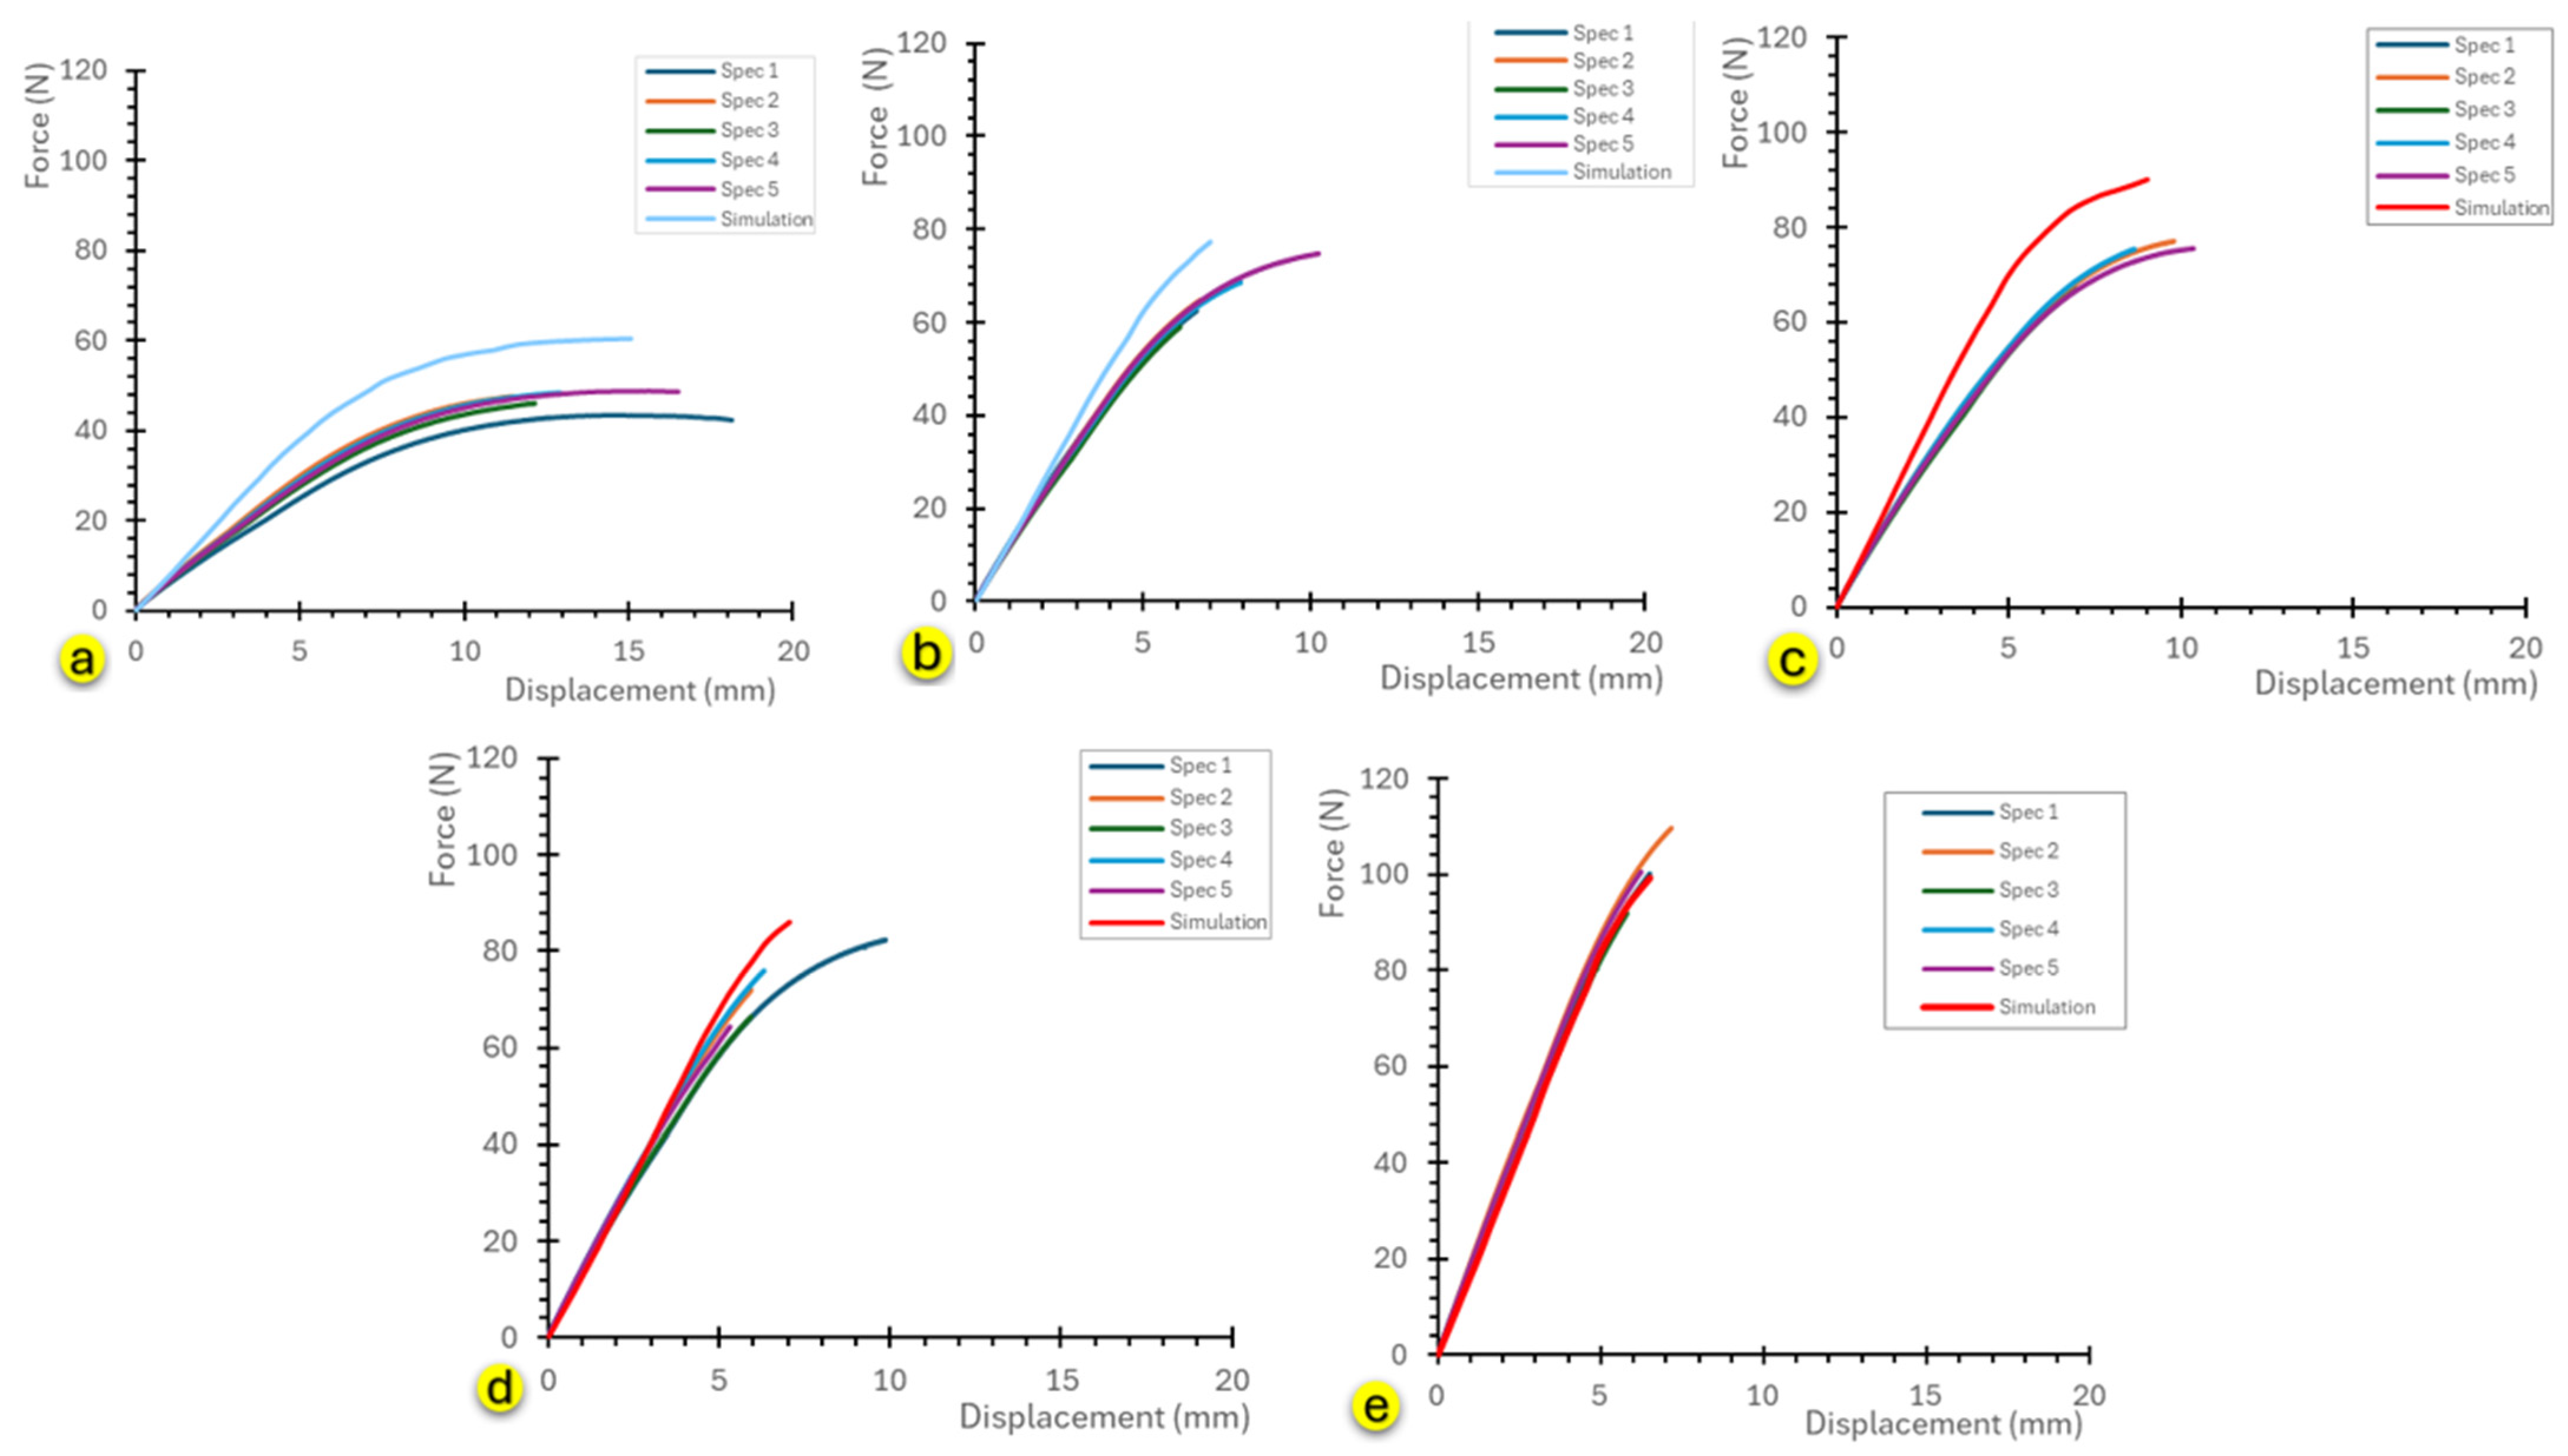
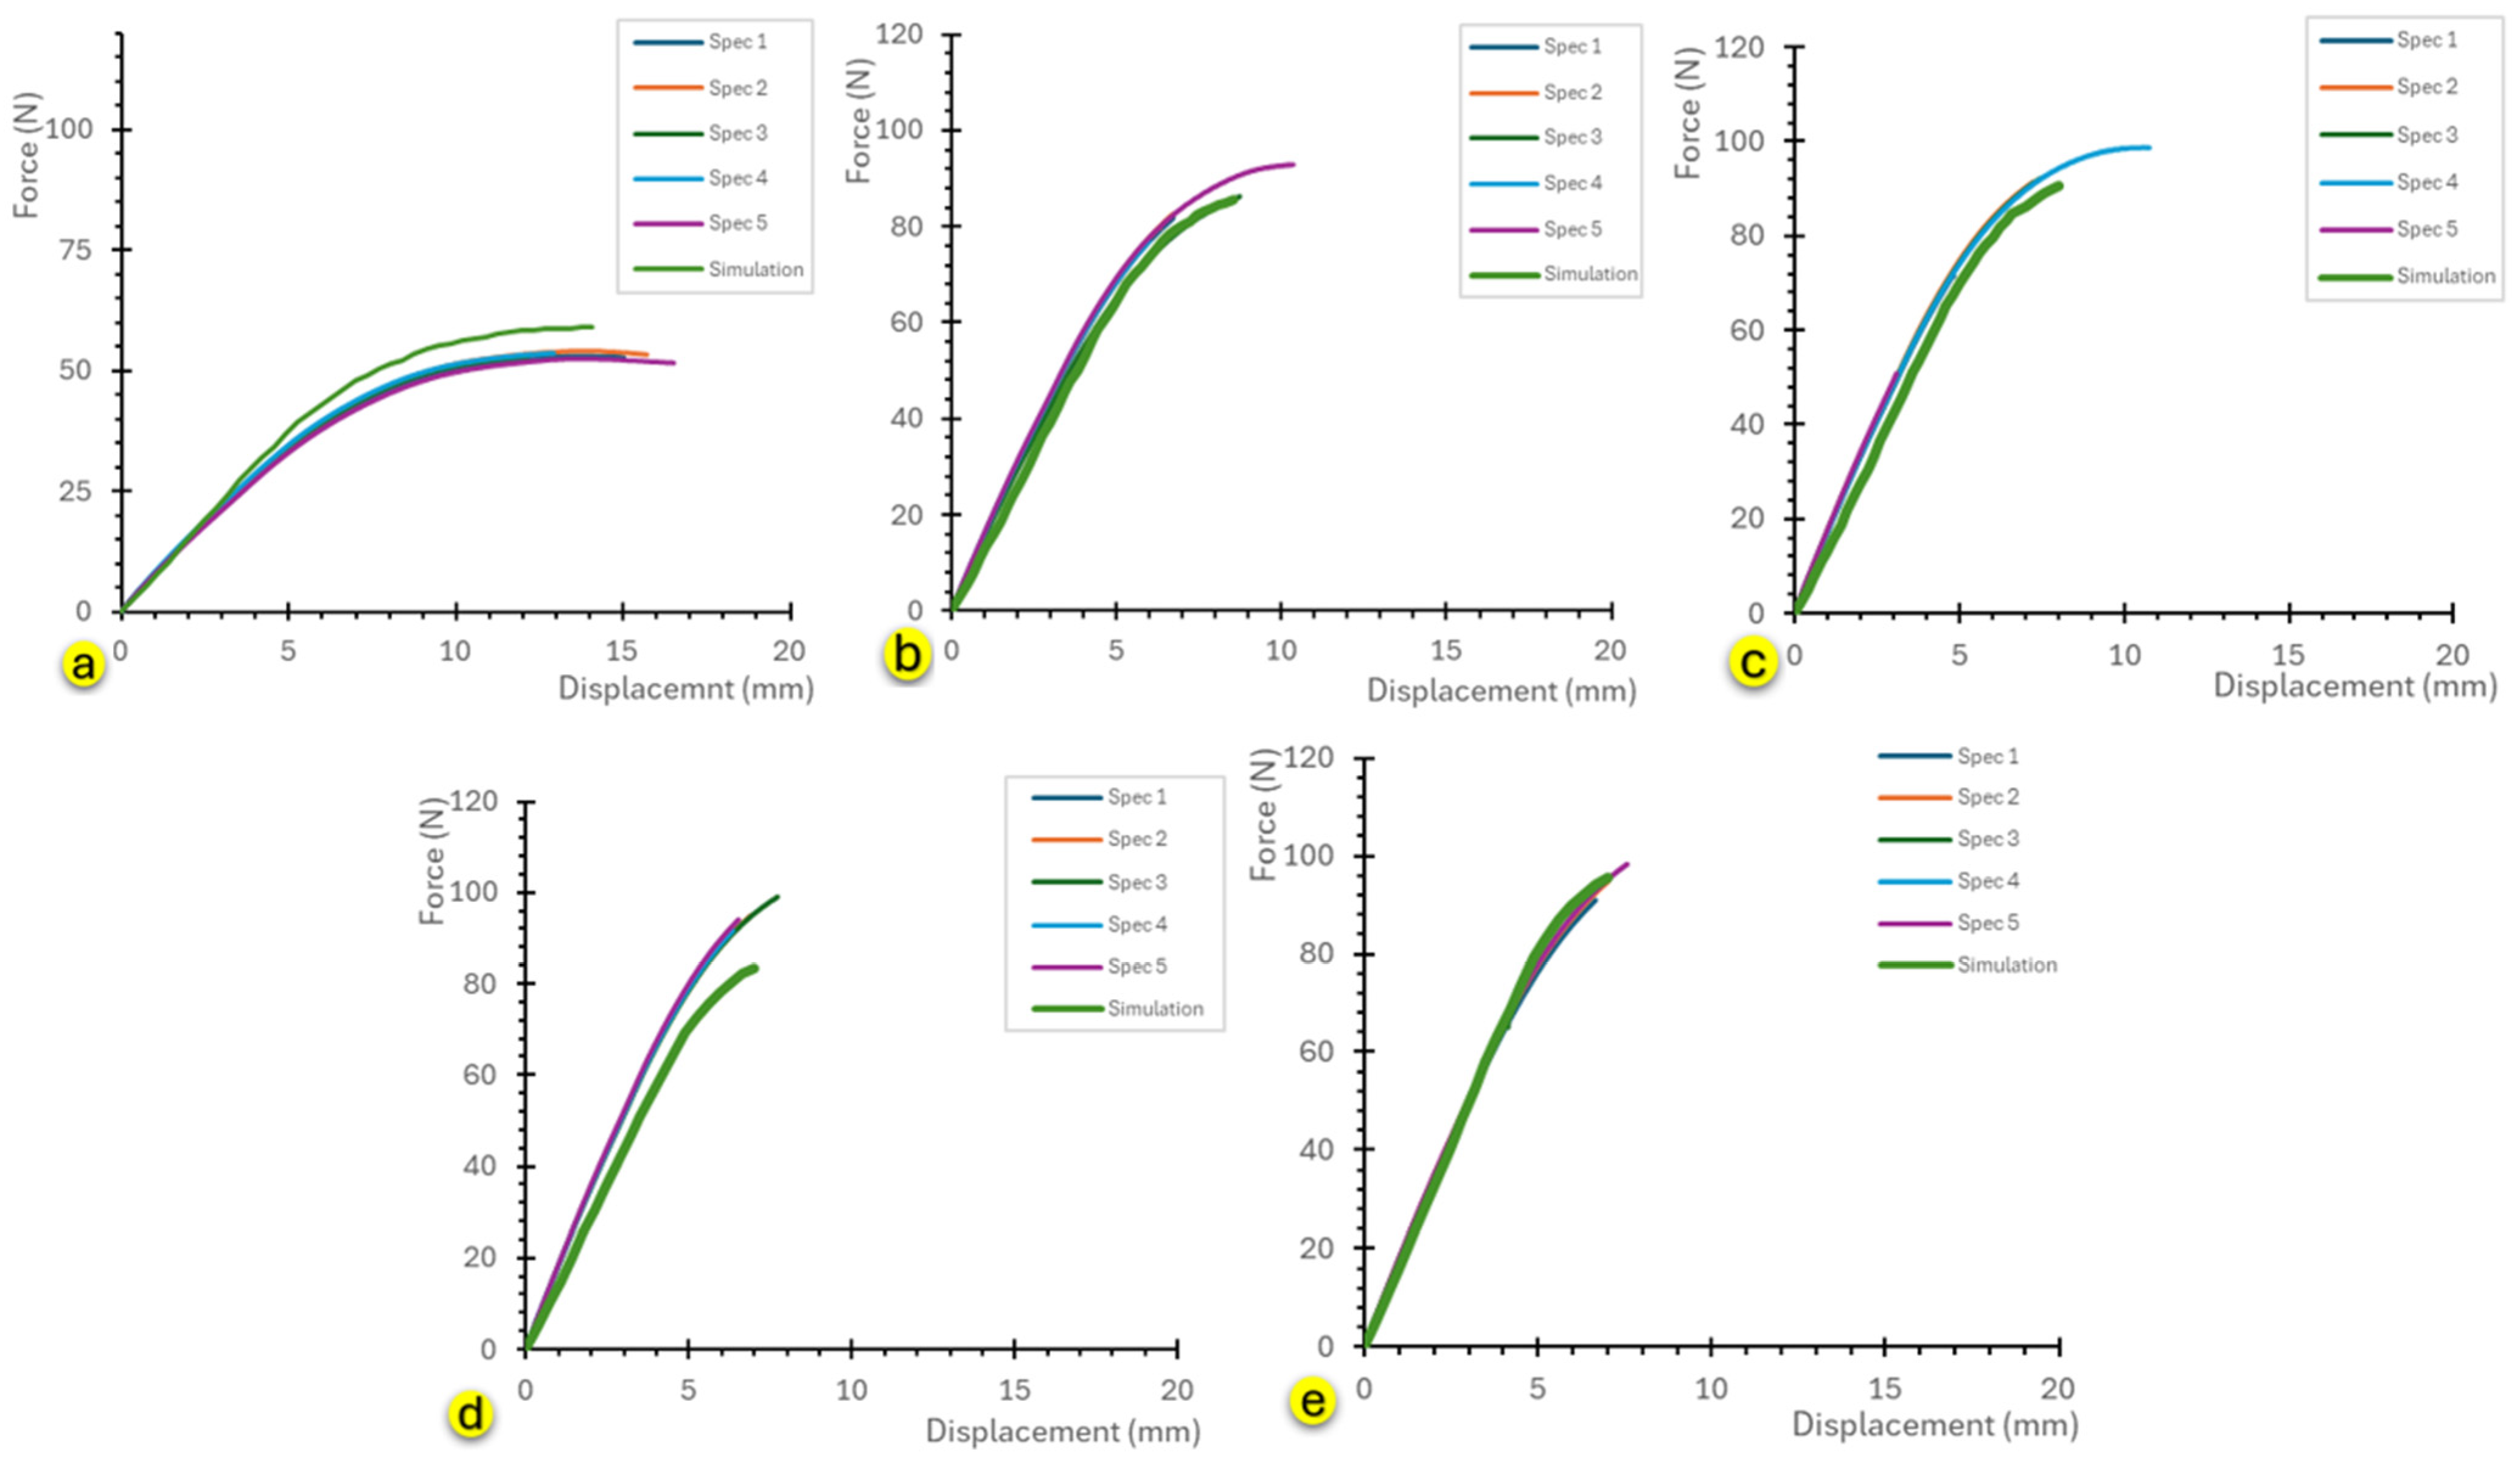
The following Figure 27a–e present the force vs. punch displacement curves from the bending tests, along with simulation results, for Flat [XY] orientation. Similarly, Figure 28a–e and Figure 29a–e present results for the On-edge [XZ] and Vertical [Z] orientations, respectively. As observed, the simulated curves exhibit behavior similar to the experimental curves. The largest deviations occurred at intermediate curing times, likely due to variations in the resin batches, as discussed earlier regarding the Vertical [Z] orientation tensile results. As with the tensile tests, the slope of the curves increases with longer post-curing times. The best agreement between experimental and simulated results was observed in the Flat [XY] orientation model.
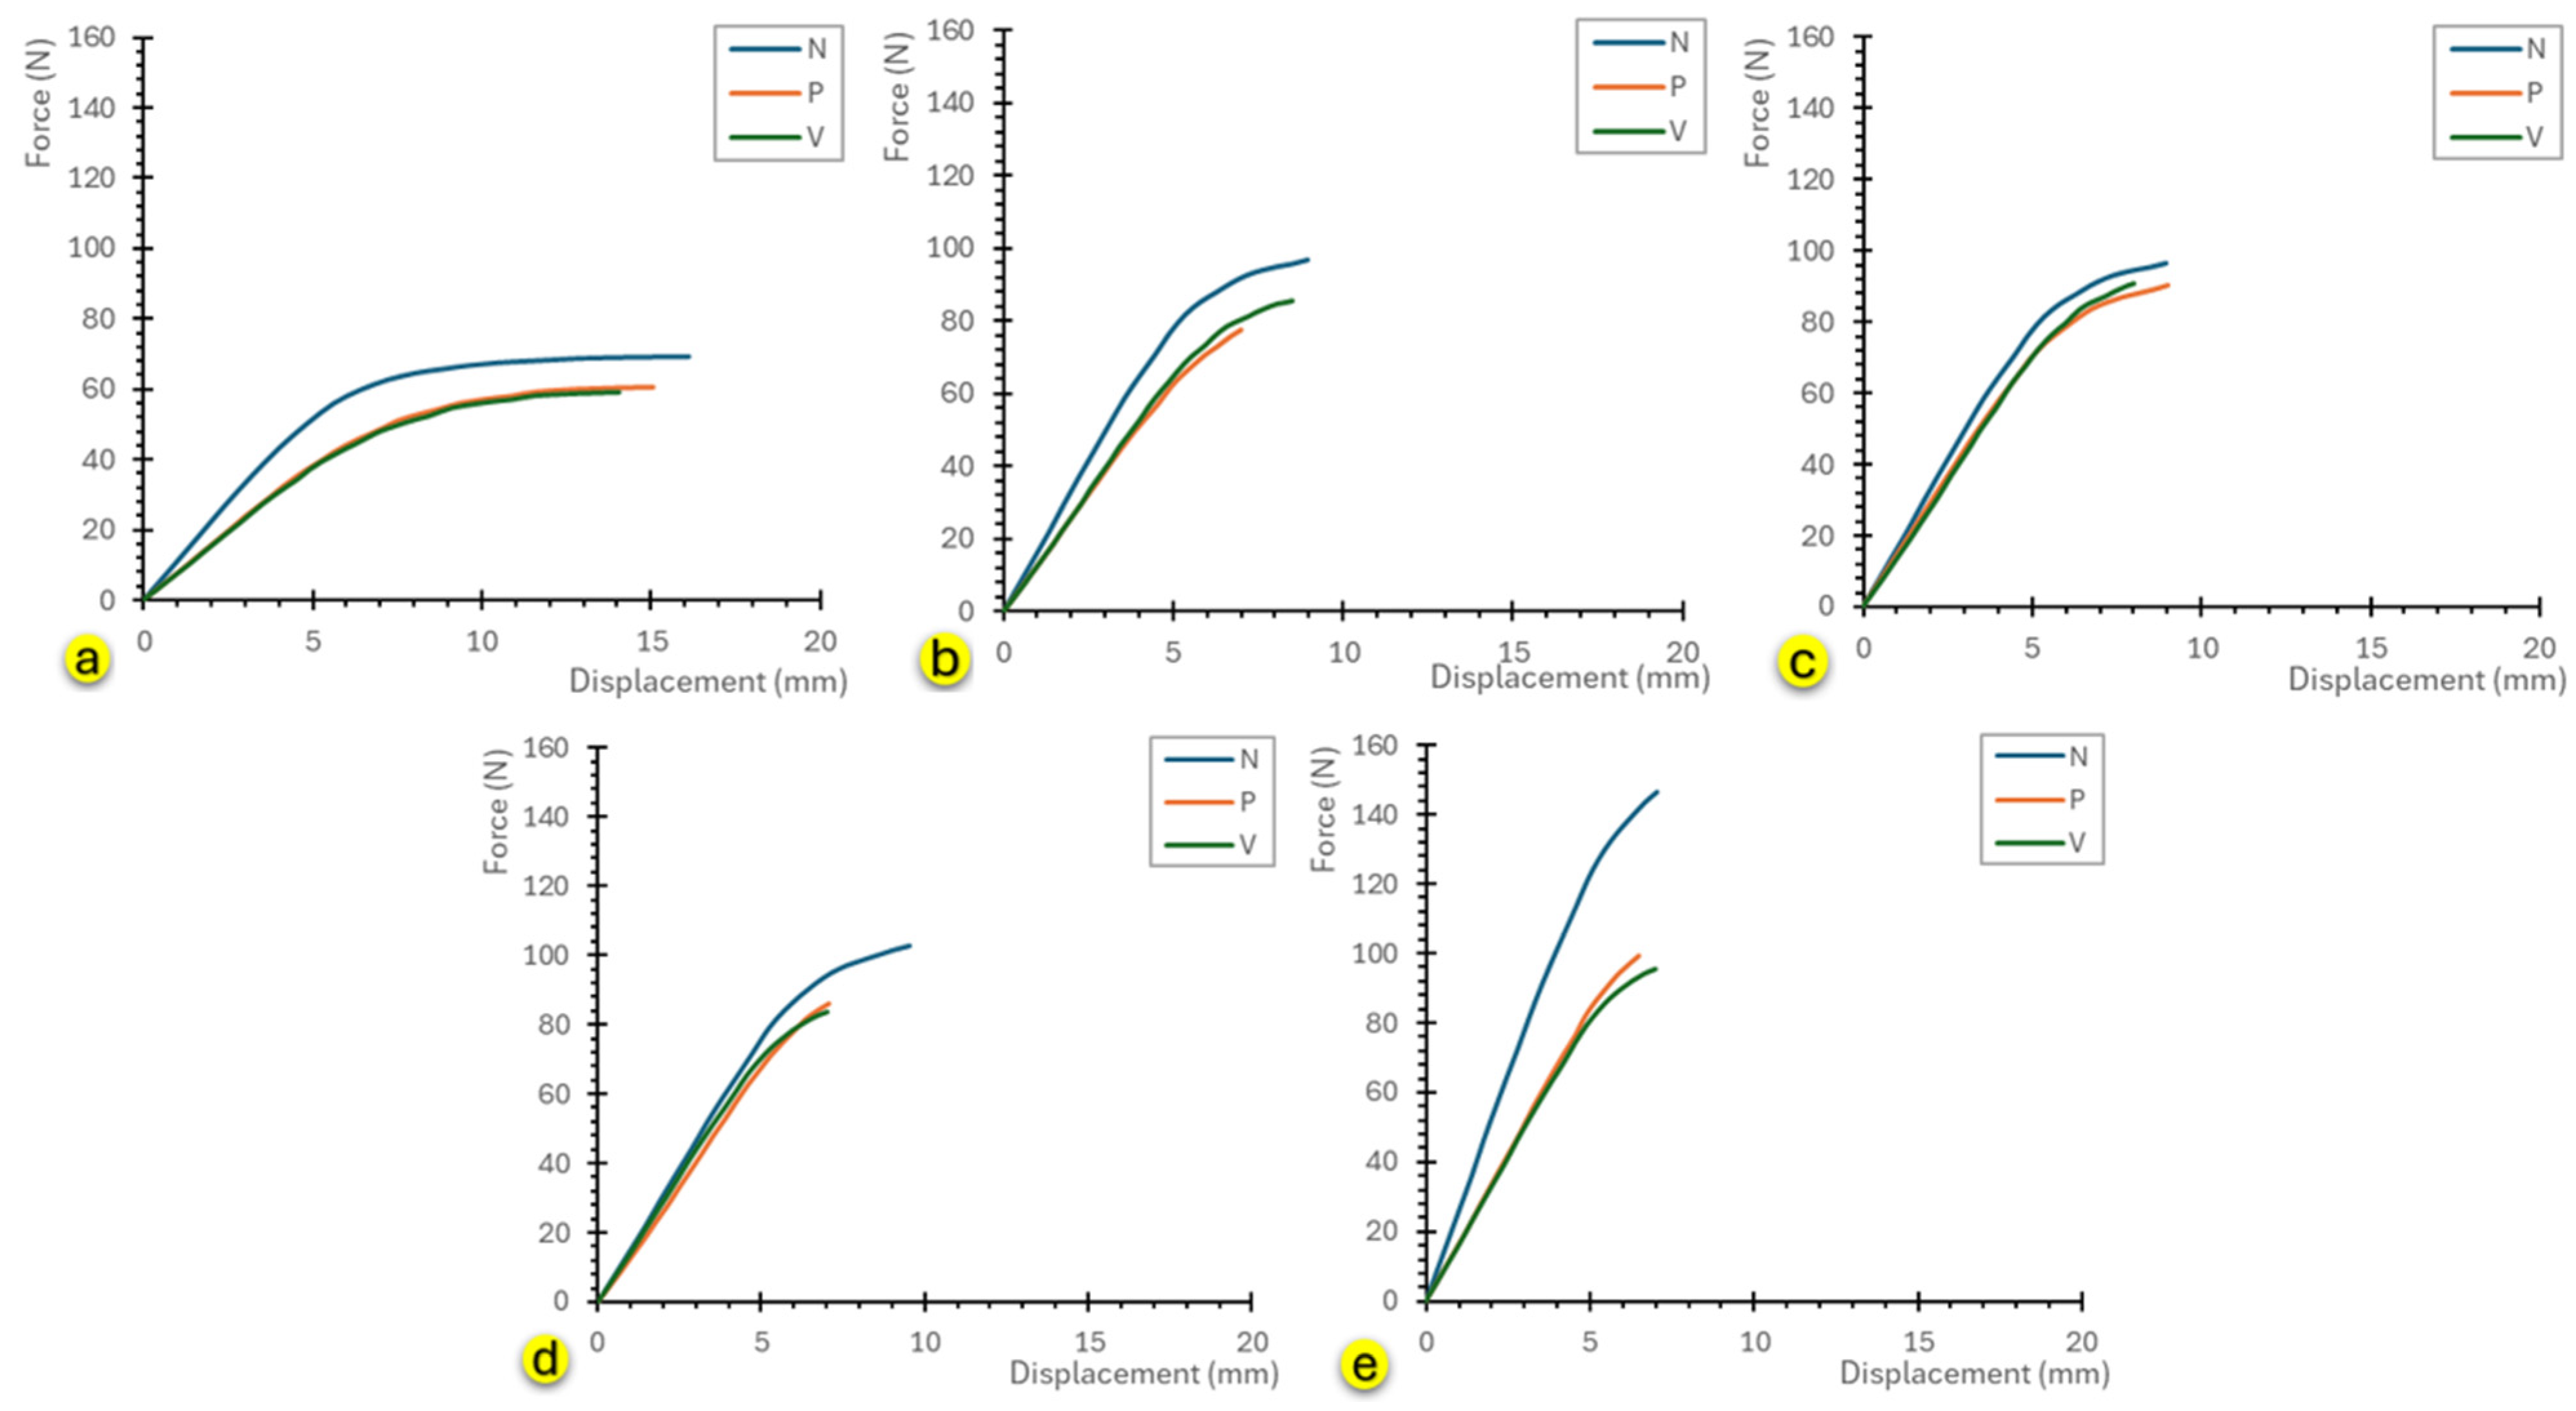
Figure 30a–e show the bending curves in the Flat [XY], On-edge [XZ], and Vertical [Z] orientations for the times of 0, 5, 10, 30, and 60 min, respectively. It is observed that the Flat [XY] condition showed the highest strengths, while the On-edge [XZ] and Vertical [Z] conditions showed similar results.
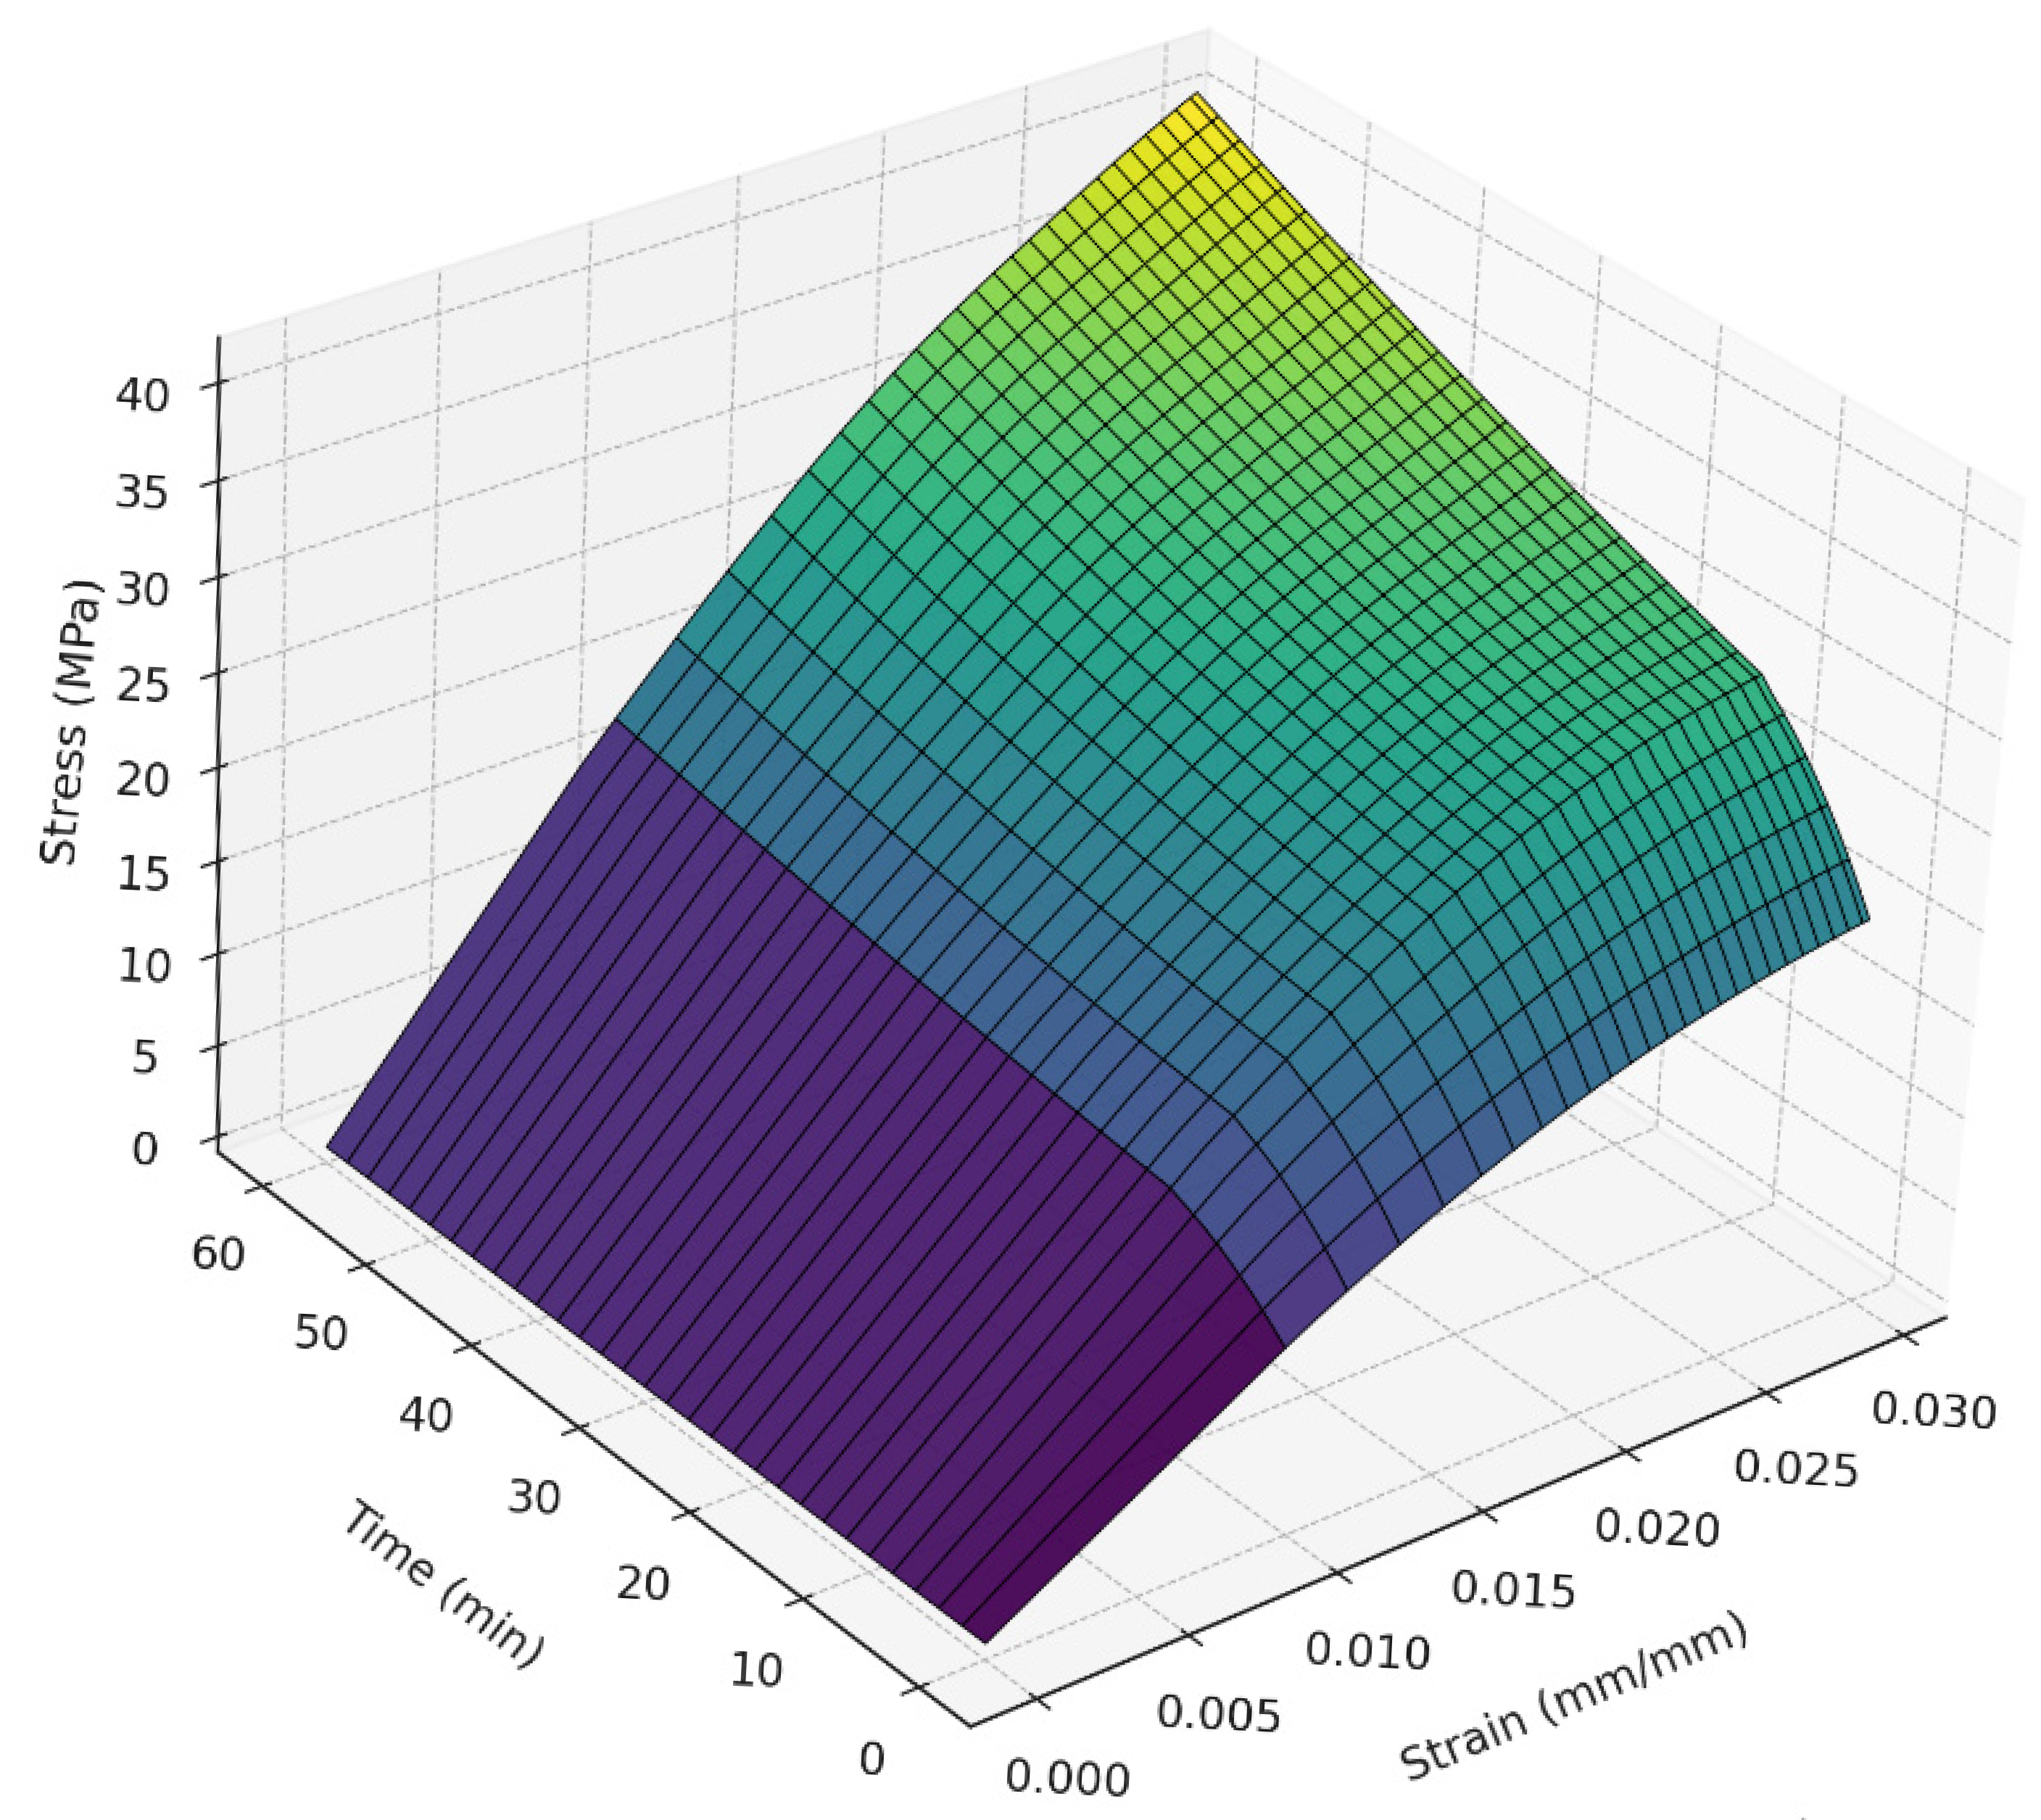
In order to obtain a general equation that correlates stress versus strain as a function of post-curing time, a quadratic interpolation was performed between the reference values, that is, for all times for the Flat [XY] position. The interpolation was performed in parts, starting at time zero minutes going up to 9 min in the first part, and starting at 10 min going up to 60 min for the second part, it was performed in this way to be able to adequately represent both the times closest to 0 min and the highest times, close to 60 min so that the error was as little as possible. With this, a general curve was obtained that makes it possible to predict what the mechanical behavior will be, as a function of tension versus deformation for any post-curing time for the resin under study, ranging from 0 to 60 min. For the Vertical [Z] condition, a curve was not created due to the high proximity between the values of 10 and 30 min, which ends up making the analysis unfeasible. The general equation is expressed by Equation (2), in which the terms a0, a1 and a2 vary depending on the strain and have two groups of distinct values in the intervals of 0 to 9 min and 10 to 60 min. The spreadsheet with the values of the coefficients is available in Appendix B. Figure 31 shows the surface generated using Equation (3) and the coefficients in Appendix B.
y x , t = a 0 + a 1 t + a 2 t 2

4. Conclusions

The increase in Young’s modulus from 964.5 (0 min) to 1,892.4 MPa (60 min) for the Flat [XY] orientation represents a 96% increase, demonstrating the importance of post-curing time. This behavior is attributed to the increased degree of conversion and the formation of additional crosslinks in the polymer network.
In tensile tests, the Flat [XY] orientation exhibited superior mechanical properties than the Vertical [Z] orientation due to the lesser influence of the interlayer interfaces in the loading direction. The approximately 20% difference between the two orientations indicates that the specimens exhibited behavior close to orthotropic material. In bending tests, the Flat [XY] orientation again exhibited superior mechanical properties, with similar results for the On-edge [XZ] and Vertical [Z] orientations.
The proposed numerical simulation models adequately represented the experiments performed, as shown in the comparative graphs between the results (Figure 23a–e,Figure 24a–e,Figure 27a–e and Figure 29a–e).
The methodology used to correlate the mechanical behavior of resin specimens with post-curing time is highly versatile, as it allows for adjustment of the post-curing time based on the desired mechanical properties. It also allows these values to be used to develop a numerical simulation model of components (within the range of 0 to 60 min). This same methodology can be applied to different types of resins and can also be extended to predict the mechanical behavior of blended resins. A specific analysis of the influence of curing and post-curing time on dimensional and geometric variation could be carried out in the future. Another topic to be addressed in future work is the influence of printing direction on fracture energy in parts printed using mSLA devices.

Author Contributions

Conceptualization, F.d.A.S.; data curation, F.d.A.S.; formal analysis V.A.R.d.O., A.d.R.d.F.N. and E.S.G.; investigation, G.C.R.d.O., T.S.R.d.S. and C.A.A.S.; methodology, G.C.R.d.O. and A.d.R.d.F.N.; project administration, E.S.G.; supervision, E.S.G.; validation, G.C.R.d.O.; writing—original draft, C.C.P. and L.F.B.M.; writing—review and editing, M.S.M. All authors have read and agreed to the published version of the manuscript.

Funding

This study was financed in part by the Coordenação de Aperfeiçoamento de Pessoal de Nível Superior-Brasil (CAPES)-Finance Code 001.

Institutional Review Board Statement

Not applicable.

Informed Consent Statement

Not applicable.

Data Availability Statement

The original contributions presented in this study are included in this article. Further inquiries can be directed to the corresponding authors.

Acknowledgments

UNESP—Universidade Estadual Paulista, Coordenação de Aperfeiçoamento de Pessoal de Nível Superior-Brasil (CAPES)—and Universidad Tecnológica del Perú (UTP).

Conflicts of Interest

The authors declare no conflicts of interest.

Appendix A

% 2 percent of the curve = (delta L)/L * 0.02 = (3.10/118)*0.02 = 0.0005
% variables x and y are vector already loaded in MATLAB
% x: displacement in mm
% y: force in N
% Sample data
area = 44; % Cross-sectional area in mm²
initial_length = 118; % Initial length in mm
% Stress and strain calculation
stress = y ./ area; % Stress in MPa (N/mm²)
strain = x ./ initial_length; % Dimensionless strain
% Check if stress and strain have valid values
if isempty(stress) || isempty(strain) || length(stress) ~= length(strain)
       error(’Data error: stress and strain must be non-empty vectors of the same size.’);
end
% Ask user for initial and final index
start_index = input(sprintf(’Enter the initial index of the linear region (1 to %d): ’, length(strain)));
end_index = input(sprintf(’Enter the final index of the linear region (%d to %d): ’, start_index + 1, length(strain)));
% Ensure indices are within valid range
if start_index < 1 || end_index > length(strain) || start_index >= end_index
       error(’Invalid indices. Make sure that 1 <= start index < end index <= %d.’, length(strain));
end
% Linear fit in the identified region
p = polyfit(strain(start_index:end_index), stress(start_index:end_index), 1);
% The slope is the modulus of elasticity
elastic_modulus = p(1);
% Display results
fprintf(’Linear region defined by user: Index %d to %d\n’, start_index, end_index);
fprintf(’The modulus of elasticity is: %.2f MPa\n’, elastic_modulus);
% Ensure a new figure is created
figure;
% Plot full graph
plot(strain, stress, ’.-’, ’LineWidth’, 1.5); % Experimental data
hold on;
% Fitted data for linear fit plot
strain_fit = strain(start_index:end_index);
stress_fit = polyval(p, strain_fit);
% Plot linear fit line
plot(strain_fit, stress_fit, ’--’, ’LineWidth’, 1.5); % Linear fit line
% ----------- Line parallel to 2% strain (offset) ------------
strain_offset = linspace(0.0005, max(strain), 100); % strains starting at 2%
stress_offset = elastic_modulus * (strain_offset - 0.0005); % same slope, shifted
% Plot the new offset line
plot(strain_offset, stress_offset, ’-.’, ’LineWidth’, 1.5, ’Color’, [0.85 0.33 0.1]); % orange color
% ----------- Calculation of the secant modulus point (intersection) ----------
% Interpolate experimental data with interp1
strain_interp = linspace(min(strain), max(strain), 1000);
stress_interp = interp1(strain, stress, strain_interp, ’linear’);
% Calculate the interpolated offset line
stress_offset_interp = elastic_modulus * (strain_interp - 0.0005);
% Difference between the curves
difference = abs(stress_interp - stress_offset_interp);
% Index of minimum difference (closest intersection point)
[~, idx_intersec] = min(difference);
strain_secant = strain_interp(idx_intersec);
stress_secant = stress_interp(idx_intersec);
% Plot secant modulus point
plot(strain_secant, stress_secant, ’rp’, ’MarkerSize’, 10, ’MarkerFaceColor’, ’r’);
text(strain_secant, stress_secant, sprintf(’ Secant modulus point\n (%.4f, %.2f MPa)’, strain_secant, stress_secant), ...

       ’VerticalAlignment’, ’bottom’, ’FontSize’, 9);
% Final plot adjustments
xlabel(’Strain (dimensionless)’);
ylabel(’Stress (MPa)’);
title(’Stress vs. Strain Curve’);
legend(’Experimental data’, ’Linear fit’, ’Line parallel to 2%’, ’Secant modulus point’, ’Location’, ’best’);
grid on;
hold off;

Appendix B

Equation:IF($H$1<=9;B2+C2*$H$1+D2*$H$1^2;E2+F2*$H$1+G2*$H$1^2)
xa0_0_9a1_0_9a2_0_9a0_10_60a1_10_60a2_10_60TimeStress (y)
0000000600
0.0084558.2257610.524709−0.0175511.271450.0443620.000574 16
0.0096089.3478930.595396−0.0198312.751660.057980.000463 17.89791
0.01066610.285290.672677−0.0228214.261180.049090.000669 19.61621
0.01163711.099820.723295−0.0246515.411680.0472060.000813 21.17085
0.0125311.823210.768032−0.0262216.423710.0471940.000923 22.57672
0.01335212.46630.807783−0.0275717.316650.0485570.001005 23.84773
0.01410913.039590.843229−0.0287418.107790.0508030.001067 24.99682
0.01480813.550570.875133−0.0297818.812370.0535320.001114 26.03602
0.01545514.008170.903953−0.030719.443480.0564440.001152 26.97648
0.01605514.41910.93012−0.0315220.011420.0593730.001182 27.82854
0.01661414.789460.953997−0.0322720.525160.0622010.001207 28.60173
0.01713615.124830.975893−0.0329620.992510.0648550.001228 29.30481
0.01762415.429250.996113−0.0335921.419650.0673160.001246 29.94585
0.01808415.707361.014832−0.0341721.812130.0695720.001263 30.53221
0.01851915.962621.032245−0.0347122.17450.0716350.001277 31.07063
0.01893116.198261.048506−0.0352222.510830.0735110.00129 31.5672
0.01932416.41621.063814−0.035722.82440.0752230.001303 32.02746
0.01970116.619631.078202−0.0361623.118090.0767860.001314 32.4564
0.02006316.810321.09181−0.0365923.394670.07820.001325 32.85848
0.02041416.989631.104748−0.03723.656250.079480.001337 33.23769
0.02075417.158811.117091−0.0373923.90430.0806530.001348 33.59756
0.02108617.319451.128892−0.0377724.140890.0816940.001361 33.94121
0.0214117.472551.1402−0.0381324.367160.0826220.001374 34.27134
0.02172917.618941.151051−0.0384824.5840.0834590.001389 34.5903
0.02204217.759311.161472−0.0388124.792160.0842220.001404 34.90011
0.02235217.894261.17148−0.0391424.992130.0849330.001421 35.20244
0.02265918.024261.181081−0.0394425.184210.085620.001438 35.49871
0.02296318.149691.190287−0.0397325.368670.0863060.001456 35.79005
0.02326418.270861.199094−0.0400125.545540.0870240.001475 36.07735
0.02356418.388021.207489−0.0402725.714660.0878130.001494 36.3613
0.02386318.501381.215456−0.0405125.875780.0887180.001512 36.64238
0.0241618.611081.222972−0.0407426.02850.0897880.001529 36.92088
0.02445618.717241.230013−0.0409326.172360.0910790.001544 37.19696
0.02475118.819971.236547−0.0411126.306780.0926490.001557 37.47063
0.02504418.919341.242537−0.0412626.431160.0945530.001566 37.74179
0.02533619.015421.247948−0.0413726.544680.096880.00157 38.01021
0.02562619.108261.252747−0.0414626.646610.0997040.001569 38.27562
0.02591419.197911.256898−0.041526.736210.1030990.00156 38.53766
0.02620119.284421.260365−0.0415126.812760.1071390.001543 38.7959
0.02648519.367851.263117−0.0414826.875540.1118980.001517 39.04991
0.02676719.448261.265123−0.041426.92390.1174460.00148 39.29919
0.02704619.52571.266358−0.0412826.957260.1238490.001432 39.54326
0.02732219.600211.266877−0.0411226.977650.130870.001375 39.78162
0.02759419.671791.266677−0.0409226.985160.1384960.001311 40.01379
0.02786419.739481.26652−0.0407226.988770.1462740.001243 40.23931
0.02812919.803391.266622−0.0405326.991540.154050.001173 40.45773
0.02839119.863651.266966−0.0403426.993420.1618230.001102 40.66865
0.02864819.920381.267532−0.0401626.994380.1695920.001028 40.87171
0.02890119.973731.268301−0.0399926.994360.1773580.000953 41.06661
0.02914920.023851.269254−0.0398326.993340.1851210.000876 41.25308
0.02939320.070841.27038−0.0396826.99130.192880.000796 41.43094

References

  1. Da Silva, T.M.; Immich, F.; De Araujo, T.S.; Lund, R.G.; Da Silva, A.F.; Piva, E.; Da Rosa, W.L.D.O. Photosensitive resins used in additive manufacturing for oral application in dentistry: A scoping review from lab to clinic. J. Mech. Behav. Biomed. Mater. 2023, 141, 105732. [Google Scholar] [CrossRef] [PubMed]
  2. Zhou, L.; Miller, J.; Vezza, J.; Mayster, M.; Raffay, M.; Justice, Q.; Al Tamimi, Z.; Hansotte, G.; Sunkara, L.D.; Bernat, J. Additive Manufacturing: A Comprehensive Review. Sensors 2024, 24, 2668. [Google Scholar] [CrossRef] [PubMed]
  3. Roes, F.; Boyer, R.; Dutta, B. 1—Introduction to aerospace materials requirements and the role of additive manufacturing. In Additive Manufacturing for the Aerospace Industry; Froes, F., Boyer, R., Eds.; Elsevier: Amsterdam, The Netherlands, 2019; pp. 1–6. [Google Scholar]
  4. Alami, A.H.; Ghani Olabi, A.; Alashkar, A.; Alasad, S.; Aljaghoub, H.; Rezk, H.; Abdelkareem, M.A. Additive manufacturing in the aerospace and automotive industries: Recent trends and role in achieving sustainable development goals. Ain Shams Eng. J. 2023, 14, 102516. [Google Scholar] [CrossRef]
  5. Turkcan, H.; Imamoglu, S.Z.; Ince, H. To be more innovative and more competitive in dynamic environments: The role of additive manufacturing. Int. J. Prod. Econ. 2022, 246, 108418. [Google Scholar] [CrossRef]
  6. Quan, H.; Zhang, T.; Xu, H.; Luo, S.; Nie, J.; Zhu, X. Photo-curing 3D printing technique and its challenges. Bioact. Mater. 2020, 5, 110–115. [Google Scholar] [CrossRef]
  7. Pinto, C.C.; Silva, F.D.; Guidi, E.S. Analytical, Experimental, and Finite Element Study of Stress Concentration for Samples Printed on Masked Stereolithography Devices. Appl. Mechan. 2025, 6, 21. [Google Scholar] [CrossRef]
  8. Kumar, S.; Bhushan, P.; Pandey, M.; Bhattacharya, S. Additive manufacturing as an emerging technology for fabrication of microelectromechanical systems (MEMS). J. Micromanufacturing 2019, 2, 175–197. [Google Scholar] [CrossRef]
  9. Minin, A.; Blatov, I.; Rodionov, S.; Zubarev, I. Development of a cell co-cultivation system based on protein magnetic membranes, using a mSLA 3D printer. Bioprinting 2021, 23, e00150. [Google Scholar] [CrossRef]
  10. Taormina, G.; Sciancalepore, C.; Messori, M.; Bondioli, F. 3D printing processes for photocurable polymeric materials: Technologies, materials, and future trends. J. Appl. Biomater. Funct. Mater. 2018, 16, 151–160. [Google Scholar] [CrossRef]
  11. Zhang, J.; Xiao, P. 3D printing of photopolymers. Polym. Chem. 2018, 9, 1530–1540. [Google Scholar] [CrossRef]
  12. Wu, J.; Zhao, Z.; Hamel, C.M.; Mu, X.; Kuang, X.; Guo, Z.; Qi, H.J. Evolution of material properties during free radical photopolymerization. J. Mech. Phys. Solids 2018, 112, 25–49. [Google Scholar] [CrossRef]
  13. Brighenti, R.; Cosma, M.P. Mechanical behavior of photopolymerized materials. J. Mech. Phys. Solids 2021, 153, 104456. [Google Scholar] [CrossRef]
  14. Štaffová, M.; Ondreáš, F.; Svatík, J.; Zbončák, M.; Jančář, J.; Lepcio, P. 3D printing and post-curing optimization of photopolymerized structures: Basic concepts and effective tools for improved thermomechanical properties. Polym. Test. 2022, 108, 107499. [Google Scholar] [CrossRef]
  15. Nowacki, B.; Kowol, P.; Kozioł, M.; Olesik, P.; Wieczorek, J.; Wacławiak, K. Effect of Post-Process Curing and Washing Time on Mechanical Properties of mSLA Printouts. Materials 2021, 14, 4856. [Google Scholar] [CrossRef] [PubMed]
  16. Salmoria, G.V.; Ahrens, C.H.; Beal, V.E.; Pires, A.T.N.; Soldi, V. Evaluation of post-curing and laser manufacturing parameters on the properties of SOMOS 7110 photosensitive resin used in stereolithography. Mater. Des. 2009, 30, 758–763. [Google Scholar] [CrossRef]
  17. Uzcategui, A.C.; Muralidharan, A.; Ferguson, V.L.; Bryant, S.J.; McLeod, R.R. Understanding and Improving Mechanical Properties in 3D printed Parts Using a Dual-Cure Acrylate-Based Resin for Stereolithography. Adv. Eng. Mater. 2018, 20, 1800876. [Google Scholar] [CrossRef]
  18. Diniță, A.; Neacșa, A.; Portoacă, A.I.; Tănase, M.; Ilinca, C.N.; Ramadan, I.N. Additive Manufacturing Post-Processing Treatments, a Review with Emphasis on Mechanical Characteristics. Materials 2023, 16, 4610. [Google Scholar] [CrossRef]
  19. Bednarczyk, P.; Walkowiak, K.; Irska, I. Epoxy (Meth)acrylate-Based Thermally and UV Initiated Curable Coating Systems. Polymers 2023, 15, 4664. [Google Scholar] [CrossRef]
  20. ISO 527-2; Plastics—Determination of Tensile Properties—Part 2: Test Conditions for Moulding and Extrusion Plastics. ISO: Geneva, Switzerland, 2012.
  21. ISO 178; Plastics—Determination of Flexural Properties. ISO: Geneva, Switzerland, 2019.
  22. Chatani, S.; Kloxin, C.J.; Bowman, C.N. The Power of Light in Polymer Science: Photochemical Processes to Manipulate Polymer Formation, Structure, and Properties. Polym. Chem. 2014, 5, 2187–2201. [Google Scholar] [CrossRef]
  23. Rabek, J.F. Polymer Photodegradation: Mechanisms and Experimental Methods; Chapman & Hall: London, UK, 1995. [Google Scholar] [CrossRef]
  24. Andrady, A.L.; Hamid, S.H.; Hu, X.; Torikai, A. Effects of Increased Solar Ultraviolet Radiation on Materials. J. Photochem. Photobiol. B Biol. 1998, 46, 96–103. [Google Scholar] [CrossRef]
  25. Dietliker, K. A Compilation of Photoinitiators Commercially Available for UV Today; SITA Technology Ltd.: London, UK, 2002. [Google Scholar]
  26. Jakubiak, J.; Allonas, X.; Fouassier, J.P.; Sionkowska, A.; Andrzejewska, E.; Linden, L. Camphorquinone–Amines Photoinitiating Systems for the Initiation of Free Radical Polymerization. Polymer 2003, 44, 5219–5226. [Google Scholar] [CrossRef]
  27. Stansbury, J.W.; Idacavage, M.J. 3D Printing with Polymers: Challenges among Expanding Options and Opportunities. Dent. Mater. 2016, 32, 54–64. [Google Scholar] [CrossRef] [PubMed]
  28. Decker, C.; Jenkins, A.D. Kinetic Approach of Oxygen Inhibition in Ultraviolet- and Electron Beam-Induced Polymerizations. Macromolecules. 1985, 18, 1241–1244. [Google Scholar] [CrossRef]
  29. O’Brien, A.K.; Bowman, C.N. Impact of Oxygen on Photopolymerization Kinetics and Polymer Structure. Macromolecules 2006, 39, 2501–2506. [Google Scholar] [CrossRef]
  30. Pospíšil, J. Mechanistic Action of Phenolic Antioxidants in Polymers—A Review. Polym. Degrad. Stab. 1988, 20, 181–202. [Google Scholar] [CrossRef]
  31. Scott, G. Atmospheric Oxidation and Antioxidants; Elsevier: Amsterdam, The Netherlands, 1993. [Google Scholar]
  32. Dietliker, K. Photoinitiators for Free Radical and Cationic Polymerisation; SITA Technology Ltd.: London, UK, 1991. [Google Scholar]
  33. Gruber, H.F. Photoinitiators for Free Radical Polymerization. Prog. Polym. Sci. 1992, 17, 953–1044. [Google Scholar] [CrossRef]
  34. Singh, V. Literature Survey of Strain Rate Effects on Composites; TR18-001 (open), Swerea (now RISE) SICOMP: Mölndal, Sweden, 2018. [Google Scholar]
  35. Korolev, A.; Zadorin, A.; Mishnev, M. The Finite Element Method in Thermosetting Polymers’ and FRPs’ Supramolecular Structure and Thermomechanical Properties’ Modeling. Polymers 2024, 16, 3443. [Google Scholar] [CrossRef]
  36. Meißner, R.H.; Konrad, J.; Boll, B.; Fiedler, B.; Zahn, D. Molecular Simulation of Thermosetting Polymer Hardening: Reactive Events Enabled by Controlled Topology Transfer. Macromolecules 2020, 53, 9698–9705. [Google Scholar] [CrossRef]
  37. Gaikwad, P.S.; Krieg, A.S.; Deshpande, P.P.; Patil, S.U.; King, J.A.; Maiaru, M.; Odegard, G.M. Understanding the Origin of the Low Cure Shrinkage of Polybenzoxazine Resin by Computational Simulation. ACS Appl. Polym. Mater. 2021, 3, 6407–6415. [Google Scholar] [CrossRef]
  38. Zhang, J.-T.; Shang, Y.-D.; Zhang, M.; Liu, L.-S.; Zhai, P.-C.; Li, S.-X. Cure-Dependent Viscoelastic Analysis on the Residual Stresses and Distortion Created in Composite Corner during Curing. In Proceedings of the 2nd Annual International Conference on Advanced Material Engineering (AME 2016), Guangzhou, China, 24–25 July 2016; Atlantis Press: Paris, France, 2016; pp. 20–27. [Google Scholar] [CrossRef]
  39. Bonhin, E.; David Müzel, S.; Cesar, G.; Oliveira, R.; Luiz, W.; Tupinambá, M.; Guidi, E.; Alexis, C.; Alvarado Silva, C.; De, F.; et al. Evaluation and Feasibility of Different Models and Methods for Composite Simulation Using Ansys. IAENG Int. J. Comput. Sci. 2024, 51, 918–924. [Google Scholar]
  40. Oliveira, G.C.R.d.; Rosario de Oliveira, V.A.; Alvarado Silva, C.A.; Guidi, E.S.; Silva, F.d.A. Modeling the Stress Field in MSLA-Fabricated Photosensitive Resin Components: A Combined Experimental and Numerical Approach. Modelling 2025, 6, 3. [Google Scholar] [CrossRef]
Figure 1. FTIR analysis for samples post-cured at 5, 10, 30, and 60 min.
Applmech 06 00071 g001
Figure 2. X-ray diffraction (XRD) analysis for samples post-cured at 5, 10, 30, and 60 min.
Applmech 06 00071 g002
Figure 3. Positioning of the specimens on the print bed: Flat [XY] (a) and Vertical [Z] (b).
Applmech 06 00071 g003
Figure 4. Specimen orientation: (a) Vertical [Z] and (b) Flat [XY].
Applmech 06 00071 g004
Figure 5. Specimen orientation: (a) Vertical [Z], (b) On-edge [XZ], and (c) Flat [XY].
Applmech 06 00071 g005
Figure 6. Equipment: (a) washing chamber for printed parts and (b) UV curing chamber.
Applmech 06 00071 g006
Figure 7. Color changes in the specimens due to curing time, from left to right with increasing curing time and amber color.
Applmech 06 00071 g007
Figure 8. Universal testing machine setup for: (a) tensile and (b) bending tests.
Applmech 06 00071 g008
Figure 9. Extensometer mounted on tensile a.
Applmech 06 00071 g009
Figure 10. Determination of the secant modulus point.
Applmech 06 00071 g010
Figure 11. New material added to the software library.
Applmech 06 00071 g011
Figure 12. MISO curves for each post-curing time in the Flat [XY] orientation.
Applmech 06 00071 g012
Figure 13. MISO curves for each post-curing time in the Vertical [Z] orientation.
Applmech 06 00071 g013
Figure 14. Constraints applied to the tensile test specimen model.
Applmech 06 00071 g014
Figure 15. Constraints applied to the bending test specimen model.
Applmech 06 00071 g015
Figure 16. Finite element mesh for the tensile model.
Applmech 06 00071 g016
Figure 17. Finite element mesh for the bending model.
Applmech 06 00071 g017
Figure 18. Normal stress of the tensile test specimen model.
Applmech 06 00071 g018
Figure 19. Elastic strain of the tensile test specimen model.
Applmech 06 00071 g019
Figure 20. Plastic strain of the tensile test specimen model.
Applmech 06 00071 g020
Figure 21. Displacement for the model with 60 min post-curing time and Flat [XY] orientation of the bending test specimen model.
Applmech 06 00071 g021
Figure 22. Punch force in the model with 60 min post-curing time and Flat [XY] orientation of the bending test specimen model.
Applmech 06 00071 g022
Figure 23. Tensile test results in the Flat [XY] direction with curves from numerical simulation using Ansys: (a) 0 min, (b) 5 min, (c) 10 min, (d) 30 min, and (e) 60 min.
Applmech 06 00071 g023
Figure 24. Tensile test results in the Vertical [Z] direction with curves from numerical simulation using Ansys: (a) 0 min, (b) 5 min, (c) 10 min, (d) 30 min, and (e) 60 min.
Applmech 06 00071 g024
Figure 25. Average simulated curves for all curing times in the Flat [XY] direction.
Applmech 06 00071 g025
Figure 26. Average simulated curves for all curing times in the Vertical [Z] direction.
Applmech 06 00071 g026
Figure 27. Force versus displacement of the punch obtained in bending tests together with the curve obtained in simulations Flat [XY] orientation of the specimen (a) 0 min, (b) 5 min, (c) 10 min, (d) 30 min, and (e) 60 min.
Applmech 06 00071 g027
Figure 28. Force versus displacement of the punch obtained in bending tests together with the curve obtained in simulations On-edge [XZ] orientation of the specimen (a) 0 min, (b) 5 min, (c) 10 min, (d) 30 min, and (e) 60 min.
Applmech 06 00071 g028
Figure 29. Force versus displacement of the punch obtained in bending tests together with the curve obtained in simulations Vertical [Z] orientation of the specimen (a) 0 min, (b) 5 min, (c) 10 min, (d) 30 min, and (e) 60 min.
Applmech 06 00071 g029
Figure 30. Force versus displacement of the punch obtained in the bending tests together with the curve obtained in the simulations Flat [XY], On-edge [XZ], Vertical [Z] orientations of the specimens (a) 0 min, (b) 5 min, (c) 10 min, (d) 30 min, and (e) 60 min.
Applmech 06 00071 g030
Figure 31. Surface tension versus deformation as a function of post-curing time.
Applmech 06 00071 g031
Table 1. Mechanical Properties of the Resin Used in the Flat [XY] Orientation.
Post-Curing Time (min)05103060
Young’s Modulus (MPa)964.512551392.41551.51892.4
Poisson’s Ratio0.340.340.340.340.34
Shear Modulus (MPa)359.9468.3519.5578.9706.1
Table 2. Mechanical Properties of the Resin Used in the Vertical [Z] Orientation.
Post-Curing Time (min)05103060
Young’s Modulus (MPa)7741278136313391661.2
Poisson’s Ratio0.340.340.340.340.34
Shear Modulus (MPa)288.8476.8508.6499.6619.8
Table 3. Punch Displacement.
Position
Exposure TimeFlat [XY]On-Edge [XZ]Vertical [Z]
0 min16.0 mm15.0 mm14.0 mm
05 min9.5 mm7.0 mm8.5 mm
10 min9.0 mm9.0 mm8.0 mm
30 min9.5 mm7.0 mm7.0 mm
60 min7.0 mm6.5 mm7.0 mm
Table 4. Experimental average equation coefficients in the Flat [XY] orientation.
a0a1a2a3a4a5
0 min4,533,820,000.00646,962,000.00−26,541,900.00193,738.00−8387.881048.53
5 min3934.12−153,492,000.0022,219,200.00−1,115,860.002184.381327.71
10 min426,750,000,000.00−39,348,900,000.001,343,980,000.00−21,096,500.00132,118.001186.95
30 min1.005,144,658,833.70−393,726,332.7710,776,234.69−145,371.922267.45
60 min1.001,556,773,000.00−96,010,600.001,777,159.00−31,107.862067.92
Table 5. Experimental average equation coefficients in the Vertical [Z] orientation.
a0a1a2a3a4a5
0 min1,085,050,000.00−293,125,000.0029,652,300.00−1,280,220.0011,677.20775.27
05 min13,152,100,000.00−12,303,100,000.00442,574,000.00−7,970,800.0057,142.001176.92
10 min27,498,000,000.00−3,297,630,000.00169,977,000.00−4,790,010.0050,100.101215.67
30 min69,510,700,000.00−7,894,720,000.00359,565,000.00−8,577,360.0090,334.801031.80
60 min330,133,000,000.00−30,573,500,000.001,117,810,000.00−20,920,100.00186,509.001074.73
Table 6. Young’s modulus of the resin in Flat [XY] orientation.
Post-Curing Time (min)Young’s Modulus (MPa)Shear Modulus (MPa)
0964.5 ± 45.2359.9 ± 16.8
51255.0 ± 62.1468.3 ± 23.2
101392.4 ± 58.9519.6 ± 22.0
301551.5 ± 71.3578.9 ± 26.6
601892.4 ± 89.7706.1 ± 33.5
Table 7. Young’s modulus of the resin in Vertical [Z] orientation.
Post-Curing Time (min)Young’s Modulus (MPa)Shear Modulus (MPa)
0774.0 ± 38.2288.8 ± 14.3
51278.0 ± 59.4476.9 ± 22.2
101363.0 ± 67.1508.6 ± 25.0
301339.0 ± 61.8499.6 ± 23.1
601661.2 ± 78.9619.8 ± 29.4
Disclaimer/Publisher’s Note: The statements, opinions and data contained in all publications are solely those of the individual author(s) and contributor(s) and not of MDPI and/or the editor(s). MDPI and/or the editor(s) disclaim responsibility for any injury to people or property resulting from any ideas, methods, instructions or products referred to in the content.