Article

Electromagnetic–Computational Fluid Dynamics Couplings in Tungsten Inert Gas Welding Processes—Development of a New Linearization Procedure for the Joule Production Term

1
ICB, UMR 6303, UTBM, CNRS/University Bourgogne Franche-Comté, 90010 Belfort, France
2
ICB, UMR 6303, IUT Le Creusot, CNRS/University Bourgogne Franche-Comté, 71200 Le Creusot, France
*
Author to whom correspondence should be addressed.
Appl. Mech. 2024, 5(1), 121-140; https://doi.org/10.3390/applmech5010008
Submission received: 11 December 2023 / Revised: 7 February 2024 / Accepted: 10 February 2024 / Published: 28 February 2024

Abstract

:
The finite volume method (FVM) was used to model a tungsten inert gas (TIG) arc welding process. A two-dimensional axisymmetric model of arc plasma integrating fluid–solid coupling was developed by solving electromagnetic and thermal equations in both the gas domain and the solid cathode. In addition, two additional coupling equations were considered in the gaseous domain where the arc is generated. This model also included the actual geometry of torch components such as the gas diffuser, the nozzle, and the electrode. The model was assessed using numerous numerical examples related to the prediction of the argon plasma mass fraction, temperature distribution, velocity fields, pressure, and electric potential in the plasma. A new linearization method was developed for the source term in the energy conservation equation, allowing for the prediction of Joule effects without artificial conductibility. This new method enhances the efficiency of the classical approach used in the literature.

1. Introduction

TIG welding is a famous process for the assembly of metal parts in several industrial applications, as outlined by Tashiro et al. [1]. In this context, the local melting and re-solidification of the weld bead between the parts to be assembled during welding is one of the difficulties encountered during the assembly process, resulting in large deformations which often require straightening operations, thus increasing the production time. This research topic has been studied for many years, and a lot of papers in the literature have addressed industrial problems [2]. For example, Brickstad et al. [3] studied the formation of residual stresses in the butt-welded pipes used in nuclear plants. Capriccioli et al. [4] developed an FE model by considering the “birth and death” of elements to model the filler material. In the same vein, Mousavi et al. [5] analyzed the effect of the grooved angle on the distribution of residual stresses for the TIG welding process. Lundbäck et al. [6] performed computations and experiments with two plates but without any filler material between them and demonstrated the sensitivity of the model with buckling. Honggang et al. [7] developed a 3D model of a double-sided welding process using a plasma torch on one side and a gas tungsten arc (GTA) torch on the other side. Zhan et al. [8] developed a 3D model of a laser–metal inert gas (MIG) hybrid welding process, with an approach based on different types of heat sources and without any consideration of the arc. Zhang et al. [9] also studied the laser–MIG hybrid welding process in a keyhole mode and developed an approach investigating the solid–liquid–gas interface. Tchoumi et al. [10] studied the role of process parameters during the welding operations of 316 L stainless steel sheets to anticipate mechanical distortions and establish possible ways of decreasing them. The energy transfer efficiency (fraction of electric power transferred to the workpiece) is known to have a major influence on deformations and was studied, for example, by Dupont et al. [11] for several welding processes. In particular, the average arc efficiency was estimated to be 0.67 ± 0.05 for the GTAW (i.e., TIG) process.
A computational fluid dynamics (CFD) study of the electric arc is proposed in the present work to provide the main characteristics of the plasma flow for the GTA welding process. Understanding the behavior of the gas and plasma flow during welding operations is currently the subject of several research works: Lu et al. [12] studied the effect of welding gas nature on weld morphology for 304 stainless steel welding with a GTAW process. Arunkumar et al. [13] developed a specific activating flux (A-TIG) welding technology to enhance the depth of penetration up to 6 mm in a single pass. Similarly, Lin et al. [14] investigated the effects of activating fluxes and welding parameters on the penetration and depth-to-width ratio of the weld bead for Inconel 718 alloy welds. Venkatesan et al. [15] also studied the effect of ternary fluxes on the penetration depth for A-TIG processing. Dal et al. [16] developed an electromagnetic model of the arc for the TIG welding process to predict heat transfers.
However, as arcing and arc maintenance are hardly studied in the literature, the present study focuses specifically on this aspect by considering the real electrical conductibility in the energy transfer equations instead of using artificial conductibility when the arc becomes established. A two-dimensional axisymmetric model of the welding arc including this aspect was developed. The electromagnetic and thermal equations were solved in the gas domain as well as in the solid cathode, which is new in comparison with most of the earlier works, whereas two additional conservative equations were considered to model the arc. All the specific developments correlated with the complexity of the plasma flow were set thanks to user-defined functions coded in the C programming language. This code was interfaced with the ANSYS FLUENT 16.2 commercial software based on a finite volume approach. To validate this approach, physical quantities such as the temperature field within the plasma, electric potential variation, and plasma velocity were calculated by varying parameters such as the distance between electrodes, the gas flow rate, or the current intensity. The predicted results presented a fair agreement with data taken from the literature. In the numerical aspect, several improvements were performed with respect to previous works: some of the equations were solved in both the fluid and solid parts (notably in the cathode), and a new linearization procedure was developed to implement the Joule effect in the electric arc, making the modeling process more robust, as explained below.

2. Industrial Context

In the food industry, it is mandatory to manufacture efficient machines to process food by tumbling, mixing, marinating, injecting liquids, and cutting meat (Figure 1).
A large majority of these machines require assembling thin plates together. For hygiene reasons, welding is preferred because it leaves no space where bacteria could develop. However, local melting and re-solidification of the weld beads between the parts to be assembled by TIG welding provide large deformations that often require manual straightening operations with a drastic increase in production time. Tchoumi et al. [10] developed a thermomechanical model based on experimental investigations to overcome this difficulty. These investigations were conducted by considering stainless steel 316 L, which is often used for industrial applications in the food industry. To account for the behavior of the arc, a CFD model was developed as described in next sections. Naturally, manufacturers of food industry machines are strongly interested in predicting the deformations that occur during welding operations (FEM-type simulations), while being far less interested in modeling the welding process itself. However, the welding process directly impacts the heat fluxes transferred, and subsequently deformations, which are often the main concerns of industrial manufacturers. Providing a reliable digital twin of the welding process is therefore essential for the reliable prediction of distortions due to welding operations.

3. CFD Modeling of the Arc and Plasma Flow

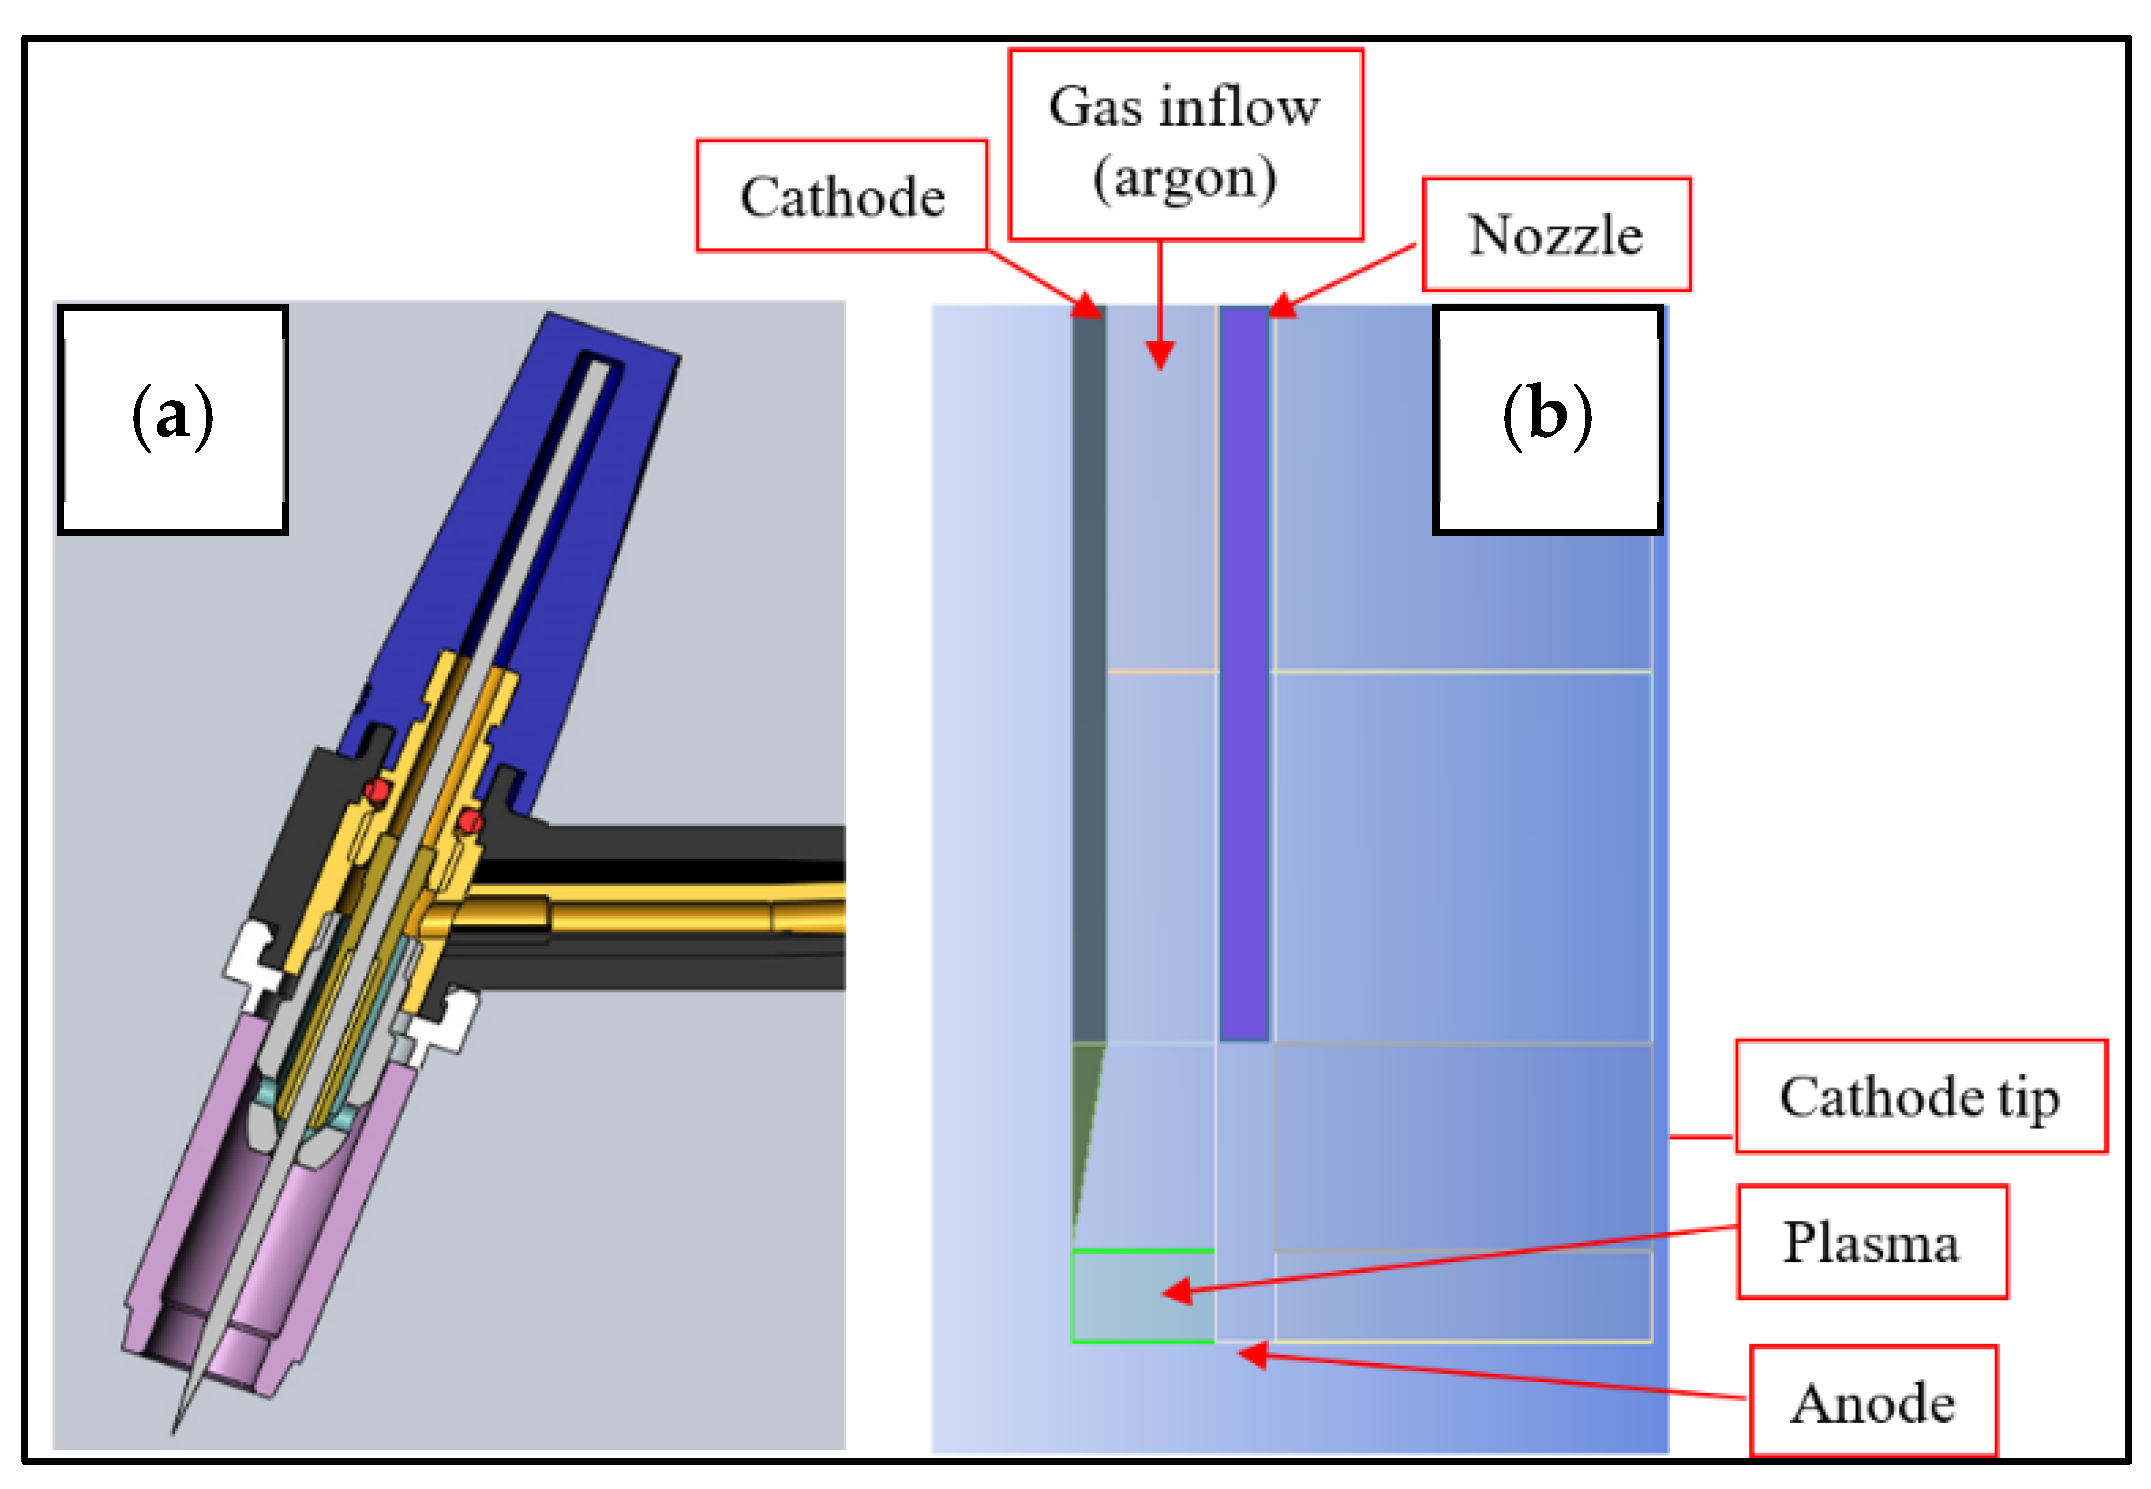
Zhu et al. [17] developed a CFD model to study a free welding arc at atmospheric pressure, while Lowke et al. [18] studied a TIG arc with a similar model. Yamamoto et al. [19] developed a CFD model of a TIG arc and studied the effect of metal vapors on the current density in the near anode region. Tanaka et al. [20] developed a model of TIG welding including the electrodes and allowing the prediction of the temperature fields in the cathode and the anode. Murphy et al. [21] also used a CFD model of the arc and studied thermal fluxes transferred at the anode surface (TIG welding), as well as the pressure increase at the anode surface (MIG welding process). Mougenot et al. [22] developed a 3D transient model of a transferred arc in interaction with the molten pool at the anode surface. The authors used Electricité de France’s open-source software Saturne 2.0.2 to implement their model. They investigated metal vapors coming from the weld pool, which was considered as non-deformable. The tungsten cathode was not part of the CPU domain, so that a current density profile was set at the cathode tip. According to the results presented in [22], obtained for a current intensity of 200 A and a distance between cathode tip and anode of 5 mm, the influence of metal vapors on the temperature field was limited. Traidia et al. [23] developed an FEM axisymmetric CFD model of pulsed current GTAW with COMSOL Multiphysics software. However, the provided results focused more on phenomena occurring in the weld pool. The same authors [24] also provided the corresponding CFD results in the arc flow region for the same conditions and compared the results of their computations with the experimental data of Hsu et al. [25] (GTAW, I = 200 A, arc-length of 10 mm). More recently, Ebrahimi et al. [26] developed a simulation-based approach to study the oscillatory behavior of the metal melt pool during GTAW. Their simulations were implemented using ANSYS/FLUENT and based on a volume of fluid (VOF) model, which is well suited to monitoring the gas/liquid interface in the melt pool. In a second article, the same authors [27] studied with the same model the effects of several process parameters (such as a sulfur concentration ranging from 60 to 240 ppm, and a travel speed ranging from 1.25 to 5.0 mm/s). Considering the cathode as part of the computational domain is not a common modeling choice in the literature. However, Goodarzi et al. [28] developed a 2D axisymmetric model of the arc to study the effect of the cathode tip for GTAW. For their boundary conditions, they chose the cathode to be a part of the CPU domain with a semi-coupled approach (i.e., electric current set at the cathode inlet/no current density profile required at the cathode tip). However, their model is not fully described. In their study, the arc length ranged between 2 and 10 mm, whereas the cathode tip varied between 9° and 150°. More recently, Li et al. [29] also used a 2D axisymmetric model to study GTA welding, without incorporating the tungsten cathode as part of the computational domain. In addition, they did not provide any detail about the linearization of the Joule production term in the energy conservation equation. Finally, this question has never been addressed in the literature dealing with electric arcs modeling in the context of GTAW or other manufacturing processes. In the present study, the computational domain includes two regions defining the tungsten solid cathode and the gas domain (plasma generated by the electric arc), whereas the anode wall (316 L stainless steel) is a wall boundary of the domain. The welding torch is an ABITIG20F apparatus from ABICOR BINZEL with a tungsten electrode and components presented in Figure 2.
The CFD model was developed using ANSYS FLUENT 16.2 software, in which the main equations governing fluid flow are already implemented. It was however necessary to implement in-house routines in C language and to plug them into FLUENT to combine the Navier–Stokes and Maxwell equations. These routines are based on two specific additional conservation equations, which take into account the electrical conductibility of the argon plasma without using artificial conductibility during the maintaining of the arc. Finally, the developed model considers the following assumptions:
(a)
The arc is in local thermodynamic equilibrium (LTE), which is a realistic hypothesis when the distance between the tip of the electrode and the surface of the anode is at least 2 mm, as suggested by Griem et al. [30];
(b)
A steady-state regime is assumed in the plasma flow;
(c)
The effect of metal vapors is neglected because the electric current is lower than 150 A;
(d)
The quantity of positive charges almost balances the charge of electrons (quasi-neutral field);
(e)
The fluid flow is turbulent.

3.1. Governing Equations

The temperature dependence of electrical conductibility σ was considered and allowed coupling equations to be implemented without any requirement of artificial conductibility (commonly used in the literature) anywhere in the domain. In this way, the model is consistent with the true physics describing electromagnetic couplings in the arc column. In addition, the true temperature dependence of σ is not detrimental to the convergence of the iterative solving procedure. The properties of common plasma gas mixtures are available in the literature, such as in the book of Boulos et al. [31]. A classical temperature dependence of electrical conductibility of argon plasma is plot in Figure 3 according to the literature data.
On the other hand, two additional transport equations were included to model electromagnetic couplings. The considered physical model of the arc is thus very similar to that used in [19,20]. This type of model was also used by Bolot et al. [32] who implemented a 3D model to study the electric arc within a plasma gun. These two equations allow:
(1)
calculating the Lorentz force which plays a key role to describe the behavior of arcing and maintaining of the arc [33];
(2)
accounting for the Joule effect to properly solve the energy equation in the plasma flow.
These equations were included by considering two user-defined scalars (additional entities for which a conservation equation is solved). In addition, all coupling terms and temperature-dependent properties were set by routines coded in C language, thanks to FLUENT user-defined functions (UDFs). The two additional equations for considering electromagnetic couplings and for which a conservation equation is solved are the electric potential ϕ and the axial component A x of the magnetic potential vector:
x σ ϕ x 1 r r σ r ϕ r = 0
2 A x x 2 1 r r r A x r = μ 0   j x
in which the electrical conductibility σ depends on the temperature T as explained before, and x and r stand for axial and radial directions, respectively. μ 0 is the permeability of free space, and   j x is the axial component of the current density J (A/m2):
J = j x j r = σ ϕ x ϕ r
The first component   j x of J is calculated from the electric potential field ϕ obtained from Equation (1) and is added as a source term in the right-hand side of Equation (2). Equations (1) and (2) are therefore strongly coupled: this coupling is considered thanks to the FLUENT internal sequential iterative solving procedure allowing the progressive updating of the different fields simultaneously. In addition, the rotational component of the magnetic field is calculated from
B θ = A x r
The axial and radial components of the Lorentz force F resulting from the cross product Λ between the current density J and the magnetic field B are hence calculated as
F = F x F r = J   Λ   B = j r B θ j x B θ = σ r A x r σ x A x r
Equation (5) is finally reported as a loading force in the right-hand side of the Navier–Stokes equations which are solved using the internal standard procedure of FLUENT:
ρ u u x + ρ v u r = p x + 2   x μ e u x + 1 r r μ e r u r + 1 r r μ e r v x + F x
ρ u v x + ρ v v r = p r + x μ e v x + 2 r r μ e r v r + x μ e u r 2 μ e v r 2 + F r
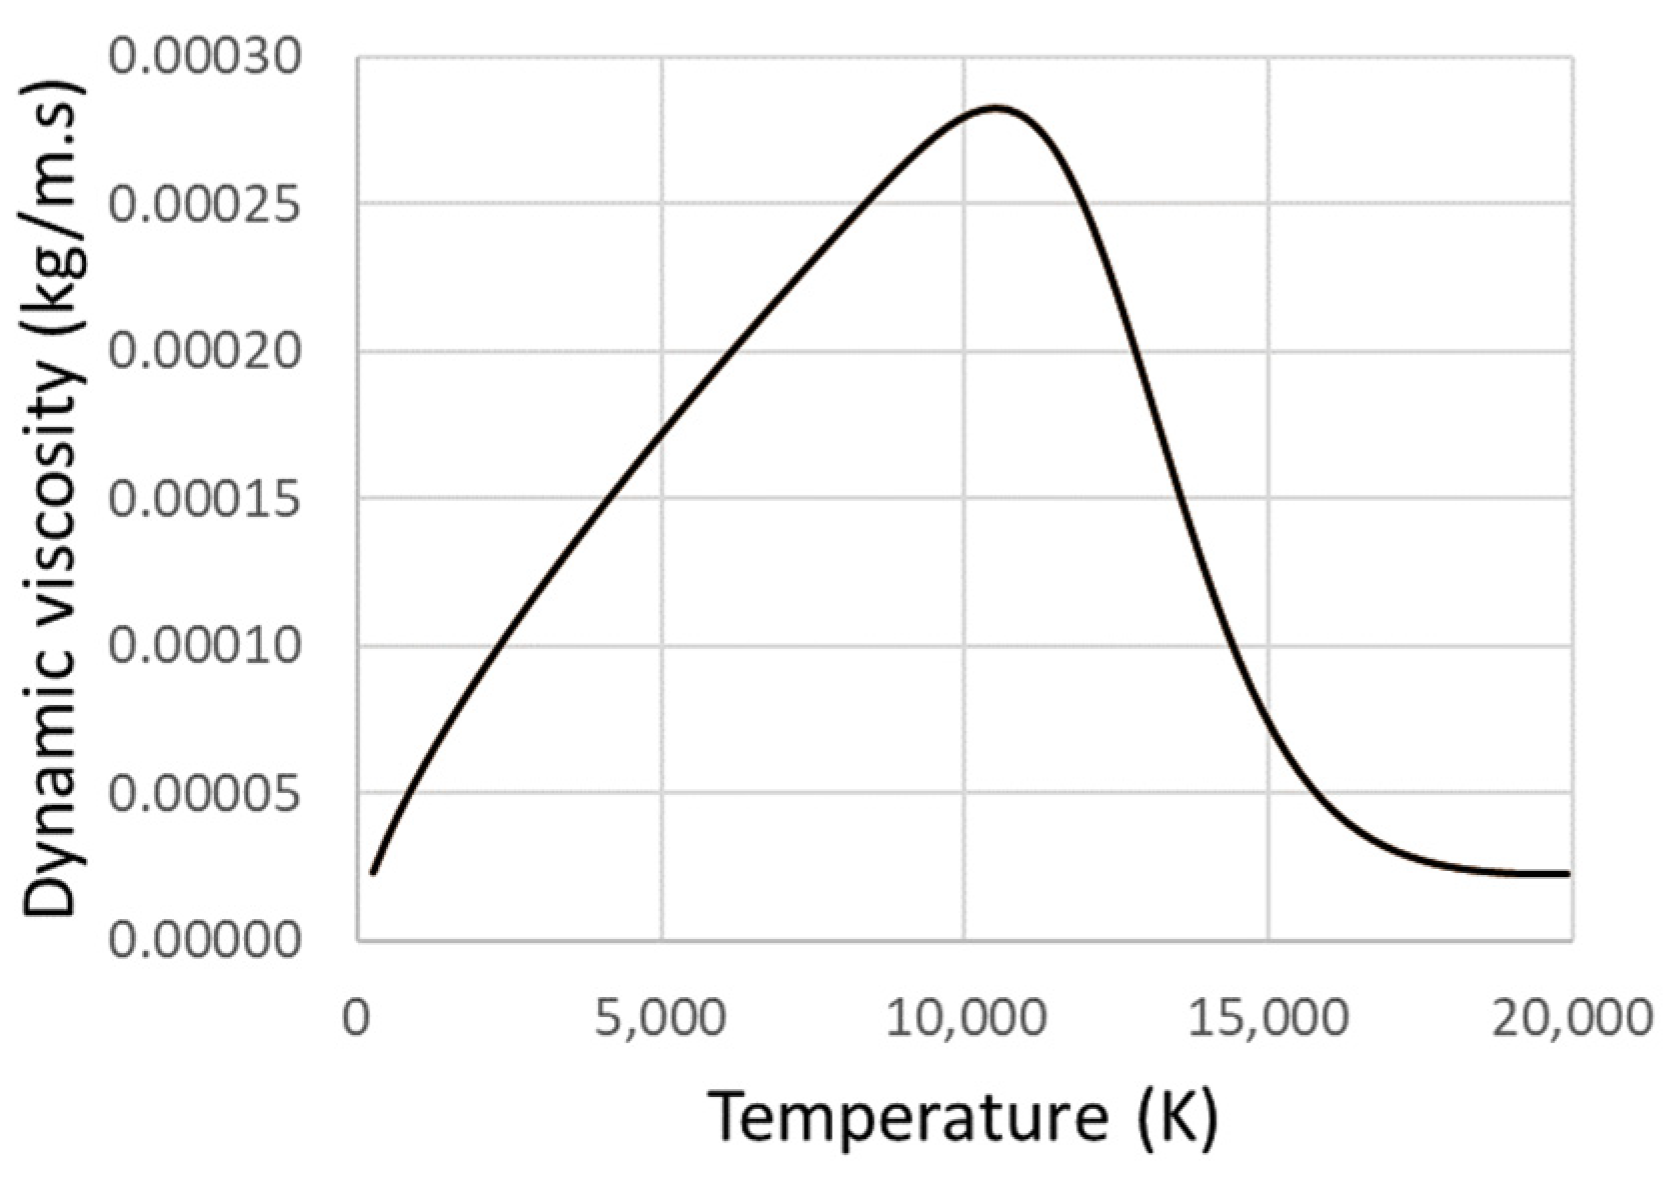
where μ e stands for the effective dynamic viscosity, u and v are the axial and radial components of the velocity, and p is the static pressure. The realizable k-ε turbulence model was selected to consider turbulence effects through the turbulent viscosity so that μ e = μ t + μ . As reported in [32], the dynamic viscosity μ is temperature-dependent (Figure 4). In addition, the corrective term proposed by Bolot et al. [34] was taken into account since it has a noticeable effect for high-temperature gas flows, such as plasma flows. Finally, the argon plasma density ρ is calculated according to the following law:
ρ = P   M T R   T
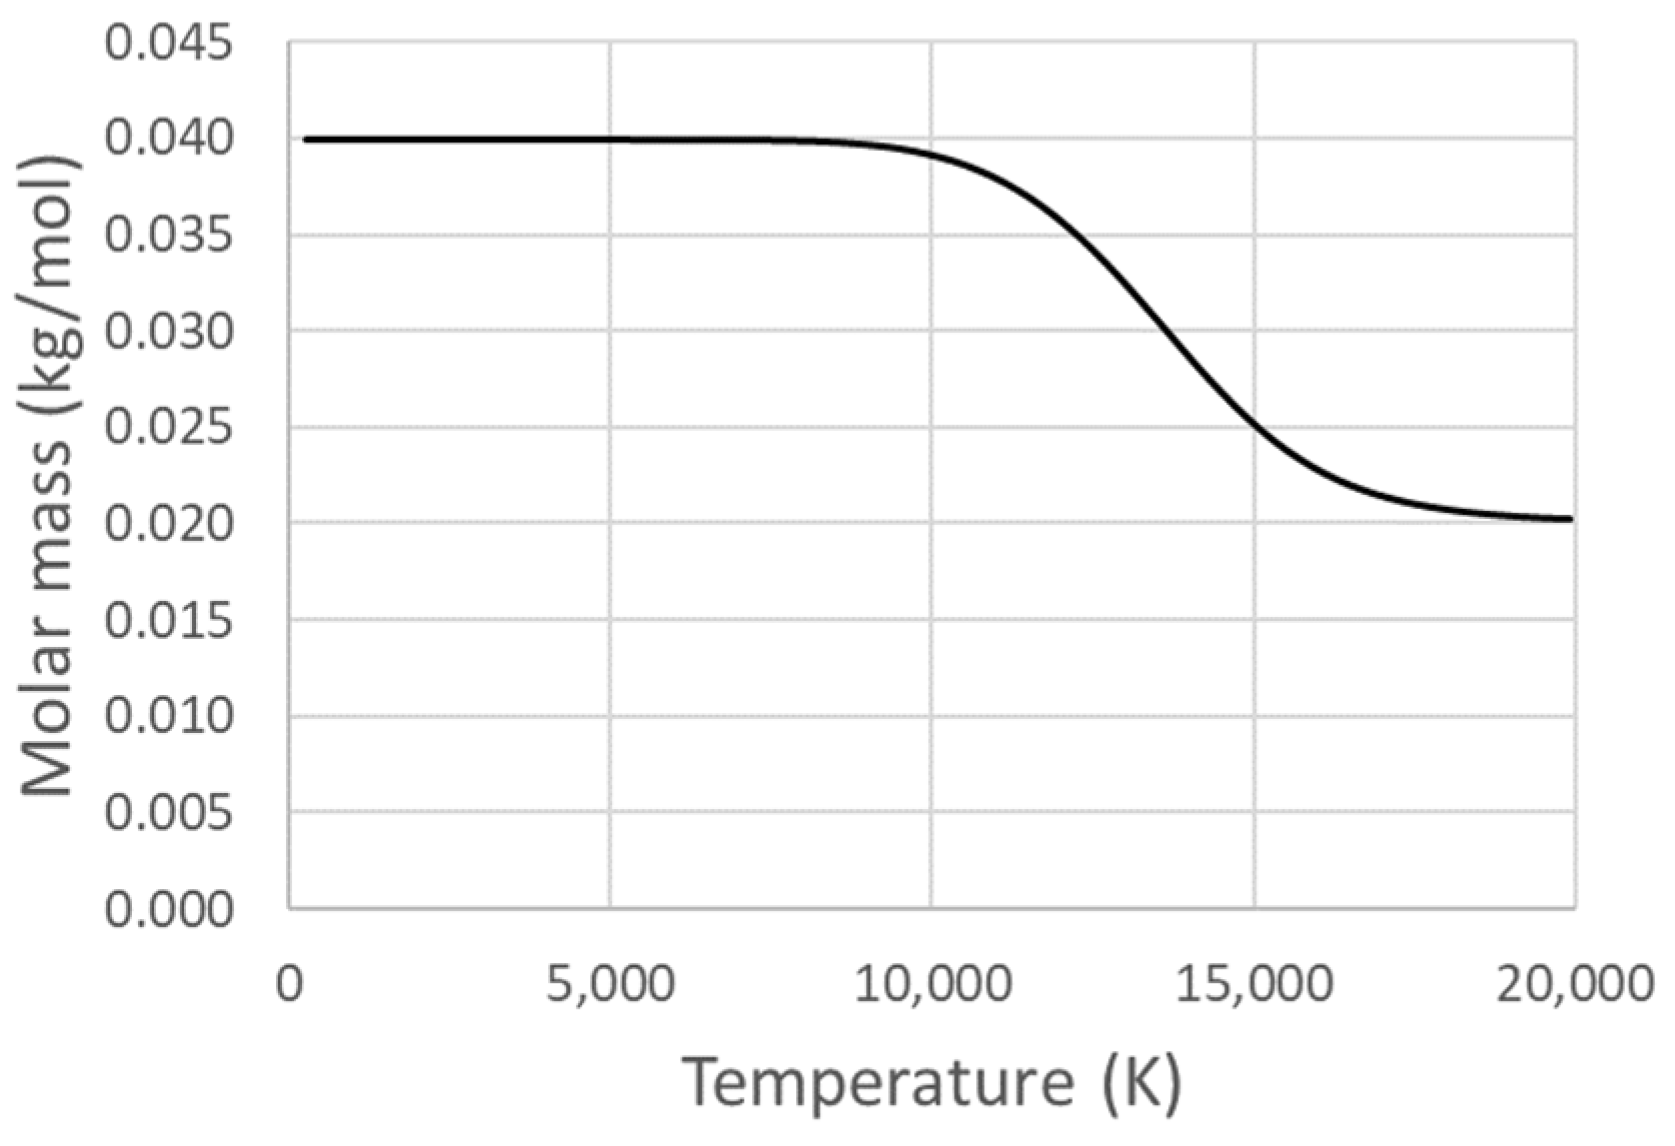
in which P is a constant pressure of 100 kPa, R is the universal gas constant, and M T is the molar mass of the argon plasma depending on the temperature T . This dependence is presented in Figure 5 with data extracted from [35]. Similar data are also available in [36].
Moreover, as explained before, electromagnetic coupling results (Equations (1) and (2)) are also required to solve the energy equation in the plasma flow. This energy equation is expressed as
ρ u h x + 1 r r ρ v h r x κ e T x 1 r r κ e r T r = Q J Q R + u P x + v P r
with: κ e = κ + μ t   C p P r t .
All terms on the right-hand side of Equation (9) represent the source terms of the energy equation. In particular, the first term Q J represents the Joule effect calculated from
Q J = J 2 σ = σ ϕ x 2 + ϕ r 2
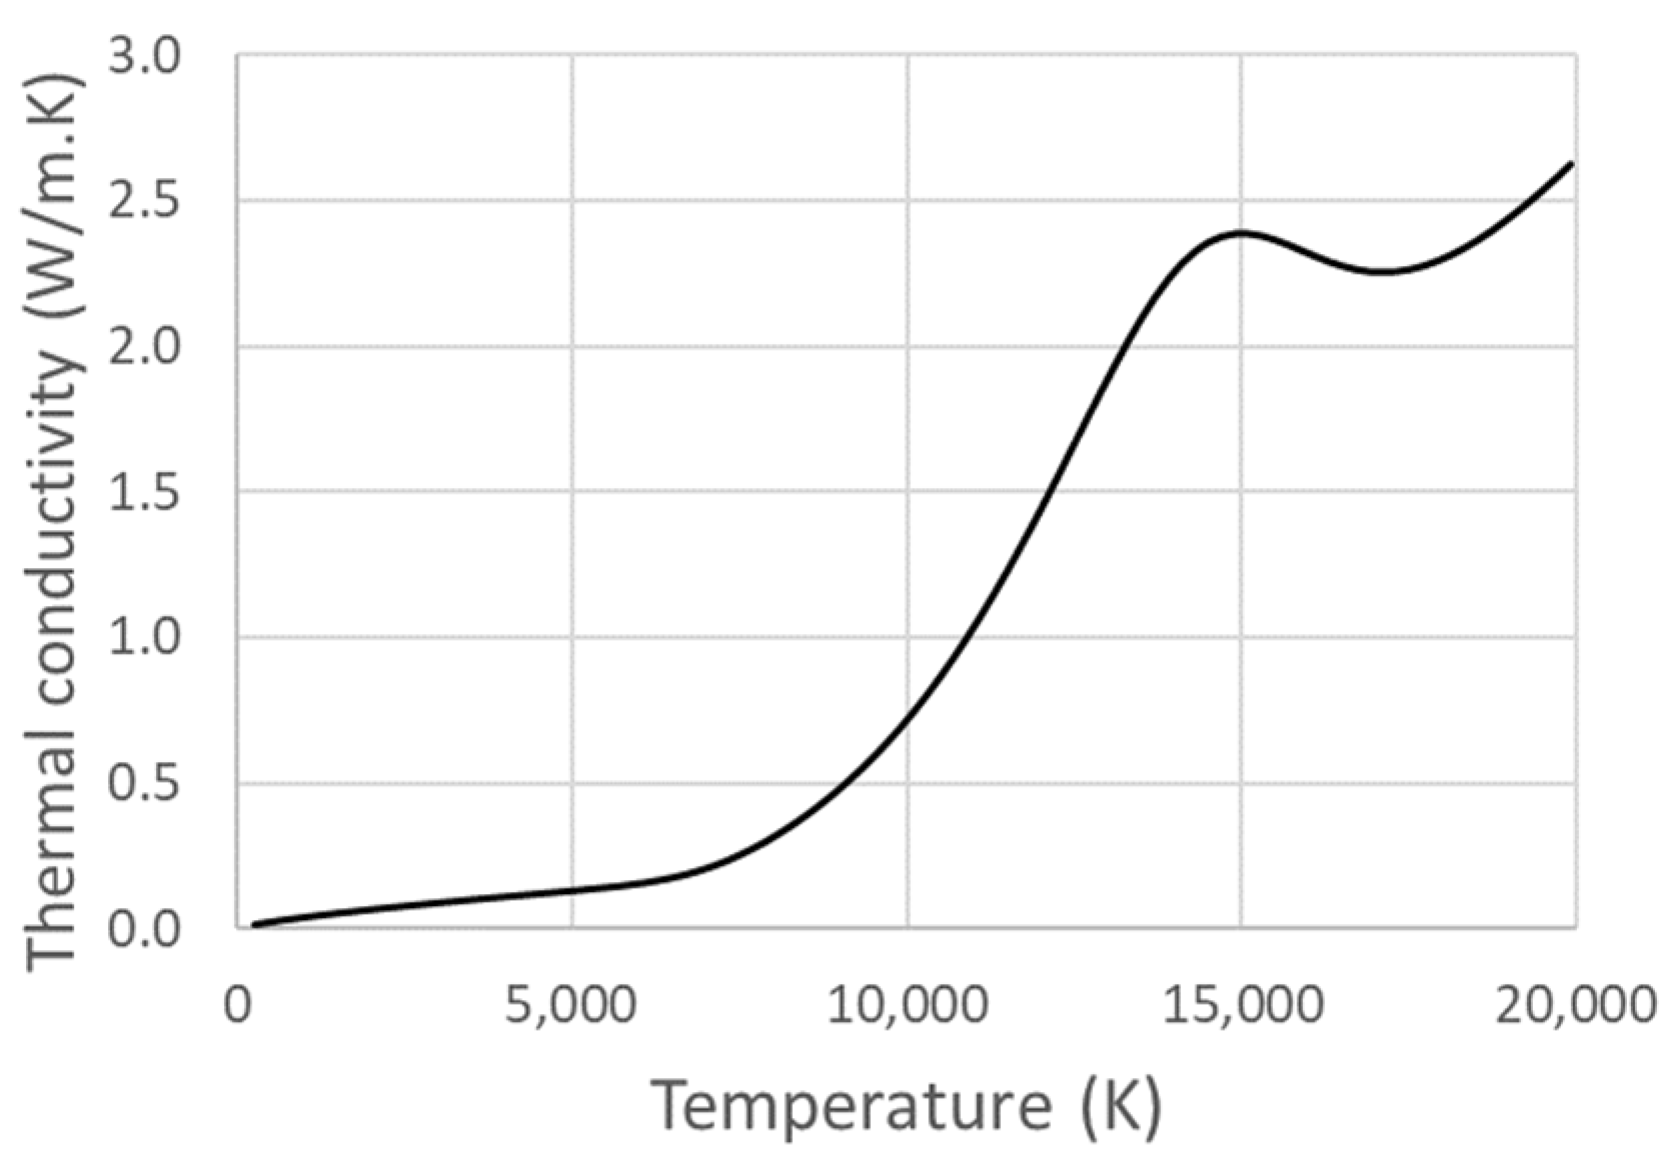
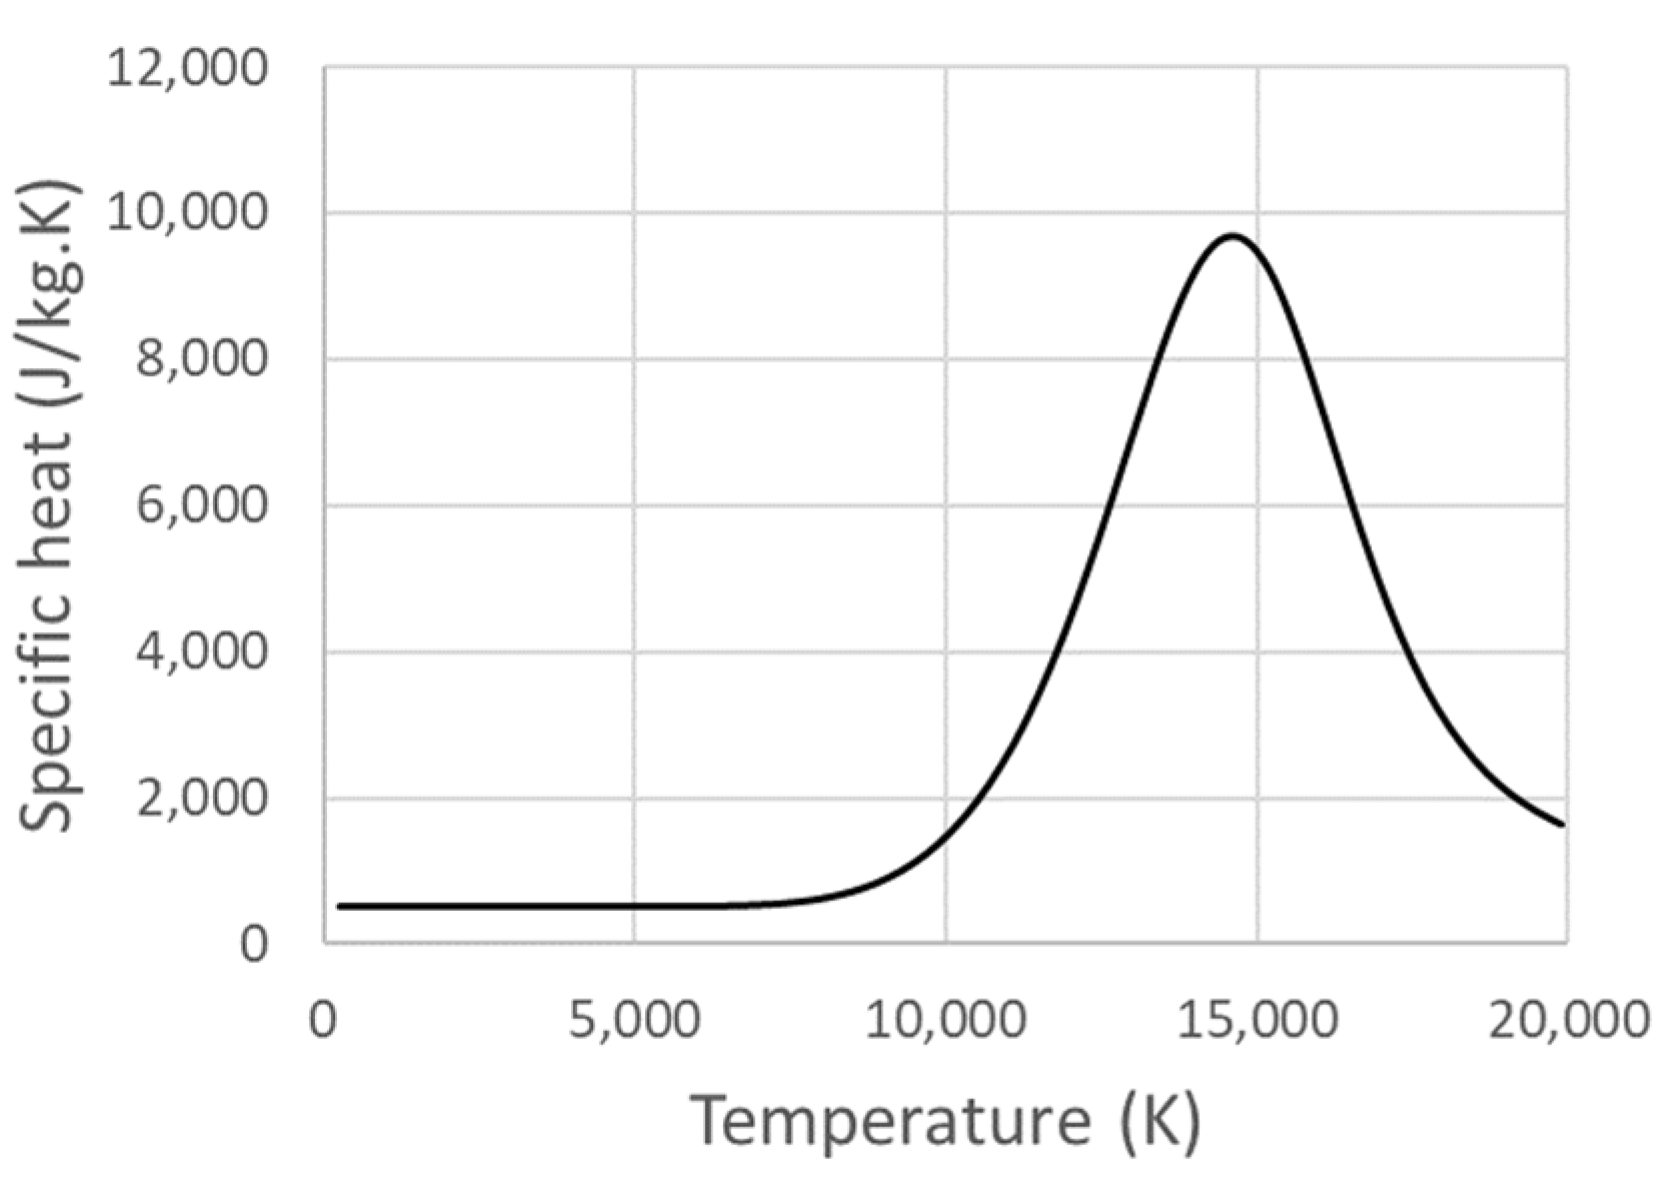
Equation (10) clearly shows that the electric potential ϕ , solution of Equation (1), is needed to calculate the Joule production term. The turbulent Prandtl number P r t (which appears in Equation (9) through the coefficient κ e ) was set to 0.85, whereas the thermal conductivity κ and the specific heat   C p depend on the argon plasma temperature, as shown in [31]. These dependencies are presented in Figure 6 and Figure 7.
The second source term Q R on the right side of Equation (9) represents radiative losses and has been studied in [37]. Lago et al. [38] estimated that radiative losses represent about 25% of the electric energy input for an argon plasma. Finally, the expression suggested in [37,38] was considered:
Q R = 4 π ε N
where ε is the Stefan–Boltzmann constant and N is the neat emission coefficient. The value of this last coefficient was chosen based on the data presented in [39].
In addition, to investigate the quality of the arc column protection by argon, another conservation equation was considered:
ρ u Y A r x + 1 r r ρ v Y A r r x ρ D e Y A r x 1 r r ρ D e r Y A r r = 0
in which Y A r is the argon mass fraction and D e is the effective diffusion coefficient (m2/s) of argon plasma. This equation highlights that the mass fraction of air entrained in the plasma is given by 1 Y A r . The effective diffusion coefficient ρ D e was derived from
ρ D e = μ S c + μ t S c t
in which S c is the Schmidt number, S c t is the turbulent Schmidt number, and a unitary Lewis number was assumed, meaning that S c P r and S c t P r t = 0.85 .

3.2. Arcing and Maintaining of the Welding Arc

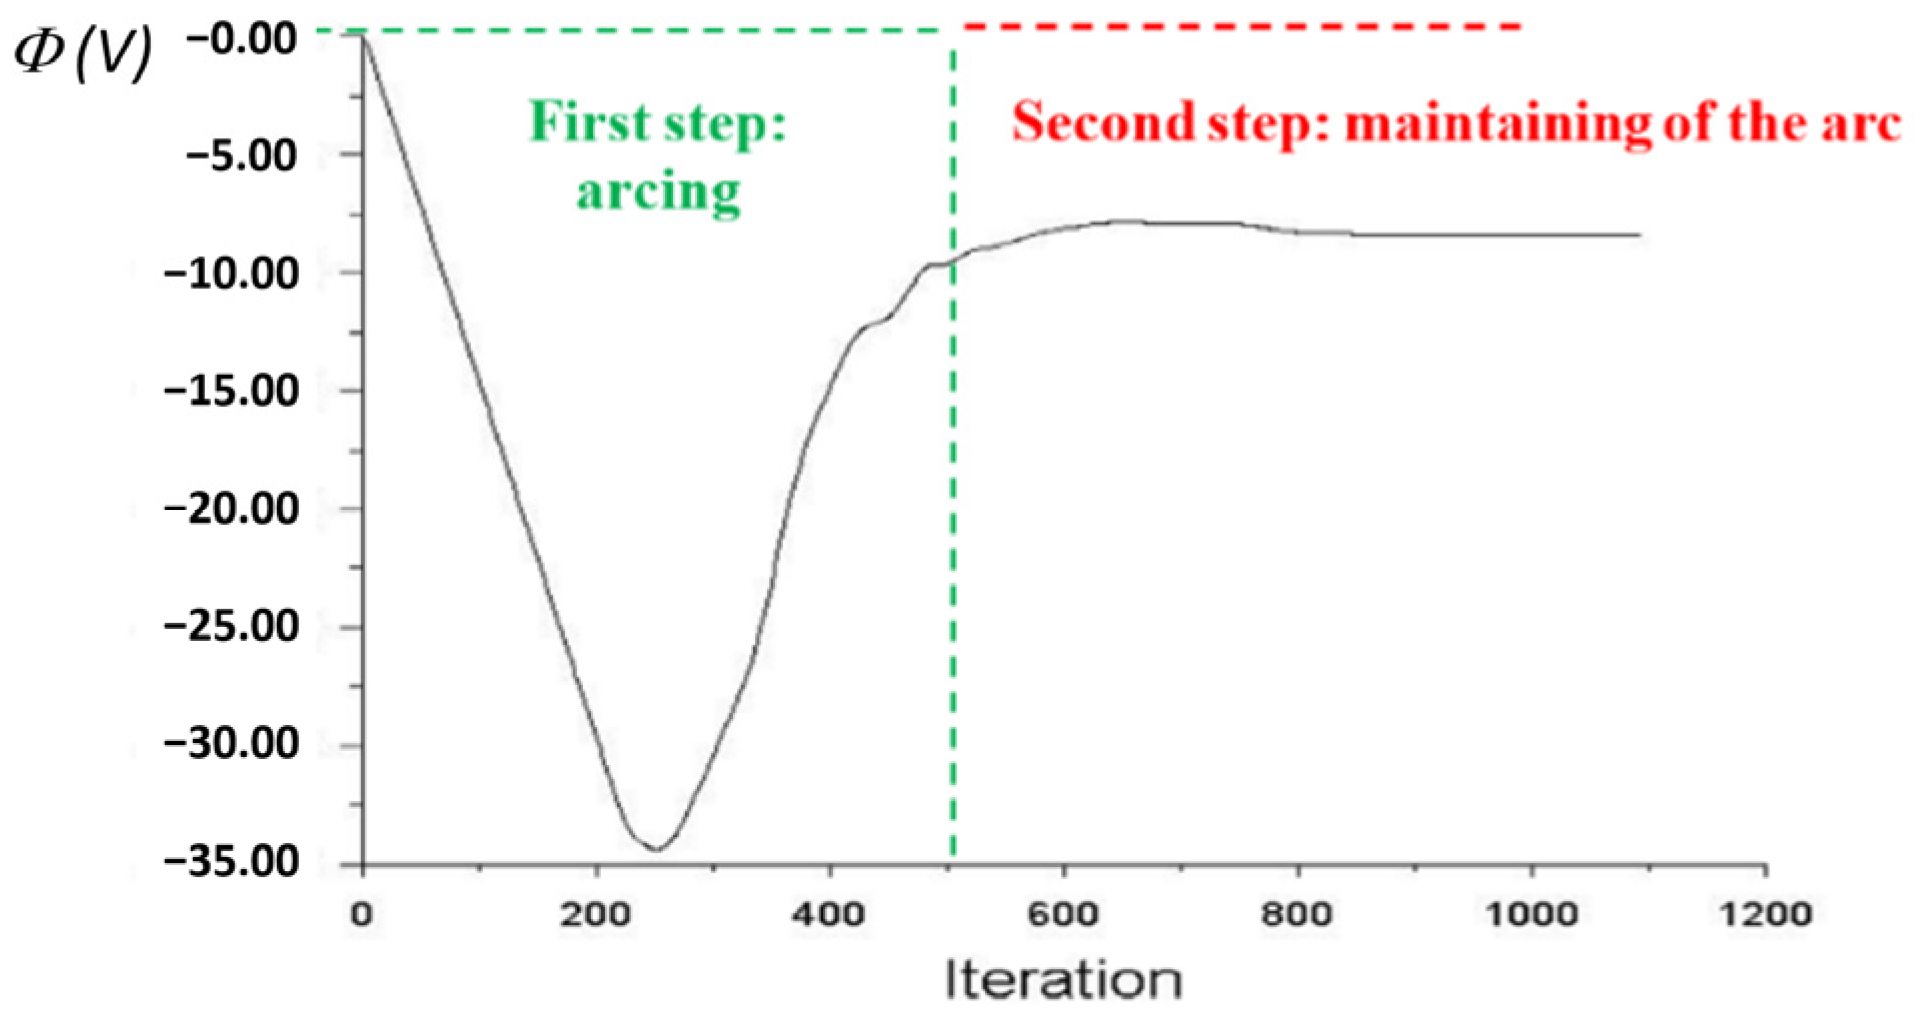
One of the major achievements of the present work concerns the computation of heat transfers (Equation (9)) from the cathode to the anode during maintaining of the welding arc. Different authors have investigated this issue, such as Sanders et al. [40], Dunn et al. [41], Ushio et al. [42], and Wu et al. [43], but none have explained in detail the steps of arcing and maintaining of the arc. In the present model, the heat transfer from the electric arc is computed in two steps as presented in Figure 8.
The first step is almost standard and concerns arcing (arc ignition) by using an artificial value for electrical conductibility. This step is required to avoid any uncontrollable increase in ϕ due to σ 0 in Equation (1). Nevertheless, even when the plasma becomes electrically conductive (from the temperature increase), most models still use artificial conductibility in the near wall regions where the temperature drops to that of the solid wall. The second step is less classical in the sense that it aims at maintaining the arc without any need for artificial conductibility. This second step consists of implementing an improved linearization method to set the Joule production term, in order to improve the convergence of the iterative procedure used to solve the energy equation. In practice, the Joule production term given by Equation (10) is included in the right-hand side of the energy conservation Equation (9). In view of the general solving procedure applied in FLUENT and due to all coupling effects, an iterative process is always considered to solve Equation (9). For the iterative solving procedure applied to the temperature T , as well as to other quantities, a linear equation of the following form is thus written for each T k (temperature in cell k):
a k T k = l = 1 l = n b a l T l + b
in which the l index stands for all the neighbor cells of k , and n b is the number of neighbor cells of cell k .
An equation such as Equation (14) is thus written for each cell k of the computational domain, and hence forms a system of equations, which is solved iteratively. Without linearization, the simplest way to implement Q J T consists in using a like-explicit scheme, where the current (iteration i) Joule effect term Q J i depends directly on the previous (iteration i − 1) temperature T i 1 calculated from Equation (9):
Q J i = J 2 σ T i 1
In that case, the term Q J T appears in Equation (14) for each cell through the coefficient b . However, this approach is not the best in terms of convergence. In the present work, the electrical conductibility σ T is computed from one of the two following relationships, which fit the data of Figure 3:
I f   T > 9273.5 :   σ T = 10,972 × l n T 7626.55
I f   T 9273.5 :   σ T = 7.11081   × 10 5 × e x p 5.38188 × 10 4 T
Without any linearization of Q J T , this source term is hence set in the coefficient b of Equation (14). However, this method is often detrimental to convergence, so that linearization is preferable whenever possible. To do so, FLUENT provides the derivative of the source term as a function of the variable being solved ( T in the present case), so that the user can provide Q J T (default zero, i.e., no linearization of Q J T which is set in b ). A linearization of Q J has thus been introduced considering the following method:
(a)
The control of the electric current during the welding process (the electric current intensity I is imposed so that the integral of the current density J over the cathode tip surface is imposed too);
(b)
The variation in the electrical conductibility with temperature.
As a first approximation, the derivative Q J T can be rewritten as
Q J T ~ Q J σ σ T = J 2 σ 2 10,972 T = 10,972 T ϕ x 2 + ϕ r 2
Note that the first partial derivative of Equation (18) was evaluated assuming no variation in the current density (i.e., J = c s t e ). In all cases, the electric current must indeed go through the domain, whereas the ϕ field adapts itself depending on the current density and σ . In addition, Equation (16) was used to evaluate the second derivative because the production term is much higher at high temperatures. If the derivative of the source is negative (as expected here due to the minus sign in Equation (18)), it is then split as Q J = Q J T V T . In that case, the first term V Q J T = Q J T Q J T is left in the right hand side of Equation (14), and hence corresponds to the coefficient b , whereas the second term T Q J T is transferred to the left hand side of Equation (14). This transfer is realized by adding Q J T to the a k term. Since Q J T is negative (which can be observed in Equation (18)), a k tends to increase due to the linearization of the source term, and the solving procedure becomes more stable. Finally, this improved linearization procedure was implemented in C thanks to FLUENT user-defined functions. It represents a significant improvement regarding all previous works, in which absolutely no details on this subject have been reported to date. The proposed method presents two advantages:
(a)
It avoids under-relaxation in the iterative process applied to solve the energy conservation equation and therefore significantly enhances the convergence of the iterative procedure used to solve Equation (9);
(b)
It avoids the use of artificial conductibility in some parts of the domain (i.e., near the surface of electrodes, for example).

3.3. CFD Model

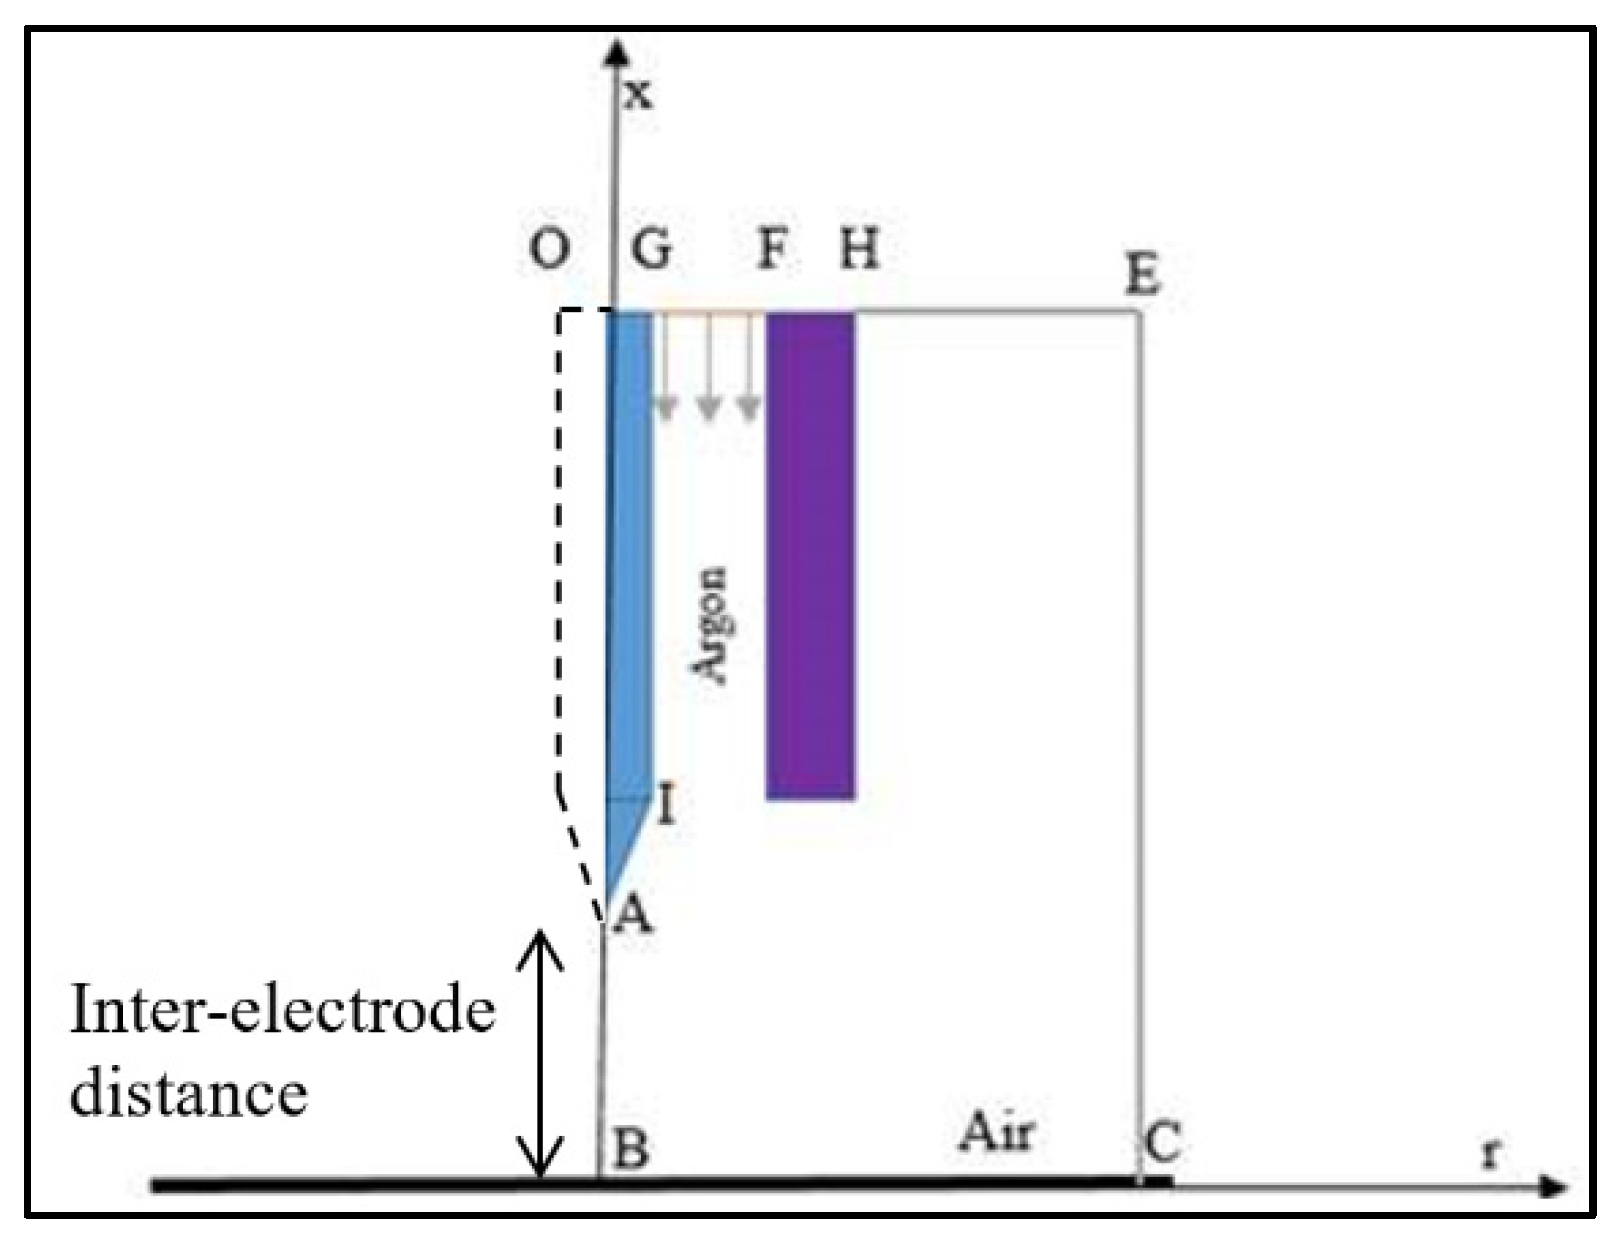
The computational domain is simplified for calculation purposes as proposed in [18,44], which is necessary to apply a 2D axisymmetric model. However, it contains all essential elements of the torch. This simplification considers the coupled arc–electrode system as two different regions (cathode for the solid region and argon–arc plasma for the fluid region). The torch dimensions are similar to those of the ABICOR BINZEL ABITIG20F welding torch. According to the axisymmetric assumption, only one half of the total domain was considered for the calculations. The calculation domain (designated by the letters OECBO in Figure 9) is divided in two parts: a solid part (OGIAO area) and a fluid part (GECBAIG area). It is pointed out that the purple-colored ceramic part is used for guiding the argon flow but has a weak interaction with other parts. Therefore, the ceramic part was not considered in the calculations.
The boundary conditions applied to the computational domain are listed in Table 1 for each part of the torch. Along the GF line, the argon mass fraction Y A r is set to 1, which corresponds to an injection of pure argon (i.e., shield gas). Moreover, the axial component of the argon gas velocity u is related to the gas flow rate Q m , to the argon density ρ , and to the inlet surface A through the relation Q m = ρ A u . Along the OG line, the electric current density j is imposed to I S , where I stands for the electric current intensity and S is the cathode cross-section. Therefore, the normal gradient of the electrical potential is the ratio of the current density to the electrical conductibility σ . However, because there is no gas inside the cathode (i.e., the solid part), the axial u and radial v velocity components are not defined, as well as the mass fraction Y A r of plasma gas. Along the AI line (cathode tip), corresponding to the interface between the solid and the fluid parts, the temperature T , the axial component of the magnetic potential A x , and the electrical potential ϕ are coupled, which ensures the continuity of the heat flow and electric current on both sides of this interface. Finally, in all other zones, conventional boundary conditions (such as a temperature of 288 K for the ambient gas) are considered.
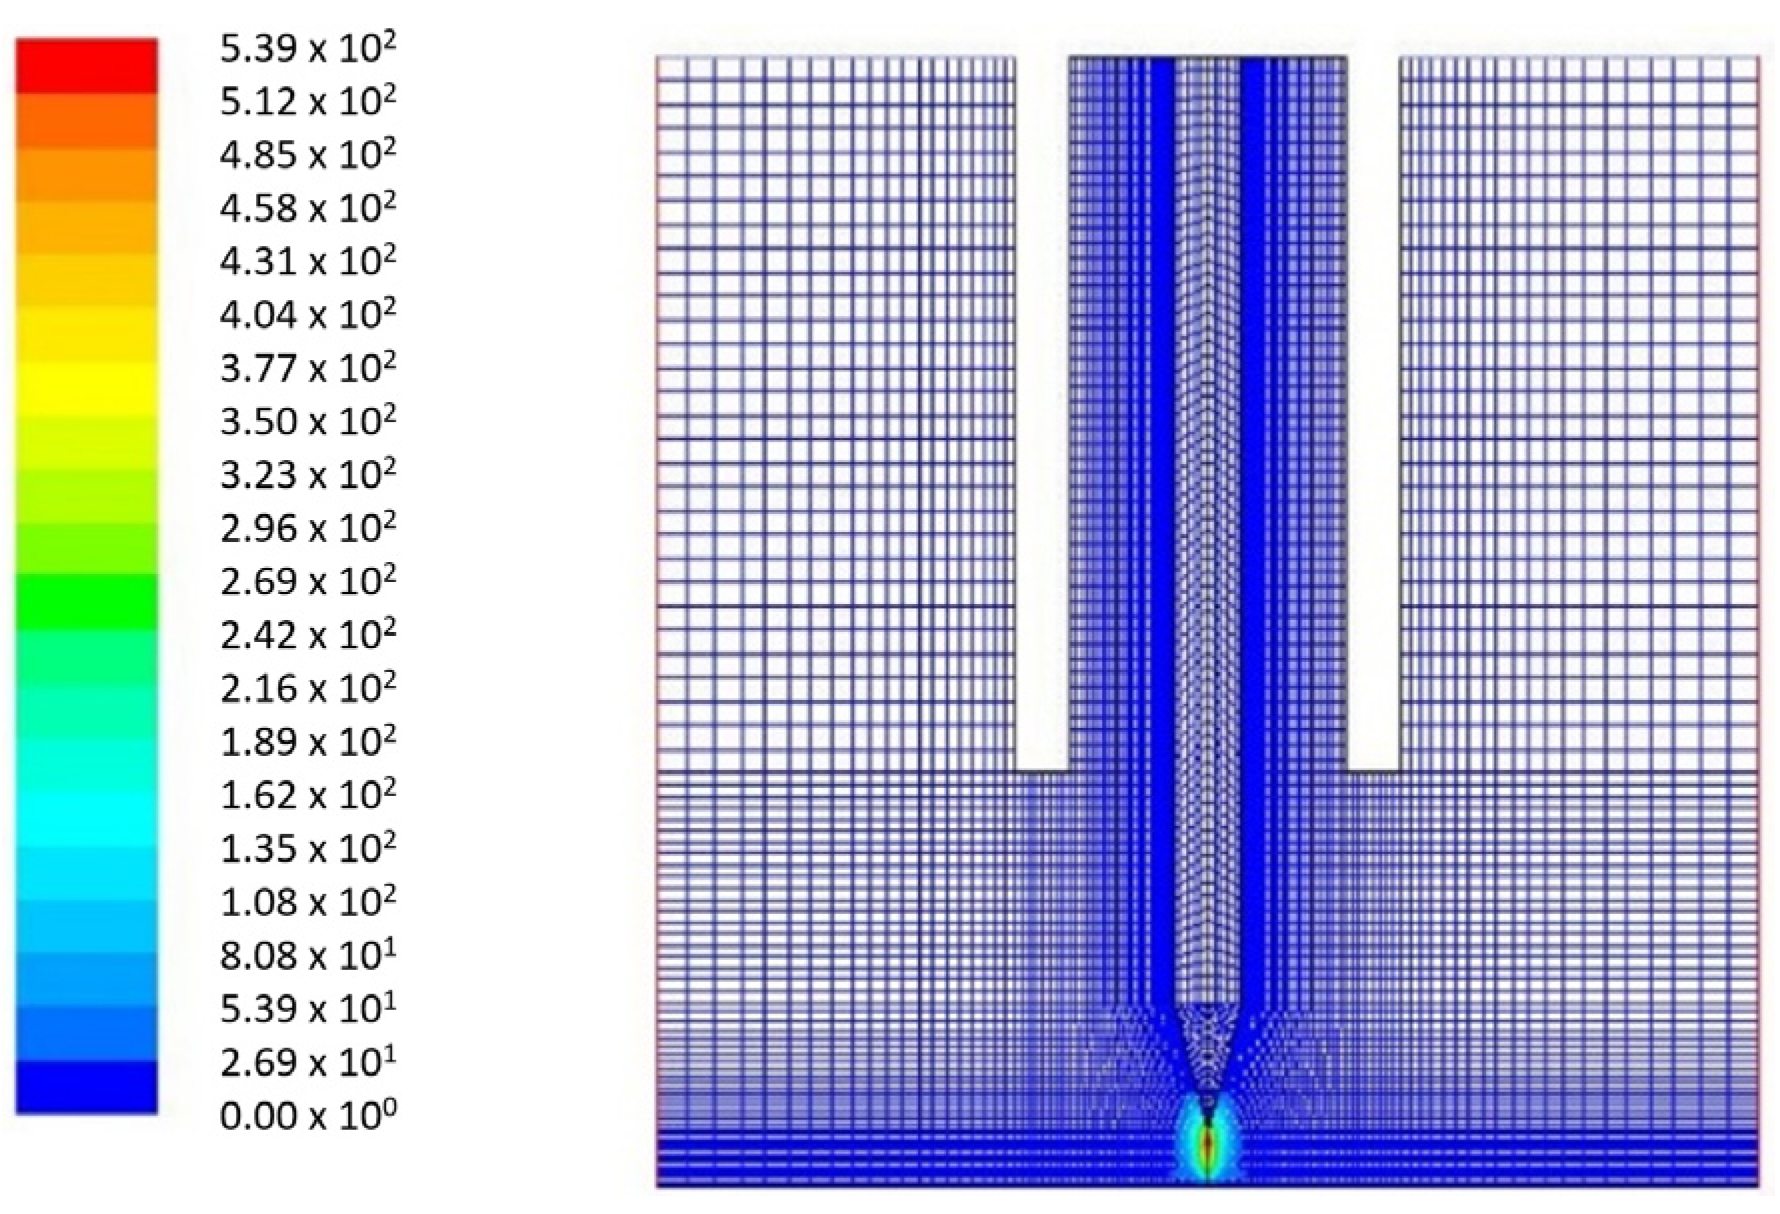
The electrode presented in Figure 9 is meshed with 2D axisymmetric elements whose size depends on the area sensitivity (Figure 10). For example, the mesh is gradually refined near the arcing region (with a smallest size in the plasma of 100 µm × 100 µm), while the largest size is in the ambient air area (0.86 mm × 0.65 mm). Only the tip of the cathode is meshed with triangles, all other areas being meshed with quadrangles. The equations presented in the previous section are solved in the different meshed areas presented in Figure 10: argon inlet, cathode, ambient air, cathode tip, and plasma region.

4. Numerical Results

The numerical results predicted with the above model are presented in the forthcoming subsections, after complete stabilization (i.e., more than 1000 iterations in Figure 8). All computations are performed with a current intensity of 100 A, an argon flow rate of 8 slpm, and an electrode distance of 2 mm, except for the last subsection, in which a parametric study is considered (i.e., variation in electric current). Each subsection is dedicated to a specific physical quantity, such as the argon plasma mass fraction, temperature, plasma velocity, and pressure field. Except for the argon plasma mass fraction, the strongest gradients are observed between the cathode tip and the anode. Axial profiles are provided along the symmetry axis of the torch (i.e., the AB line in Figure 9). Along this line, the cathode tip is the start position ( x = 0   m m ), whereas the anode wall corresponds to the end position ( x = 2   m m ).

4.1. Argon Mass Fraction

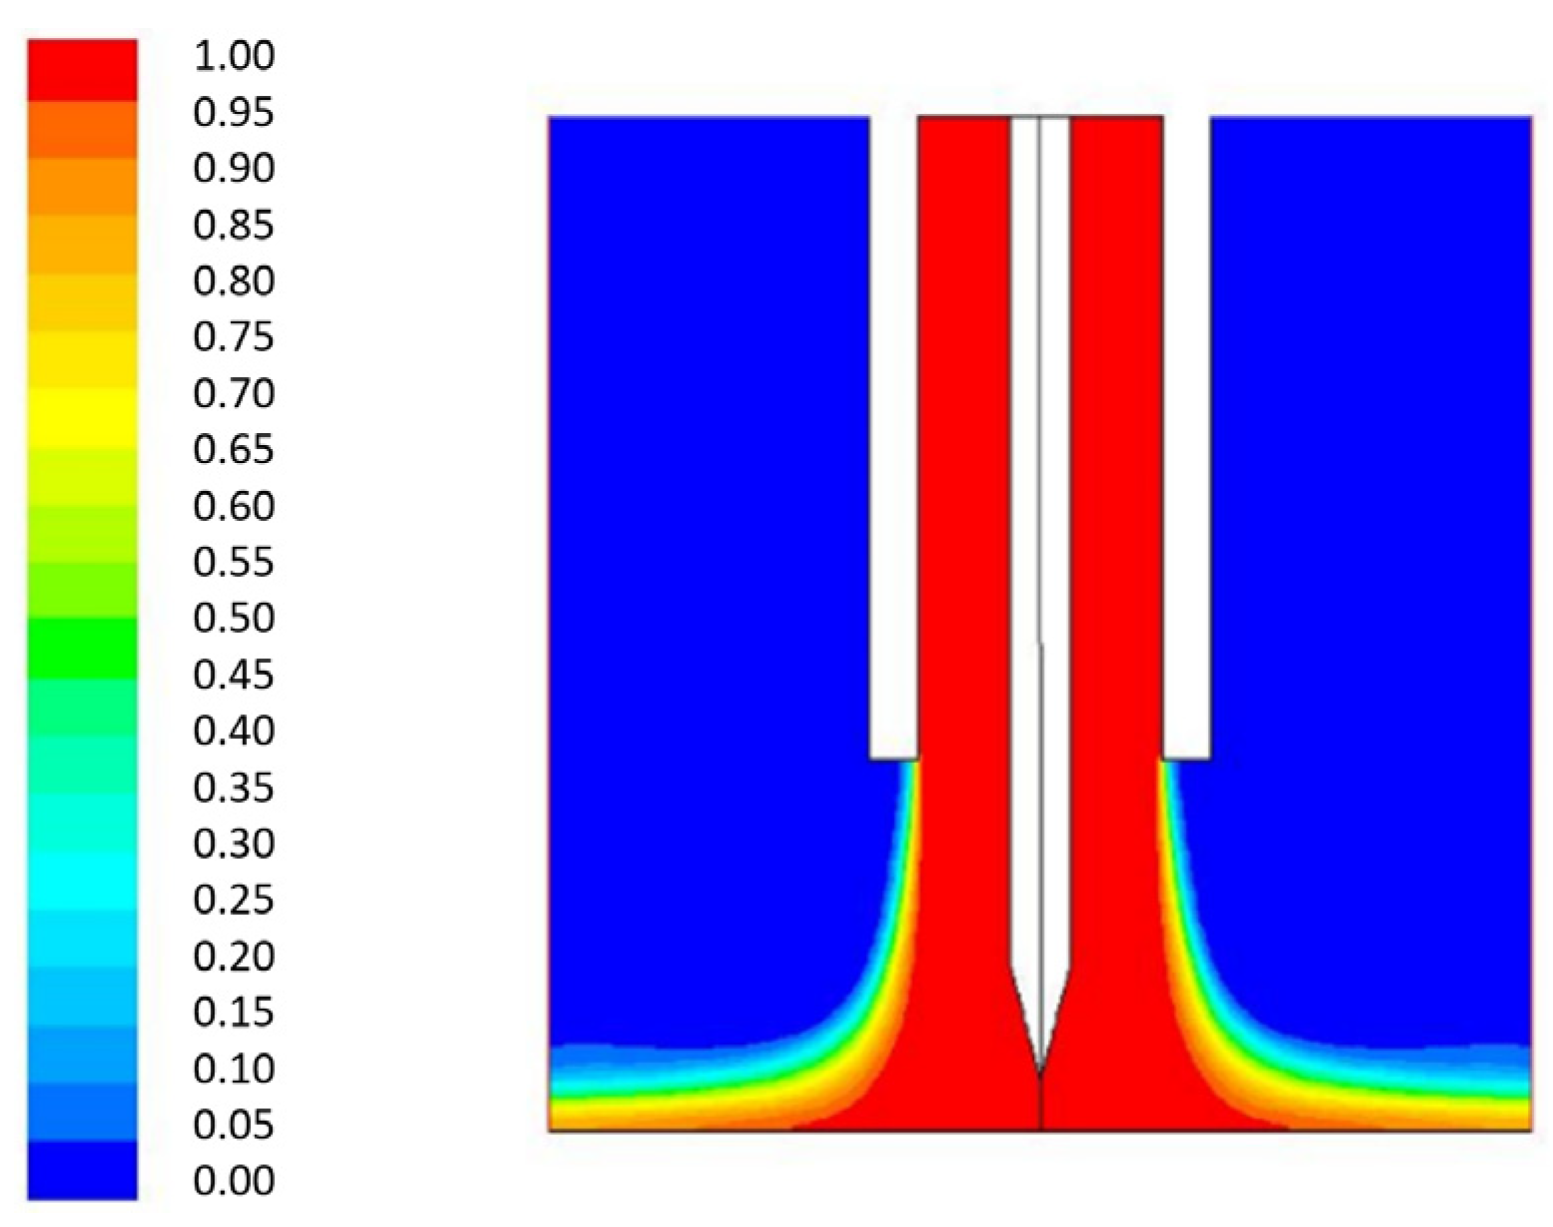
It is well known that the weld quality is strongly dependent on argon protection, and thus on the argon mass fraction, as defined by the ISO 14175:2008 norm [45]. In particular, the weld would show very poor mechanical characteristics (including porosities) without any efficient argon gas protection. Figure 11 shows the computed distribution of the mass fraction of argon plasma represented with colors going from blue (0%) to red (100%). According to this distribution, the arc region seems well protected by the argon gas injected around the cathode, which prevents any interaction between the surrounding air and the plasma in the arc region. Mixing between the argon plasma and the surrounding air occurs in the jet fringes only. The weld is therefore well protected.

4.2. Temperature Distribution

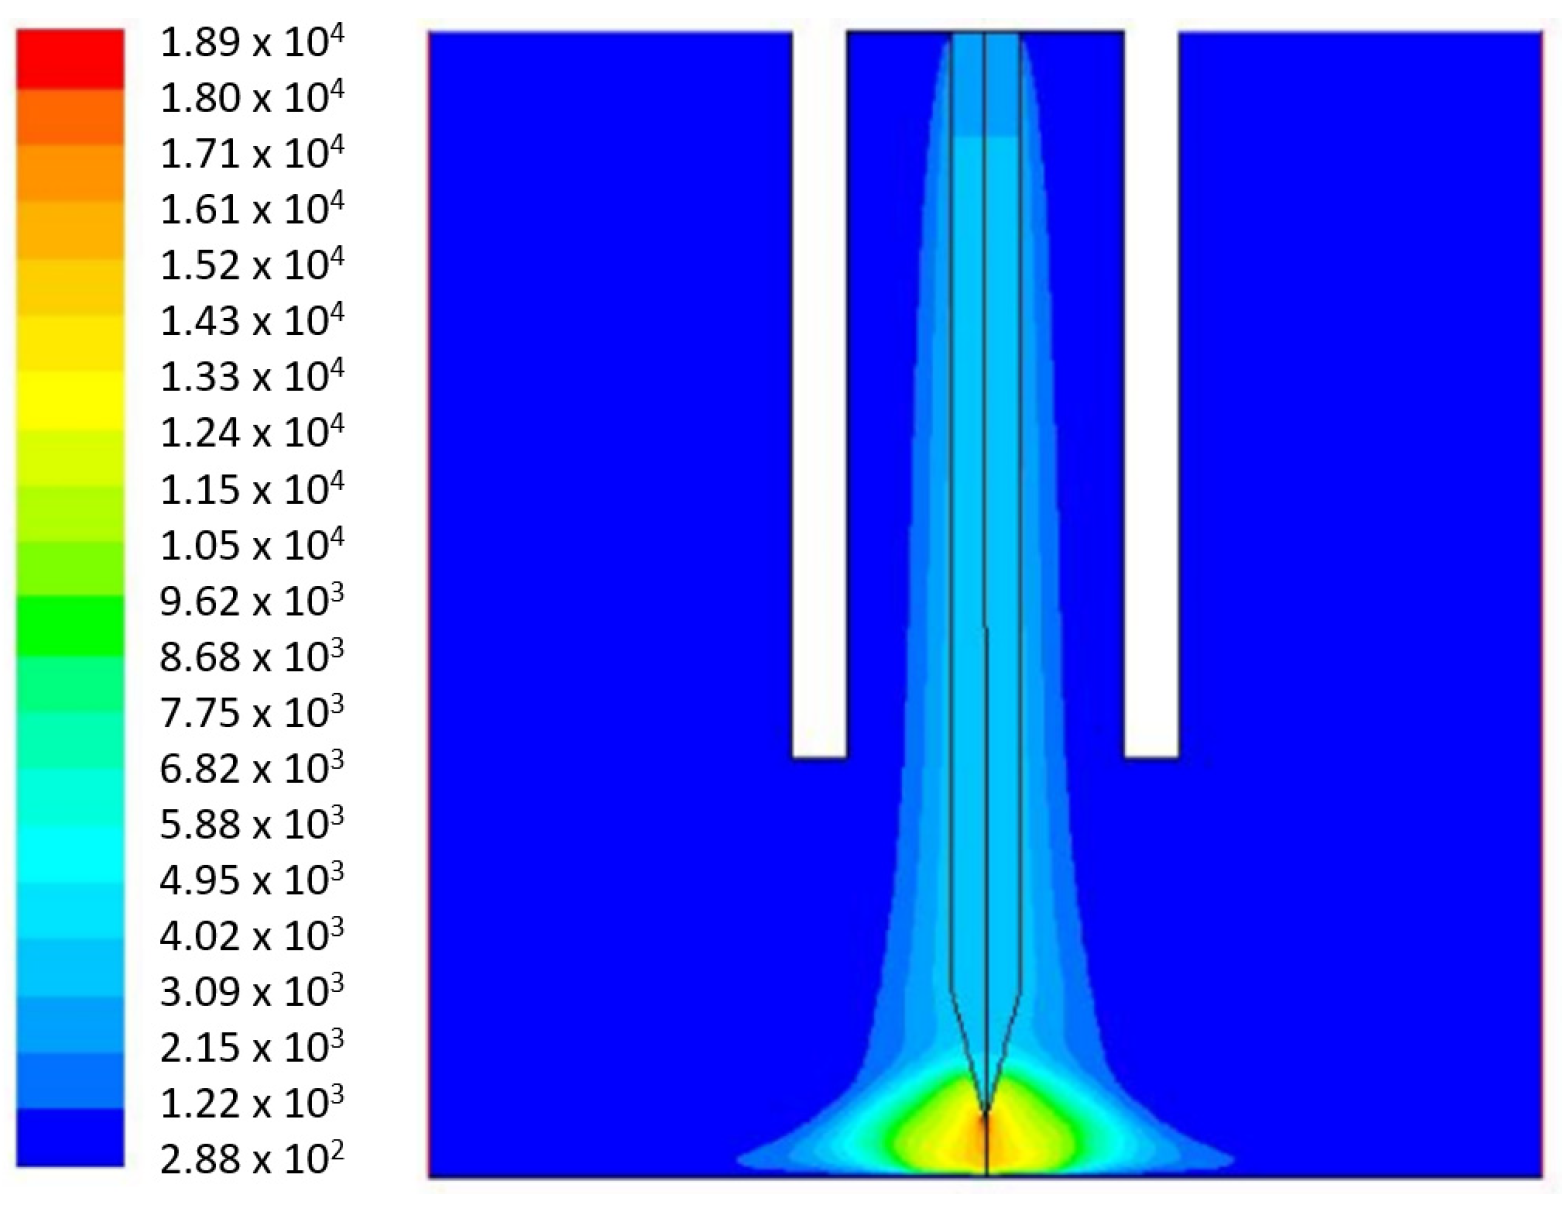
Figure 12 shows the temperature distribution in the weld region. It must be pointed out that the tungsten cathode is part of the computational domain. Lowke et al. [18] calculated a maximum temperature of about 23,000 K at the cathode tip for a current intensity of 200 A, while Tanaka et al. [46] calculated a maximum temperature of 17,000 K at 150 A. Murphy et al. [21] calculated maximum temperatures ranging between 17,000 K (pure argon) and 21,000 K (with H2 and He ratios in the plasma gas) at the cathode tip for 150 A. Yamamoto et al. [19] calculated a maximum temperature of 19,000 K for pure argon at 150 A. Our results are thus consistent with all these results presented. The further away from the vertical axis of welding, the lower the temperature. In addition, the computed temperature of the cathode ranges from 3000 K to 4000 K, which is close to the melting point of tungsten. Finally, the highest computed temperature (18,900 K) is in the close vicinity of the cathode tip.
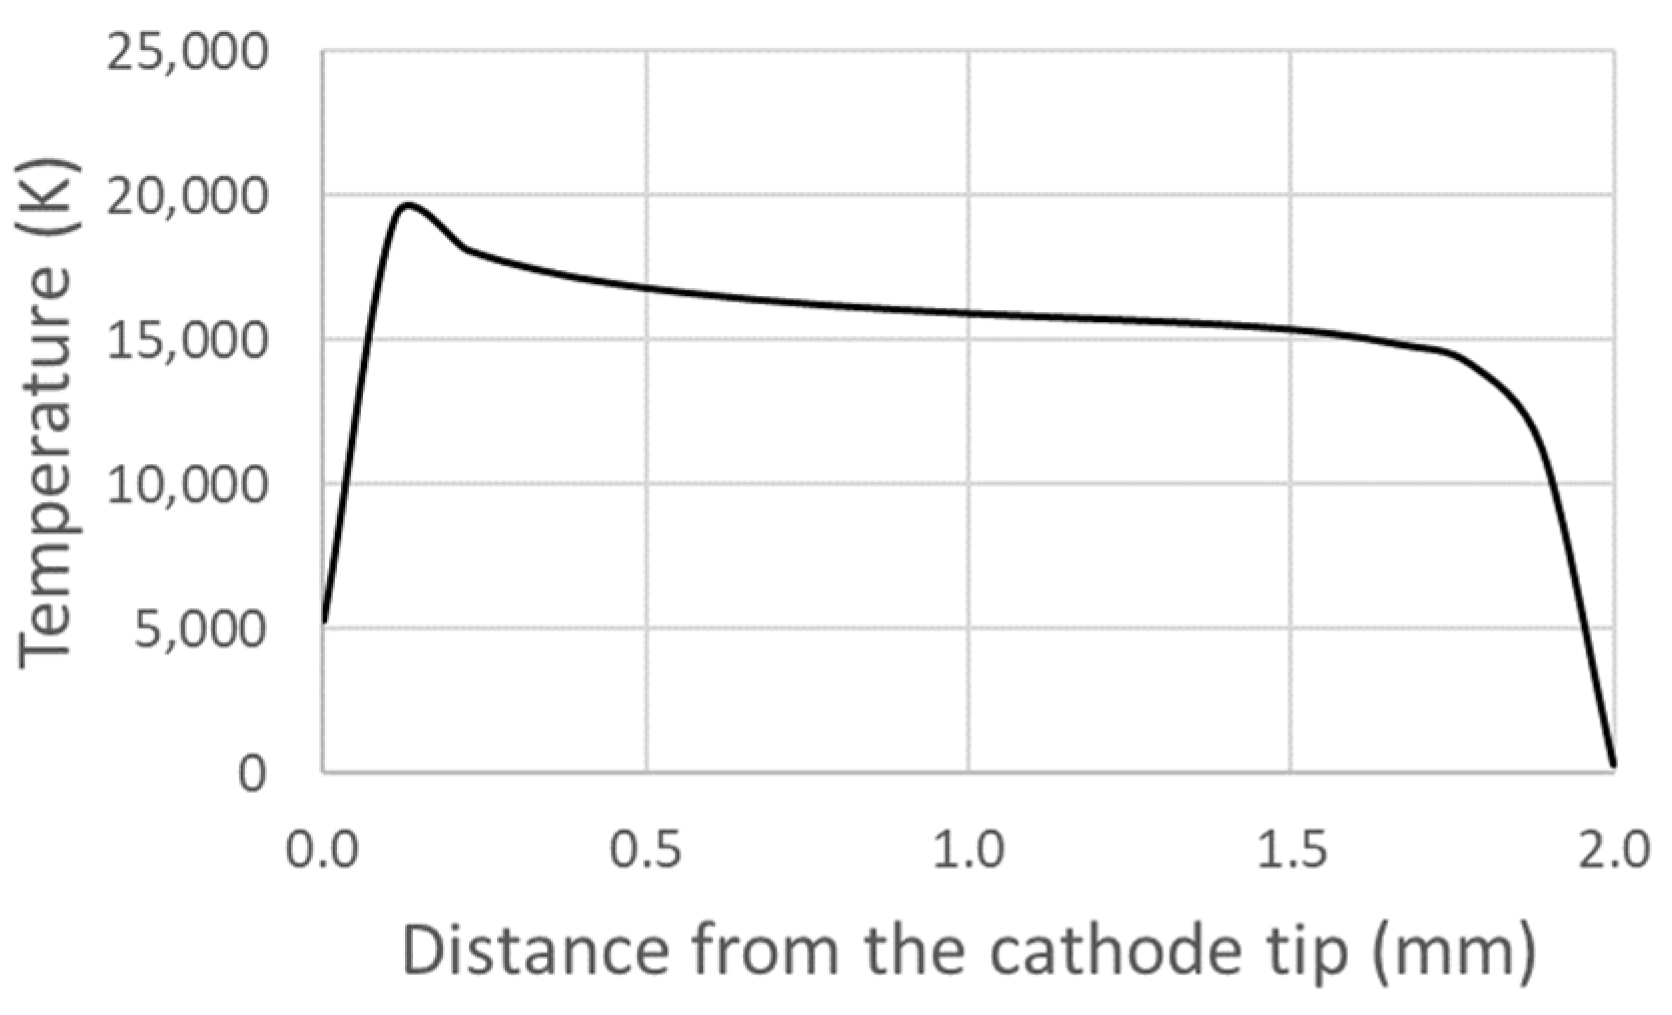
To better understand the temperature distribution near the cathode tip, where strong gradients are observed, the variation in temperature T along the x -axis (symmetrical axis) is presented in Figure 13. A strong increase in the temperature near the cathode tip ( x = 0   m m ) and a fast decrease near the anode ( x = 2   m m ) are observed, while a smoother decrease is noted between these two endpoints. This effect is linked to the strong heating generated to deliver a high temperature over a short distance, resulting in an electrically conductive plasma.

4.3. Velocities, Pressure, and Electric Potential in the Plasma

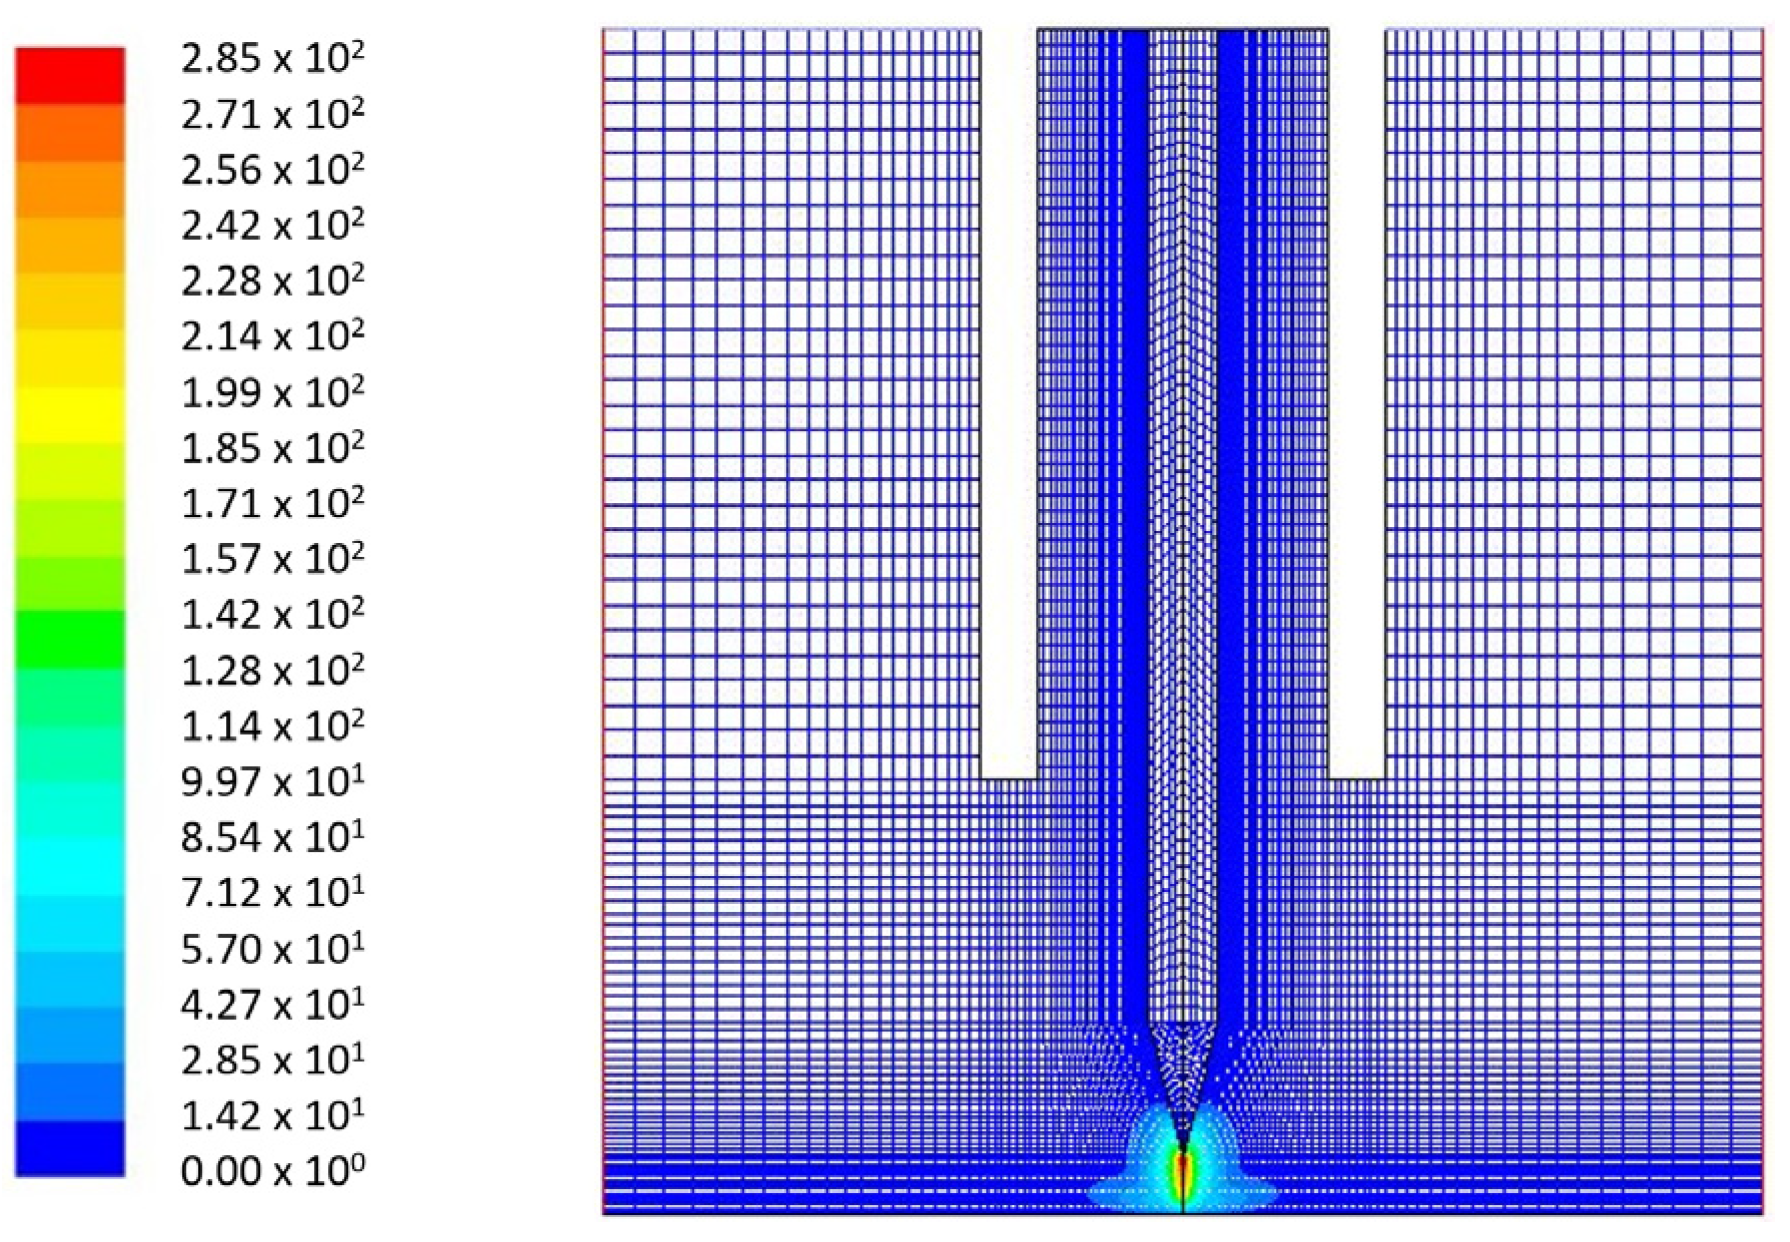
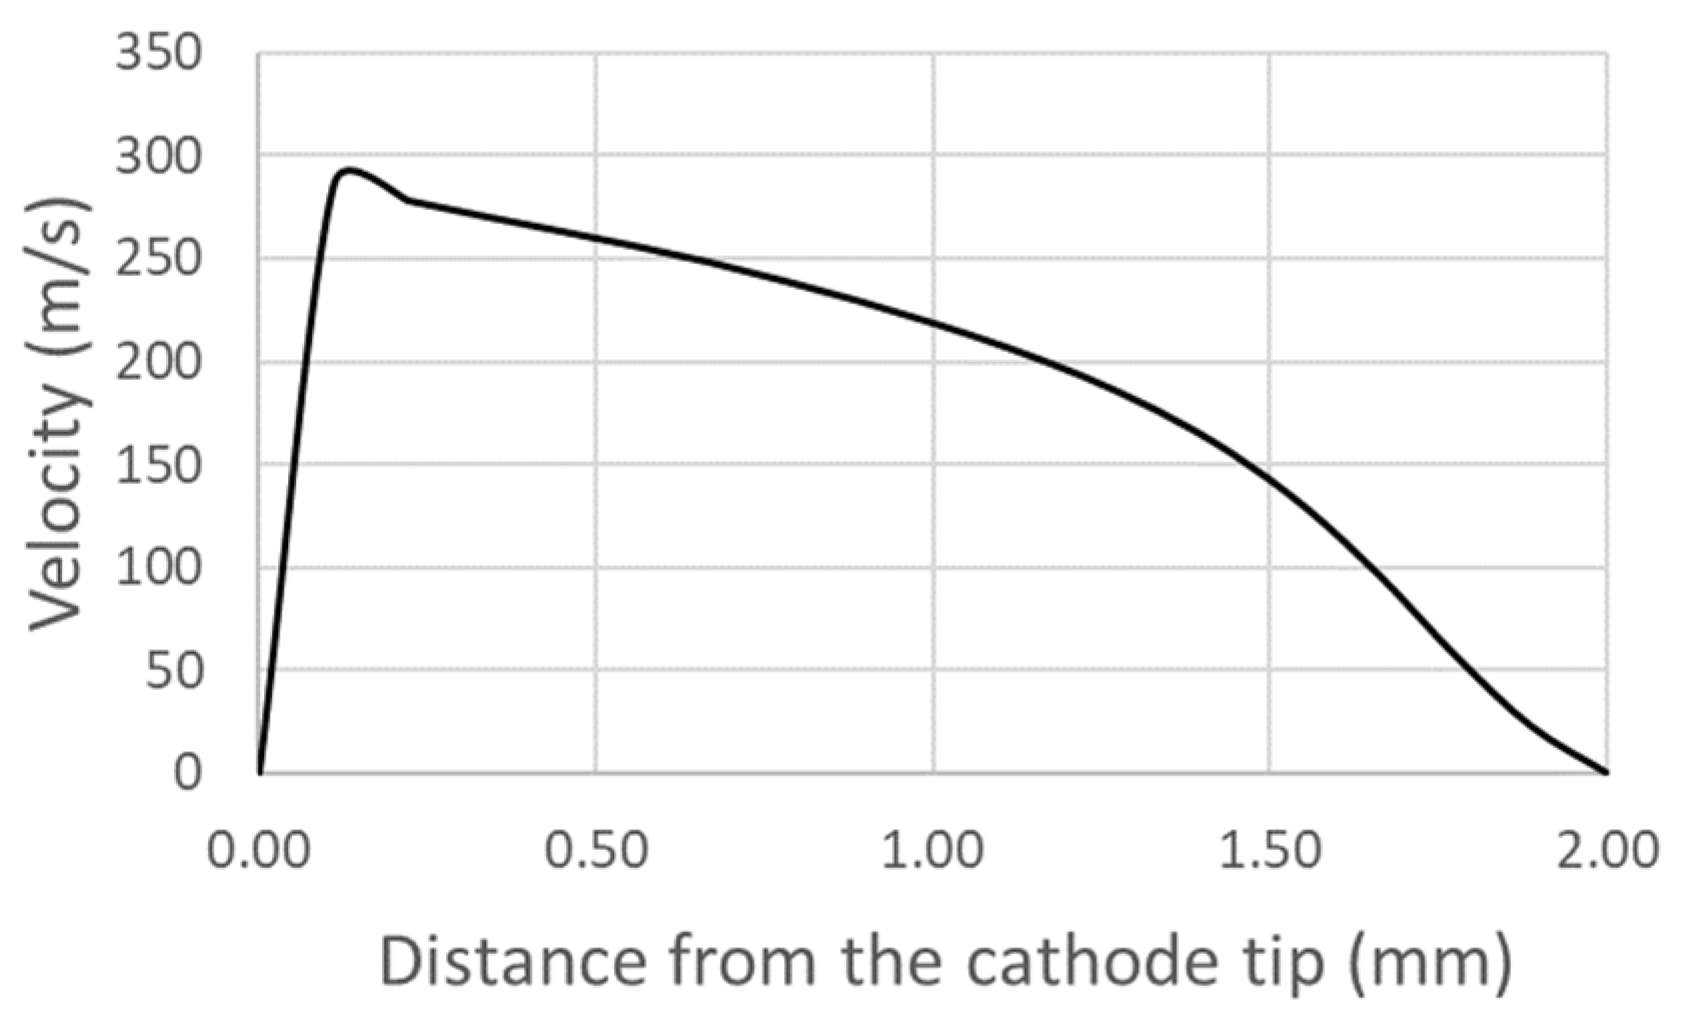
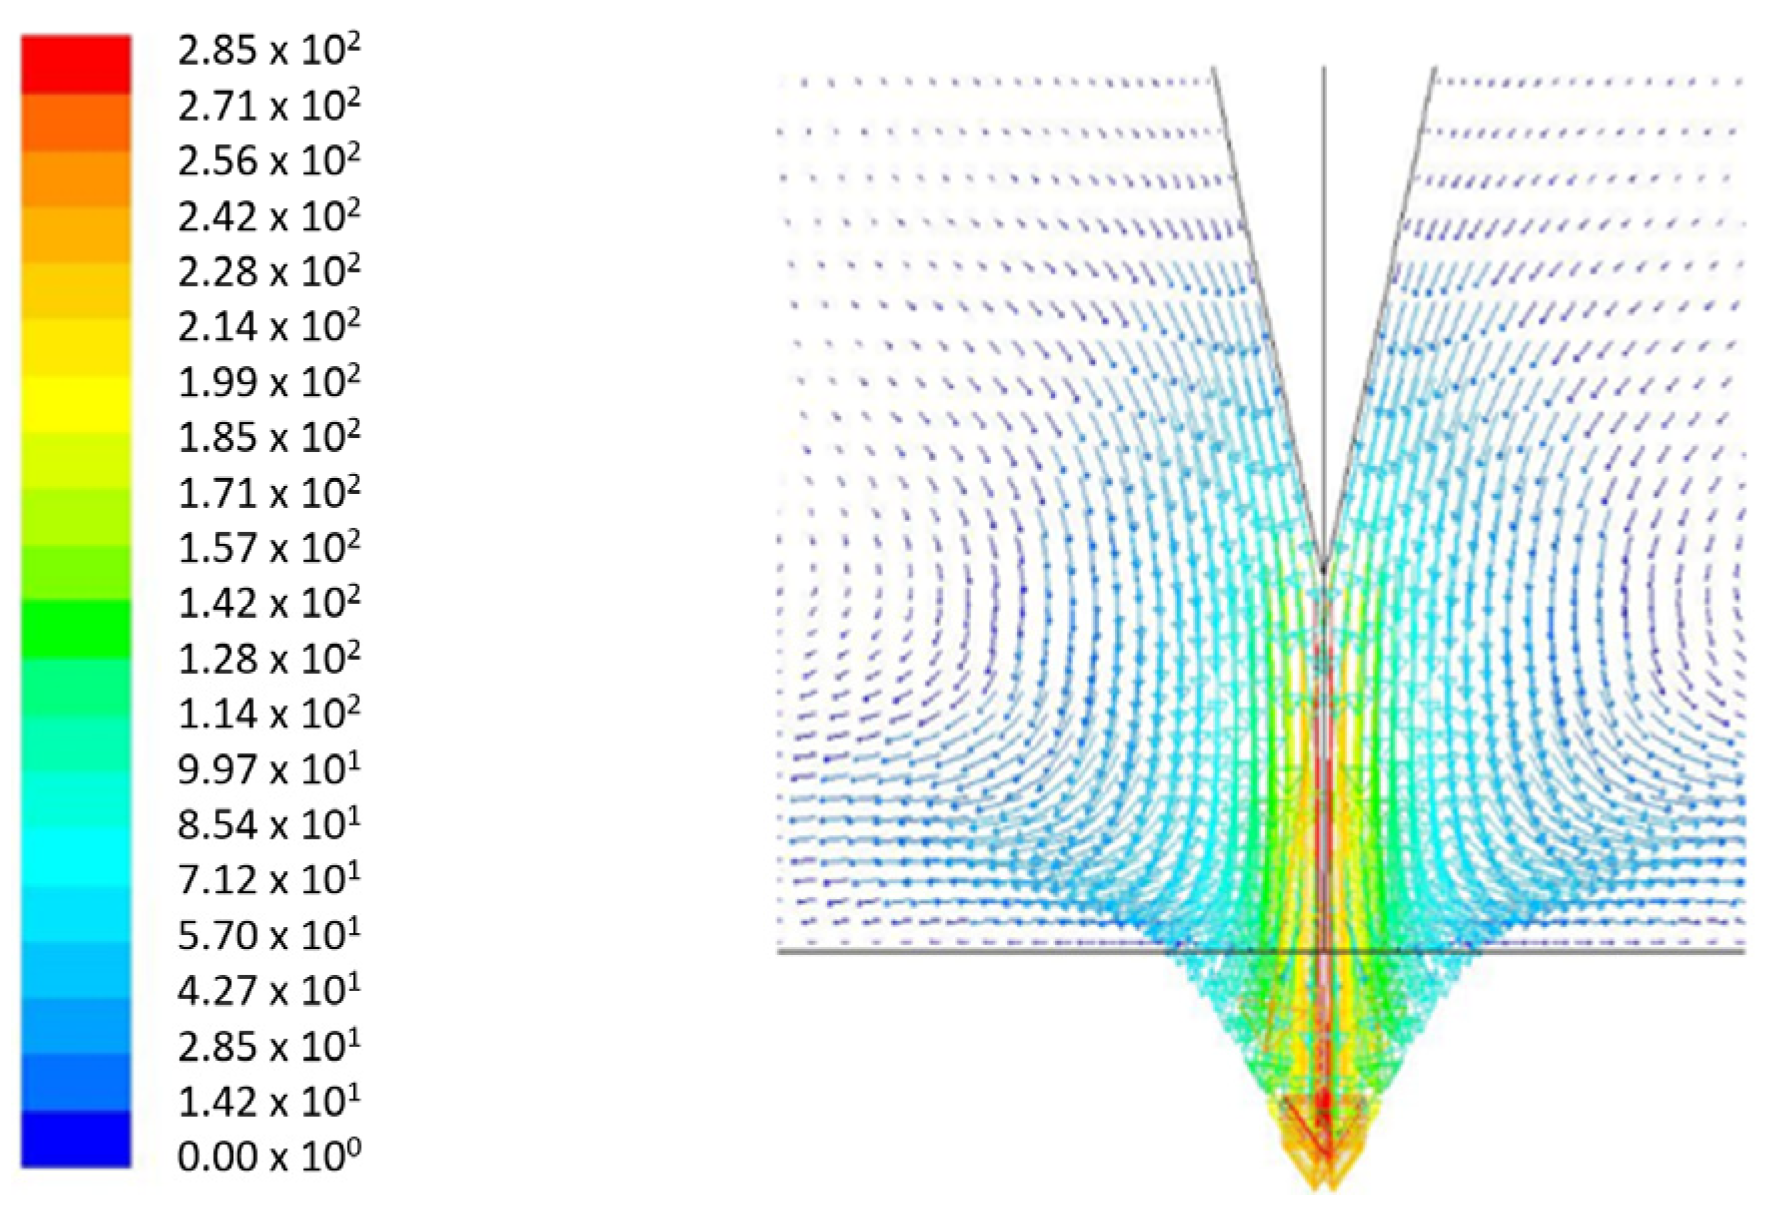
Figure 14 shows the distribution of the velocity magnitude of the fluid in the arc region. The velocity profile along the symmetry axis between the two electrodes is also plotted in Figure 15. It can be observed that the maximum velocity (285 m/s), caused by the strong heating and subsequent dilatation of the plasma, is located near the cathode tip. However, the velocity decreases in the vicinity of the anode. Choo et al. [47] calculated maximum velocities ranging between 150 m/s (100 A) and 390 m/s (300 A) downstream of the cathode tip. Tanaka et al. [46] obtained a maximum velocity of 203 m/s just downstream of the cathode tip at 150 A. The strong acceleration downstream of the cathode tip was also reported in these references.
In Figure 16, a better observation of the velocity vectors is provided by zooming in on the plasma region only. It may be noted that the vectors’ direction is initially oriented towards the anode, with a negative radial component at the cathode tip (i.e., flow tangent to the cathode surface). However, the vectors’ direction changes close to the anode, which tends to form an electromagnetic whirlwind likely caused by Lorentz forces. The behavior of the flow may be explained by magnetic forces acting in the welding arc, which generate a pressure increase at the cathode tip. Hsu et al. [25] already noticed a similar pressure increase at the cathode tip ranging from 400 Pa at 100 A to more than 800 Pa at 200 A. Bolot et al. [32] also noted a similar pressure increase at the cathode tip in the case of a 3D model devoted to the study of a plasma gun used for thermal spray.
Figure 17 shows the computed pressure distribution in the plasma zone, and Figure 18 shows the evolution of pressure along the symmetry axis between the cathode tip and the anode. The maximum pressure downstream of the cathode tip (about 520 Pa) is almost similar to the data reported in [25].
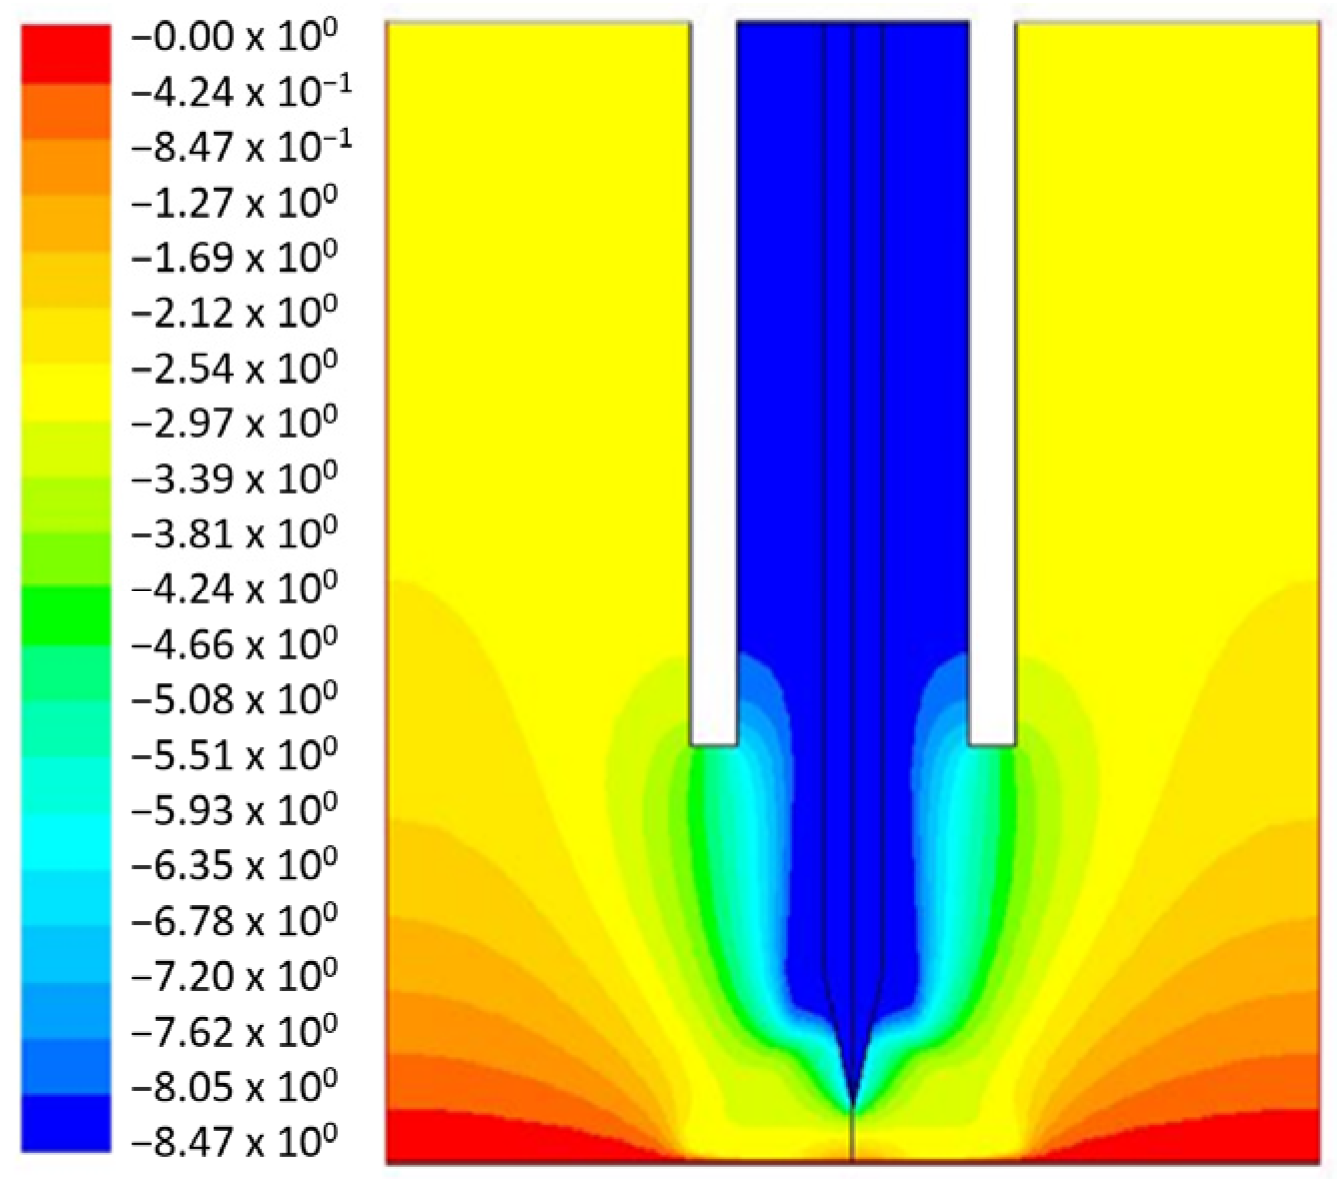
Figure 19 shows the distribution of the electric potential. According to the boundary conditions presented in Table 1, the electric potential is set to zero on the anode wall (red color), and it is automatically adjusted in the domain by the computed voltage drop in the argon plasma, caused by the electric current imposed on the tungsten cathode. The highest electric potential is in the cathode region and around it (−8.47 V). A jump occurs across the ceramic tube, which is not part of the domain.
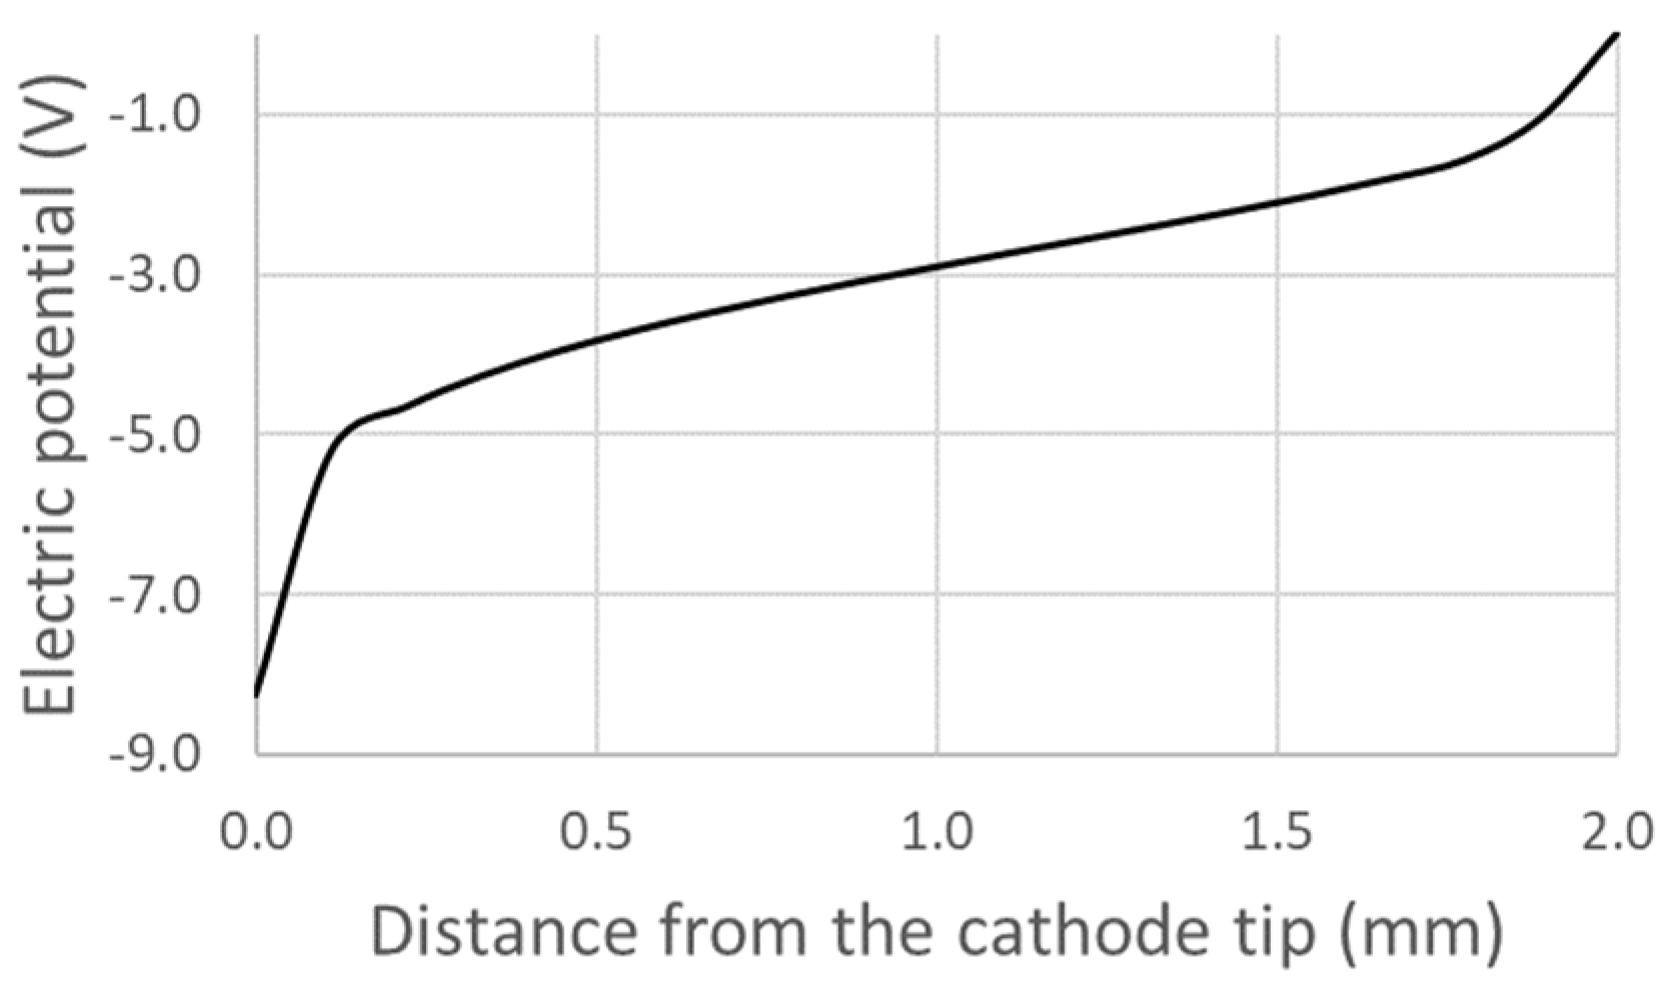
In addition, a voltage drop of 3 V can be observed in Figure 20 at the cathode tip, while a lower voltage drop of about 1 V appears at the anode wall. This behavior is induced by the decrease in the plasma temperature near the cathode and anode walls, giving rise to a decrease in the electric conductibility. Tetyana et al. [48] also suggested a higher voltage drop at the cathode tip compared to that which occurs at the anode surface. Finally, in the transition region (arc column), the electric potential shows a quasi-linear behavior (i.e., almost constant gradient).

4.4. A Parametric Study of the Welding Operating Parameters

The aim of the parametric study was to demonstrate, by comparing our results with those in the literature, that the present model can predict the influence of electric current variation, and that it remains valid for different sets of welding parameters. Three additional current intensities (90, 110, and 120 A) were considered, as well as the gas (argon) flow rate variation (8, 10, and 12 slpm, i.e., defined at 273 K and 100 kPa), corresponding to standard operating conditions. In addition, the range of the inter-electrode distance (between 2 and 4 mm) was considered, for observations of a welding-operator working in real-life conditions. Thirty-six calculations were thus performed using combinations of the parameters presented in Table 2.
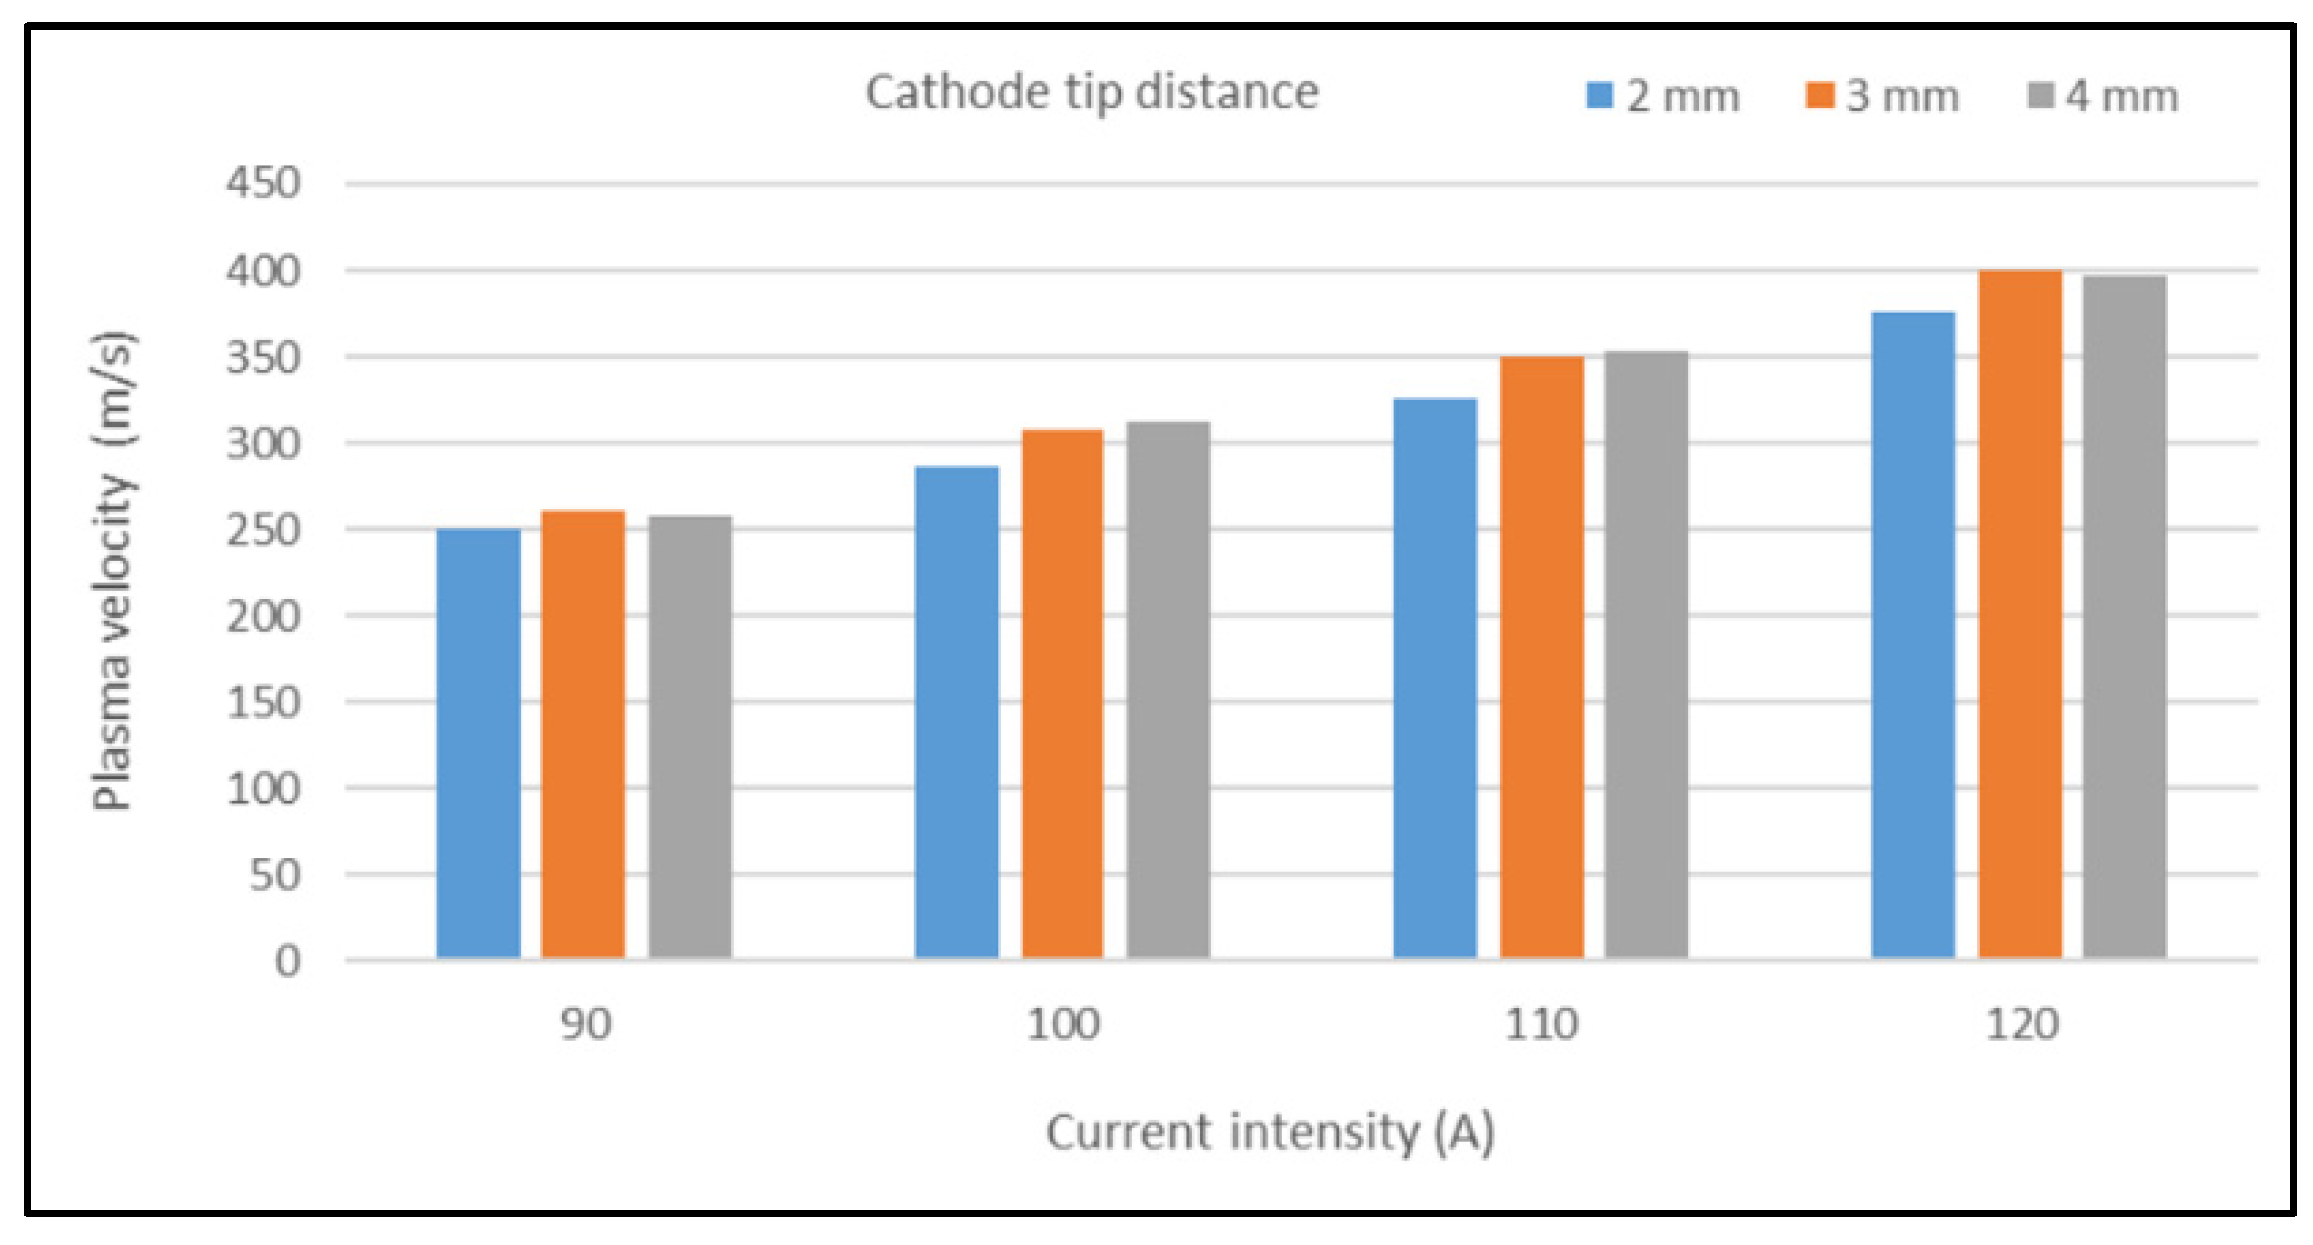
In the considered range, the argon flow rate has a weak influence on the computed results compared to the two other operating parameters (inter-electrode distance and current intensity). Therefore, Figure 21 focuses on the evolution of the maximum velocity in the arc region versus current intensity and cathode tip distance for a gas flow rate of 8 L/min.
The maximum velocity increases with the current intensity and with the distance between electrodes. For a higher distance between the cathode tip and anode, 10 mm, Hsu et al. [25] predicted a maximum velocity of 173 m/s for a current intensity of 100 A. In addition, the maximum velocity was found to increase up to 395 m/s at 300 A and their axial profile of the velocity at 200 A is in line with our results (i.e., strong increase just downstream of the cathode tip). Choo et al. [47] considered the case of a flat cathode in their model (structured mesh) and calculated maximum velocities of 150 m/s at 100 A, increasing up to 400 m/s at 300 A. At 100 A, the maximum calculated temperature was 19,500 K and the corresponding voltage was 12 V. Those results are not consistent with our values. At 100 A, we indeed obtained a velocity almost twice as big (values around 300 m/s). This difference is probably due to the shape of the cathode tip (i.e., flat in the numerical study of Choo et al. [47]). However, the increase in the maximum velocity with the increase in electric current is effective for both tip designs.
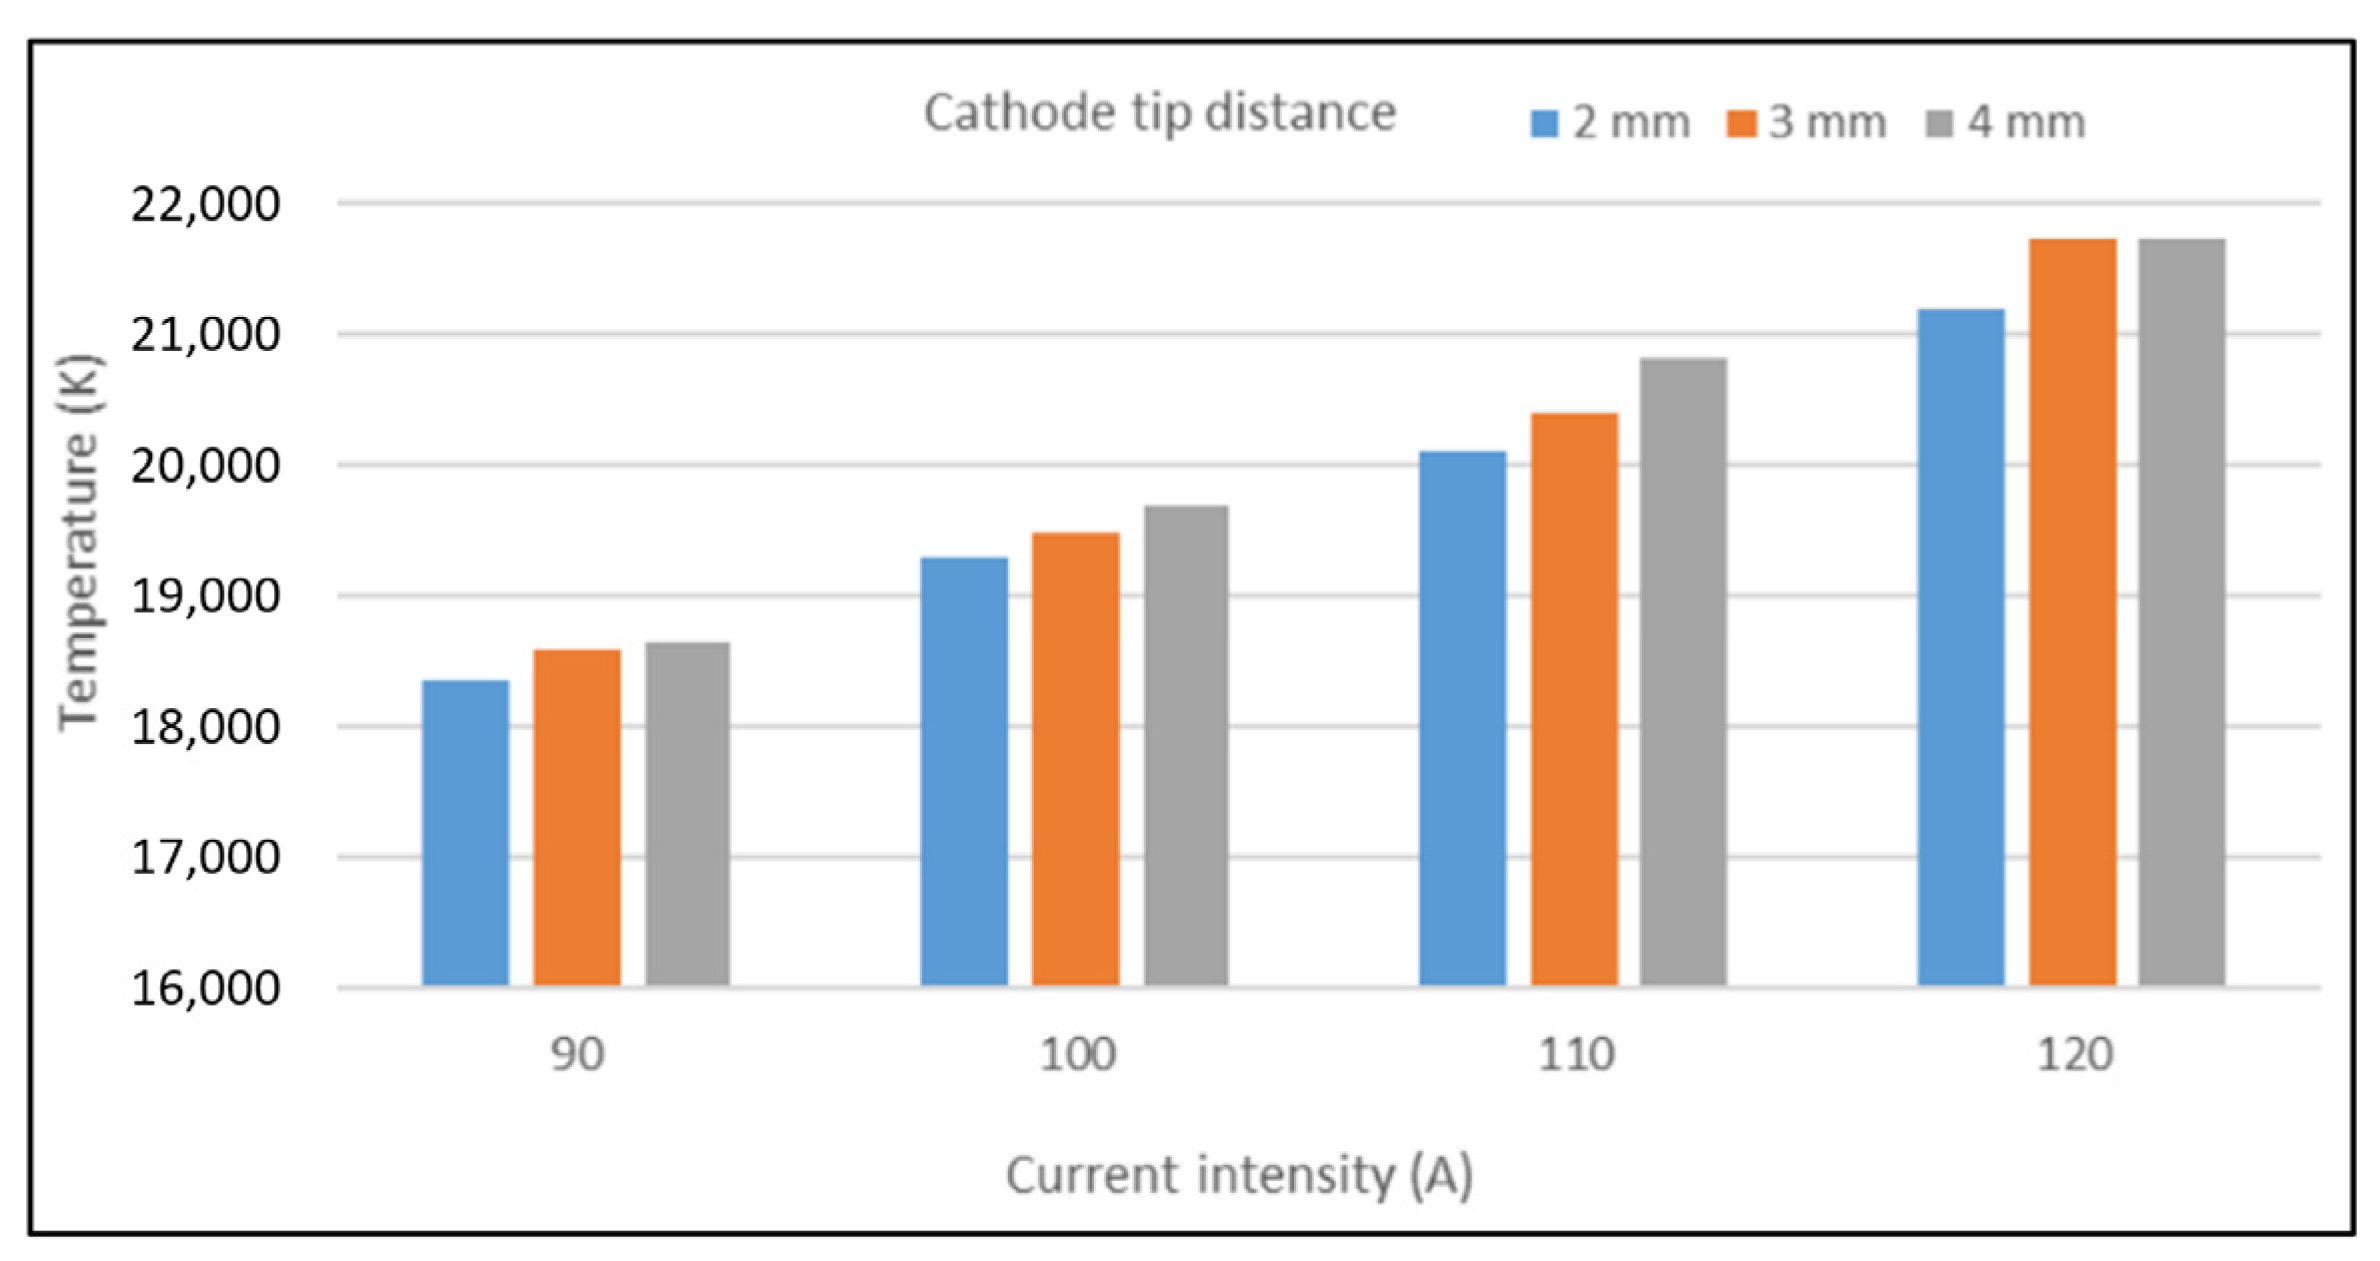
The maximum temperature (Figure 22) increases slightly and linearly with the inter-electrode distance and with the current intensity. Our results are consistent with the temperature range calculated in [25], where an increase in the maximum temperature from 18,000 K at 100 A up to 23,000 K at 300 A was also noticed. Their results were however obtained for a larger cathode tip distance (10 mm). The temperature level calculated by Choo et al. [47] for a flat cathode tip is the same as ours at 100 A (19,500 K).
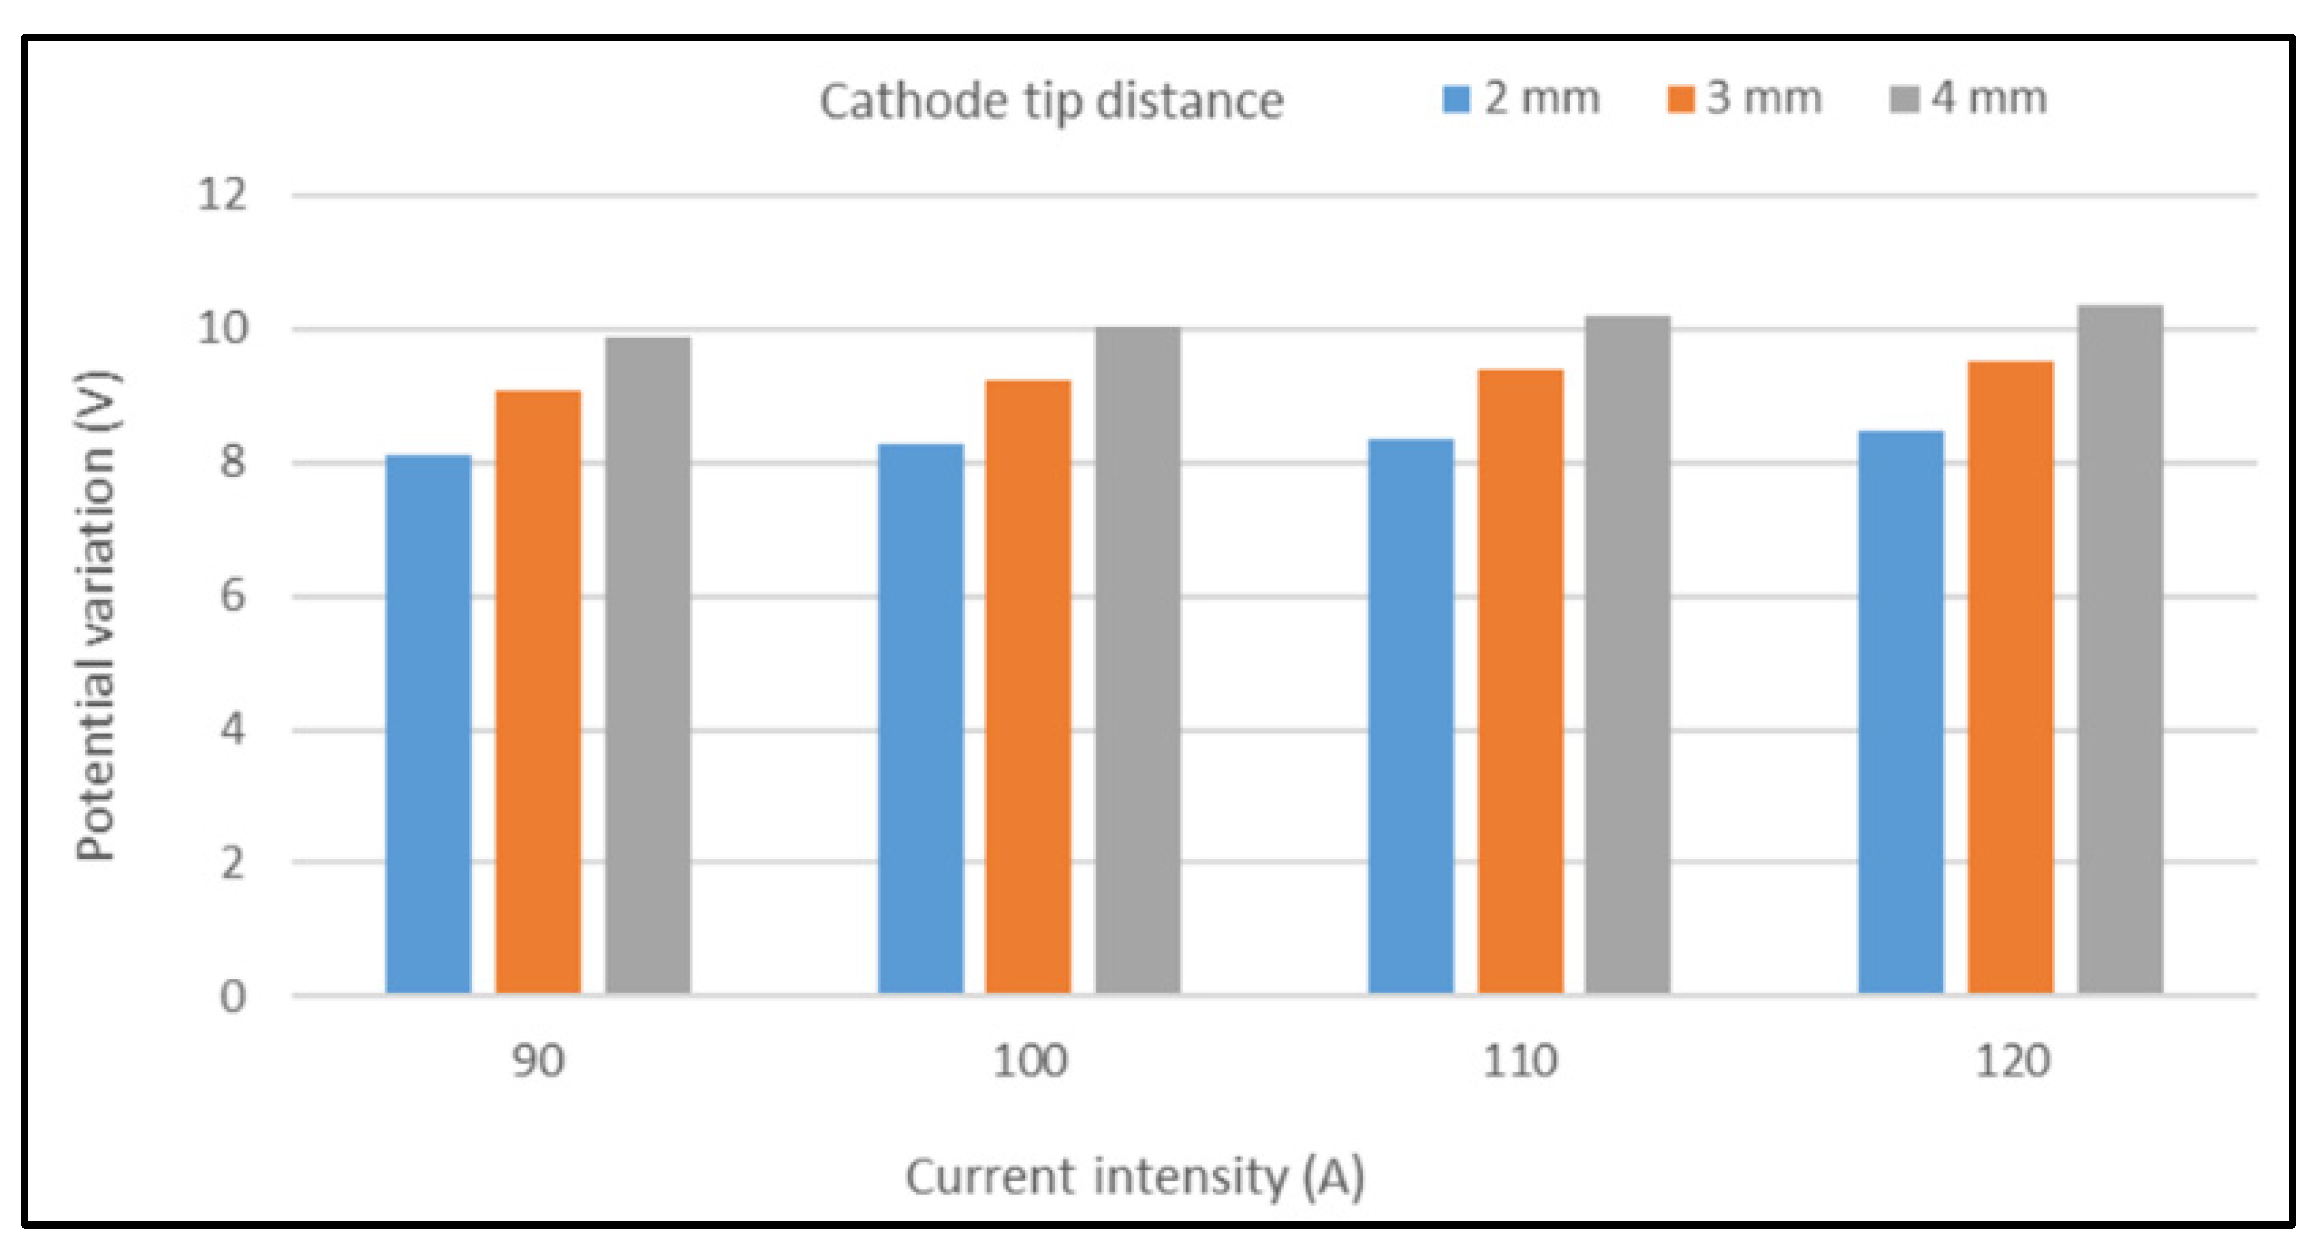
It is finally observed in Figure 23 that the torch voltage increases with the inter-electrode distance. This increase is the same for all four current intensities, i.e., an increase in about 1 V for a 1 mm increase in the inter-electrode distance. On the other hand, the voltage increases only slightly with the current intensity (about 0.4 V for a variation of 30 A). Hsu et al. [25] obtained an increase from 11.2 V at 100 A up to 15.2 V at 300 A for a distance of 10 mm between the two electrodes. Choo et al. [47] predicted an increase from 11.9 V at 100 A up to 16.2 V at 300 A for their higher electrode distance (6.3 mm). Our results obtained for lower distances between electrodes are thus consistent.

5. Conclusions

A two-dimensional axisymmetric finite volume model of the TIG welding arc, allowing electromagnetic couplings with the Navier–Stokes equations, was developed using the FLUENT 16.2 commercial software (Section 3.3). For this, two conservation equations were added for the axial component of the magnetic potential vector and for the electric potential. All developments related to these coupling equations (Section 3.1) were coded in C language thanks to user-defined functions (UDFs), and these UDF routines were then plugged into the FLUENT software (see, for example, in the Appendix A).
This model differs from those conventionally considered in the literature, and the main advancements are:
-
The two additional coupling equations were solved in both fluid and solid regions, including the cathode as a part of the computational domain;
-
A new method was implemented for linearization of the Joule heating term in the energy conservation equation;
-
This method improves the convergence of the solving procedure (Section 3.2) and makes it possible to attain values closer to the real physical phenomena;
-
This method also allows the arc to be maintained without the need for artificial conductibility anywhere in the domain (especially in near wall regions);
-
Finally, the adopted numerical procedure improves the convergence and stability during the calculation of electromagnetic couplings.
The proposed model aims to simulate transport phenomena occurring during TIG arc welding. Operating parameters (such as electric current intensity, flow rate of the protective gas, and distance between the cathode tip and anode wall) can be monitored by adjusting the boundary conditions and extending of the calculation domain.
Our model was validated by numerous numerical examples related to the argon plasma mass fraction (Section 4.1), temperature distribution (Section 4.2), velocity fields, pressure, and electric potential in the plasma (Section 4.3). Finally, a parametric study of the influence of the welding operating parameters was presented (Section 4.4). We therefore developed a reliable model for designing and optimizing welding processes.

Author Contributions

T.T. and R.B. carried out the numerical simulations. All authors worked on the design of the research project. All authors participated in the analysis of the results and in the paper redaction. All authors have read and agreed to the published version of the manuscript.

Funding

This research received no external funding.

Data Availability Statement

The original contributions presented in this study are included in the Appendix A of the article, and further inquiries can be directed to the corresponding author/s.

Conflicts of Interest

The authors declare no conflicts of interest.

Appendix A

This appendix provides the UDF for the linearization of the source term in the energy equation:
DEFINE_SOURCE(h1_source, c, t, dS, eqn)
{
 real sigma,t1,Sor,jtot;
 t1=C_T(c,t);
 sigma=esig(t1);
 //Sor=(C_UDSI_G(c,t,E1)[0]*C_UDSI_G(c,t,E1)[0]
 +C_UDSI_G(c,t,E1)[1]*C_UDSI_G(c,t,E1)[1])*sigma;
 jtot=sigma*sqrt(C_UDSI_G(c,t,E1)[0]*C_UDSI_G(c,t,E1)[0]
 +C_UDSI_G(c,t,E1)[1]*C_UDSI_G(c,t,E1)[1]);
 Sor=(jtot*jtot)/sigma;
 Sor=Sor-Qrb(t1);
 dS[eqn] = -(10972./t1)*(jtot/sigma)*(jtot/sigma);
 return Sor;
}

References

  1. Tashiro, S.; Tanaka, M.; Murphy, A.B. Numerical analysis of non-equilibrium plasma property in anode boundary layer of argon Gas Tungsten Arc. Surf. Coat. Technol. 2010, 205, S115–S119. [Google Scholar] [CrossRef]
  2. Dal, M.; Fabbro, R. An overview of the state of art in laser welding simulation. Opt. Laser Technol. 2016, 78, 2–14. [Google Scholar] [CrossRef]
  3. Brickstad, B.; Josefson, B.L. A parametric study of residual stresses in multi-pass butt-welded stainless steel pipes. Int. J. Press. Vessel. Pip. 1998, 75, 11–25. [Google Scholar] [CrossRef]
  4. Capriccioli, A.; Frosi, P. Multipurpose ANSYS FE procedure for welding processes simulation. Fusion Eng. Des. 2009, 84, 546–553. [Google Scholar] [CrossRef]
  5. Mousavi, A.; Miresmaeili, R. Experimental and numerical analyses of residual stress distributions in TIG welding process for 304L stainless steel. J. Mater. Process. Technol. 2008, 208, 383–394. [Google Scholar] [CrossRef]
  6. Lundbäck, A.; Alberg, H.; Henrikson, P. Simulation and validation of TIG-Welding and Post Weld Heat Treatment of an Inconel 718 Plate. In Proceedings of the Seventh International Seminar Numerical Analysis of Weldability, Graz, Austria, 29 September–1 October 2003. [Google Scholar]
  7. Honggang, D.; Hongming, G.; Lin, W. Numerical simulation of fluid flow and temperature field in keyhole double-sided arc welding process on stainless steel. Int. J. Numer. Methods Eng. 2006, 65, 1673–1687. [Google Scholar] [CrossRef]
  8. Zhan, X.; Zhang, Q.; Wang, Q.; Chen, J.; Liu, H.; Wei, Y. Numerical simulation of flow field in the Invar alloy laser-MIG hybrid welding pool based on different heat source models. Int. J. Numer. Methods Heat Fluid Flow 2018, 28, 909–926. [Google Scholar] [CrossRef]
  9. Zhang, D.; Wei, Y.; Zhan, X.; Chen, J.; Li, H.; Wang, Y. Numerical simulation of keyhole behaviors and droplet transfer in laser-MIG hybrid welding of Invar alloy. Int. J. Numer. Methods Heat Fluid Flow 2018, 28, 1974–1993. [Google Scholar] [CrossRef]
  10. Tchoumi, T.; Peyraut, F.; Bolot, R. Influence of the welding speed on the distortion of thin stainless steel plates—Numerical and experimental investigations in the framework of the food industry machines. J. Mater. Process. Technol. 2016, 229, 216–229. [Google Scholar] [CrossRef]
  11. Dupont, J.N.; Marder, A.R. Thermal Efficiency of Arc Welding Processes. Weld. Res. Suppl. 1995, 74, 406s–416s. [Google Scholar]
  12. Lu, S.; Fujii, H.; Nogi, K. Arc ignitability, bead protection and weld shape variations for He–Ar–O2 shielded GTA welding on SUS304 stainless steel. J. Mater. Process. Technol. 2009, 209, 1231–1239. [Google Scholar] [CrossRef]
  13. Arunkumar, V.; Vasudevan, M.; Maduraimuthu, V.; Muthupandi, V. Effect of activated flux on the microstructure and mechanical properties of 9Cr-1Mo steel weld joint. Mater. Manuf. Process. 2012, 27, 1171–1177. [Google Scholar] [CrossRef]
  14. Lin, H.L.; Wu, T.M. Effects of activating flux on weld bead geometry of Inconel 718 alloy TIG welds. Mater. Manuf. Process. 2012, 27, 1457–1461. [Google Scholar] [CrossRef]
  15. Venkatesan, G.; George, J.; Sowmyasri, M.; Muthupandi, V. Effect of Ternary Fluxes on Depth of Penetration in A-TIG Welding of AISI 409 Ferritic Stainless Steel. Procedia Mater. Sci. 2014, 5, 2402–2410. [Google Scholar] [CrossRef]
  16. Dal, M.; Le Masson, P.; Carin, M. A model comparison to predict heat transfer during spot GTA welding. Int. J. Therm. Sci. 2014, 75, 54–64. [Google Scholar] [CrossRef]
  17. Zhu, P.; Lowke, J.J.; Morrow, R. A unified theory of free burning arcs, cathode sheaths and cathodes. J. Phys. D Appl. Phys. 1992, 25, 1221–1230. [Google Scholar] [CrossRef]
  18. Lowke, J.J.; Morrow, R.; Haidar, J. A simplified unified theory of arcs and their electrodes. J. Phys. D Appl. Phys. 1997, 30, 2033–2042. [Google Scholar] [CrossRef]
  19. Yamamoto, K.; Tanaka, M.; Tashiro, S.; Nakata, K.; Yamazaki, K.; Yamamoto, E.; Suzuki, K.; Murphy, A.B. Numerical simulation of metal vapor behavior in arc plasma. Surf. Coat. Technol. 2008, 202, 5302–5305. [Google Scholar] [CrossRef]
  20. Tanaka, M.; Yamamoto, K.; Tashiro, S.; Nakata, K.; Ushio, M.; Yamazaki, K.; Yamamoto, E.; Suzuki, K.; Murphy, A.B.; Lowke, J.J. Metal vapour behavior in gas tungsten arc thermal plasma during welding. Weld. World 2008, 52, 82–88. [Google Scholar] [CrossRef]
  21. Murphy, A.B.; Tanaka, M.; Yamamoto, K.; Tashiro, S.; Lowke, J.J.; Ostriko, V.K. Modelling of arc welding: The importance of including the arc plasma in the computational domain. Vacuum 2010, 85, 579–584. [Google Scholar] [CrossRef]
  22. Mougenot, J.; Gonzalez, J.-J.; Freton, P.; Masquere, M. Plasma–weld pool interaction in tungsten inert-gas configuration. J. Phys. D Appl. Phys. 2013, 46, 135206. [Google Scholar] [CrossRef]
  23. Traidia, A.; Roger, F.; Guyot, E. Optimal parameters for pulsed gas tungsten arc welding in partially and fully penetrated weld pools. Int. J. Therm. Sci. 2010, 49, 1197–1208. [Google Scholar] [CrossRef]
  24. Traidia, A.; Roger, F. Numerical and experimental study of arc and weld pool behaviour for pulsed current GTA welding. Int. J. Heat Mass Transf. 2011, 54, 2163–2179. [Google Scholar] [CrossRef]
  25. Hsu, K.C.; Etemadi, K.; Pfender, E. Study of the free-burning high-intensity argon arc. J. Appl. Phys. 1983, 54, 1293–1301. [Google Scholar] [CrossRef]
  26. Ebrahimi, A.; Kleijn, C.R.; Richardson, I.M. A simulation-based approach to characterise melt-pool oscillations during gas tungsten arc welding. Int. J. Heat Mass Transf. 2021, 164, 120535. [Google Scholar] [CrossRef]
  27. Ebrahimi, A.; Kleijn, C.R.; Hermans, M.J.M.; Richardson, I.M. The effects of process parameters on melt-pool oscillatory behaviour in gas tungsten arc welding. J. Phys. D Appl. Phys. 2021, 54, 275303. [Google Scholar] [CrossRef]
  28. Goodarzi, M.; Choo, R.; Toguri, J.M. The effect of the cathode tip angle on the GTAW arc and weld pool: I. Mathematical model of the arc. J. Phys. D Appl. Phys. 1997, 30, 2744–2756. [Google Scholar] [CrossRef]
  29. Li, L.; Li, B.; Liu, L.; Motoyama, Y. Numerical Modeling of Fluid Flow, Heat Transfer and Arc–Melt Interaction in Tungsten Inert Gas Welding. High Temp. Mater. Proc. 2017, 36, 427–439. [Google Scholar] [CrossRef]
  30. Griem, H.R. Validity of Local Thermal Equilibrium in Plasma Spectroscopy. Phys. Rev. 1963, 131, 1170–1176. [Google Scholar] [CrossRef]
  31. Boulos, M.I.; Fauchais, P.; Pfender, E. Thermal Plasmas: Fundamentals and Applications; Plenum Press: New York, NY, USA, 1994; Volume 1. [Google Scholar]
  32. Bolot, R.; Coddet, C.; Allimant, A.; Billieres, D. Modeling of the Plasma Flow and Anode Region Inside a Direct Current Plasma Gun. J. Therm. Spray Technol. 2011, 20, 21–27. [Google Scholar] [CrossRef]
  33. Nahed, C.; Gounand, S.; Medale, M. A numerical study of the effects of cathode geometry on tungsten inert gas type electric arcs. Int. J. Heat Mass Transf. 2022, 182, 121923. [Google Scholar] [CrossRef]
  34. Bolot, R.; Li, J.; Coddet, C. Some Key Advices for the Modeling of Plasma Jets using FLUENT, Thermal Spray connects: Explore its surfacing potential. In Proceedings of the International Thermal Spray Conference, Basel, Switzerland, 2–4 May 2005. [Google Scholar]
  35. Baudry, C. Contribution à la Modélisation Instationnaire et Tridimensionnelle du Comportement Dynamique de L’arc Dans une Torche de Projection Plasma. Ph.D. Thesis, Université de Limoges, Limoges, France, 2003. [Google Scholar]
  36. Brochard, M. Modèle Couplé Cathode-Plasma-Pièce en Vue de la Simulation du Procédé de Soudage à L’arc TIG. Ph.D. Thesis, IUSTI de L’école Polytechnique Universitaire de Marseille, Marseille, France, 2009. [Google Scholar]
  37. Lancaster, J.F. The Physics of Welding, 2nd ed.; Oxford Pergamon: Oxford, UK, 1986. [Google Scholar]
  38. Lago, F.; Gonzalez, J.J.; Freton, P.; Gleizes, A. A numerical modelling of an electric arc and its interaction with the anode: Part I. The two-dimensional model. J. Phys. D Appl. Phys. 2004, 37, 883–897. [Google Scholar] [CrossRef]
  39. Wilbers, A.T.M.; Beulens, J.J.; Schram, D.C. Radiative energy loss in a two-temperature argon plasma. J. Quant. Spectrosc. Radiat. Transf. 1991, 46, 385–392. [Google Scholar] [CrossRef]
  40. Sanders, N.A.; Pfender, E. Measurement of anode falls and anode heat transfer in atmospheric pressure high intensity arcs. J. Appl. Phys. 1984, 55, 714–722. [Google Scholar] [CrossRef]
  41. Dunn, G.J.; Allemand, C.D.; Eagar, T.W. Metal Vapors in Gas Tungsten Arcs: Part I. Spectroscopy and Monochromatic Photography. Metall. Mater. Trans. A 1986, 17, 1851–1863. [Google Scholar] [CrossRef]
  42. Ushio, M.; Tanaka, M.; Wu, C.S. Analytical Approach to Anode Boundary Layer of Gas Tungsten Arcs. Trans. JWRI 1996, 25, 9–21. [Google Scholar]
  43. Wu, C.S.; Gao, J.Q. Analysis of the heat flux distribution at the anode of a TIG welding arc. Comput. Mater. Sci. 2002, 24, 323–327. [Google Scholar] [CrossRef]
  44. Zhu, P.; Lowke, J.J.; Morrow, R.; Haidar, J. Prediction of anode temperatures of free burning arcs. J. Phys. D Appl. Phys. 1995, 28, 1369–1376. [Google Scholar] [CrossRef]
  45. ISO 14175:2008; Welding Consumables–Gases and Gas Mixtures for Fusion Welding and Allied Processes. ISO: Geneva, Switzerland, 2008.
  46. Tanaka, M.; Terasaki, H.; Ushio, M.; Lowke, J.J. A Unified Numerical Modeling of Stationary Tungsten-Inert-Gas Welding Process. Metall. Mater. Trans. A 2002, 33, 2043–2052. [Google Scholar] [CrossRef]
  47. Choo, R.T.C.; Szekely, J.; Westhoff, R.C. On the Calculation of the Free Surface Temperature of Gas-Tungsten-Arc Weld Pools from First Principles: Part I. Modeling the Welding Arc. Metall. Trans. B 1992, 23, 357–369. [Google Scholar] [CrossRef]
  48. Tetyana, K. Study of Thermal Plasma Jets Generated by DC Arc Plasma Torches Used in Plasma Spraying Applications. Ph.D. Thesis, Charles University in Prague, Faculty of Mathematics and Physics, Prague, Czech Republic, 2006. [Google Scholar]
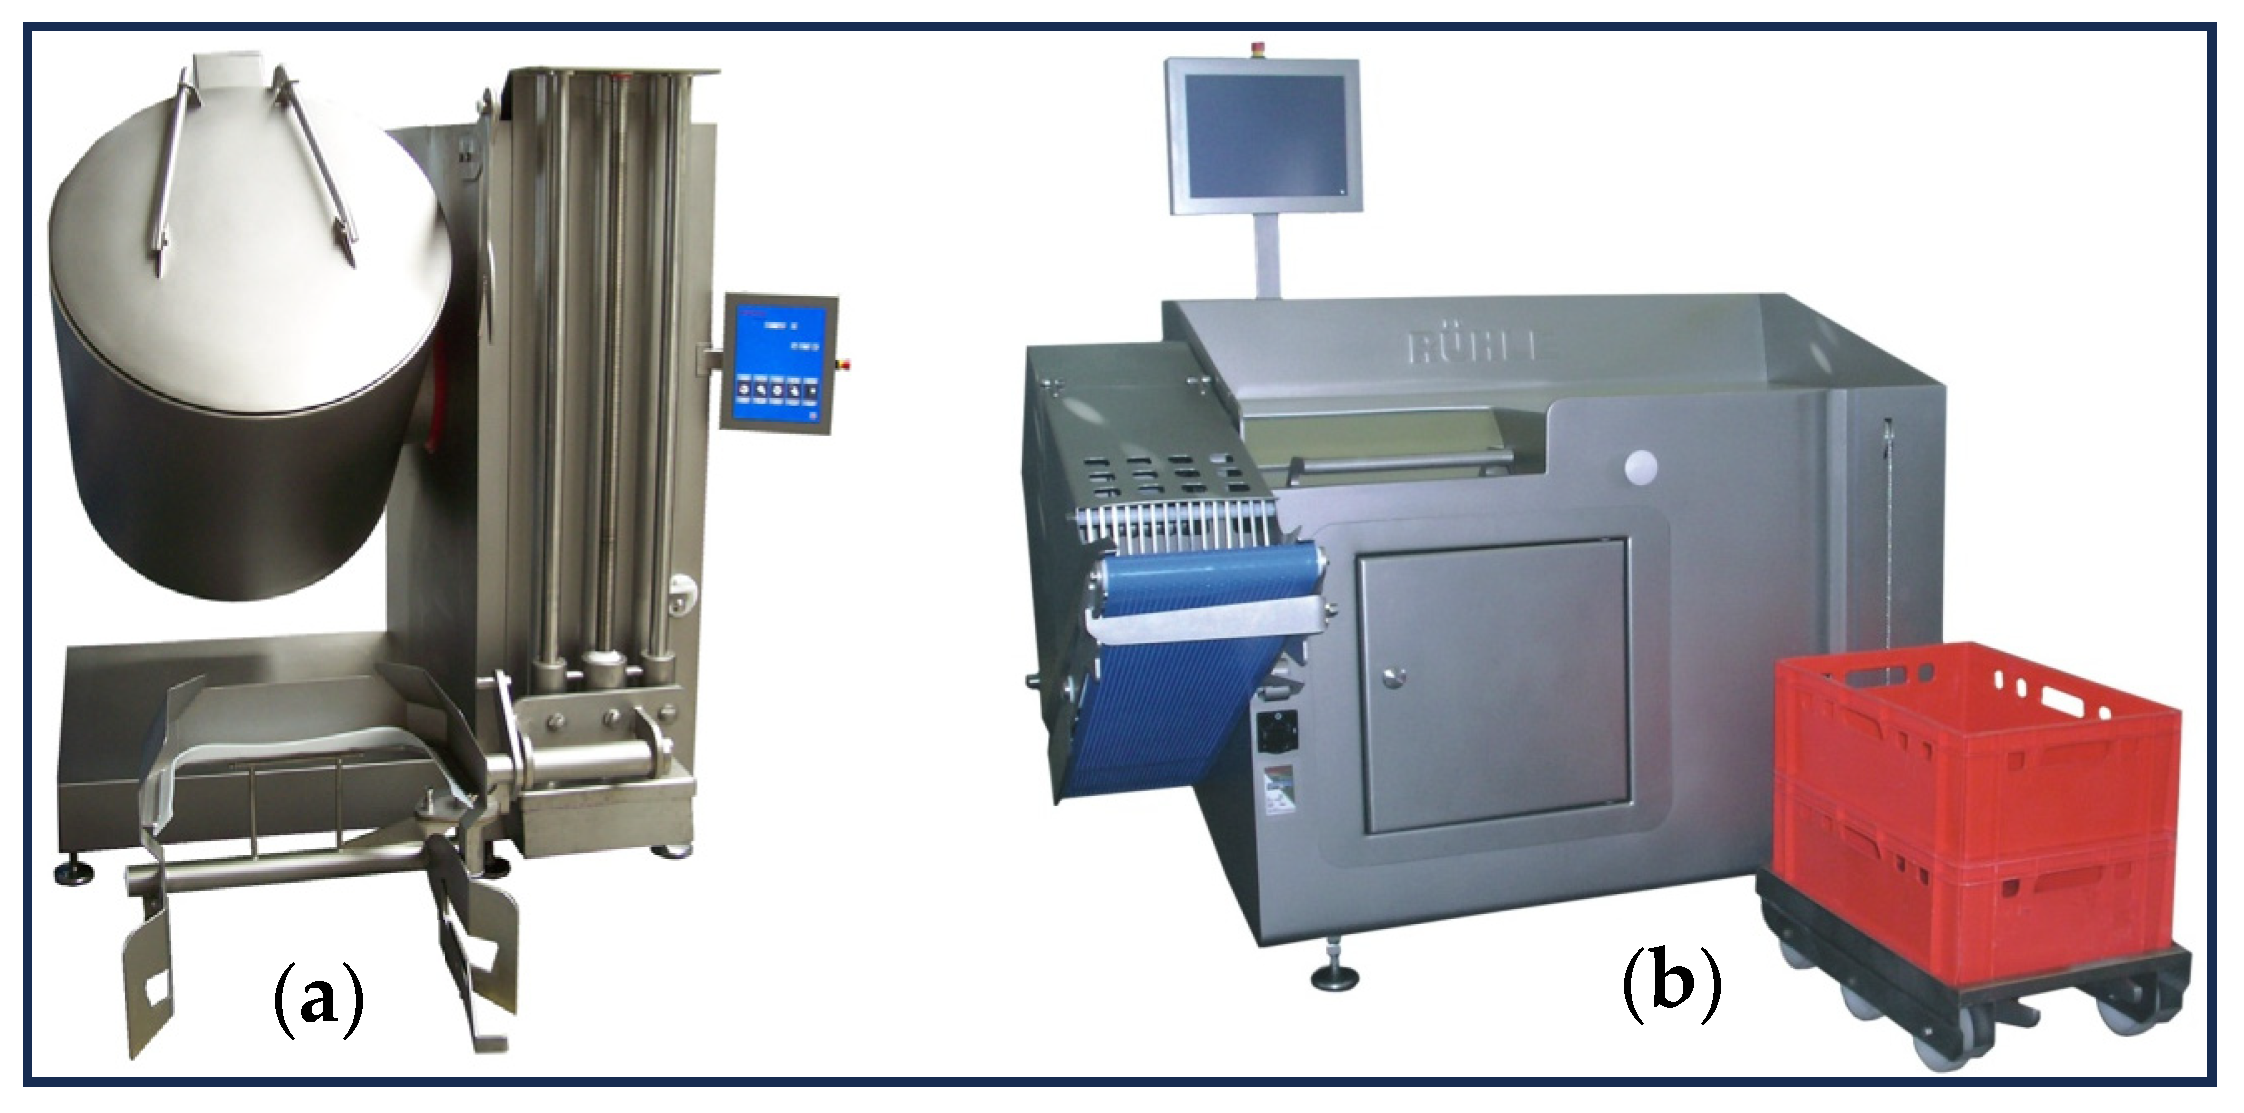
Figure 1. Examples of machines (RÜHLE GmbH): (a) mixing; (b) cutting.
Applmech 05 00008 g001
Figure 2. (a) CAD view of the experimental device; (b) Axisymmetric view of the computational domain.
Applmech 05 00008 g002
Figure 3. Electrical conductibility of argon plasma vs. temperature.
Applmech 05 00008 g003
Figure 4. Dynamic viscosity of an argon plasma vs. temperature.
Applmech 05 00008 g004
Figure 5. Molar mass of an argon plasma vs. temperature.
Applmech 05 00008 g005
Figure 6. Thermal conductivity of an argon plasma vs. temperature.
Applmech 05 00008 g006
Figure 7. Specific heat of an argon plasma vs. temperature.
Applmech 05 00008 g007
Figure 8. Arcing and maintaining of the arc.
Applmech 05 00008 g008
Figure 9. Computational domain.
Applmech 05 00008 g009
Figure 10. Mesh of the electrode region.
Applmech 05 00008 g010
Figure 11. Argon mass fraction Y A r in the plasma (cathode tip region).
Applmech 05 00008 g011
Figure 12. Temperature distribution in the plasma.
Applmech 05 00008 g012
Figure 13. Variation in the temperature along the symmetry axis of the torch between the cathode tip (start position: x = 0   m m ) and the anode wall (end position: x = 2   m m ).
Applmech 05 00008 g013
Figure 14. Distribution of the velocity magnitude in the plasma at the cathode tip.
Applmech 05 00008 g014
Figure 15. Variation in the plasma velocity along the symmetry axis between the cathode tip (start position: x = 0   m m ) and the anode wall (end position: x = 2   m m ).
Applmech 05 00008 g015
Figure 16. Zoom on the plasma velocity vectors (region of the cathode tip and anode wall).
Applmech 05 00008 g016
Figure 17. Pressure distribution in the plasma (cathode tip region).
Applmech 05 00008 g017
Figure 18. Variation in the local pressure along the symmetry axis between the cathode tip (start position: x = 0   m m ) and the anode wall (end position: x = 2   m m ).
Applmech 05 00008 g018
Figure 19. Electric potential distribution in the plasma (I = 100 A).
Applmech 05 00008 g019
Figure 20. Variation in the electric potential along the symmetry axis between the cathode tip (start position: x = 0   m m ) and the anode wall (end position: x = 2   m m ).
Applmech 05 00008 g020
Figure 21. Influence of parameters (arc current intensity and inter-electrode distance) on the predicted maximum velocity.
Applmech 05 00008 g021
Figure 22. Influence of parameters (arc current intensity and inter-electrode distance) on the maximum temperature.
Applmech 05 00008 g022
Figure 23. Influence of parameter (arc current intensity and inter-electrode distance) on the electrical potential difference.
Applmech 05 00008 g023
Table 1. Boundary conditions along the lines defined by letters in Figure 9.
Plasma: (AB)Anode: (BC)Ambient Air: (CE) and (HE)Gas Inlet: (GF)Cathode Inlet: (OG)Cathode Tip: (AI)
u : axial plasma velocity u r = 0 0 u r = 0 Q m ρ A u n = 0
v :   radial plasma velocity 0 0 v r = 0 0 v n = 0
T : temperature T r = 0 288 K288 K if incoming288 K T n = 0 Solid-fluid coupling
ϕ : electric potential ϕ r = 0 0 ϕ r = 0 ϕ x = 0 ϕ n = j σ = I σ S Solid-fluid coupling
A x : axial component of the magnetic potential vector A x r = 0 A x x = 0 A x n = 0 0 A x x = 0 Solid-fluid coupling
Y A r : argon mass fraction Y A r r = 0 Y A r x = 0 0 if incoming 1 Y A r n = 0
Table 2. List of parameter sets.
Inter-Electrode DistanceCurrent Intensity
90 A100 A110 A120 A
2 mm8 L/min8 L/min8 L/min8 L/min
10 L/min10 L/min10 L/min10 L/min
12 L/min12 L/min12 L/min12 L/min
3 mm8 L/min8 L/min8 L/min8 L/min
10 L/min10 L/min10 L/min10 L/minArgon flow rate
12 L/min12 L/min12 L/min12 L/min
4 mm8 L/min8 L/min8 L/min8 L/min
10 L/min10 L/min10 L/min10 L/min
12 L/min12 L/min12 L/min12 L/min
Disclaimer/Publisher’s Note: The statements, opinions and data contained in all publications are solely those of the individual author(s) and contributor(s) and not of MDPI and/or the editor(s). MDPI and/or the editor(s) disclaim responsibility for any injury to people or property resulting from any ideas, methods, instructions or products referred to in the content.