1. Introduction
For highly advanced crash-absorbing structures such as crash boxes in modern racing cars, reinforced materials, particularly unidirectional glass-fiber-reinforced plastics (GFRPs), are often used. Similarly, advanced guardrails, also called crash barriers, which are safety devices installed along roads and highways to prevent vehicles from leaving the roadway or colliding with dangerous obstacles, can be made of GFRPs. They are used to redirect or absorb the vehicle’s impact energy to reduce the severity of accidents and to protect both the vehicle’s occupants and other road users. Up to now, crash barriers have typically been made of sturdy materials such as steel or concrete. They are strategically placed in areas of increased accident risk, such as sharp curves, bridges, or steep slopes.
The choice of the crash barrier material depends on several factors, including the desired level of protection, cost, and environmental considerations. Steel crash barriers are widespread and often found on country roads, see
Figure 1. Steel is commonly used for crash barriers due to its high strength and durability. It can effectively absorb and dissipate energy during an impact, reducing the severity of the impact. Steel crash barriers are often galvanized to increase their corrosion resistance and durability. Concrete crash barriers are used on highways and other high-speed roads. They usually consist of precast reinforced concrete elements joining a continuous barrier and provide excellent protection against vehicle intrusion and high-impact forces. Composite materials, such as fiber-reinforced polymers, are becoming increasingly popular in crash barrier applications because they offer a combination of high strength, being lightweight, and corrosion resistance. The specific choice of crash barrier material depends on the project’s specific requirements, including the desired level of protection, budget constraints, and local regulations.
Since most fatal accidents occur on country roads, it is reasonable to use high-quality GFRP materials here. Furthermore, hybrid constructions are particularly desirable for cost reasons, i.e., constructions made of a steel and GFRP combination. To design such structures that protect against car impact, strain-rate-dependent material data for GFRPs are needed. That motivated us to investigate GFRPs at high strain rates of up to 700/s in this work.
For the impact experiments of our GFRP specimens, we use the split Hopkinson pressure bar (SHPB). The SHPB is a common experimental device for determining the dynamic material properties under moderate and high strain rates [
1,
2]. Hereby, the strain rate
is a measure of how quickly the material is compressed or stretched, i.e., it quantifies the change of strain
per unit of time (1/s). Knowing the response helps us to understand and predict the behavior of materials under a high-speed impact, allowing for the design and optimization of structures and materials that can withstand such loading conditions.
Several authors have already studied the dynamic behavior of GFRP materials, e.g., [
3,
4,
5,
6,
7,
8,
9]. Most investigations focused on the failure modes and strengths at higher strain rates. While [
3] concentrated on the effect of different fiber orientations, the works [
8,
9] only present experiments on a specimen with fiber orientation in the loading direction. An increase in Young’s modulus was found. Different fiber volume fractions in their samples were considered in [
9]. An increasing stress–strain curve was also observed by [
4] by raising the strain rates for different fiber volume fractions during the tests. In [
6], specimens similar to ours in terms of fiber volume fraction were tested. They noticed an increase in Young’s modulus with an increasing strain rate for both parallel and orthogonal fiber orientation. Paper [
7] deals with investigating the compressive impact properties of GFRP utilizing a servohydraulic apparatus. This method allows experiments to be performed at medium strain rates (up to approx. 100/s). The authors specify a dynamic Young’s modulus
in their work. Since all investigated GFRP materials differ concerning the matrix material and the fiber material and its volume fraction, the comparability of experimental data is difficult. Here, we present the data collected from the literature and compare them to our results in our discussion.
Polymeric material behavior usually has a strong dependence on the strain rate. Thus, knowledge gained from the classic tensile tests can only be used to a limited extent to design materials subjected to impact loads. Typically, vehicles crash into the guardrails at speeds of 50 to 100 km/h, which results in strain rates of about 500/s. Therefore, we investigate three different strain rates in this range to characterize the dynamic behavior of GFRPs. From the results, an effective rate-dependent material model is derived. To our knowledge, such detailed information on GFRP materials has not yet been given.
The remainder of the paper is organized as follows: In
Section 2, the experimental setup of the SHPB, as well as the specimen design and its material components, are described. Our specimens have two configurations that differ in the orientation of their fibers, namely parallel and orthogonal to the loading direction (GFRP ‖, GFRP ⊥).
Section 3 presents the dynamic experiments performed on the GFRP specimens. Strain rates of up to 700/s are evaluated. In
Section 4, we derive a constitutive model for time dependency of the elastic modulus. A comparison with other works on GFRP is given in
Section 5, and
Section 6 provides the conclusion.
2. Specimen and Experimental Setup
The specimens were cut from unidirectional GFRP plates. To manufacture such plates, the raw material of the unidirectional GFRP was available as tape. It consisted of an epoxy resin matrix and glass fibers with a diameter of 20 μm, while the plate’s fiber volume fraction
reached 58%. The tape material was provided by the company
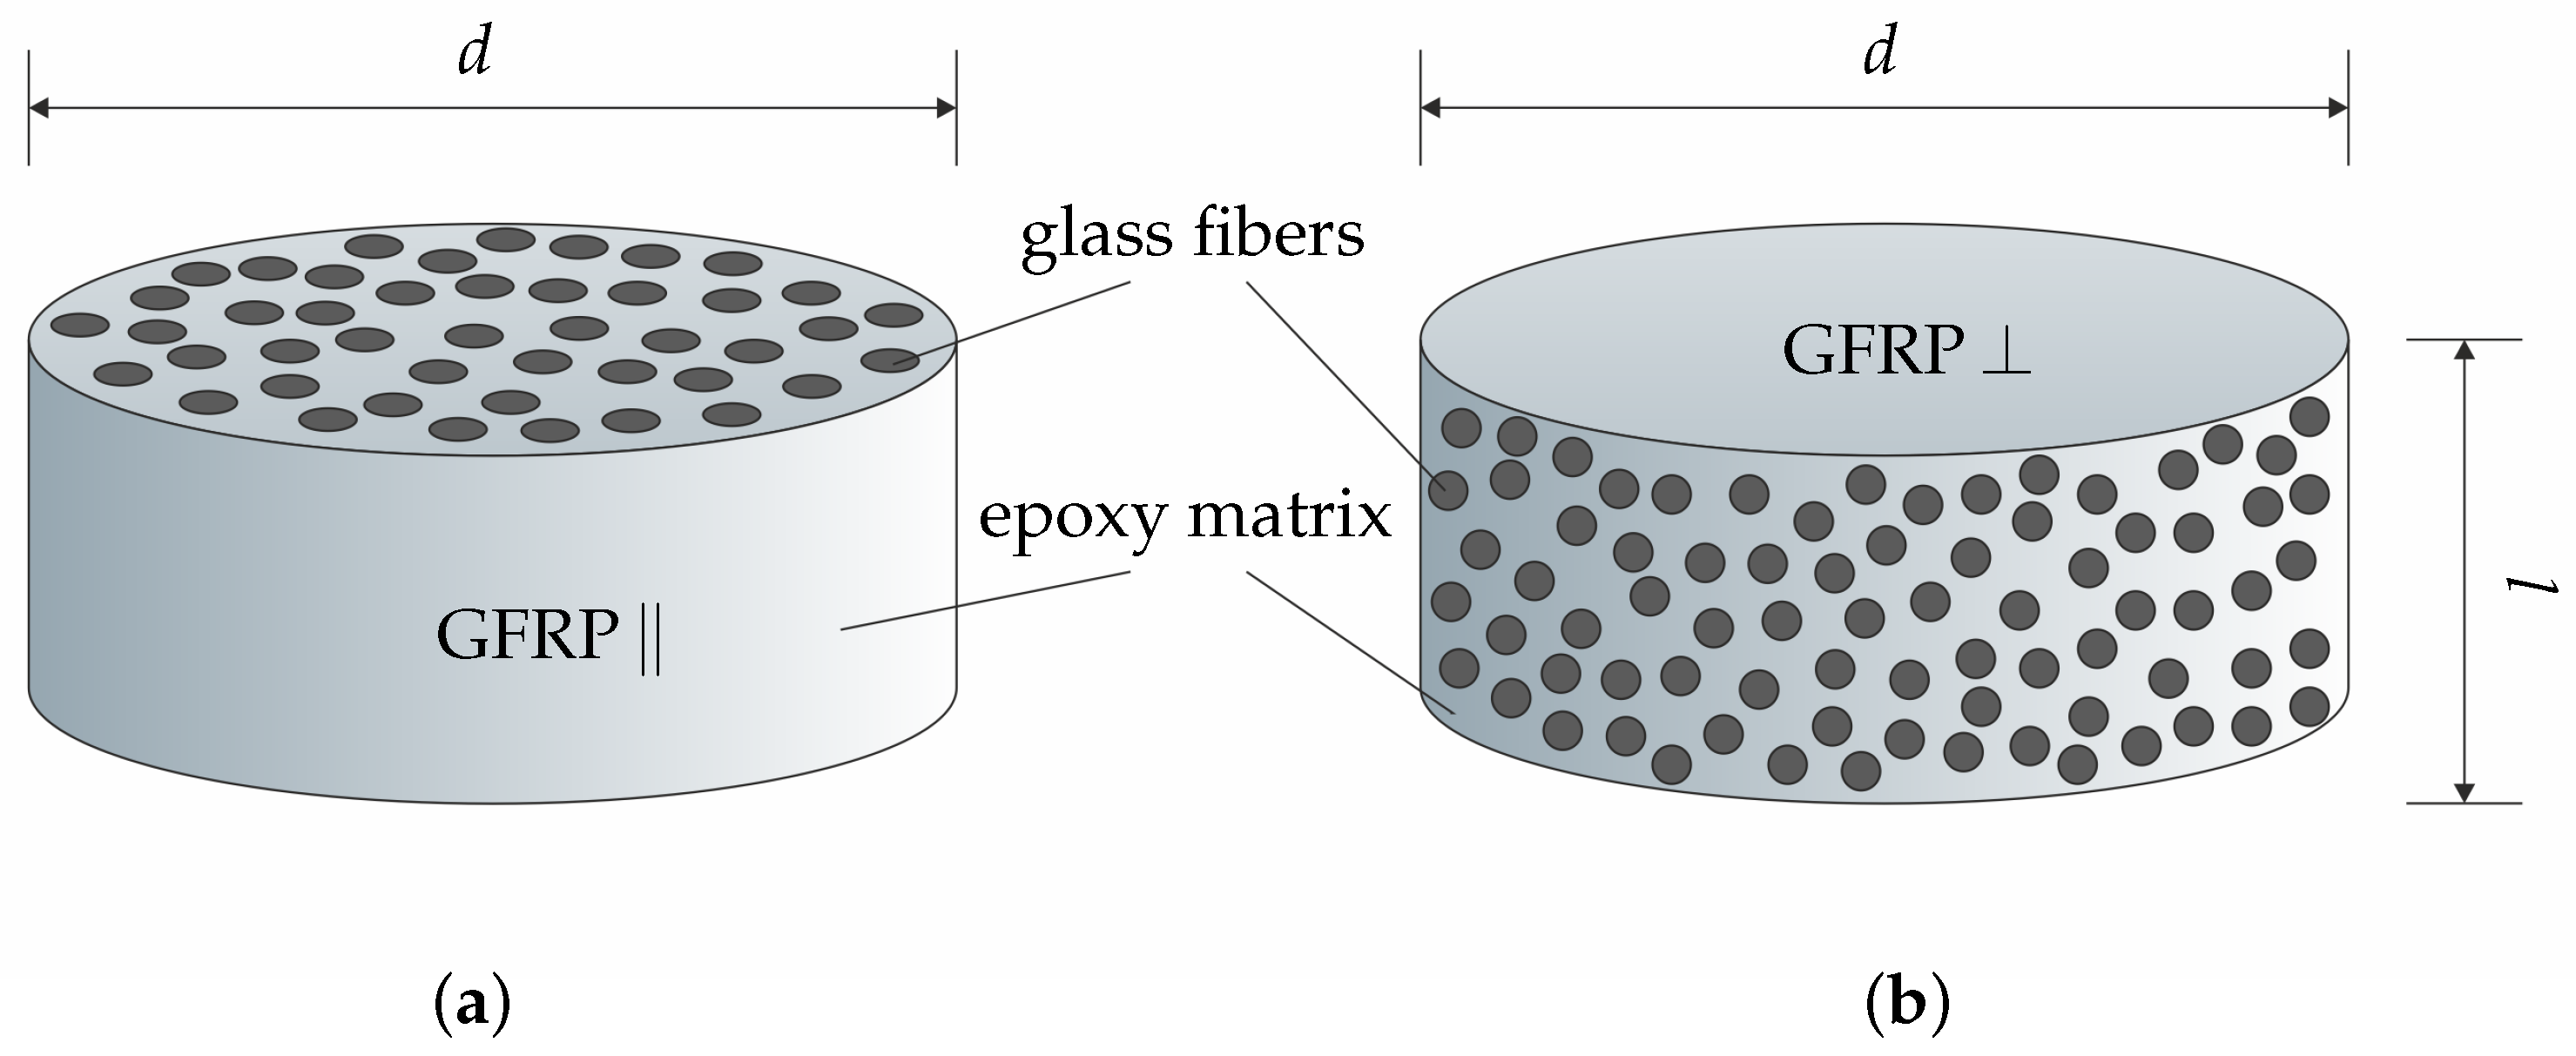
MUBEA Attendorn. A specific number of tapes with a thickness each of 600 μm were pressed inside a hot pressing tool under a pressure of four bar and temperature up to 230 °C. After the consolidation, cylindrical specimens were cut out using a waterjet process. Since waterjet cutting only produces a rough shape of the specimens, they are subsequently processed further. CNC turning ensures the roundness of the cylindrical specimen, and grinding processes guarantee a perfect surface of the specimen. Two types of cylindrical specimens with length
l and diameter
d were prepared. The first type of specimen was cut so that the fibers were oriented parallel to the cylinder axis, see
Figure 2a. These specimens are referred to as GFRP ‖ in the following. The second specimen type was cut so that the fibers were oriented perpendicularly to the cylinder axis, see
Figure 2b. These types of specimen are named GFRP ⊥.
In this study, the two limiting cases of loads regarding the fiber orientation (perpendicular and parallel) are considered; both are needed to map the direction-dependent (orthotropic) material behavior of unidirectional fiber-reinforced material. We note that a cylindrical GFRP specimen with a diameter of 10 mm contains approximately 145,000 glass fibers.
2.1. Static Properties of the Tested GFRP
For reference and later modeling of the effective material behaviour, we started by determining the modulus of elasticity for the GFRP ‖ and the GFRP ⊥ specimen under static loading. The elastic modules of the components, namely the glass fibers and the epoxy matrix, are known as 72 GPa and 4 GPa, respectively. The composite’s modulus can then be approximated using the Voigt and Reuss rules of mixtures, which give an upper and a lower bound for the homogenized modules of elasticity [
10].
Here, and refer to the fibers’ and the matrix material, and and denote the corresponding volume fractions. We have here.
In our setting of unidirectional fibers, we identify the Voigt modulus
with the elastic modulus of the GFRP ‖ specimen and the Reuss modulus
with the GFRP ⊥ material. In that way we determine:
We note that these values are in line with the elastic modules given by the manufacturer (about 45 GPa) and some in-house uniaxial compression tests.
2.2. Split Hopkinson Pressure Bar
Young’s modulus at high strain rates, also known as the dynamic modulus of elasticity , refers to the modulus of the material’s elasticity under rapid loading conditions. When a material is subjected to a high rate of straining, such as during impact or explosions, its behavior can differ significantly from that under static or low strain rate conditions. is typically determined through specialized testing techniques, such as SHPB experiments or high-speed tensile testing. These tests load the material specimen dynamically and measure its resulting stress–strain response.
In the SHPB setup of [
11], two long bars are aligned along their axis, and the material specimen is placed between them, see
Figure 3. Both bars have a circular cross-section and are usually of the same length. The geometry of the bars and specimens used here can be found in
Table 1. The bars in our testing setup are made of steel. A striker, typically made from the same material and diameter, is accelerated by a gas gun, and when it hits the front face of the first bar (incident bar), a stress pulse is induced. This pressure wave travels through the incident bar and reaches the specimen at its end. Because the specimen is small, it acts in the same way as an interface. A part of the wave is reflected, and the rest is transmitted into the second bar (transmission bar).
The reflection results from the impedance mismatch between the bar and the specimen. The impedance
Z measures how effectively a wave can propagate in a medium and is determined by the material density
and propagation velocity
c, cf. Equation (
3). The impedance mismatch between the selected bar material and specimen material may result in insufficient impulse transmission. If the impedance difference is very high, almost the entire wave is reflected at the interface between the incident bar and the specimen. A correspondingly weak or no pulse is then measured at the transmission bar. For this reason, the bars used must be adapted to the material to be tested. For example, bars made of PMMA are used for soft materials [
12]. During the transition from one medium to another, the cross-sectional area over which the wave is transmitted also plays a role. For this reason, the impedance is also listed in relation to the cross-sectional area of the bars,
The incident, the reflected, and the transmitted wave are measured with strain gauges placed in the center of the corresponding bars. In our experiments, the waves are recorded at a sampling rate of by the HBM GEN7t data acquisition system equipped with two bridge cards, type GN411. Each bridge card is supplied by four channels, with each channel able to measure up to 1 MS/s. Wheatstone bridges in a full-bridge configuration are used (HBM 3/350 XY31), with a resistance of 350.0 Ω ± 0.30% and a gauge factor of 2.0 ± 1.0%. The laboratory has a constant temperature of 20 °C.
2.3. Basic Equations for the SHPB Experiment
The SHPB experiment assumes that a one-dimensional wave propagates through the bars and the specimen following the equation
where
u is the displacement and
is the wave speed of the bar material. During the experiment, three strain pulses are measured: the incident pulse
, the reflected
, and the transmitted pulse
. Then, the strain in the specimen
, its strain rate
, and stress
are calculated as follows:
Here,
A and
l are the cross-section area and the length of bar (index “
b”) and specimen (index “
s”), respectively. For a detailed derivation, we refer to [
13,
14,
15]. For the evaluation of the experiments, a period of stress equilibrium and a constant strain rate
are presumed. The stress equilibrium in the sample can be reached more reliably when using thin specimens [
16,
17]. The necessary conditions are discussed in the following.
2.4. Prerequisites of the SHPB Experiment
The specimen’s geometry has to be chosen so that its deformation is uniform and friction during deformation and inertia effects are minimized. This condition can be achieved by a length-to-diameter ratio of 2:1 to 3:1, cf. [
13]. Our specimens have
0.3 to 0.5 and are exactly in this range. Lubricant is applied between the specimen’s surfaces and the bars to reduce the friction effects, cf. [
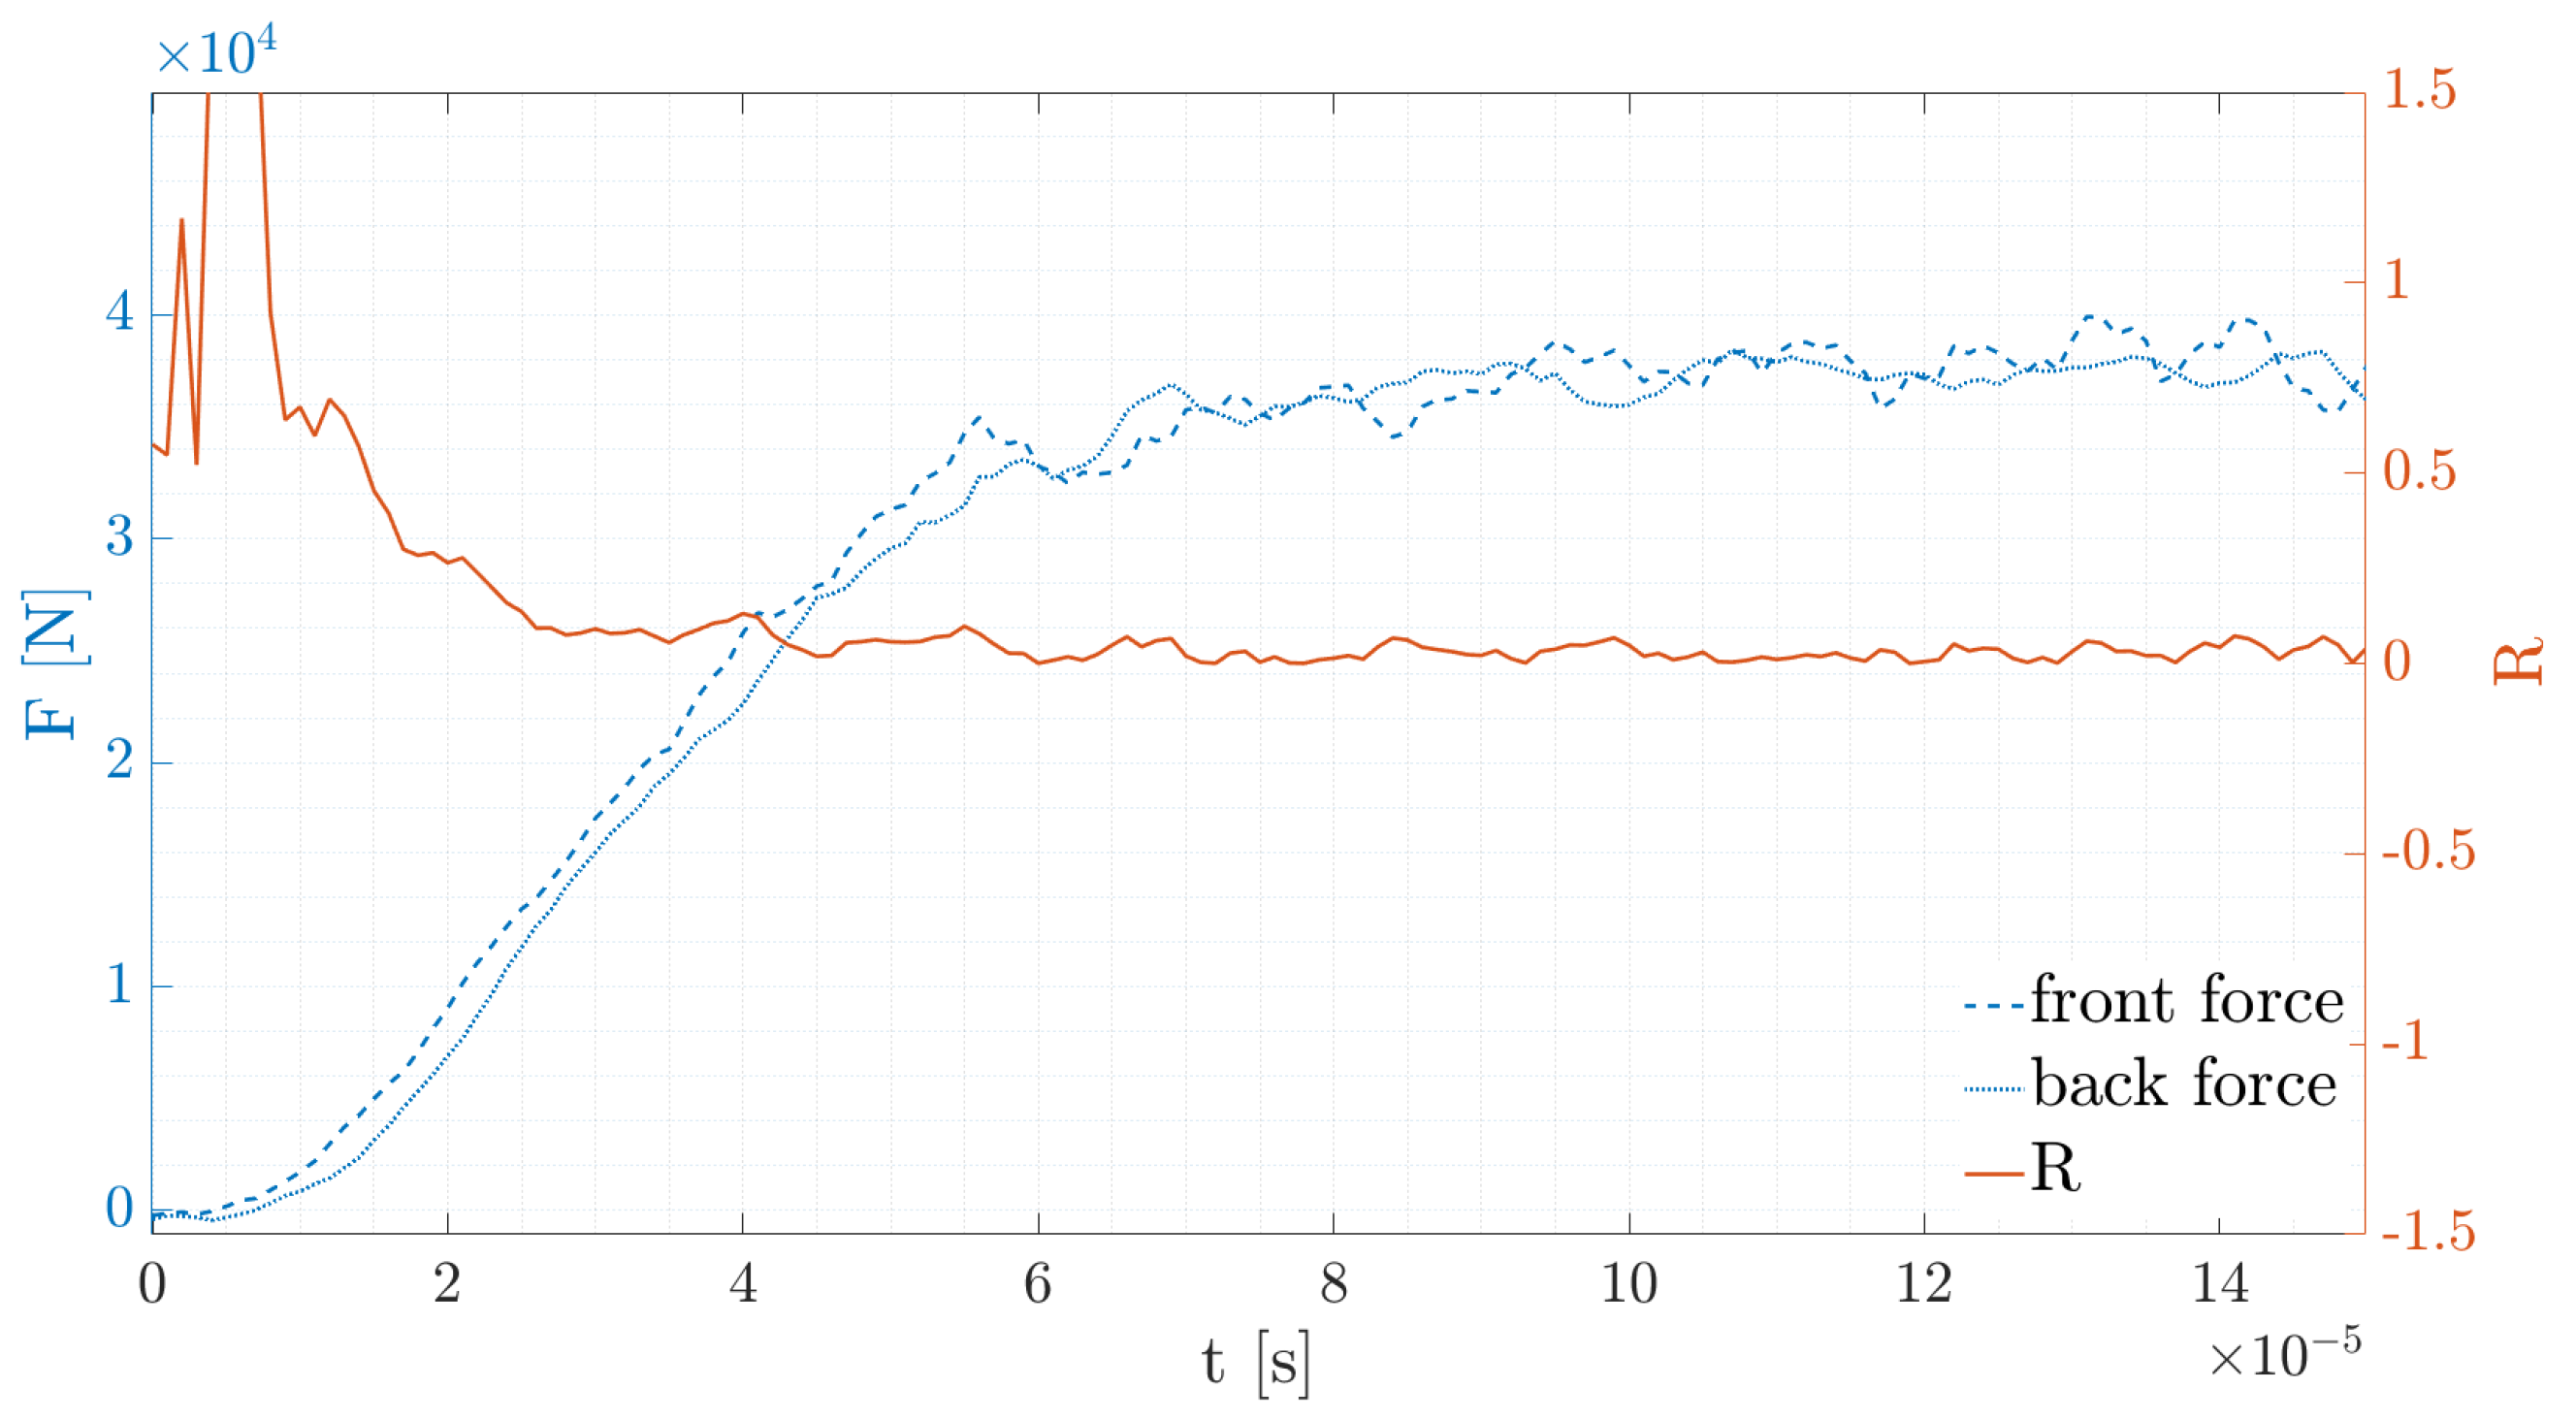
18]. To achieve a stress equilibrium, the stress state described by the lateral force
F has to be equal at both surfaces of the specimen. It is challenging to meet this condition, and therefore, a factor for the stress equilibrium
R is introduced, cf. [
19]. In Equation (
8),
represents the force at the front side of the specimen, and
is the force at the back end of the specimen. Both are evaluated from the measured wave signals of the incident and transmission bars. In our experiments, an
R of less than or equal to 10% was chosen as being acceptable, see
Figure 4.
We note that the wave signals measured at the centered strain gauges in steel bars are assumed to be the signals that arrive at the interface of the bars and specimen. This assumption can be made due to the low dispersions in metal bars. This concept does not apply when testing with polymeric bars where the recorded signals need to be corrected, cf. [
20]. The specimen’s strain, strain rate, and stress can be calculated with the Equations (
5) to (
7) from the measured data. The stress–strain curves presented here were calculated from the average values measured on the plateau of the reflected pulse.
4. Material Model for High Strain Rates
The goal of our investigation was not only to measure the increase in the elastic modulus under impact but also to provide the design engineer with a tool for dimensioning GFRP collision barriers. The stiffness at high strain rates refers to the ability of the material or structure to dissipate and absorb energy when subjected to rapid loading. To account for such a situation in a numerical computation, a material model for the effective response of the CFRP material under different strain rates is needed.
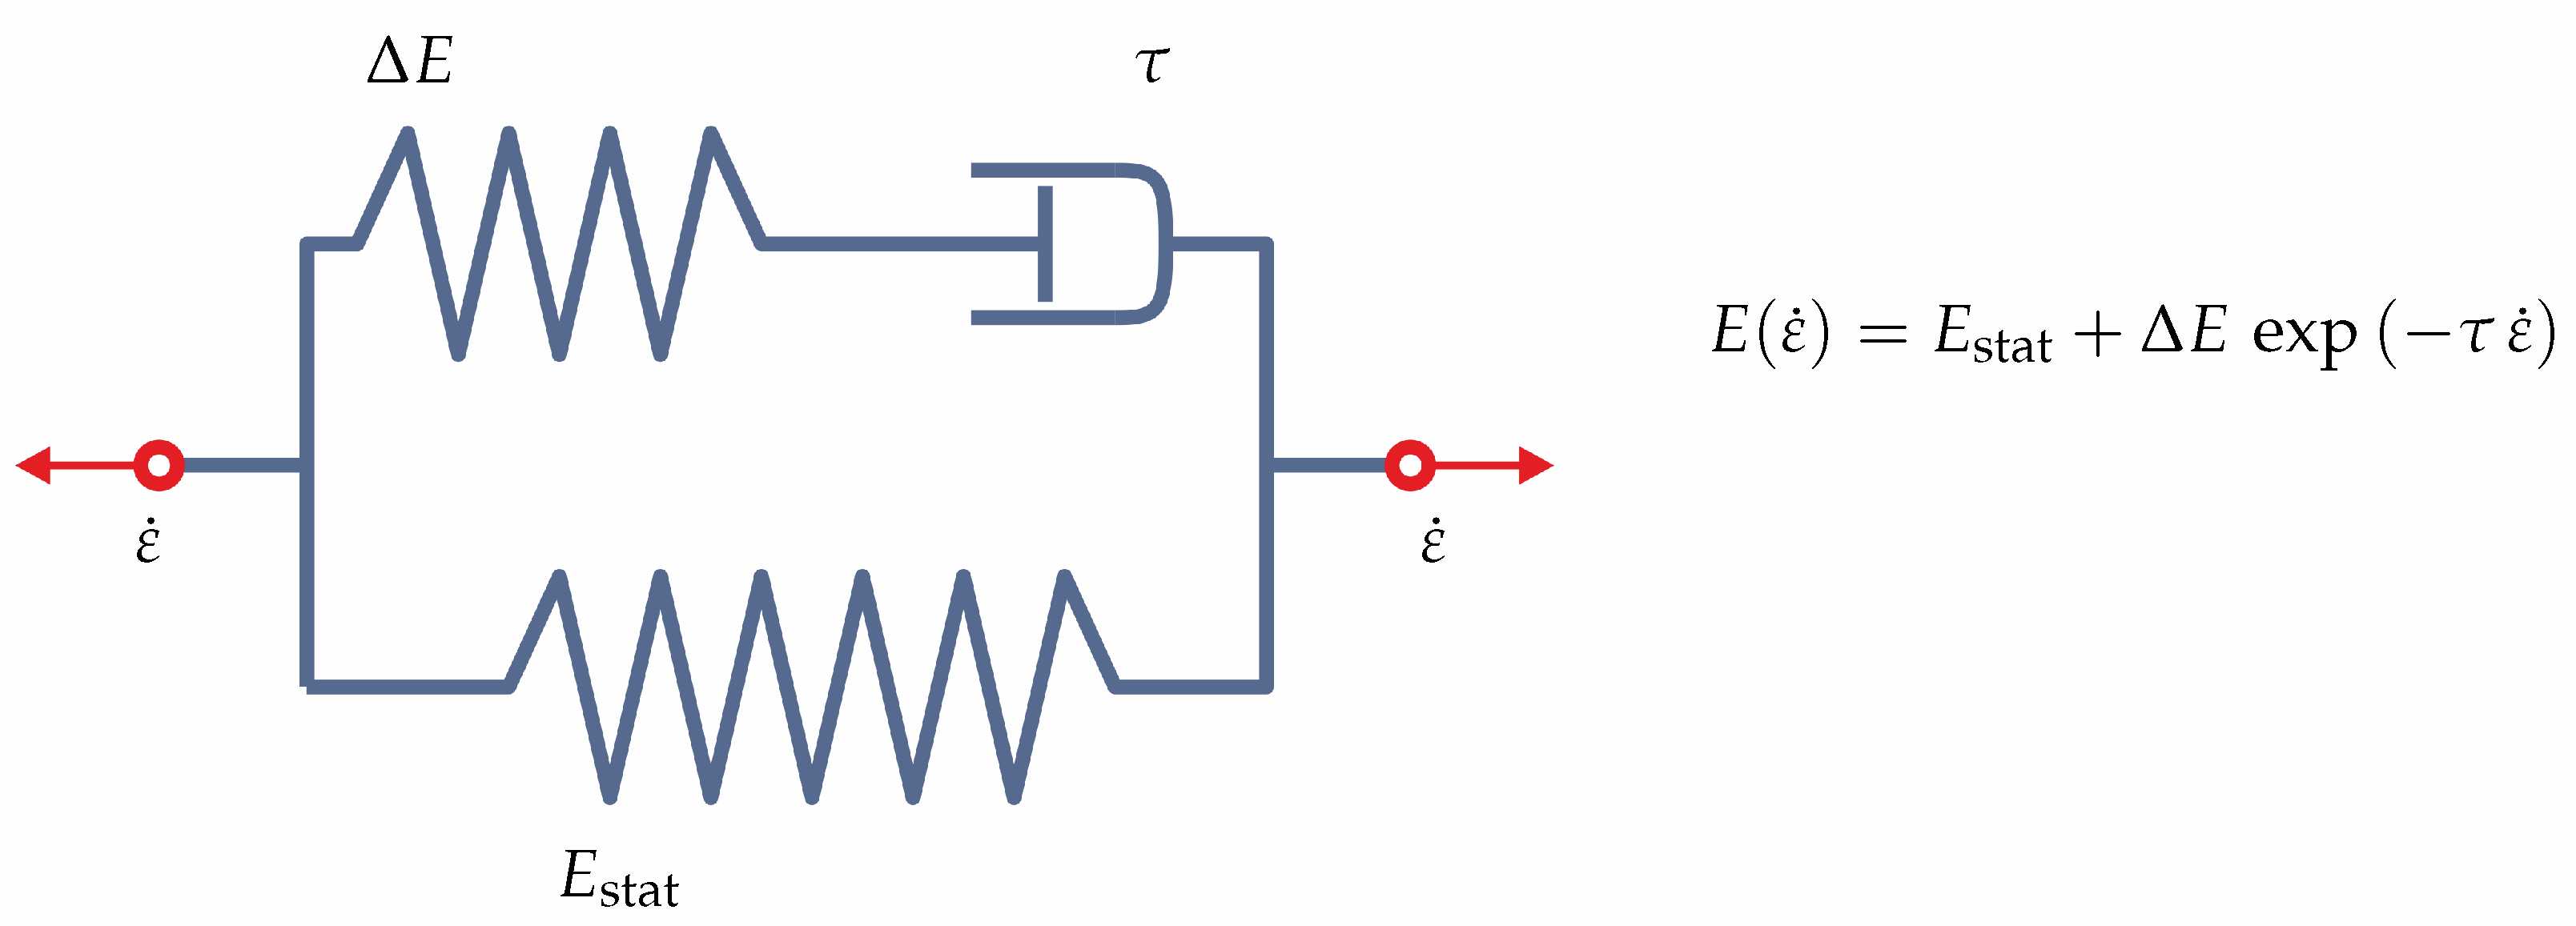
For this purpose, we refer to rheological models as combinations of elastic springs (with modulus
E) and dashpots (with characteristic times
). The latter ones account for the time dependence of the response and are related to the strain rate
. In
Figure 7, the simplest of such a model, a linear standard body, is displayed.
Such rheological models are known from viscoelasticity where each spring–dashpot element represents a relaxation process with a specific relaxation time
. Here, we derive the constitutive relation in an analogous manner to obtain
with
being a characteristic strain rate;
is the corresponding increase in stiffness. We use the values measured in our experiments and set
etc., see
Table 2. Such a model results in a
curve for GFRP ‖ as displayed in
Figure 8.
Because the measured strain rates do not differ by orders of magnitude—compared to the full spectrum of possible rates—the model can be simplified by using just one spring–dashpot element,
, with a mean value of
. This corresponds to the model of
Figure 7 and results in a basically identical
curve for GFRP ‖. For GFRP ⊥, the corresponding
curve is also displayed in
Figure 8. ∘ and ⋄ indicate the measured values.
The proper material parameters are crucial for the simulation of crash events. We refer to [
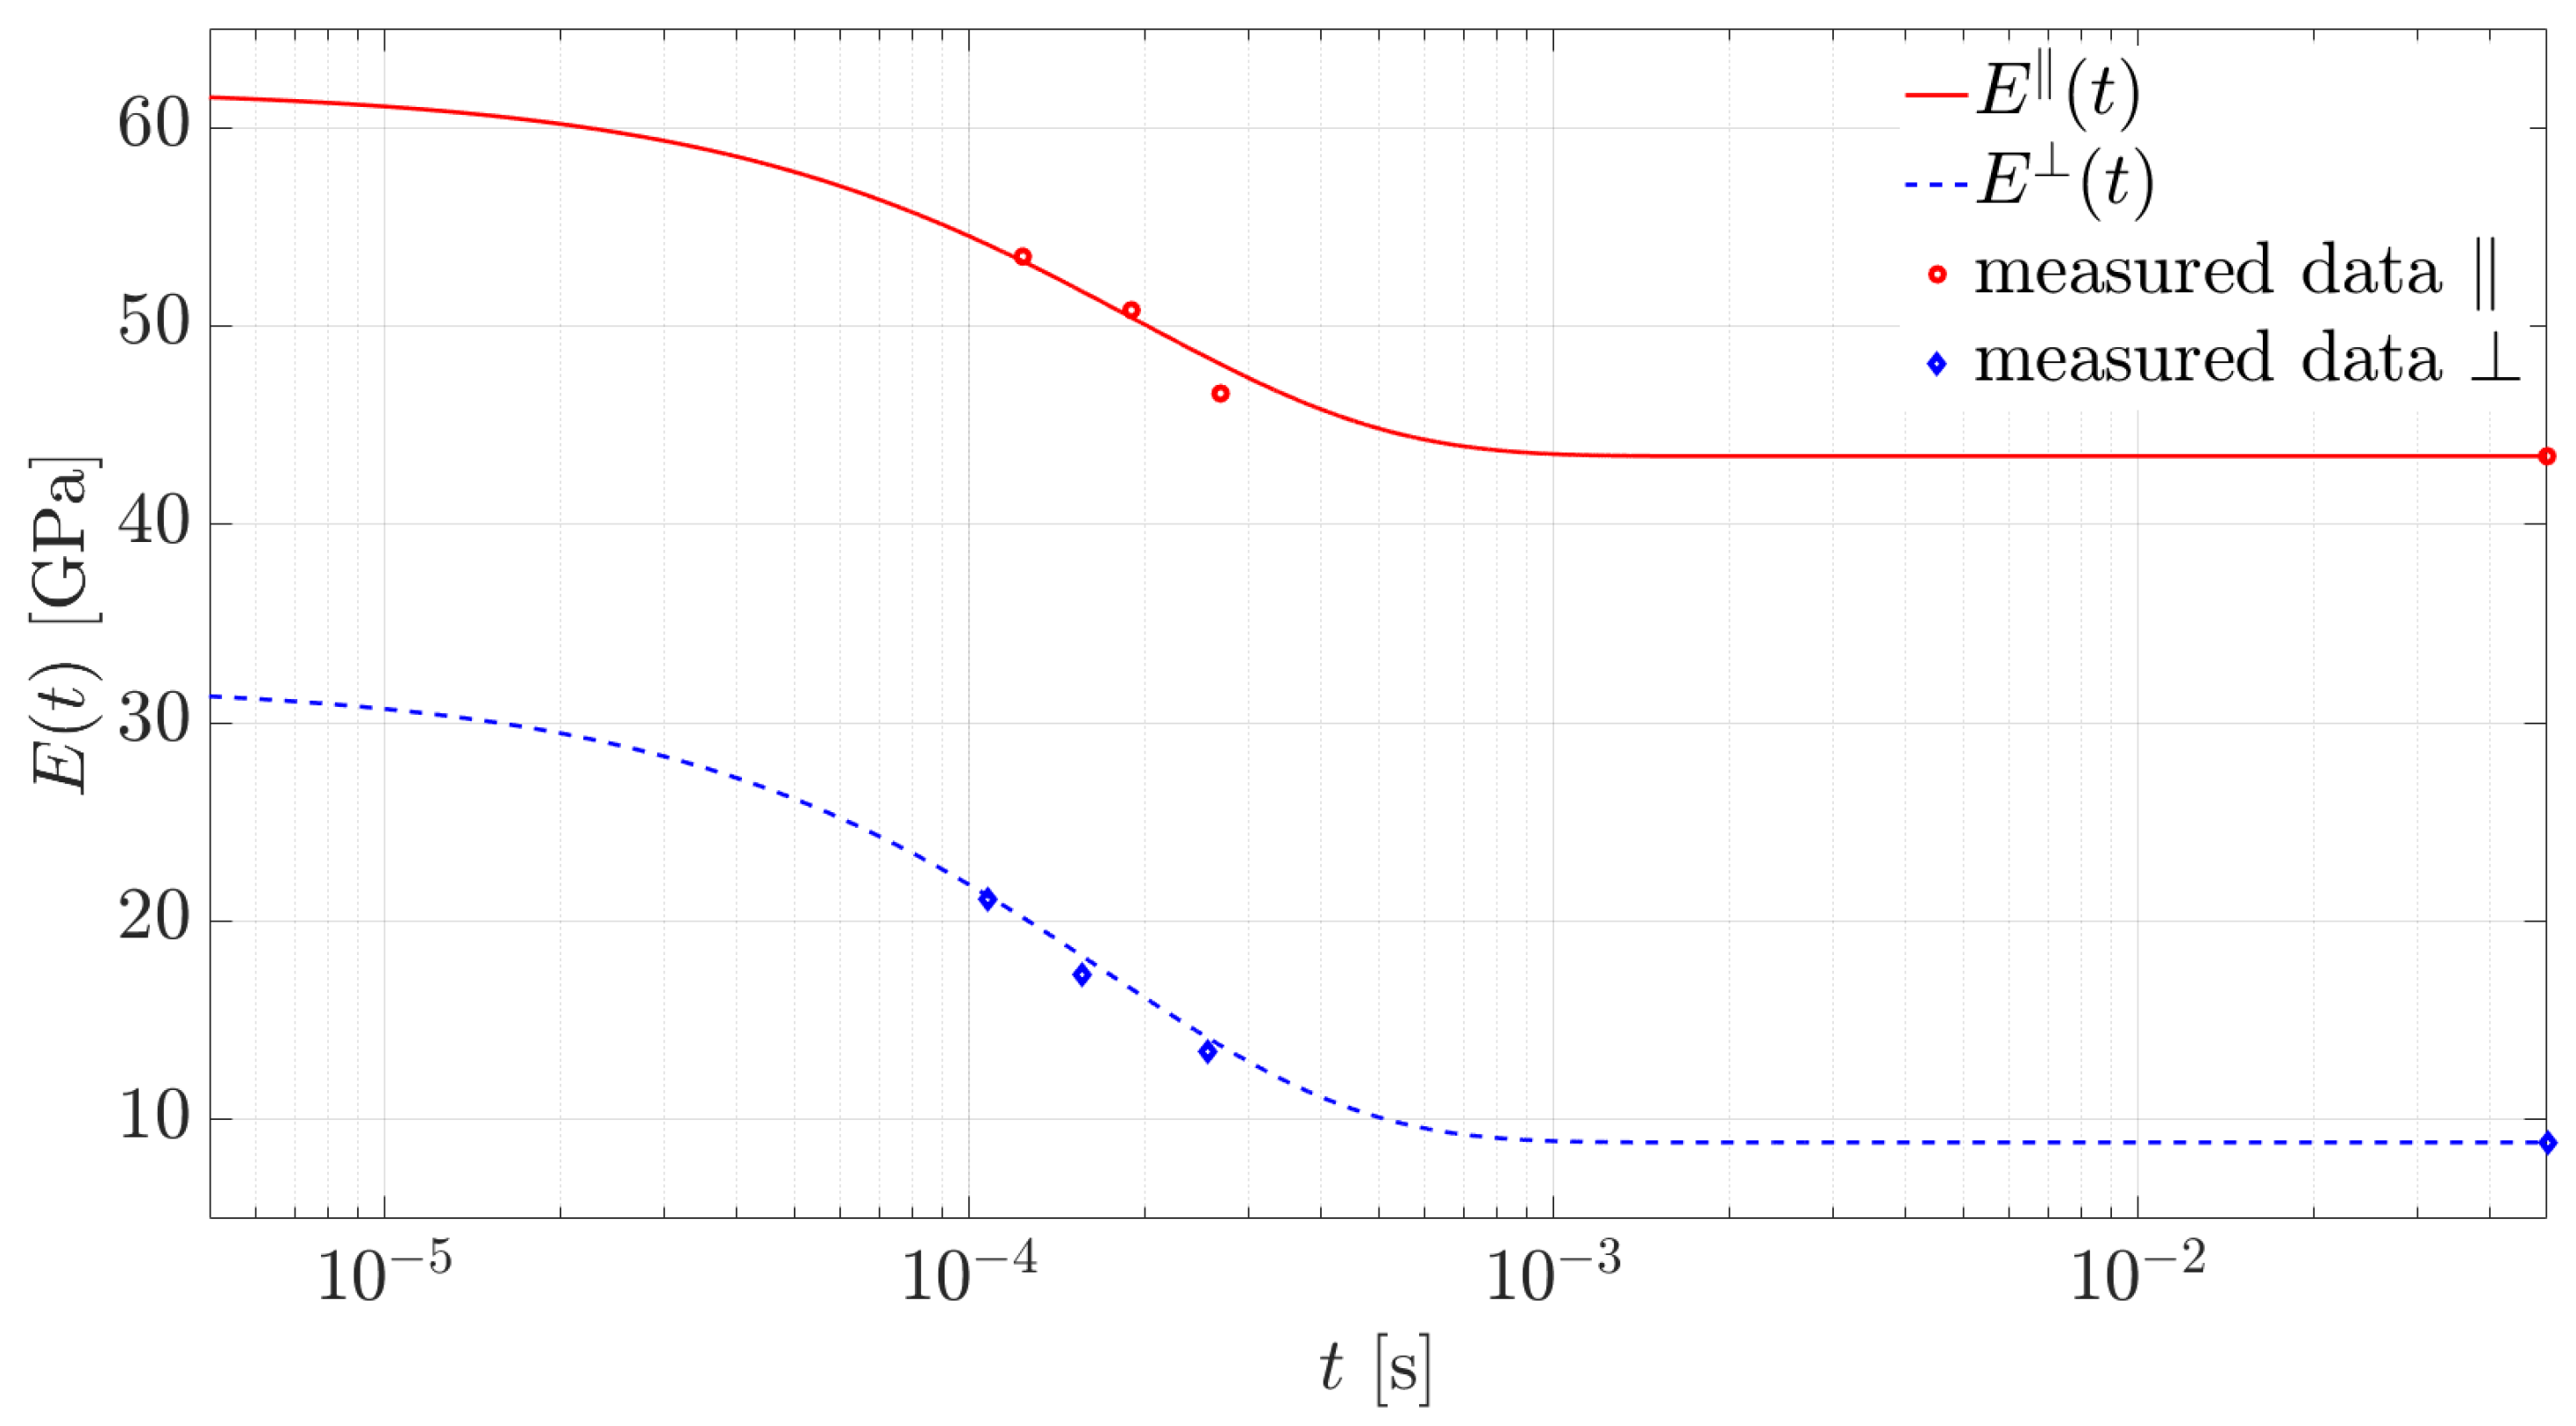
25] where the authors pointed out that experiments must determine these data to simulate the crash event as accurately as possible. Thus, with a view to use the derived constitutive model in a commercial finite element program, we go one step further and express relation (
9) as a function of time,
. Such Prony series models are usually available, e.g., in
Abaqus and
Ansys, and are primarily used to model the viscoelastic behavior of materials. Here it reads
From the values above, we determine a reference strain of
and derive
and
and
The resulting time-dependent elastic modules
are displayed in
Figure 9.
We conclude with two remarks. First, our model can only be used for strain rates below 1000/s, which are typically for car crashes and vehicle collisions [
26]. The data do not allow extrapolation to higher strain rates. To extend the model to incidents such as explosions, further experiments are required, e.g., Taylor impact tests.
Second, we attribute all time dependency observed in high-strain-rate loading to viscoelastic effects. Of course, this is a simplification because other effects, such as inertia, may also contribute to the modified elasticity. However, it is justified by the benefit of a handy model for designing GFRP collision barriers.
5. Discussion and Comparison with Other Experiments
Energy absorption at high strain rates is essential in various engineering applications where the ability to dissipate energy and protect against sudden dynamic loading events is critical. Materials with a high stiffness (and ductility) can absorb more energy before they fail. In that sense, the strain-rate sensitivity of a material refers to the increase in its stiffness under high rate loading. Such a material can be achieved through advanced manufacturing techniques, such as tailored forming processes or by incorporating energy-absorbing layers and inlets. Moreover, in [
27], the authors state that a composite material (fiber-reinforced rubcrete in their case) provides a better energy absorption than, for example, a crash barrier made of pure concrete.
The dynamic measurements of the GFRP specimens show an increase in the stress–strain curves similar to other works, cf. [
4,
6,
8,
28]. Comparing the strain-rate-sensitive stress–strain behavior is complicated because there is no standard method for executing SHPB tests. In addition, the material compositions influence the results. The material’s behavior is influenced by several factors, such as the speed of the striker, the testing method, the fiber volume fraction
, the length-to-diameter ratio, and the matrix and fiber material. In addition, the specimen’s fiber direction must be considered. Therefore,
Table 4 refers to the different polymer matrices with the fiber volume fractions
in a range between
according to the individual authors. Our observed increase in the modulus of elasticity is in line with the results of these authors.
6. Conclusions
In places where serious traffic accidents frequently occur, using crash barriers made of GFRP material is advisable. To dimension such structures, strain-rate-dependent materials are needed. In this work, dynamic compression tests were performed using the SHPB technique. GFRP specimens with different fiber orientations (parallel and orthogonal) were investigated. We found that the elastic modulus increases with increasing strain rate up to 19% for GFRP ‖ and up to 58% for GFRP ⊥ at a strain rate of about 700/s in contrast to the static modules.
Additionally, a constitutive model for the time dependency of the elastic modulus was derived. It describes the material’s elasticity for strain rates up to 1000/s independent of the loading direction. This material model can be used in future finite element simulations regarding impact analyses, car crashes, and collision incidents.
Our obtained results were placed in the context of previously published work. Although a comparison is only possible to a limited extent due to the different kinds of methods and tested GFRP materials, we found a plausible match to our observations.
The time dependency of a material’s elasticity is essential in impact engineering, ballistics, automotive safety, and defense applications. It helps understand and predict the behavior of materials under a high-speed impact or explosive events, allowing for the design and optimization of structures and materials to withstand such loading conditions.


