1. Introduction
With increasing requirements for improved efficiency in combination with a low-cost policy of mechanical machines and equipment, the risk of failures such as wear, ovality and breakage of the joints, with pin shaft, supports and bearings involved, will increase. The supports are normally made of a lower-strength and -hardness material compared to the pin shaft [
1], and therefore wear and ovality are often experienced, especially with high and alternating loads, vibrations, and shock-loads, which can be costly to repair. Increasing clearance between the pin and the support bores results in relatively larger movements between pins and supports in the radial direction, but also often in the axial direction, in addition to possible rotational movements. The initial installation clearance from the first installation of a new fabric pin in new support bores increases over time and the process could be accelerating, as described by Karlsen and Lemu [
2]. Repairing damaged supports is time-consuming and involves direct costs in terms of repairs and materials, and indirect costs in unwanted and often unplanned downtime. In general, there are various methods to join the pin shaft and the supports, such as (i) with a standard, cylindrical pin, (ii) interference by press fitting, (iii) interference by shrink fitting, and (iv) interference fit by radially expanding the pin [
2,
3].
A standard cylindrical pin, under method (i), installed in attachment lugs (machine supports), would normally be of the clearance type, with a defined positive clearance between the pin and the bore, or a near-push-fit type (close to zero clearance, but not interference type) [
4]. Chikmath and Dattaguru [
5] analyzed the stress situations by loading a joint in the pull and push directions of the lugs. A push-fit type of connection, or clearance fit, will show a region of contact/separation that changes 180° when the load is changed between pull and push, but will undergo no change of contact/separation location when the loads are pull–pull, static pull, push–push, and static push. This results in changing boundary conditions on the pin–hole interface, and the crack initiation locations are placed at +90° and −90° compared to the load direction.
In general, an expanding pin assembly, such as in method (iv) mentioned above (as shown in
Figure 1 [
6]), involves a cylindrical pin with machined tapered ends, machined sleeves with a cylindrical outer shape and conical inner shape to fit the tapered pin ends, and an endplate with tightening screws or nuts. By torquing the tightening screws or nuts, the sleeves are forced to move axially and expand radially on the tapered pin ends until the pin assembly locks via the application of wedge force to the support bore inner wall surfaces. The contact pressure between the surfaces in contact can be controlled by the torque level in the tightening screws or nuts. Any relative movements between the pin and the supports can be prevented by introducing sufficient contact pressure to the surfaces in contact. In this type of assembly, there will be no region of contact/separation due to changes in load direction. The expanding pin solution is recognized by its users as generally an easier, faster, safer, and more economical pin solution [
1,
7].
It can be both time-consuming and costly to perform repairs of damaged support bores, especially if this must be performed outside planned service intervals. Due to restrictions on hot-work and high-energy work, or the lack of sufficient and necessary tools, the machine or equipment might have to be dismantled and shipped to other locations for repair.
Nowadays, 3D scanning is applied for rapid product development [
8] and is considered as a potential tool of production control [
9,
10], where the scanned digital data of the produced part are compared with the original design data. The technologies that allow RE, and the rapid design and production of prototypes (rapid prototyping (RP)) and tools (rapid tooling (RT)), by capturing three-dimensional data from physical models in digital form, are also known as 3R technologies. Javaid et al. [
11] studied the use of 3D scanning for the RE, analysis, designing and measuring of complex shapes and surfaces, from an industrial perspective. The application of this technology is wide and is increasing rapidly, in fields such as automobile, aircraft, fashion, construction and healthcare, where the design of prostheses, anatomical orthoses, and a wide range of other tools are needed.
Three-dimensional printing is an additive manufacturing (AM) process [
12,
13,
14], wherein a material is added through the production process and not removed as in a CNC machining process, and in many situations, it can be more cost-effective to repair partially damaged and worn parts by 3R technology than printing whole new parts. Kim et al. [
15] presented a maintenance framework for such repairs to ease the task and make the process more user-friendly, and to reduce the need for expert technical support on-site, which might be difficult to get at certain locations, e.g., on ships in operation and offshore platforms. A study on how maintenance, repair, and overhaul (MRO) strategies can be optimized also presented an industrial case study [
16] of a flap discs manufacturing machine with a pneumatic cylinder used to pick up and drop the final product. The conclusion was that AM brings important advantages to MRO activities, and it offers sustainable alternatives when maintaining, repairing, overhauling, and replacing spare parts, or other components. It is necessary to determine the difference between the measured and the real part when creating a digital twin of the original part via the 3D scanning of the worn or damaged part, and this is called deviation zone estimation (DZE). Buchanan and Gardner [
17] presented an article regarding a review of methods, research, applications, opportunities, and challenges related to using 3D printing construction. They stated that the AM will complement conventional production processes, rather than replace them, with a potential for hybrid solutions to achieve structural strengthening and perform repairs. Ueda et al. [
18] used DZE to determine the worn and damaged area of an artificially created turbine blade, and Mortazavian et al. [
19] performed a thermal–mechanical study of 3D printing for worn rail repairs. An additive material of type E71T was 3D-printed on the top of the worn rail head carbon–manganese material, and the effects of preheating on residual thermal stress at the rail/additive interface were studied. Metal additive manufacturing and repair are widely applied in both the aerospace industry and medical sector [
17]. Both the Eurofighter Typhoon and Airbus 380 use 3D-printed components in non-safety-critical components, and SpaceX have built an engine chamber out of nickel superalloy. Many studies involving 3D printing have been performed within health and medical sectors. Wan et al. [
20] studied bone repair by use of a biocompatible heterogeneous bone powder and 3D printing, while Zhao et al. [
21] studied the 3D printing of porous titanium alloy scaffolds for bone tissue repair and reconstruction. Maroulakos et al. [
22] wrote a review article on the applications of 3D printing on craniofacial bone repair, based on 43 articles (6 human and 37 animal studies). Zhu at al. [
23] created a gelatin scaffold from 3D-printed porous titanium to repair and regenerate bones, and Cheng et al. [
24] studies 3D-printed prosthesis for the repair and reconstruction of bone defects.
One way to investigate strain, load and stress distribution in a pin is by applying strain gauge technology. The basis and working principle of strain gauges is the strain/resistance relationship of electrical conductors, discovered by Wheatstone and Thomson; the bridge circuit was invented and first mentioned in a publication by Charles Wheatstone in 1843 [
25], and the technique was further developed by Hook [
26] and Ruge [
27].
A cylindrical load pin will normally have two grooves going 360° around its circumference, one close to each support, with the groove depth depending on the maximum load expected, and the strain gauges are placed either on the inside wall of a pin center bore [
28,
29] or on some pockets on the outside wall [
30]. The purpose of the grooves, or deformation zones, is to ensure enough strain concentration to guarantee the accuracy and repeatability of the measured results, which define their quality.
This study investigates a new technique for the temporary repair of a support bore wherein a standard cylindrical pin shaft has originally been applied, by comparing various possible options at a point in time at which severe wear and ovality have occurred in a joint support. The comparison is performed by the application of 3D scanning and printing techniques, and strain gauge measurements in the pin under external loading and different pin positions. The proposed procedure is much more time- and cost-efficient than the traditional means of repairing worn and damaged joints, wherein the machine and equipment are typically taken out of operation until the repairs are finished; when applying this procedure, the downtime due to the repair is minimized.
3. Results and Analysis
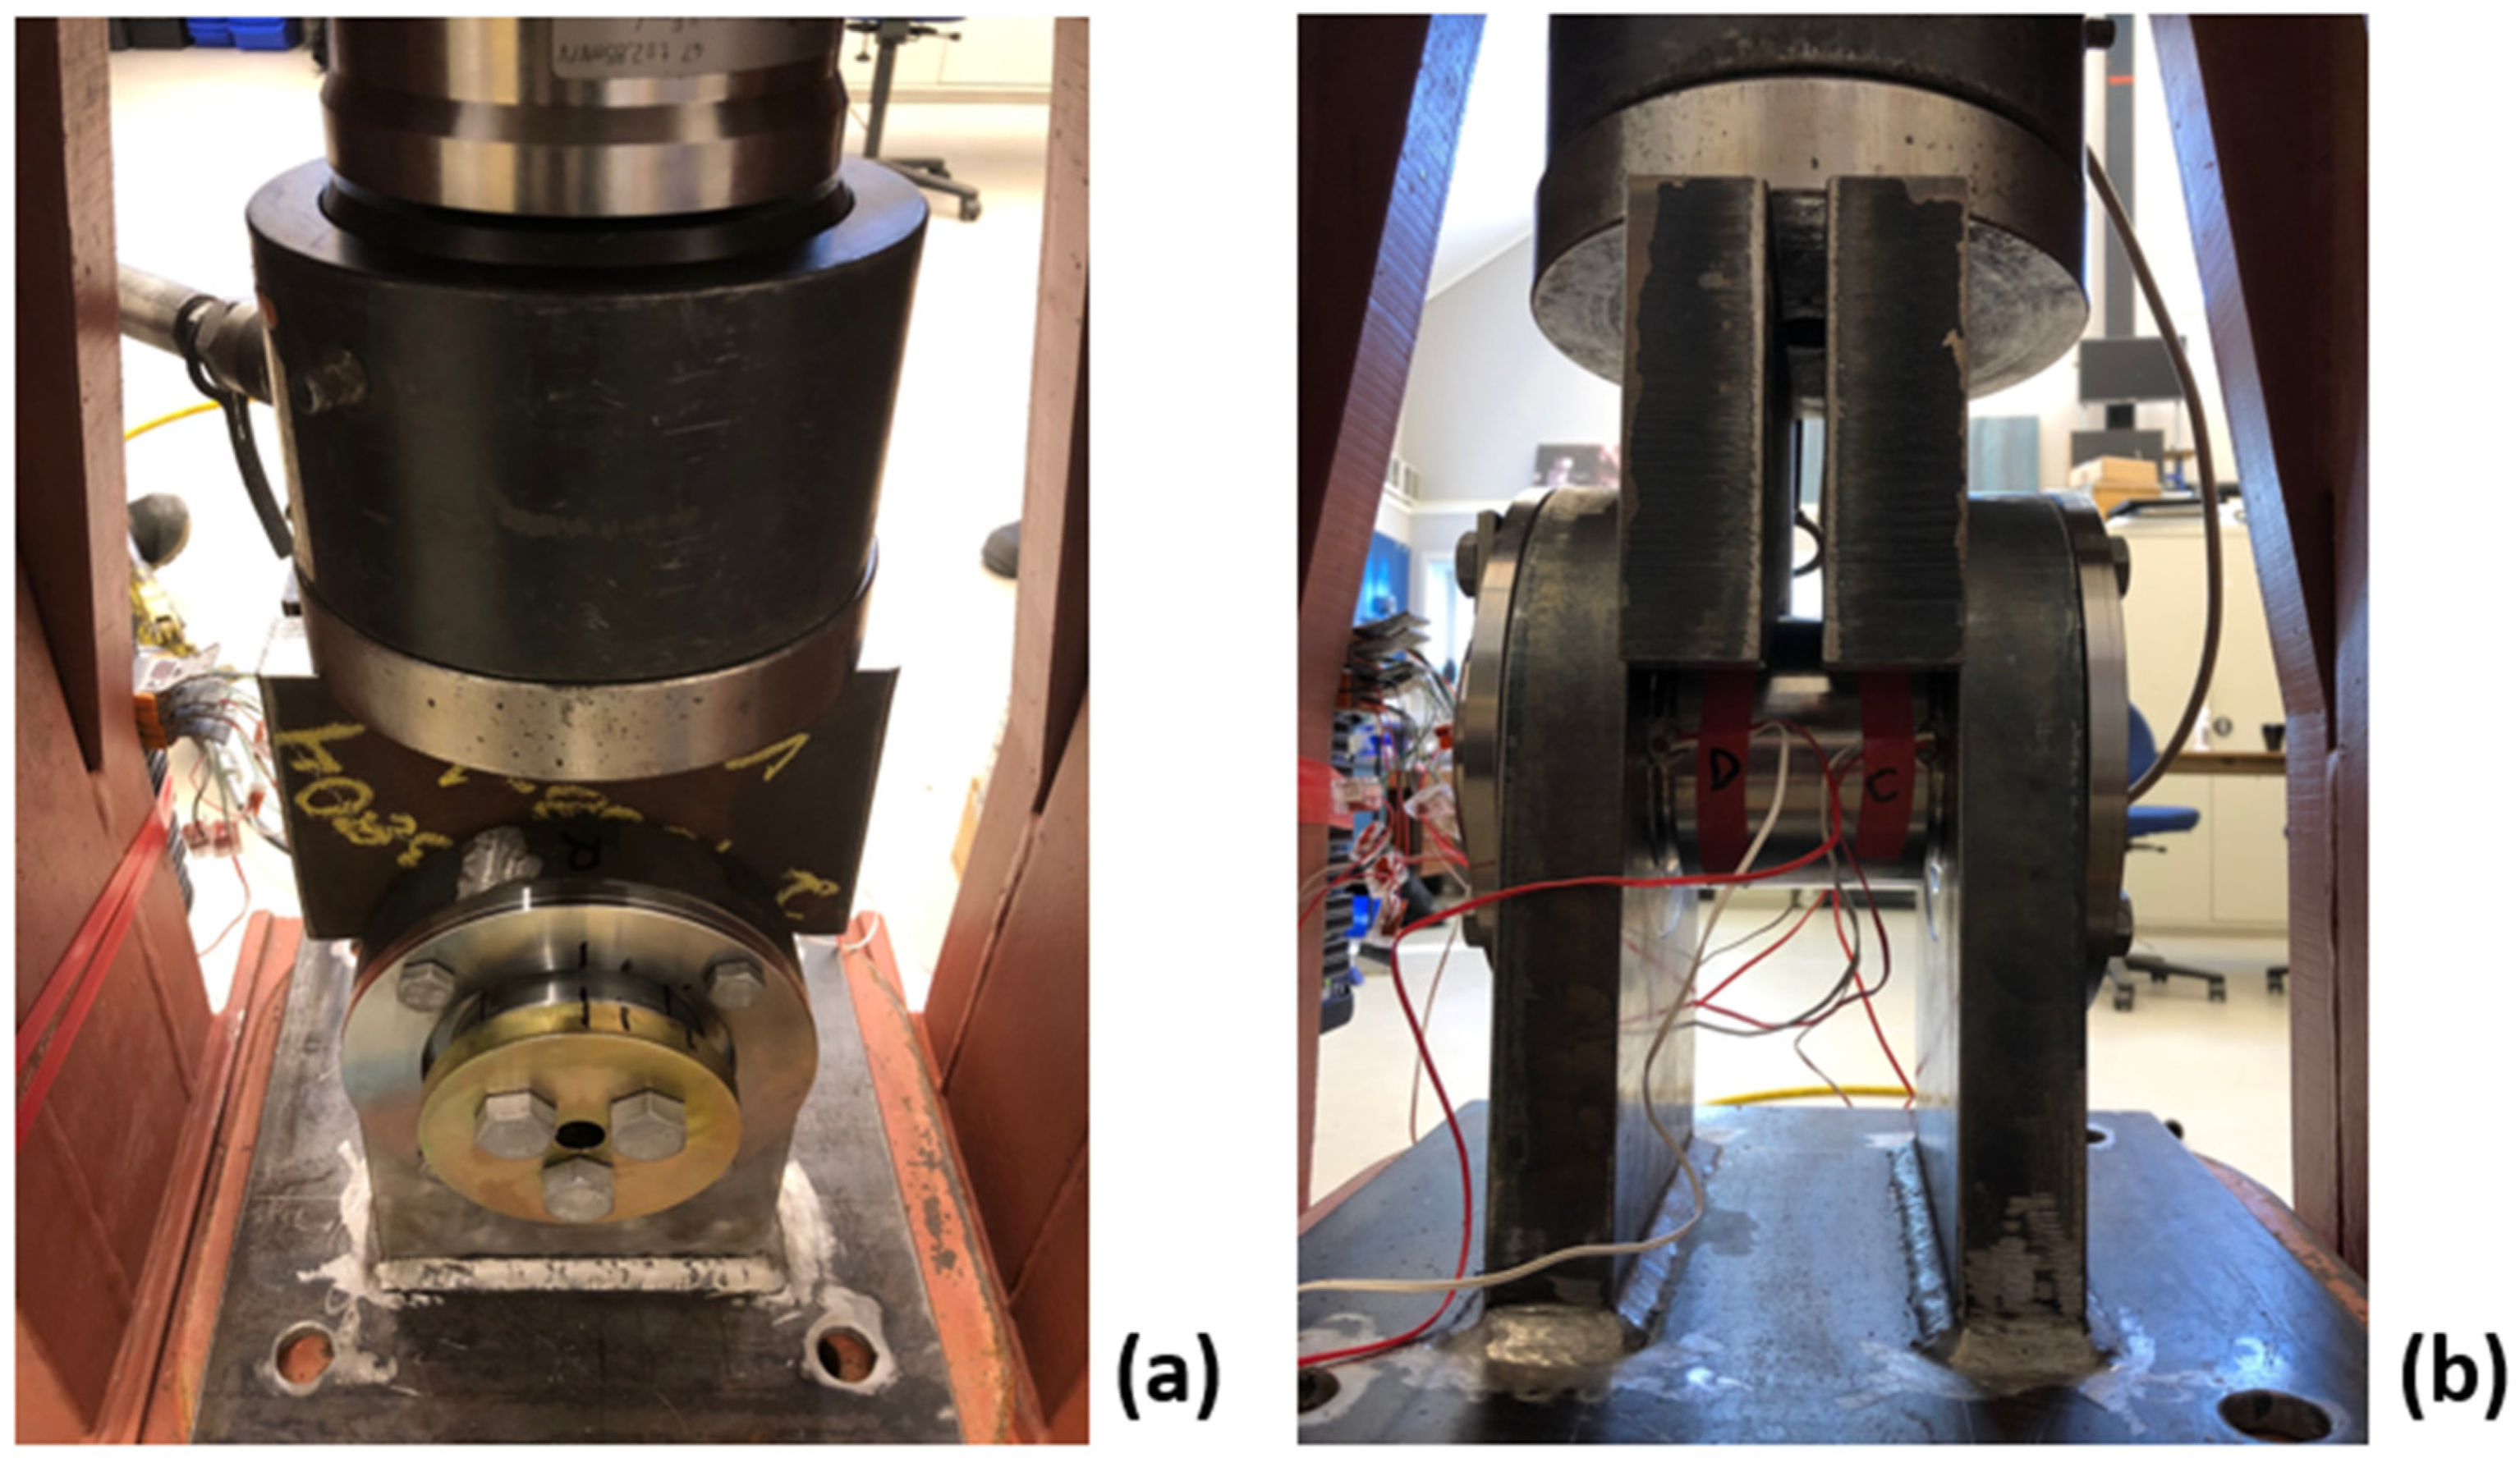
The support bores in the cases of tests 1, 3 and 5 were identical on each side with Ø88.9 mm-diameter circular holes, and representative of a normal operational situation. On the other hand, Tests 2 and 4 showed increased wear on the left (L) supports compared to the right (R) support, which was prepared to simulate an unwanted, but typical, situation for a standard pin. For the expanding pin, however, the situation described in test 4 would not occur under normal circumstances during normal operation, but could be the result of an unwanted situation wherein the expanding pin has been installed in a severely worn joint.
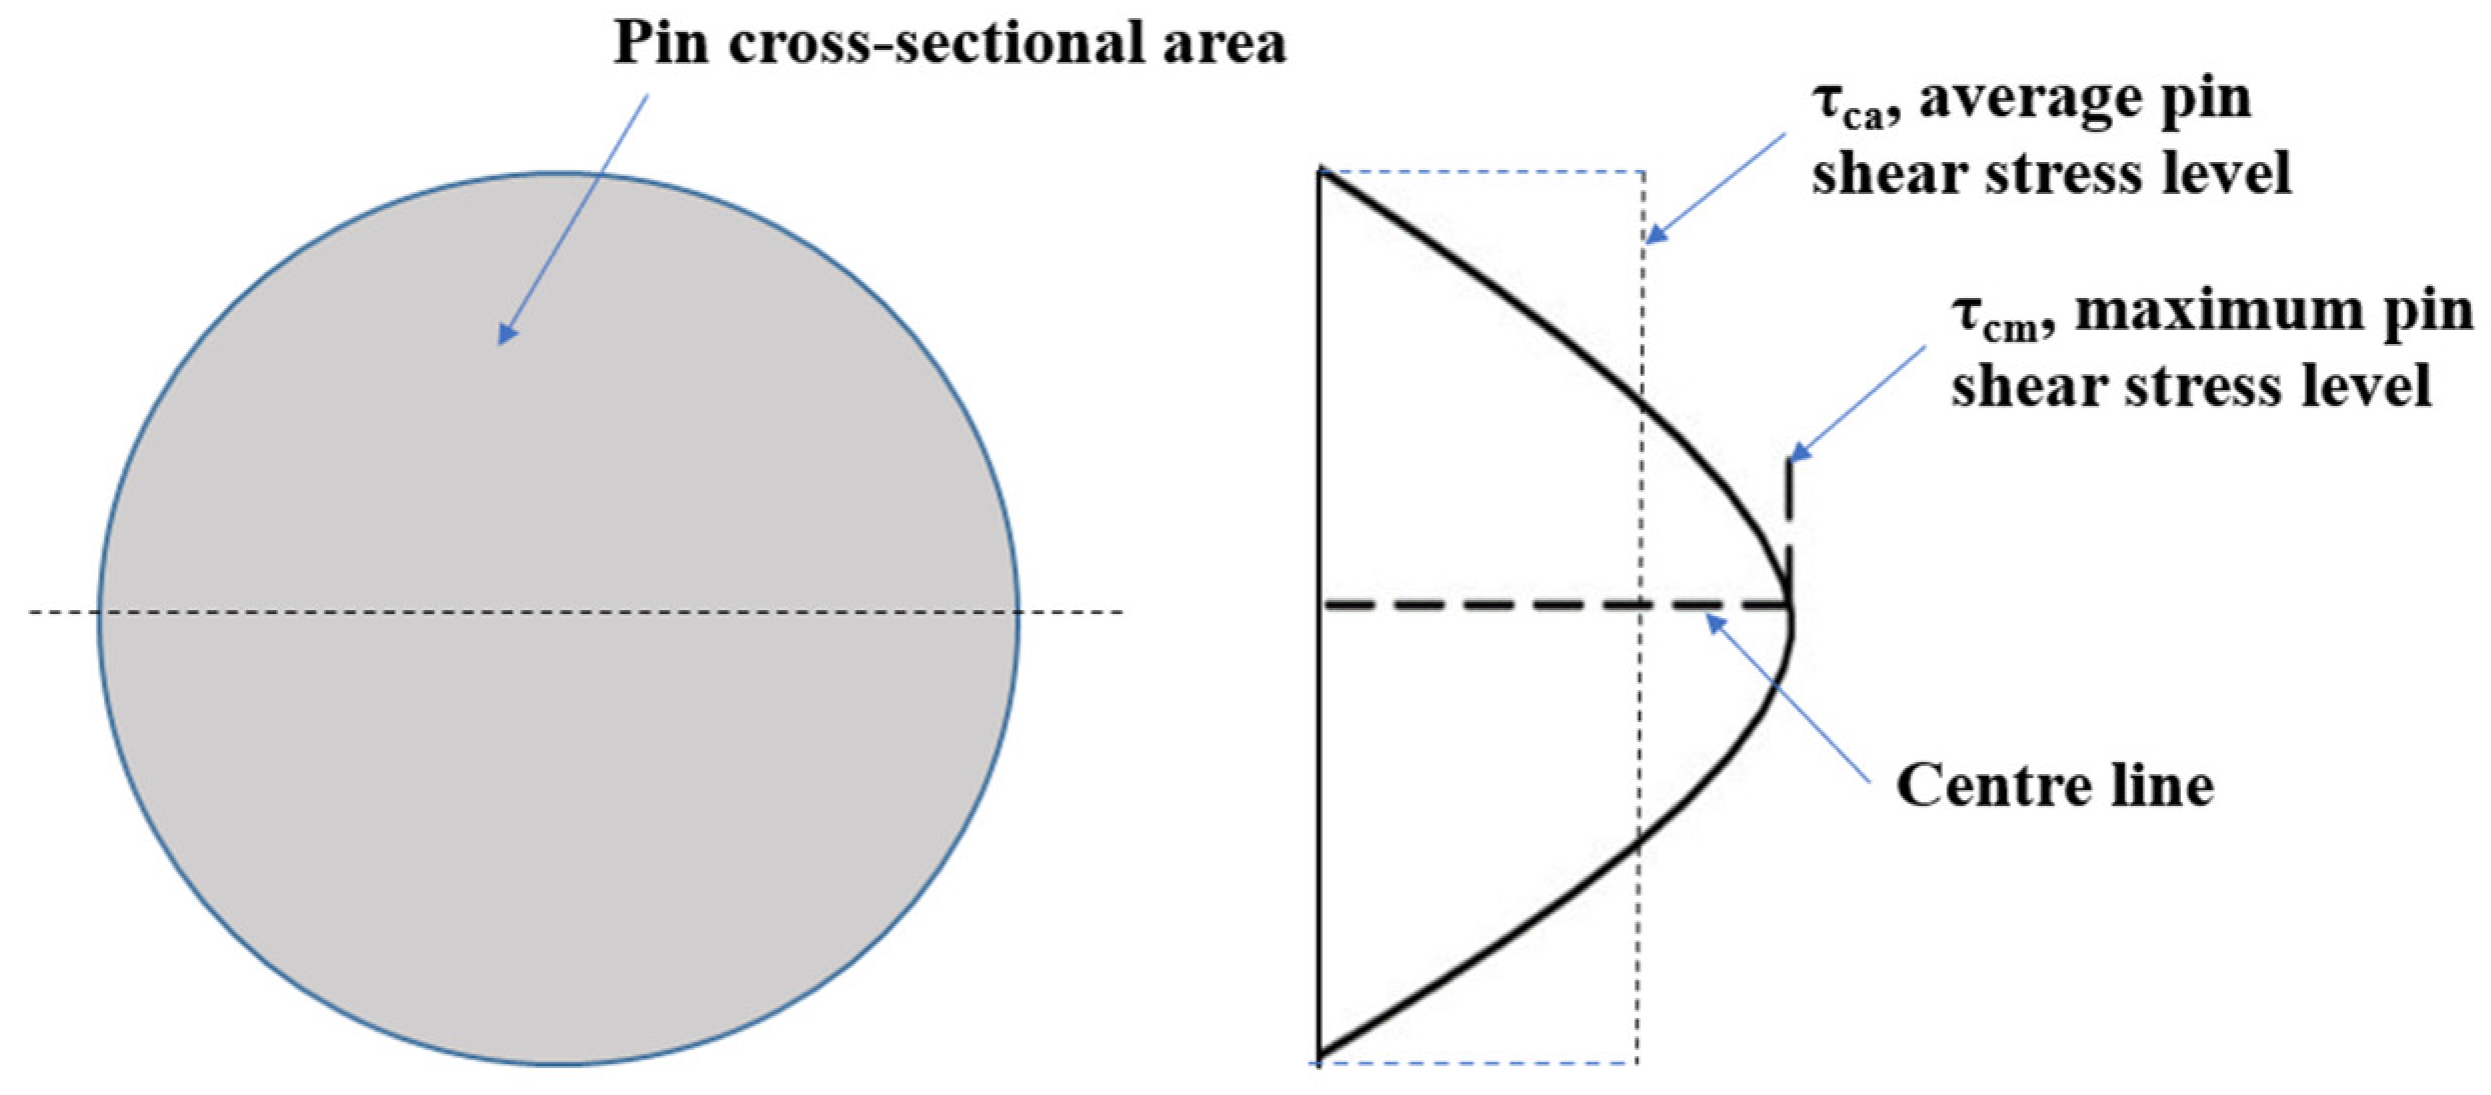
The measured strain values, ε
45°, were compared with the calculated average strain values, ε
ca, obtained from Equation (1), and the calculated maximum strain, ε
cm, from Equation (2), for each test. For circular cross-sections, the maximum shear stress, τ
cm, is assumed to be
of the average value, τ
ca [
35], as illustrated in
Figure 7. The average shear stress can be expressed as the force (N) acting on the cross-section divided by the cross-sectional area (mm
2).
where F (N) = external load, A (mm
2) = cross-sectional area and G (MPa) = shear modulus.
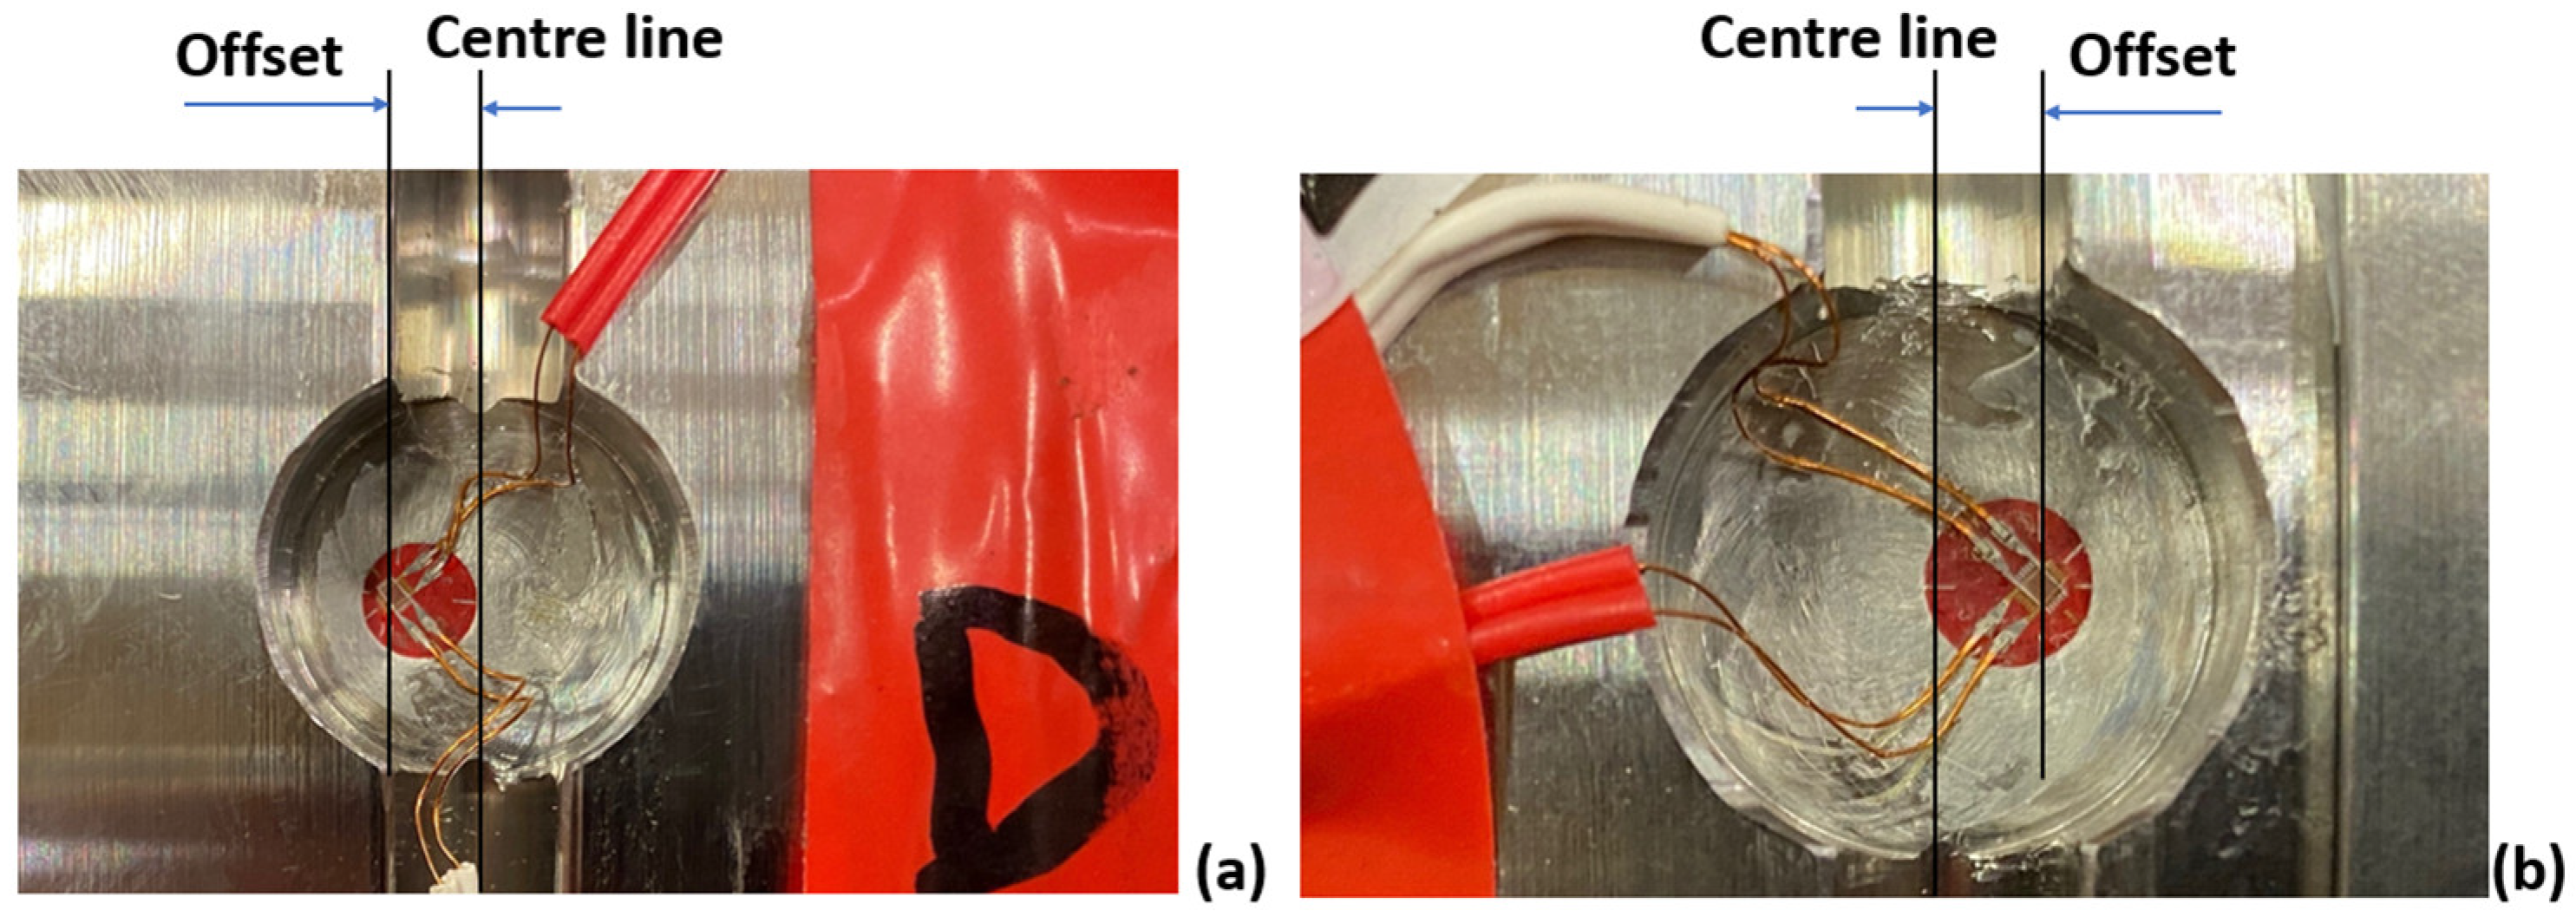
The cross-sectional shear stress area was adjusted (increased) to compensate for the strain gauges that were placed slightly offset to the ideal smallest cross-sectional area represented by the center line, as illustrated in
Figure 8, for calculation purposes. The standard pin for tests 1 and 2 had a calculated average cross-sectional area below the strain gauges of 4.956 mm
2, and an expanding pin area of 4.589 mm
2, while the minimum cross-sectional area at the center of the groove was 4.162 mm
2 for both pins when considering the strain gauge pocket areas. The loads in the calculations and tests were applied in steps of 100 kN, from 100 to 500 kN, and the shear modulus of the pin steel was 78 GPa. A comparison between the measured and calculated strains at maximum load is shown in
Table 3 and
Table 4.
The strains, ε
45°, were measured at the real cross-section (at the offset) of the right-hand end and left-hand end for 0° and 15° pin rotation positions, and the values are shown in
Table 3 and
Table 4. The calculated strain values for average, ε
ca, and maximum, ε
cm, strain at the real cross-section are also given in the same tables. The calculated strain values for the minimum cross-sectional area, at the center line in
Figure 8, are ε
ca = 378 µm/m and ε
cm = 504 µm/m for 0° pin rotation, while the values for 15° pin rotation are ε
ca = 365 µm/m and ε
cm = 487 µm/m, for both pins at both pin ends in tests 1, 3 and 5.
The applied types of strain gauges compensated for and eliminated the effects of the elongation or compression of the pin, due to, for example, changes of temperature, but a reduction in measured values was expected when the pin rotated. A pin rotation of 8° will normally result in approximately a 1% reduction in measured strain value, and 15° rotation results in approximately 3.4% reduction, according to the following formula: %reduction = (1 − cos(α)) × 100%, where α represents the rotation angle.
4. Discussion of Results
Severe joint wear and other damages can be expensive to repair, especially if the repairs must be performed outside of planned service and maintenance periods, and in addition they cannot always be performed on-site due to different restrictions or a lack of necessary tools. A long or complicated repair procedure or process can also shut down or reduce the production over a period, which can be the costliest consequence of the repair operation. Thus, the proposed repair procedure in this article aims to reduce the operational downtime in relation to the repair of the joint outside the planned service and maintenance stops, and prepare the joint to operate as normal until the next planned repair period. The repair procedure could also be applied as part of a planned repair, depending on the different companies’ maintenance and operational requirements, statutory law, regulations and standards, when it comes to mechanical joints and their corresponding machines and equipment.
As part of this study, the measurement of the specific reduction in repair time and downtime by applying the proposed repair procedure compared to the alternative methods and procedures for repairing damaged pin joints has not been done. The values proposed for reduced repair time, and reduced downtime, are thus based on knowledge and experiences derived from different industries, in addition to studies from the literature. The real repair time, costs and operational downtime due to such repairs depend highly on the type of industry, the types of machines, the type of break-down or damage, and in addition, the type of service and maintenance regime the operators of the machines are following. Several attempts have been made to develop different models to predict costs in relation to unwanted operational stops and unplanned downtime.
For instance, Edwards et al. [
36] developed a three-staged model to predict hourly downtime costs of tracked hydraulic excavators that operated in the UK mining industry, where the first stage predicted the excavator cycles, the second predicted cost per hour, and the third gave an indication of the break-down cost based on the two previous predictions. Vorster and De La Garza [
37] presented a model that was divided into four categories, which could quantify the consequential costs of downtime and the lack of availability of the machines. These were (i) the associated resources impact (ARI), which refers to costs that occur when a failure in one machine requires resources that are occupied elsewhere, or a negative impact on the productivity of one or several other machines, (ii) lack of readiness (LOR) penalty costs, if such exist, (iii) service-level impact (SLI) costs that represent more costly operations for machines working within the same work-group as the one that failed, and (iv) the alternative method impact (AMI), where a standard machine or vehicle may be forced to do the task instead of the specialized one that failed. Tignibidin et al. [
38] developed algorithms for machine learning, with the aim of lowering operating costs by predicting unscheduled downtime, with a focus on oil and gas drilling and production facilities, where failure during drilling operations is important, but also mining activities. Both Scheu et al. [
38] and Seyr et al. [
39] have studied maintenance and repairs in relation to offshore wind farms, where operation and maintenance are significantly more demanding than in operations onshore, and production losses due to downtime are often much more significant than the costs of spare parts and repair actions. Weather conditions and especially the wave heights are factors that limit the accessibility of the wind farm.
The repaired joint (test 5) in this study has not been load-tested dynamically over time, but exposed to external static loads, from 100 kN to 500 kN, in both 0° and 15° rotational positions. The measured pin strains close to each pin-support joint, with repaired support bores, were compared to corresponding measurements from the four other tests:
Test 1—a standard cylindrical pin with identically and distributed support clearance at each end;
Test 2—a standard cylindrical pin with additional heavy wear and ovality at one of the ends (L);
Test 3—an expanding pin with zero operational clearance at both ends;
Test 4—an expanding pin with zero operational clearance at one end (R) and additional heavy wear and ovality at the other (L).
In addition, as part of the study, an investigation was performed on the easiness to (i) perform a 3D scan of the damaged bore surface, (ii) to make a 3D model of the required insert, (iii) to 3D-print the insert, and finally, (iv) to install it in the damaged joint and make the joint fit for further use. The 3D-printed insert was made in four parts for easy fit, as illustrated in
Figure 5c. To make the insert one complete part with one single cut could reduce the risk of the loosening of one small part at the operation site, but in this test case, in a protected situation, it was produced in four parts to ease installation.
The 3D scanning process was relatively easy to perform when the bore surface was accessed from both sides of the support. The surface was cleaned and dried, and point markers were placed on the surface. In addition, the surface was sprayed to derive a matte white layer for the scanning tool to register the topography of the bore surface as accurately as possible. The 3D scanning process can obviously be more challenging under operational conditions, with humidity, salt, lubrication, and complicated access, compared to a clean and stable university laboratory. A digital 3D model of the insert was designed to fit well to the joint in question, and the final 3D model was inserted into the 3D printing machine for additive manufacturing. The CAD processing and the additive manufacturing can easily be performed at or close to any site where the damaged joint is operating, or at any other site where such 3D tools are available, and the final product can be shipped to its destination. The complete process of scanning, modeling, and printing out the insert can be done on-site, if the required tools and knowledge are available.
The measured strain results from tests 1–5 are shown in
Figure 9,
Figure 10,
Figure 11,
Figure 12 and
Figure 13, for the 0° position, and we also show the percentage change in the strain when the pin was turned 15°, which should cause approximately a 3.4% reduction in measured strain values. An inaccuracy level of approximately ±1% is normally accepted for normal cylindrical load pins, which represents an 8° pin rotation. The errors can also result from the quality or type of strain gauges, the glue, the location of strain gauges, the test equipment and set-up, in addition to possible shifts of the pin position during loading. If applying an incorrect type of glue, the gauge wire might not be able to reflect the real dimension change of the main material. Wear and ovality at the support bore surface will often occur over time, due to heavy and repeating loads, vibrations, corrosion, etc., which again results in inaccuracy in the measurements of a standard cylindrical load pin. An expanding load pin can reduce or eliminate the inaccuracy due to unwanted movements in the pin during operation, due to its capability to wedge and lock the supports. In this investigation, the bore and pin production tolerances before any wear were H7/h7.
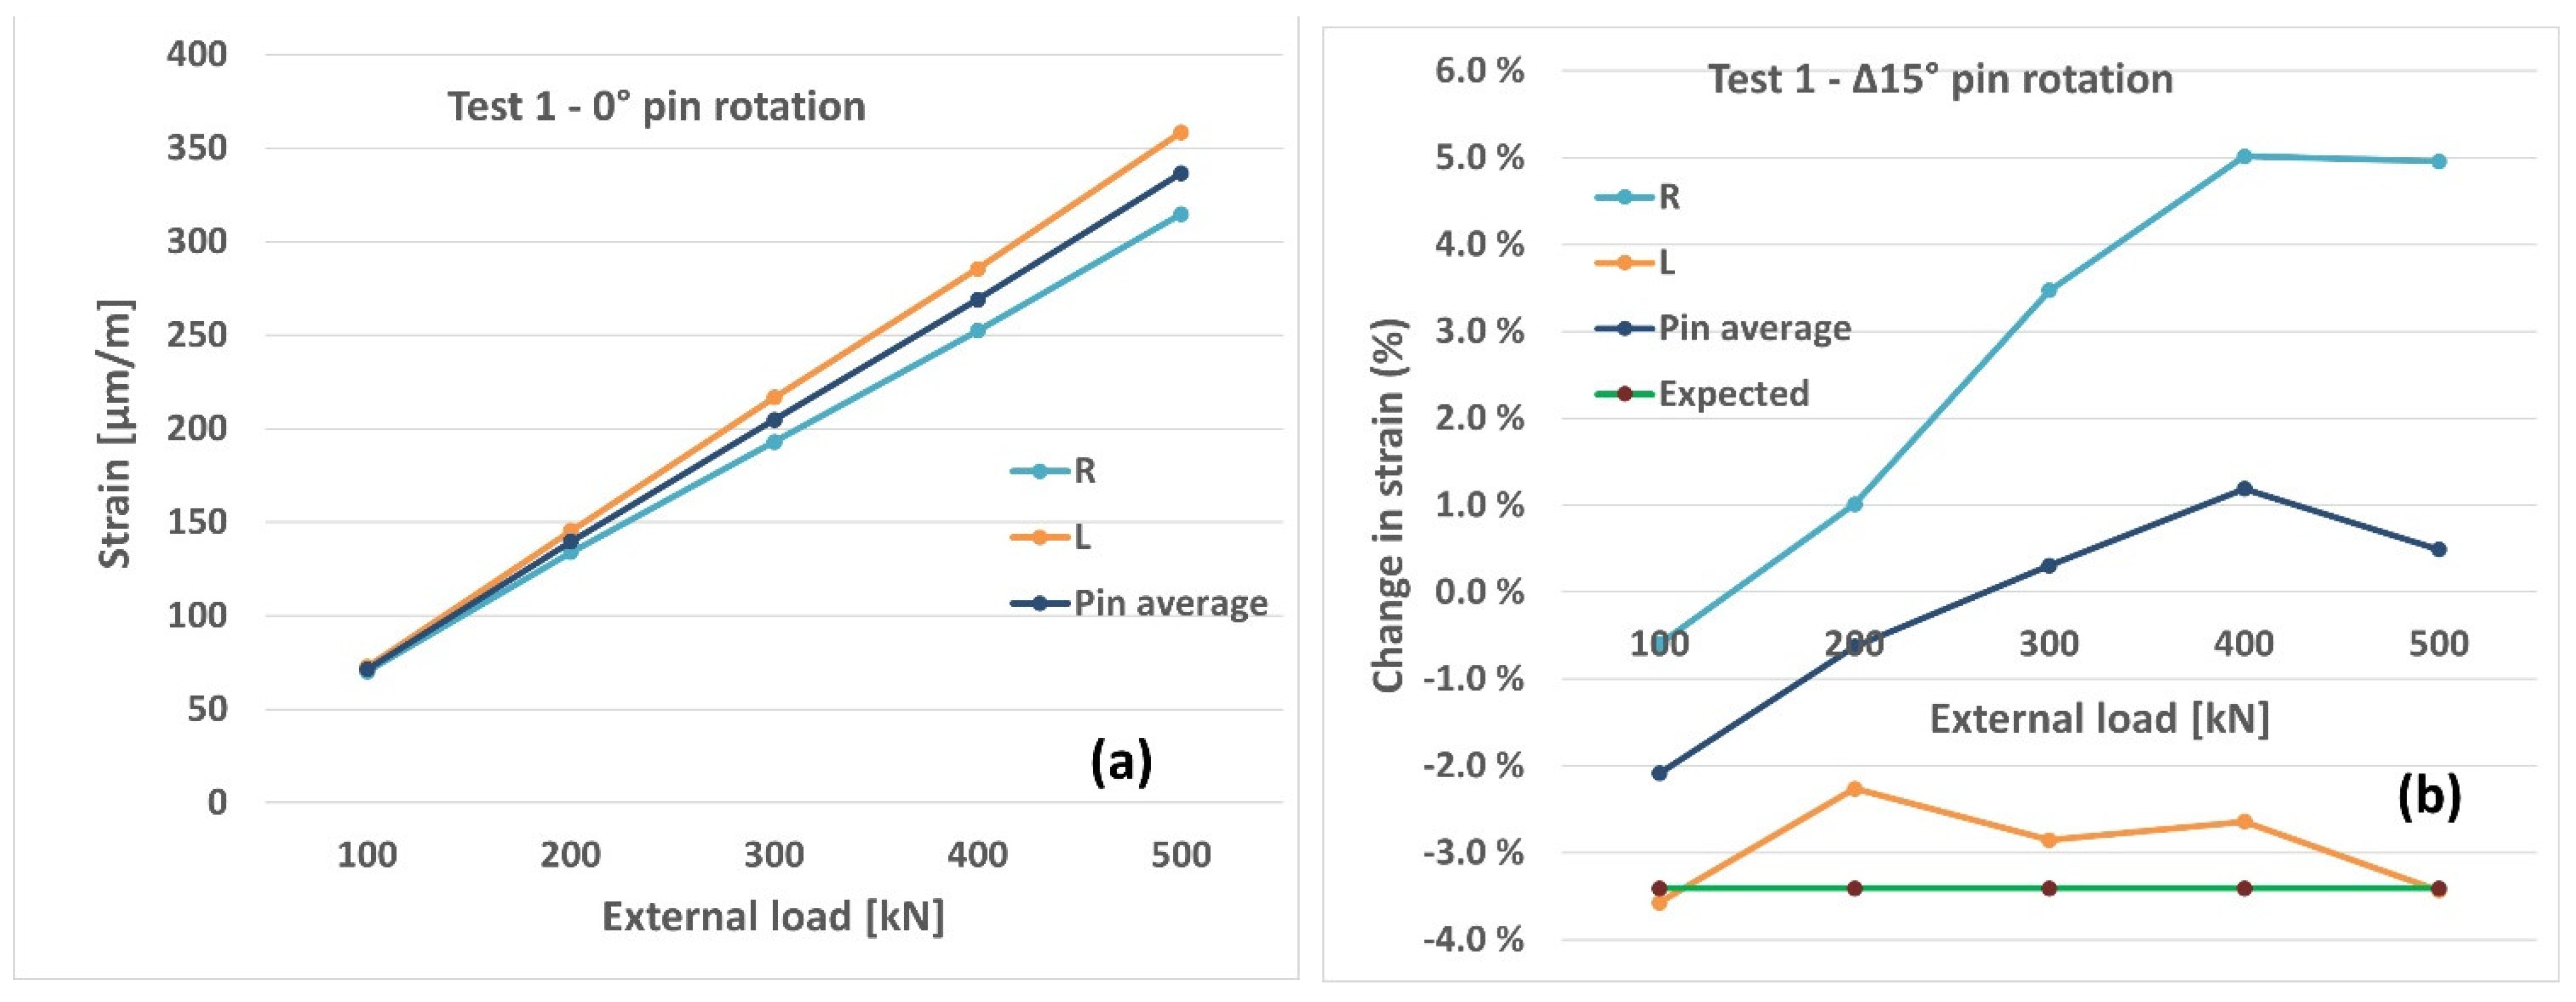
Test 1 reflects a 0.9 mm diameter difference between pin and bore. This could represent both a wide installation clearance, which involves an even and identical wear on the two supports, and a normal joint situation. The results in
Figure 9a illustrate the measured strains at the right and left pin ends for 0° pin rotation position, and
Figure 9b shows the percentage changes in strain values after the pin has turned 15°. At 0° position the maximum strain of 359 [−] is seen on the right-hand side, which is 14% more than the left-hand side. For the 15° position the strain difference between the two pin ends decreased to 5%. The average pin strain value at 500 kN load increased 0.5%, instead of the expected decrease of 3.4% due to pin rotation from 0° to 15°. This gives a difference between measured pin average and expected strain values of +3.9%.
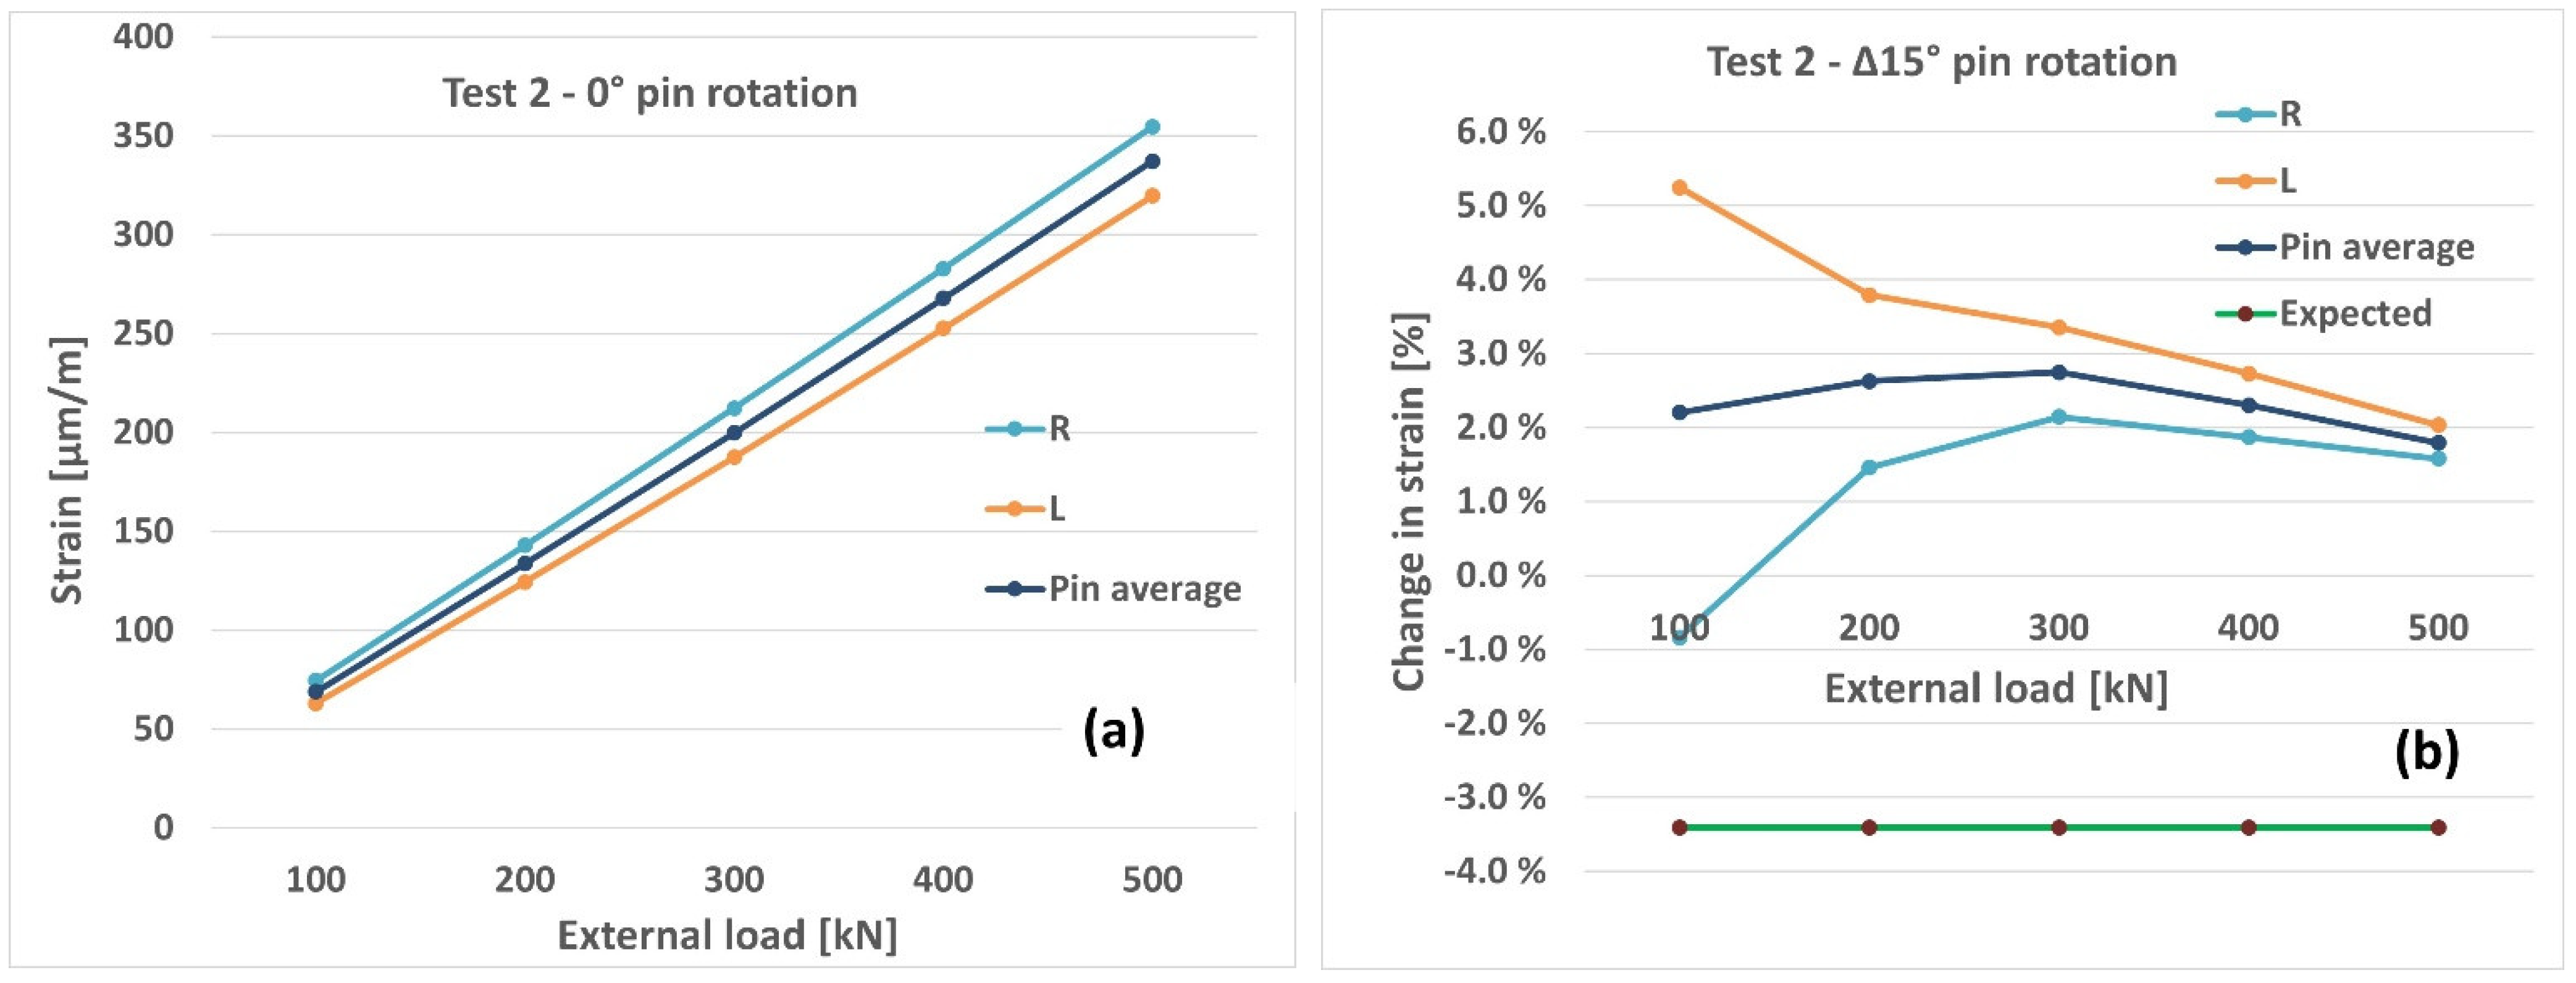
Test 2 (
Figure 10) shows a situation with heavy wear and ovality (0–5 mm) in the left-hand support, and less but more evenly distributed (0.9 mm) in test 1 on the other. Such a wear and ovality pattern might force the pin to lock to the support at the right-hand side, and maybe only slightly touch the support on the left-hand side, and thereby bend and possibly turn when loaded, which resulted in the measured values illustrated in
Figure 10a. We measured a strain value of 355 [−] at the right-hand side, at 0° position, which is 11% higher than on the left-hand side. Thus, the most loaded pin end shifted from left to right compared to the results from test 1. At the 15° position the measured difference was 10%. The pin average strain value at 500 kN load increased by +1.8%, instead of the expected decrease of 3.4%, as the pin turned from 0° to 15°, which gave a difference of +5.2%—see
Figure 10b. Situations with heavy wear and ovality of the supports are common and result normally in higher inaccuracy of measurements, as indicated by the measured results of this study.
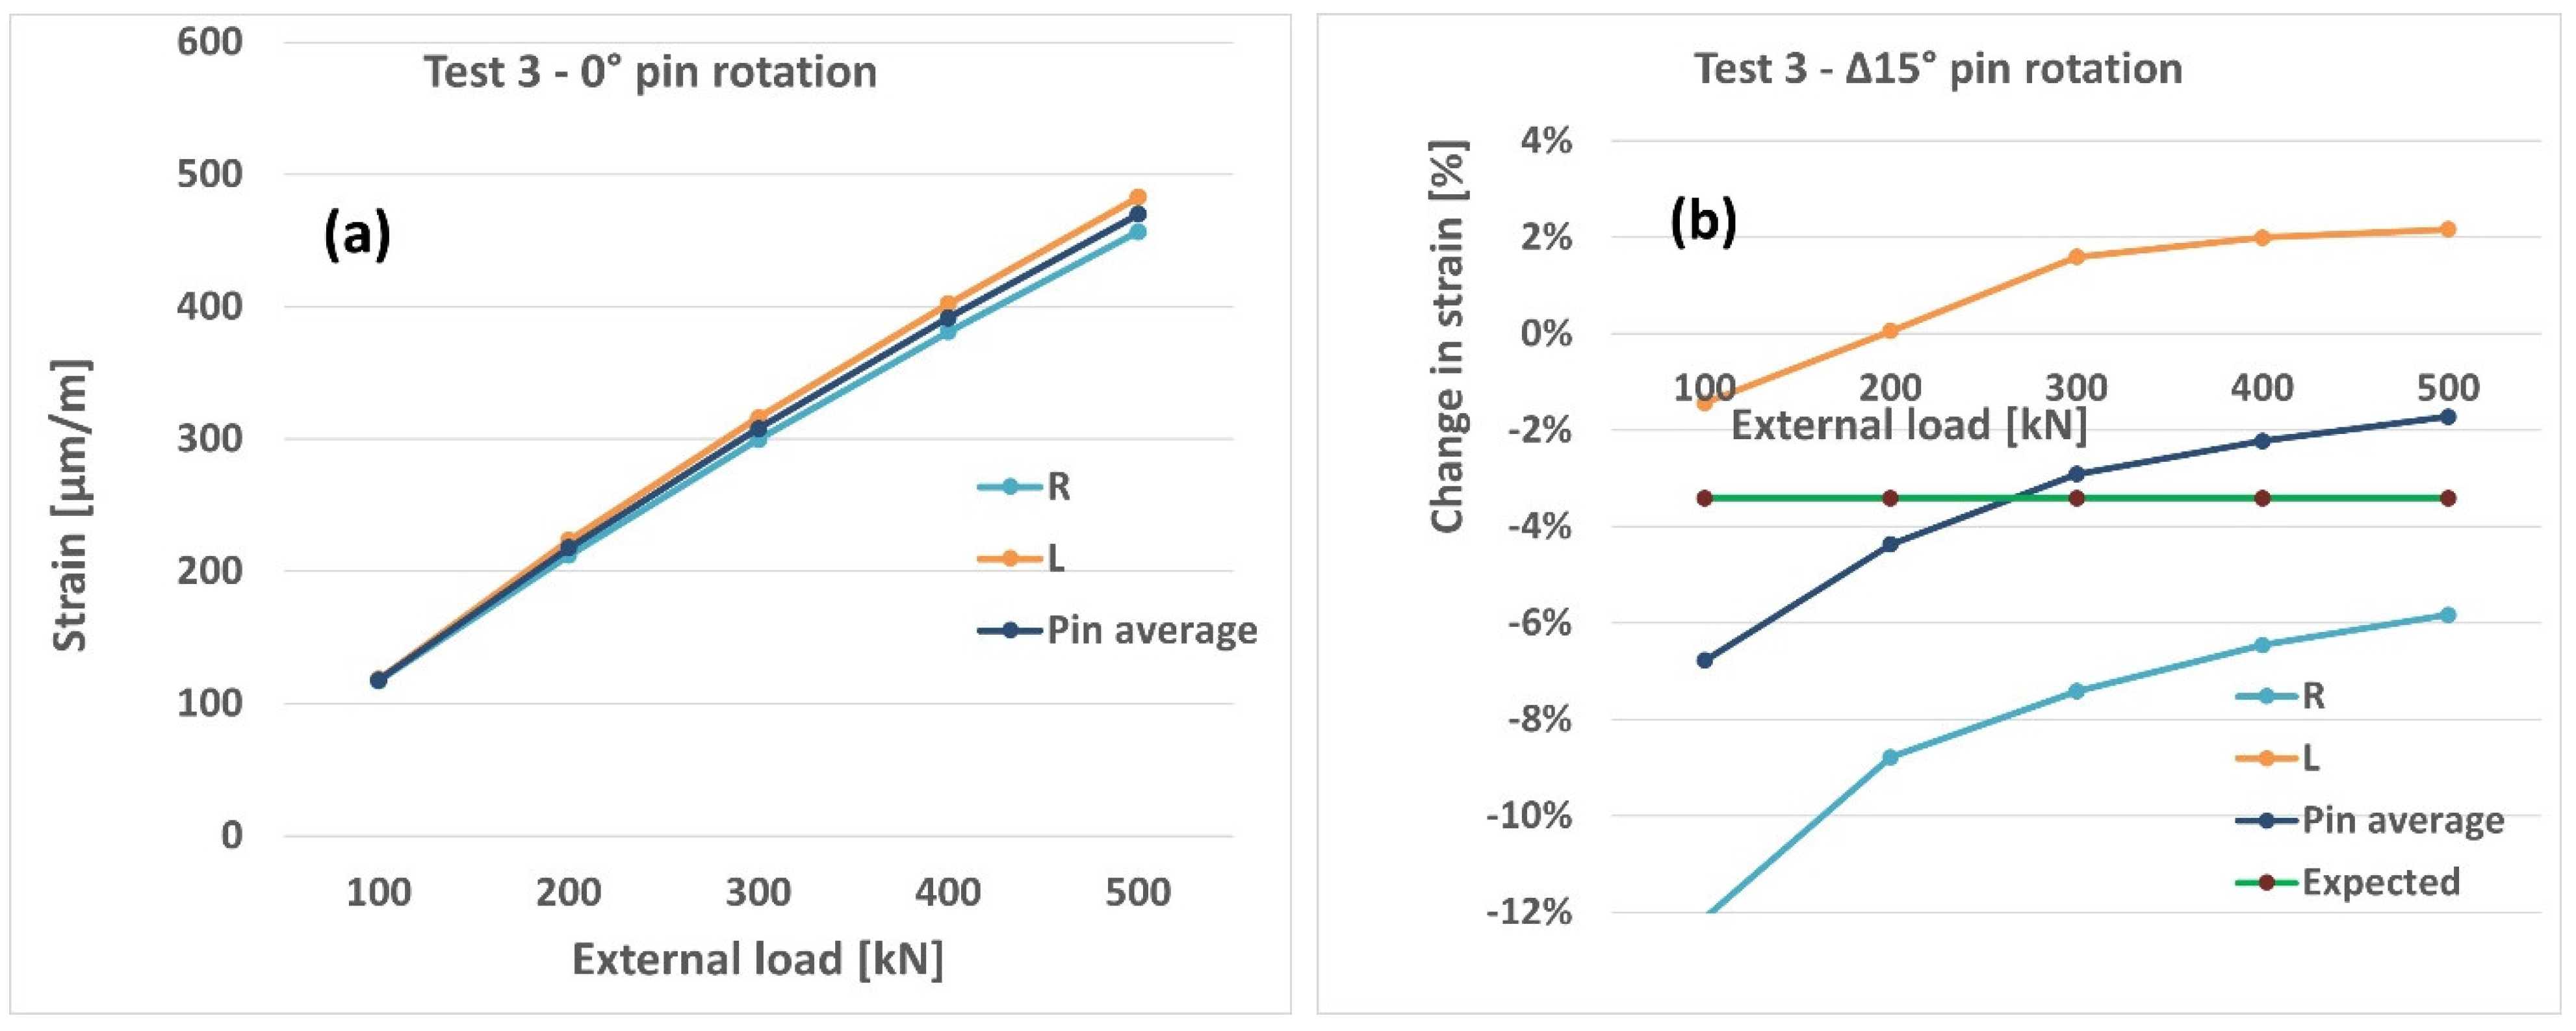
Similar to test 1, test 3 had evenly distributed wear at each end, but in this case an expanding pin was tested instead of a standard cylindrical pin. The expanding pin eliminated the existing diameter clearances of 0.9 mm, down to zero, and locked the pin to both the support bores and prevented any unwanted movements of the pin. The pin average strain value at 500 kN load decreased to −1.7%, which is close to the expected 3.4%, as the pin turned from 0° to 15°, and gave a difference of only +1.7%, as indicated in
Figure 11b. The load distribution between the pin ends varied by 6% and 15% in the 0° and 15° pin positions, respectively, both with the highest strain values at the left-hand side.
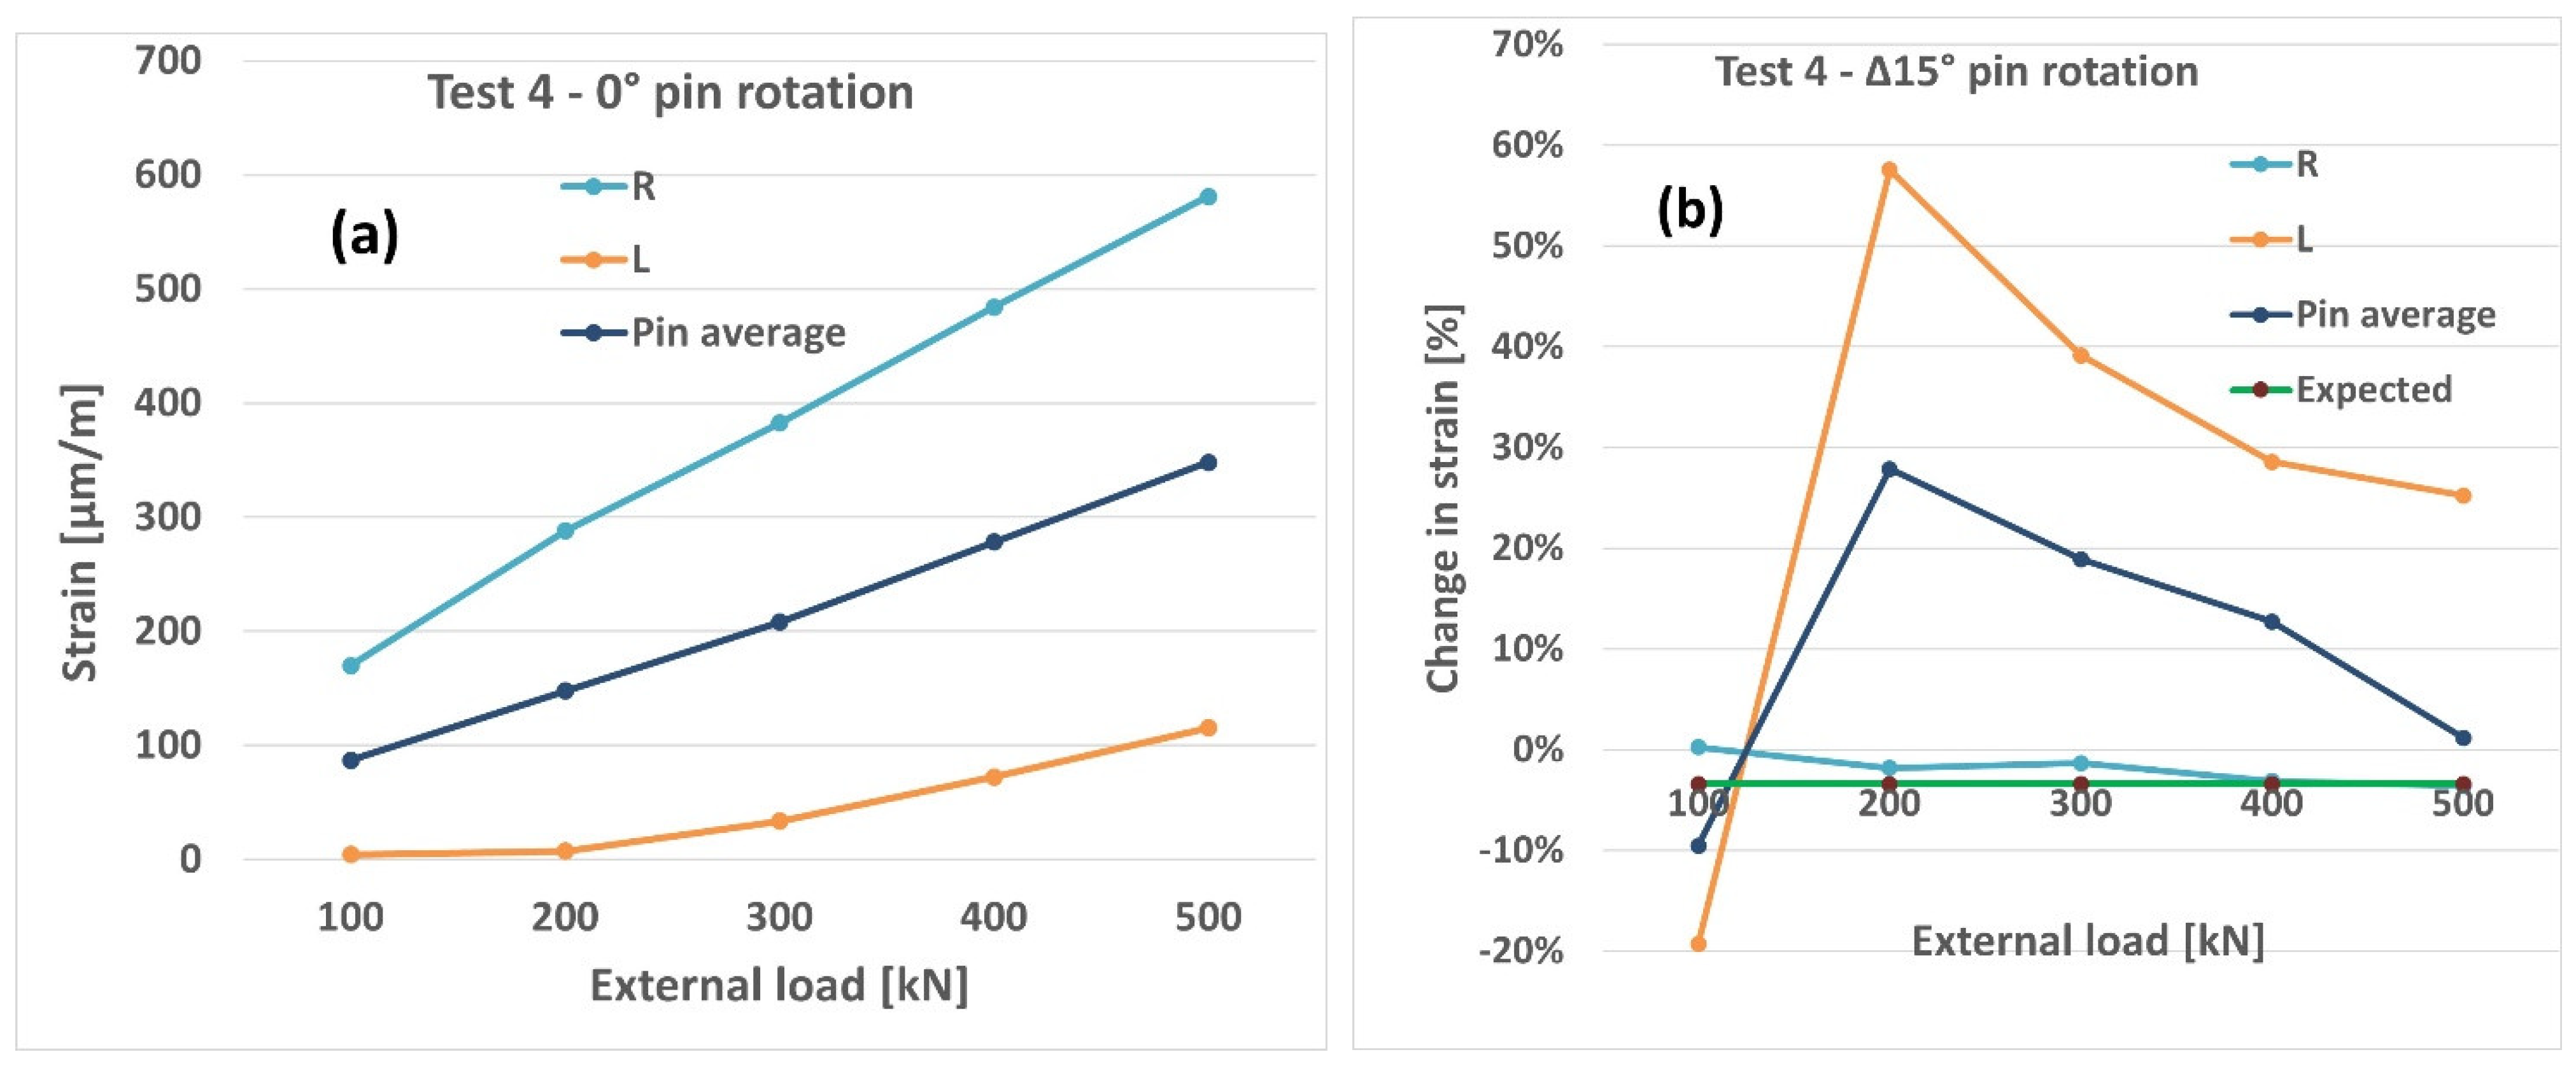
Test 4 was identical to test 2 in terms of exposure to severe wear and ovality (0–5 mm) at one end, i.e., the left-hand support, but with an expanding pin instead of a cylindrical type of pin. The effect of the expanding pin compensated for all the clearance at the pin’s right-hand side, but not all the excessive wear and ovality at the left-hand side. Thus, the pin was fixed at the right-hand side and hung partly loose at the left-hand side. When the pin was loaded with the maximum load, the right-hand side took most of the shear force, approximately five times more than the left-hand side, as illustrated in
Figure 12. The pin average strain value at 500 kN load increased by +1.2%, instead of a decrease to −3.4% as would be expected, as the pin turned from 0° to 15°, which gave a difference of +4.6%—see
Figure 12b. A major difference in strains between the two ends was measured here, as expected, as one end (R) was fixed to its support and the other (L) hung partly loose.
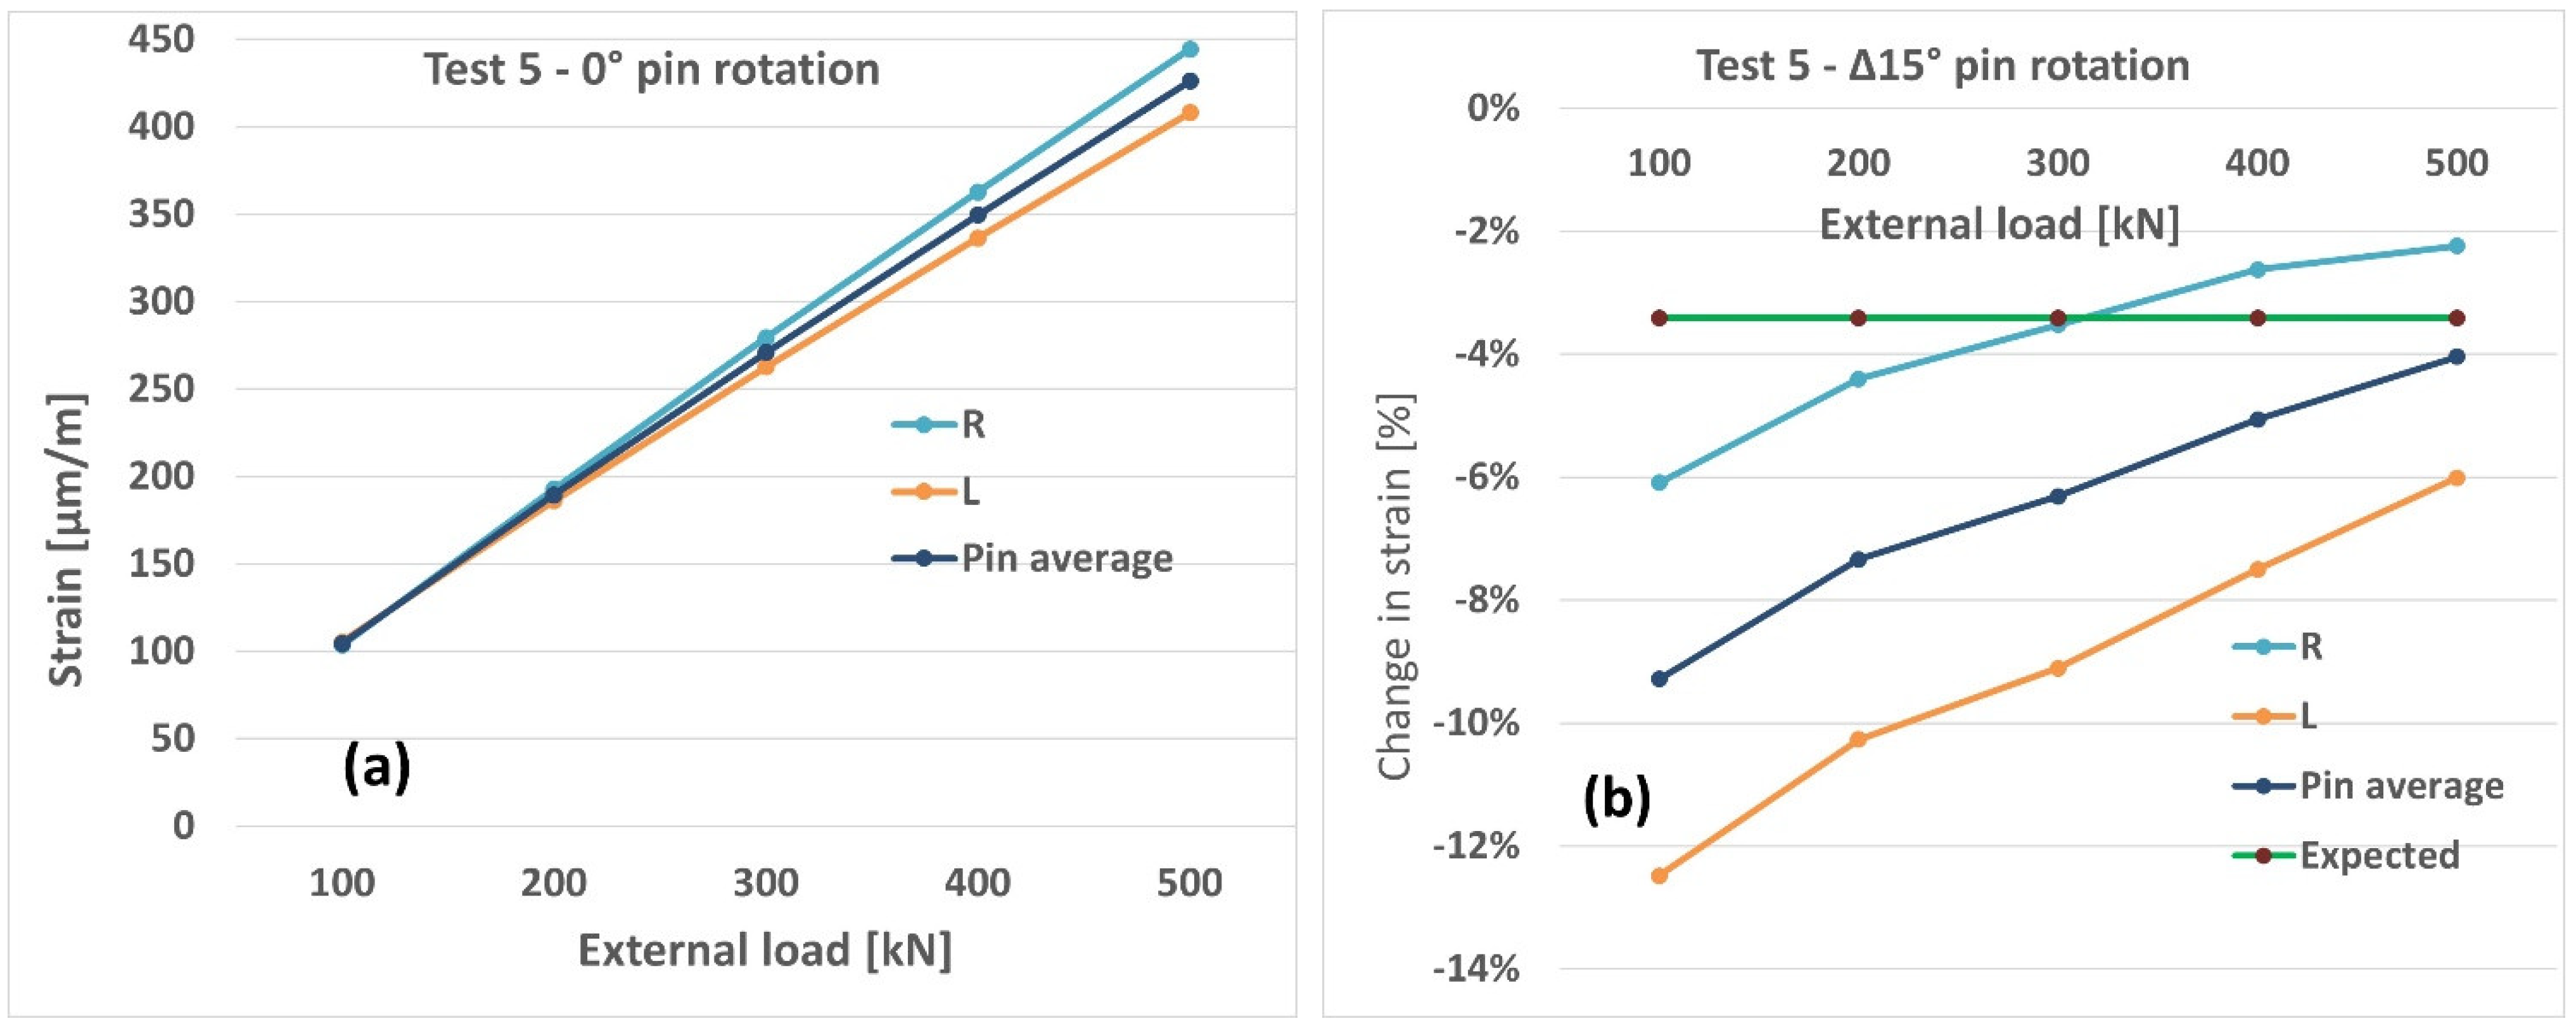
The assembly in test 5 compensated for the excessive wear and ovality by introducing a 3D-printed insert to fit the damaged bore, but with a new, circular and smaller bore diameter (Ø85 mm) that was made to fit the expanding pin. The average strain value at 500 kN load decreased to −4.0%, which is close to the expected decrease of 3.4%, as the pin turned from 0° to 15°, which gave a difference of only −0.6%—see
Figure 13b. The load distribution between the pin ends varied by 9% and 13% for the 0° and 15° pin positions, respectively.
In general, the pin average strain level was lower for the cylindrical pin in test 1 than for the expanding pin in test 3, although the strain gauges compensated for the unplanned temperature changes during testing and any additional axial tensions or compressions in the pin, and since they were placed at the pins’ neutral axis there should not have been any bending effects on the strain values either. The average strain at 500 kN load is in the range 457–483 μm/m at 0° position for test 3, compared to around 315–359 μm/m for test 1 at same pin position. A possible reason could be the inaccuracy or differences regarding where the strain gauges were placed, as illustrated in
Figure 8. The average pin cross-sectional area under the strain gauges was smaller for the expanding pin (4 589 mm
2) in tests 3–5, compared to the cylindrical pin (4 956 mm
2) in tests 1 and 2. In addition, the lengths of the axial bolt holes at the expanding pin ends reached up to where the strain gauges were installed, and could have affected the strain measurements by reducing the total cross-section area, and consequently increase the measured strain values. The measured strain values decreased with the inverse square of the diameter increase, as the cross-sectional area increased with the square value.
The measured strain values at the 0° pin position and 500 kN external load scenario have been compared with the calculated average and maximum strain values, as indicated in
Table 3 and
Table 4, and they are in good compliance. The calculated maximum strain values for the whole pin are in the range of −3% to +26% of the measured values for test 1, 3 and 5. For the 15° pin position, the corresponding values were in the range of −4% to +21%, with smaller differences for the expanding pins in tests 3 and 5.
When a joint support bore with a cylindrical pin is damaged, a decision on what to do must be taken, including:
No stop of production: continue with the damaged support (type test 2) until the next service stop. In this case, a severely damaged support could lead to pin breakage, a damaged machine, and put people in danger;
Long stop of production: stop production to perform the necessary repair and continue with a new standard cylindrical pin (type Test 1). If severe wears and ovality have occurred, they will occur again after repair, under the same operational conditions;
Long stop of production: stop production, perform the necessary repair and continue with a new expanding pin (type test 3). The expanding pin will prevent the wear process from repeating;
Short stop of production: make a short stop of production and change from cylindrical to expanding pin (type Test 4), if the wear is not severe, but if the wear is severe the expanding pin will not wedge lock sufficiently at the damaged area;
Short stops of production: make a short stop of production to 3D scan the damaged surfaces, and later, another short stop to introduce the temporary repair insert and continue with a new expanding pin (type Test 5), if the wear is severe. The joint and the machine will continue to operate until the next planned service stop, or longer.
A cylindrical pin will often damage the support bore and create increased play over time. If the same pin, or a new cylindrical pin, is installed into the same joint after the repair of the support (as for Test 1), the same problem with increasing play could easily repeat. Karlsen and Lemu [
1] used the Hertz formula for contact pressure to calculate the contact width, and the maximum and average contact pressure, for a cylindrical pin with (a) h7 tolerance, and (b) play on the bore diameter, and for an expanding pin, as a function of an increasing external load. The calculations show a rapid increase in contact pressure when the play between a cylindrical pin and the bore increases, while for an expanding pin, the play stays constant at zero. The contact stresses for the expanding pin change linearly with the changing external load because the contact width is constant, but at zero external load this pin will still have a certain contact stress due to the wedge pressure from the expanding end-sleeve. For the cylindrical pin, the contact width increases with an increasing external load, which results in a less steep increase in the total contact stress compared to an expanding pin, but only as long as there is no wear at the supports. Even a small wear rate increases the clearance between the cylindrical pin and the bore, and as a result the contact area decreases, and the contact pressure increases, leading to even more increase in the wear rate (as indicated in test 2). As a result, the contact stresses increase to a level much higher than for an expanding pin assembly, with additional stick–slip situations.
5. Conclusions
When a cylindrical pin joint is damaged by wear and ovality, a decision must be taken as to whether to continue without taking any action, or acting and performing some repair procedures. Five different options were investigated by loading the pin statically and measuring the pin strain close to each support, in two different pin positions, 0° and 15°. The measured and calculated strain values at those pin positions for tests 1, 3 and 5 were compared when loaded externally from 100 kN to 500 kN, in steps of 100 kN, and these tests were those with equal operational clearances between the pin and support at each end of 0.9 mm, 0 mm and 0 mm, respectively.
The standard cylindrical pin in test 1 showed +26% and +21% difference between the calculated maximum and measured pin strain, for the 0° and 15° pin positions, respectively, while for the expanding pin in test 3 the numbers were −3% and −4%, and for test 5 they were +8% and +8%. There seems to be good correlation between the calculated maximum strain values and the measured ones, especially for the expanding pin tests 3 and 5.
The differences in measured strain between each pin end, or the gap, were the highest for test 4 (damaged support), as expected since, that pin was fixed at one end and hung loose in the other. The smallest differences were noted for the three tests with no ovality at supports—tests 1, 3 and 5, with ±6%, ±3% and ±4%, respectively, of the average pin strain values. It can also be seen that the reduction in strain value when turning the pin from the 0° to the 15° position was close to the calculated 3.4%, especially for tests 3 and 5. For test 5 the result was only 0.6% away from the expected value, compared to 1.7% for test 3, and 3.9% and 5.2% for tests 1 and 2, respectively.
Based on the tests and analyses performed in this investigation, it can be concluded that the repair procedure of a damaged support bore, including the installation of a 3D-printed bushing, can be a viable solution. This is relatively easy to perform, and the 3D-printed insert seems to fit very well with both the damaged bore and the expanding pin. In addition, based on the results of this investigation, the tests of the pin with the repair insert (test 5) do not show any negative or weak results compared to the other tests, but rather the results are stronger. The procedure requires one short stop in operation for the 3D scanning of the damaged surface, and another short stop at a later stage to install the 3D-printed repair insert and a new expanding pin system. The machine can be operated during the production of the repair insert and pin system. The alternative is typically a longer stop in operation, which includes the time of removing the old pin, repairing the worn area, and installing the new pin, during which downtime due to the repair of wear damage can be extensive.


