1. Introduction
The analysis of the behavior of sand under the influence of dynamic forces has become an interesting challenge for both geotechnical and civil engineering. There are many numerical simulations that have been developed by scientists to predict the mechanical behavior of sand by describing loose material as a continuous medium. These methods have an advantage over the particle method due to their greater computational efficiency; however, experimental tests must usually calibrate the parameters of the constitutive models. The results of the numerical calculations that were intended to complement the test results and develop the ground–tire interaction models have also been presented.
Models based on discrete elements in mesoscale require more computing power, but their use is growing as they are now an interesting alternative since computing power has increased. The discrete-element method (DEM) is one of the meshless methods and has been widely used in the analysis of loose materials and the tractive performance of wheels [
1,
2,
3,
4]. Material in the form of loose spherical rigid elements, with elementary Young’s modulus and the density of quartz, reflects the behavior of sand during transport [
5], and can simulate driving on sand and in sandstorms, as well as fracture [
6,
7] or explosions of unmarked explosives. The dynamics of rigid bodies and kinematic pairs have been applied in the form of revolute joints between a rigid wheel and a rigid axis that were modeled using the FEM method. Spherical joints between the rigid axis of a wheel and a winch allow the forces to be compared with the data that was obtained from experimental research. Maps of the displacements of sand elements after the wheel had passed over them were also obtained. Due to the high computing power needed for the DEM method, the simulation was carried out using the parallel computing technology MPI.
The DEM method was implemented in the LS-DYNA [
8,
9] environment by Hallquist in 2015; it is based on a model that was developed by Cundall and Strack in 1979 [
10]. The spectrum of the method is wide, but because this involves the Lagrange method, it entails a long computational process. In the LS-DYNA environment, the DEM method has been implemented as an explicit method where the accuracy of the result depends on the time step. For these calculations, parallel calculation algorithms are used [
11]; however, to reduce the computational time, the complexity of the models were minimized by increasing the size of the individual grains [
1] or by reducing the volume of sand.
Since the models of the surface of a wheel have been widely investigated for both on-road conditions and off-road performance for movement in a straight line, there is a need for a universal and reliable assessment of the traction energy consumption for electric and hybrid off-road vehicles. For example, a wheeled, skid-steered vehicle is used to define the most demanding operations: turning at low speed or when stationary. The optimal design of an electric propulsion system should be based on a complete and accurate assessment of the energy consumption required for the traction effort.
Models of a wheel’s driving dynamics on the road have focused on both the friction and behavior of the rolling wheel. The simple rigid body model introduced by Dahl (1968) [
12] took the behavior of the body of the wheel against the ground into account. Later on, the LuGre bristle model was described by Olsson et al. (1998) [
13] and, as an experimental approach, the Magic Formula model was introduced by Pacejka et al. (1989) [
14]. Due to the experimental tire dynamics in the models, a significant improvement in both the testing and development of vehicles was achieved [
15,
16].
According to Wong (2001) [
17], the deformation of a wheel that is caused by transverse forces has a considerable influence on its rolling resistance. To obtain more satisfactory calculations, several approaches have been used, such as empirical models, spring-damper wheel models, and numerical calculation methods, as described by Sharma and Pandey (1997) [
18].
Bekker (1956) [
19] introduced a method for modeling the stress calculations in the tire–ground contact patch. Bekker’s equation is used to calculate the normal pressure as a function of the sinkage of the tire. According to Sharma and Pandey, the modified Coulomb equation can be used to calculate the shear stress, taking into account the cohesion, strain, and shear strain parameters.
Bekker’s model, and the other methods based on a rigid wheel, have a big disadvantage regarding the impact of tire deformation on the dynamics of a wheel; there is a mismatch in wheel deformation. The models later introduced by Schmid (1995) [
20] take tire deformation into account. The current research methods and interaction models use the finite element analysis method in most cases [
2,
3,
4].
In this article, a more realistic approach to the application of the traction force on the contact surface between the wheel and the soil is presented. The rotation of a non-driven wheel is caused by the movement of the axis and the contact forces. The developed method is able to assess both the longitudinal and lateral forces for a wide range of attack angles of the wheel and it is essential for the calculation of the traction effort of skid-steered vehicles.
2. Materials
During the interaction of the wheel with the surface under road conditions, deformation under a vertical load (steady state), as well as a longitudinal and lateral load (transversal), is considered. Longitudinal forces are the result of the application of the driving torque; these are transverse forces that are generated during cornering. The deformation of the tires, as a result the stress patterns, are strongly related to the load conditions and the construction of the tire.
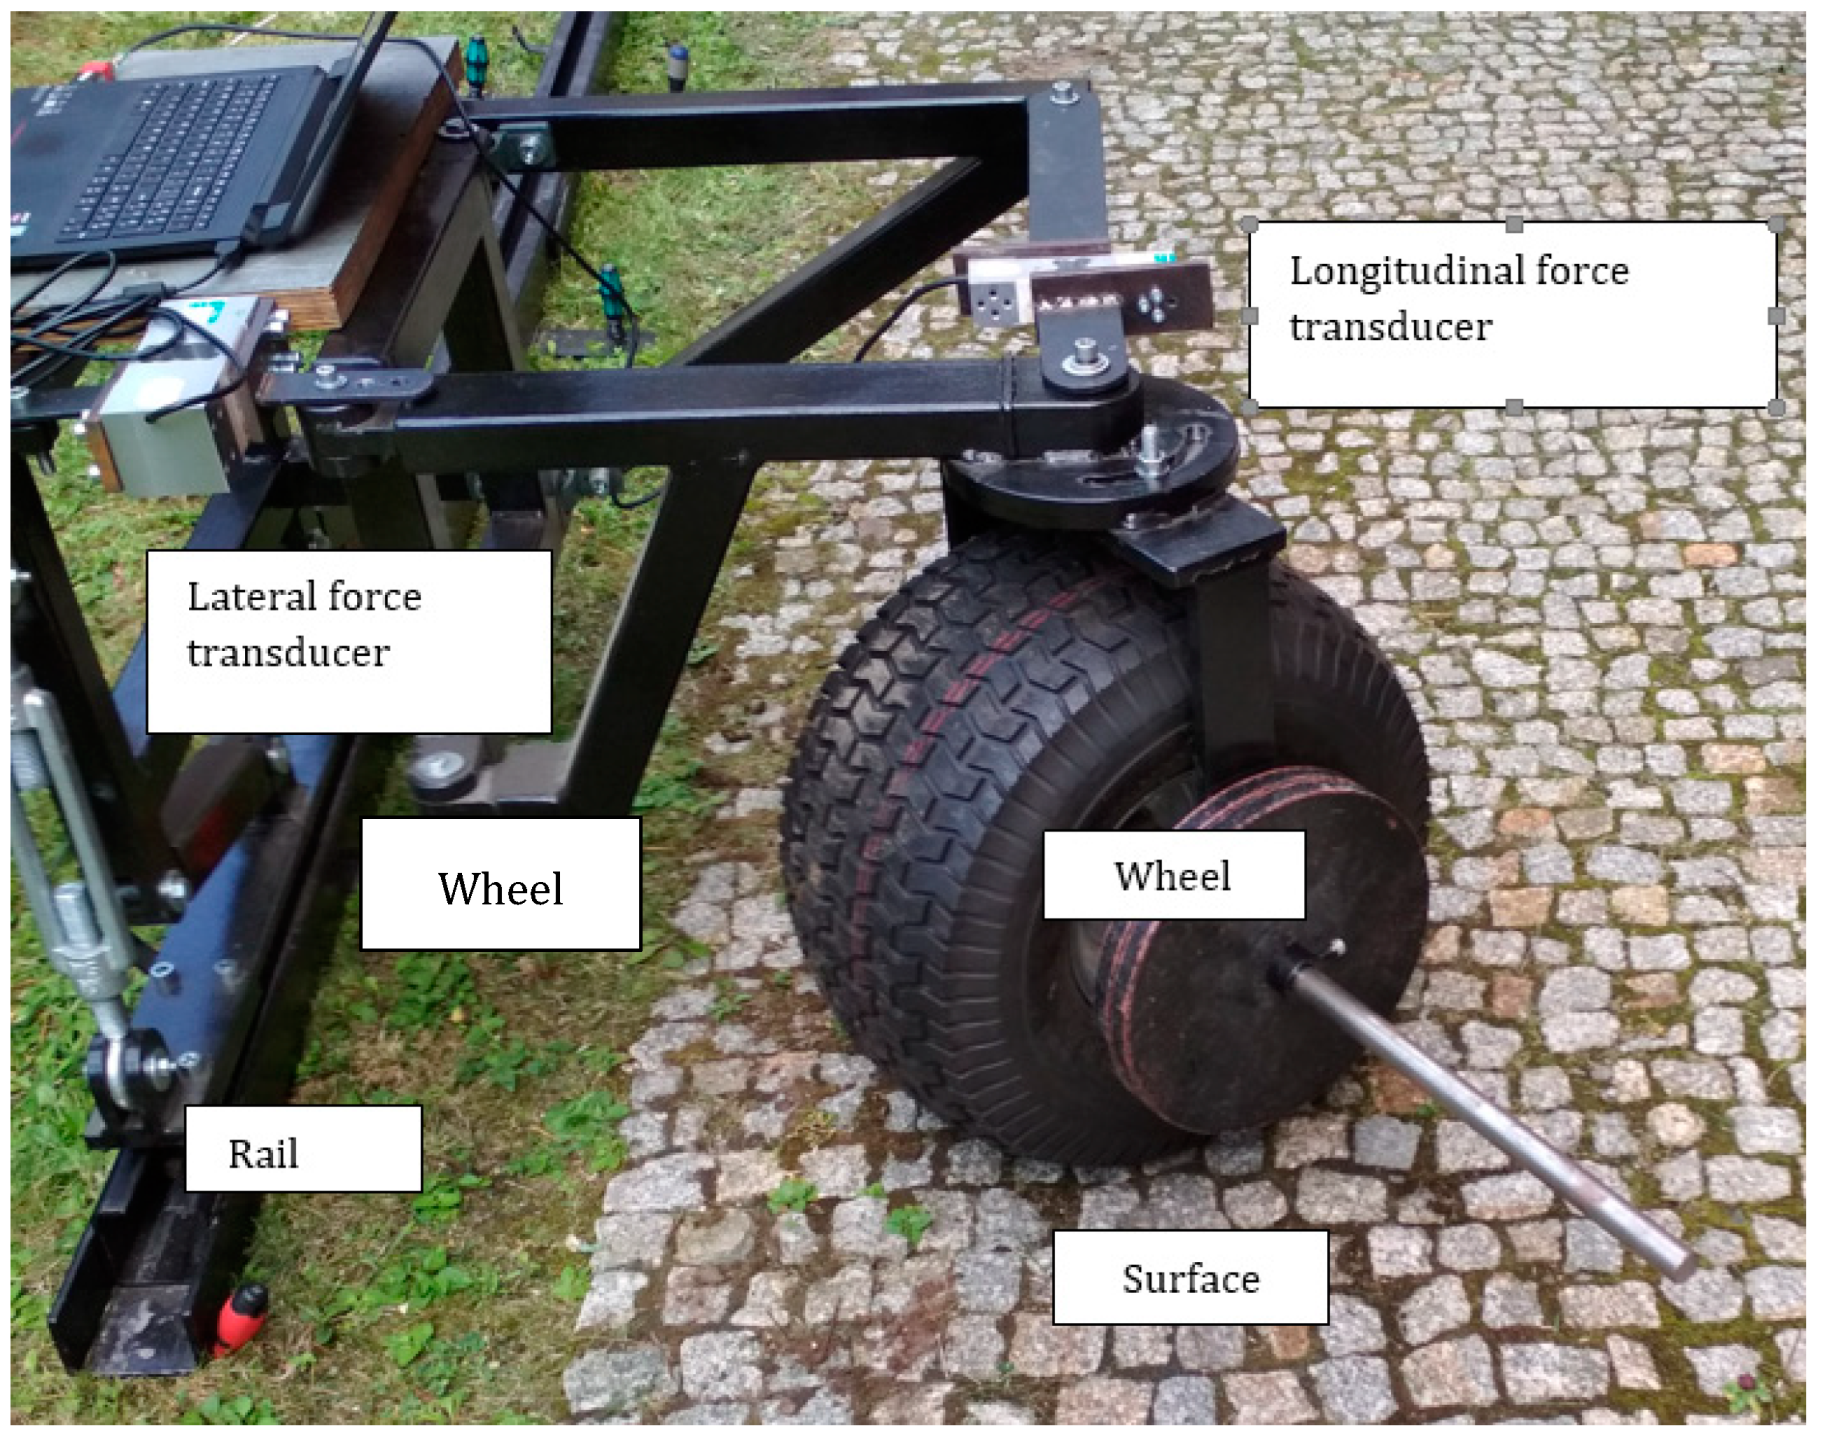
The longitudinal and lateral forces were achieved using the laboratory stand for testing. The configuration of the test facility is shown in
Figure 1,
Figure 2 and
Figure 3, according to the specification in Czapla et al. [
21]. An external electric excitation system was used to propel the wheel along a constrained rail. The wheel’s frame was attached to a cart that moved on the rail. An adjustable fork allowed the wheel’s axis to rotate in order to achieve different angles of attack of the wheel (the difference between the direction of motion and the wheel’s vertical plane of symmetry). As the frame was constrained in two degrees of freedom through the use of rods with force transducers, the lateral and longitudinal forces could be isolated and measured.
The laboratory stand allowed for changes in the following parameters to be achieved: angle of attack, wheel load, wheel pressure, and ground conditions. A standard all-terrain 20 × 10.00 −8” vehicle wheel was used in the test.
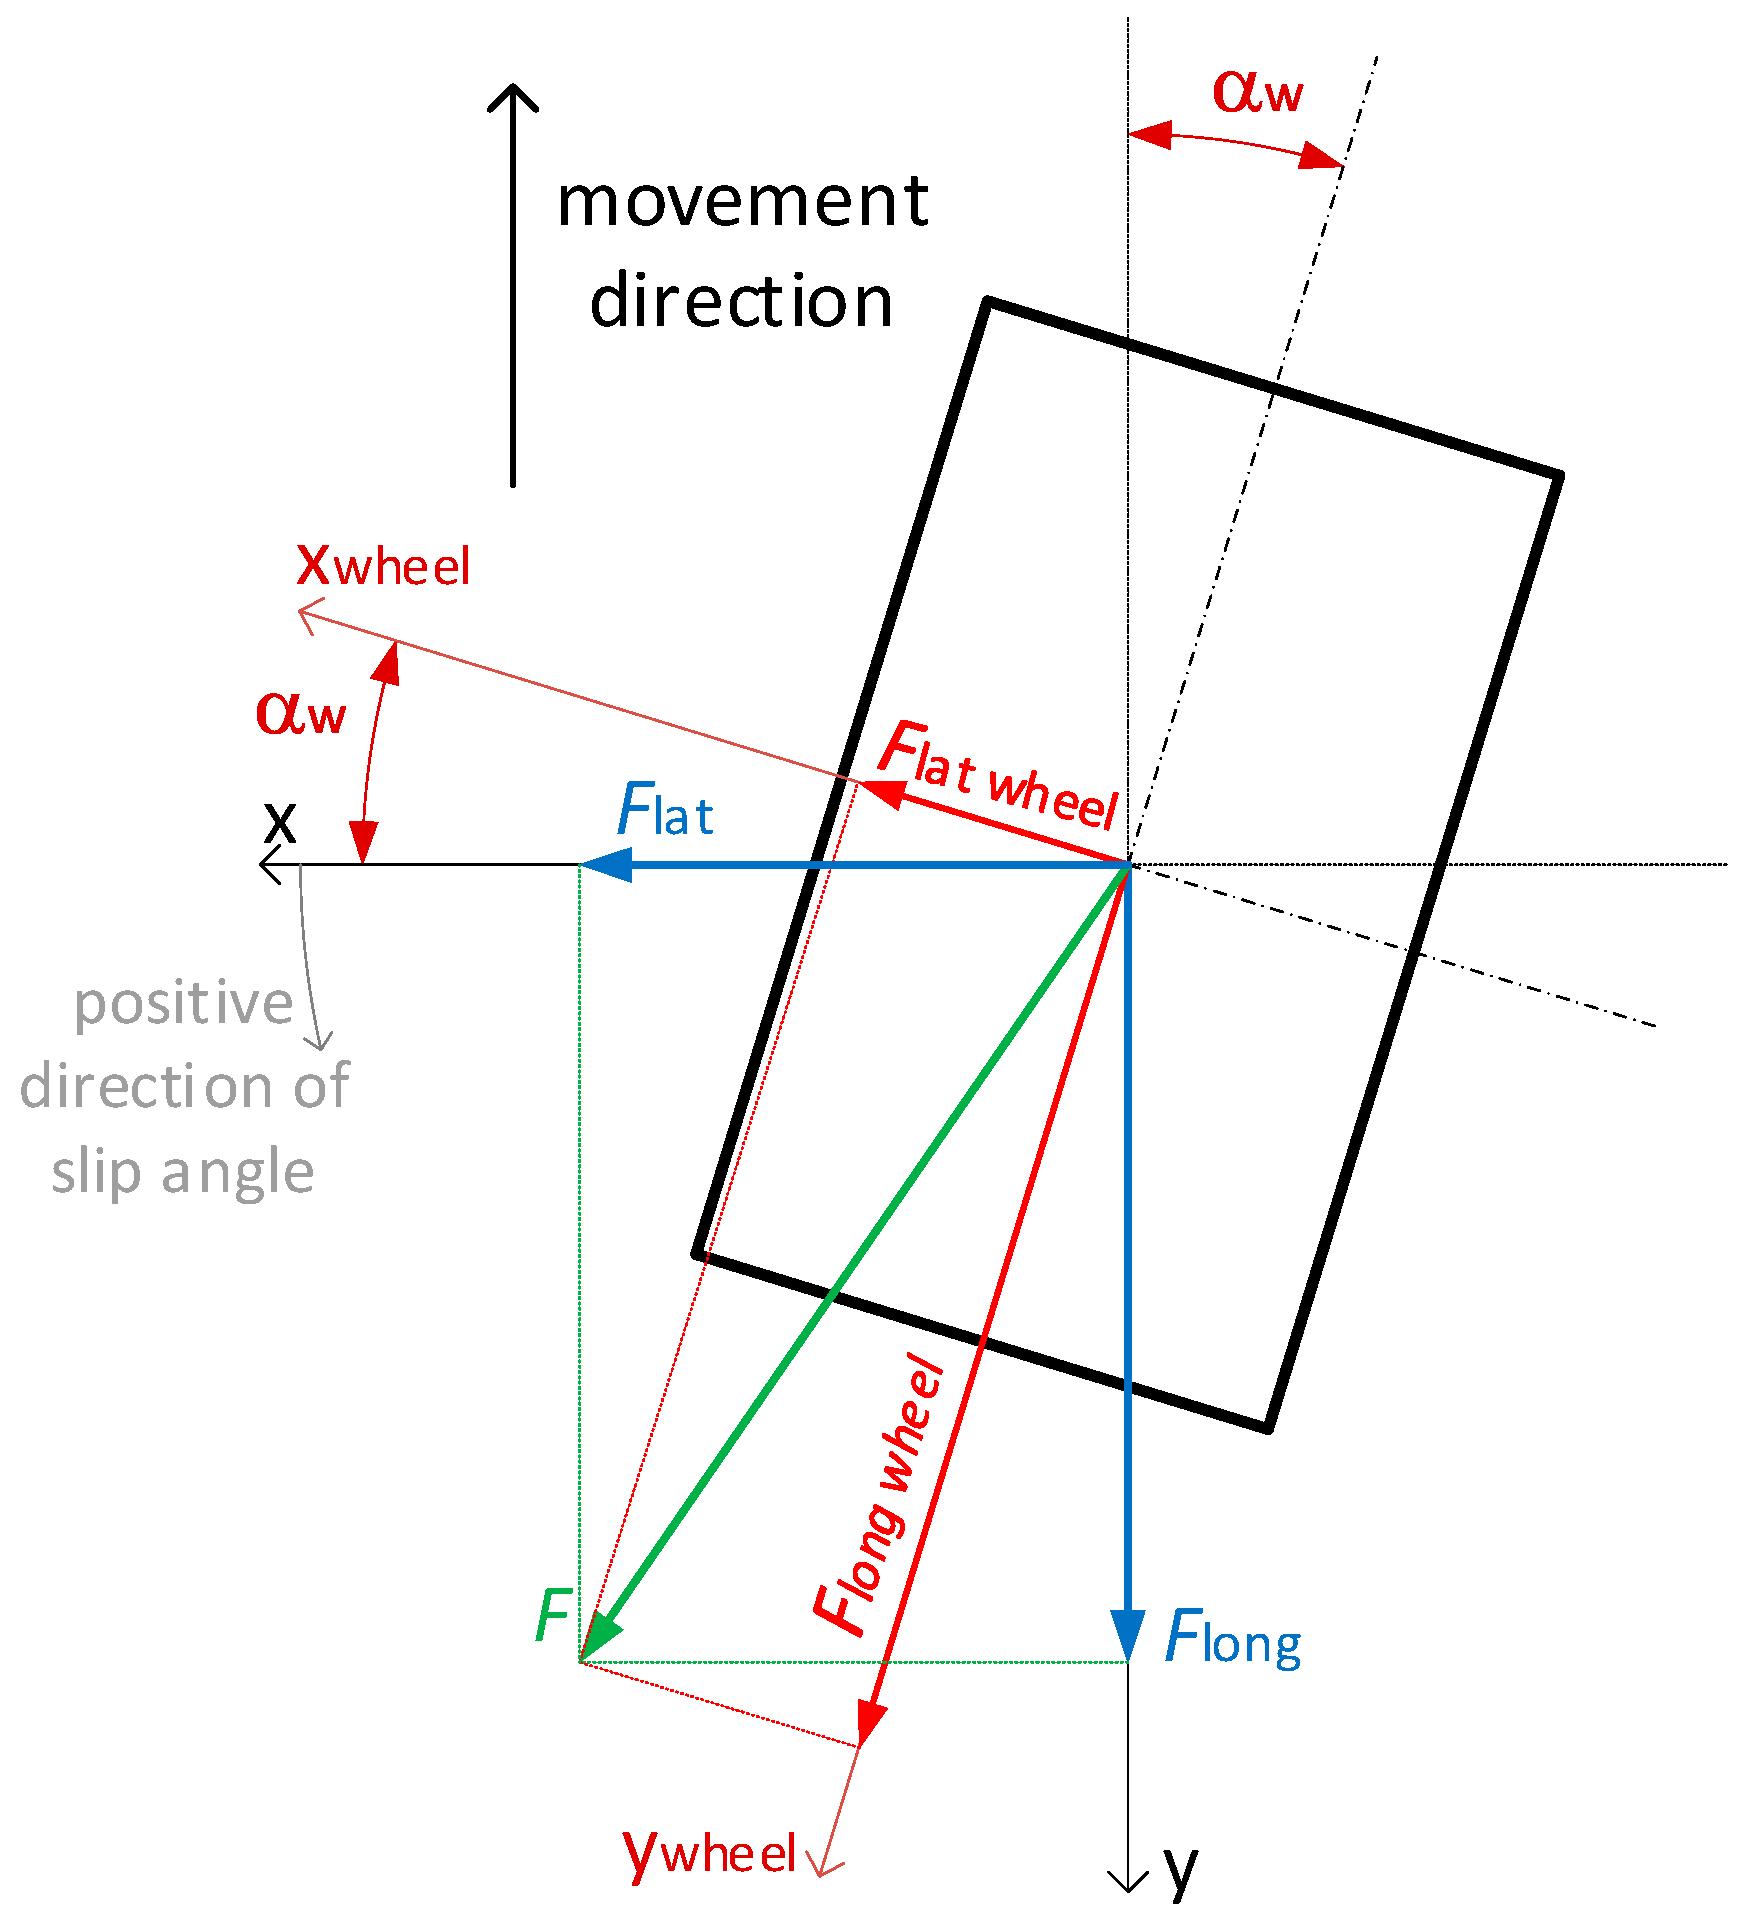
The test results have been presented showing the lateral and longitudinal forces against time for different angles of attack of the wheel for dry sand. The coordinate system that was used for the experiment was taken into account, and further calculations have been shown in
Figure 2. The longitudinal and lateral axes of the wheel were parallel to the vehicle’s axes in the case when the slip angle αw = 0. Measurements were taken for slip angle values ranging from 0 to 90°; for a value of 90°, the lateral and longitudinal axes of the wheel were parallel to the longitudinal and lateral axes of the vehicle, respectively.
In
Figure 2, x and y are the coordinate axes relative to the direction of movement, xwheel and ywheel are the coordinate axes relative to the wheel’s geometry, Flong is the measured longitudinal force relative to the direction of movement, Flat is the measured lateral force relative to the direction of movement, F is the resultant force relative to the coordinate axes of the direction of movement, Flong wheel is the longitudinal component of the force relative to the wheel’s geometrical axes, Flat wheel is the lateral component of the force related to the wheel’s geometrical axes, and αw is the slip angle (between the direction of movement and the wheel’s coordinate system) [
21].
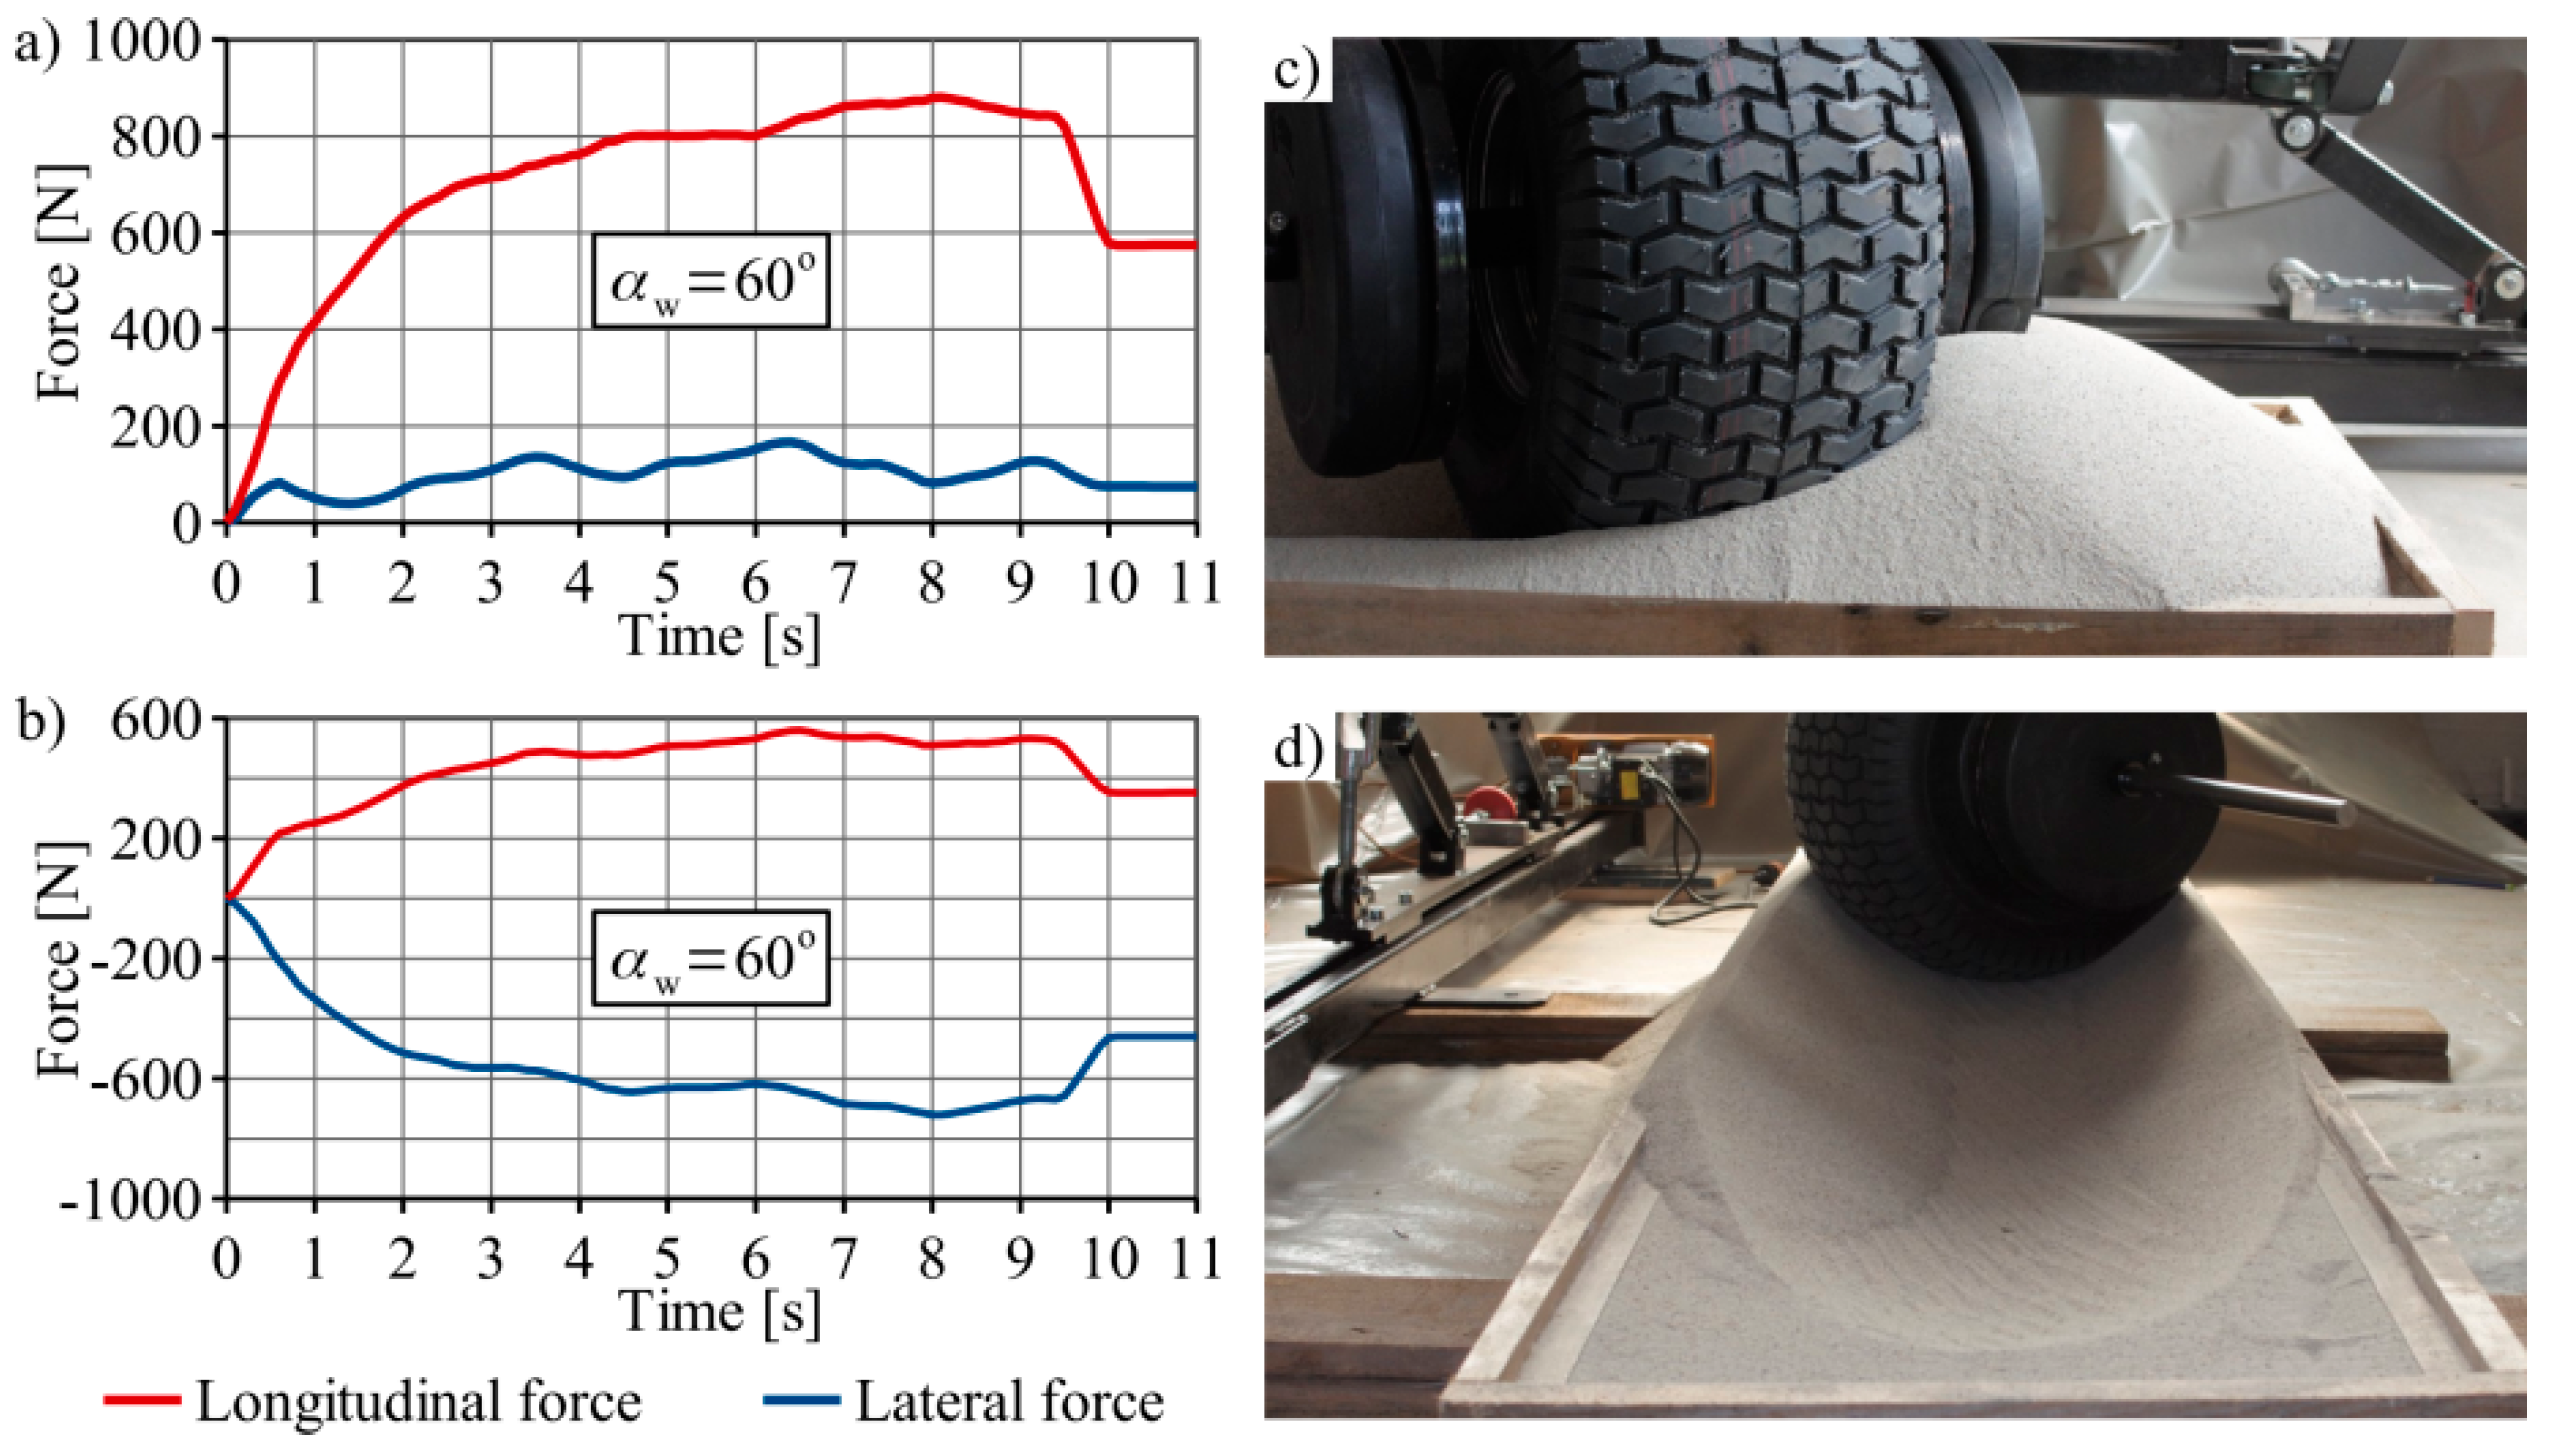
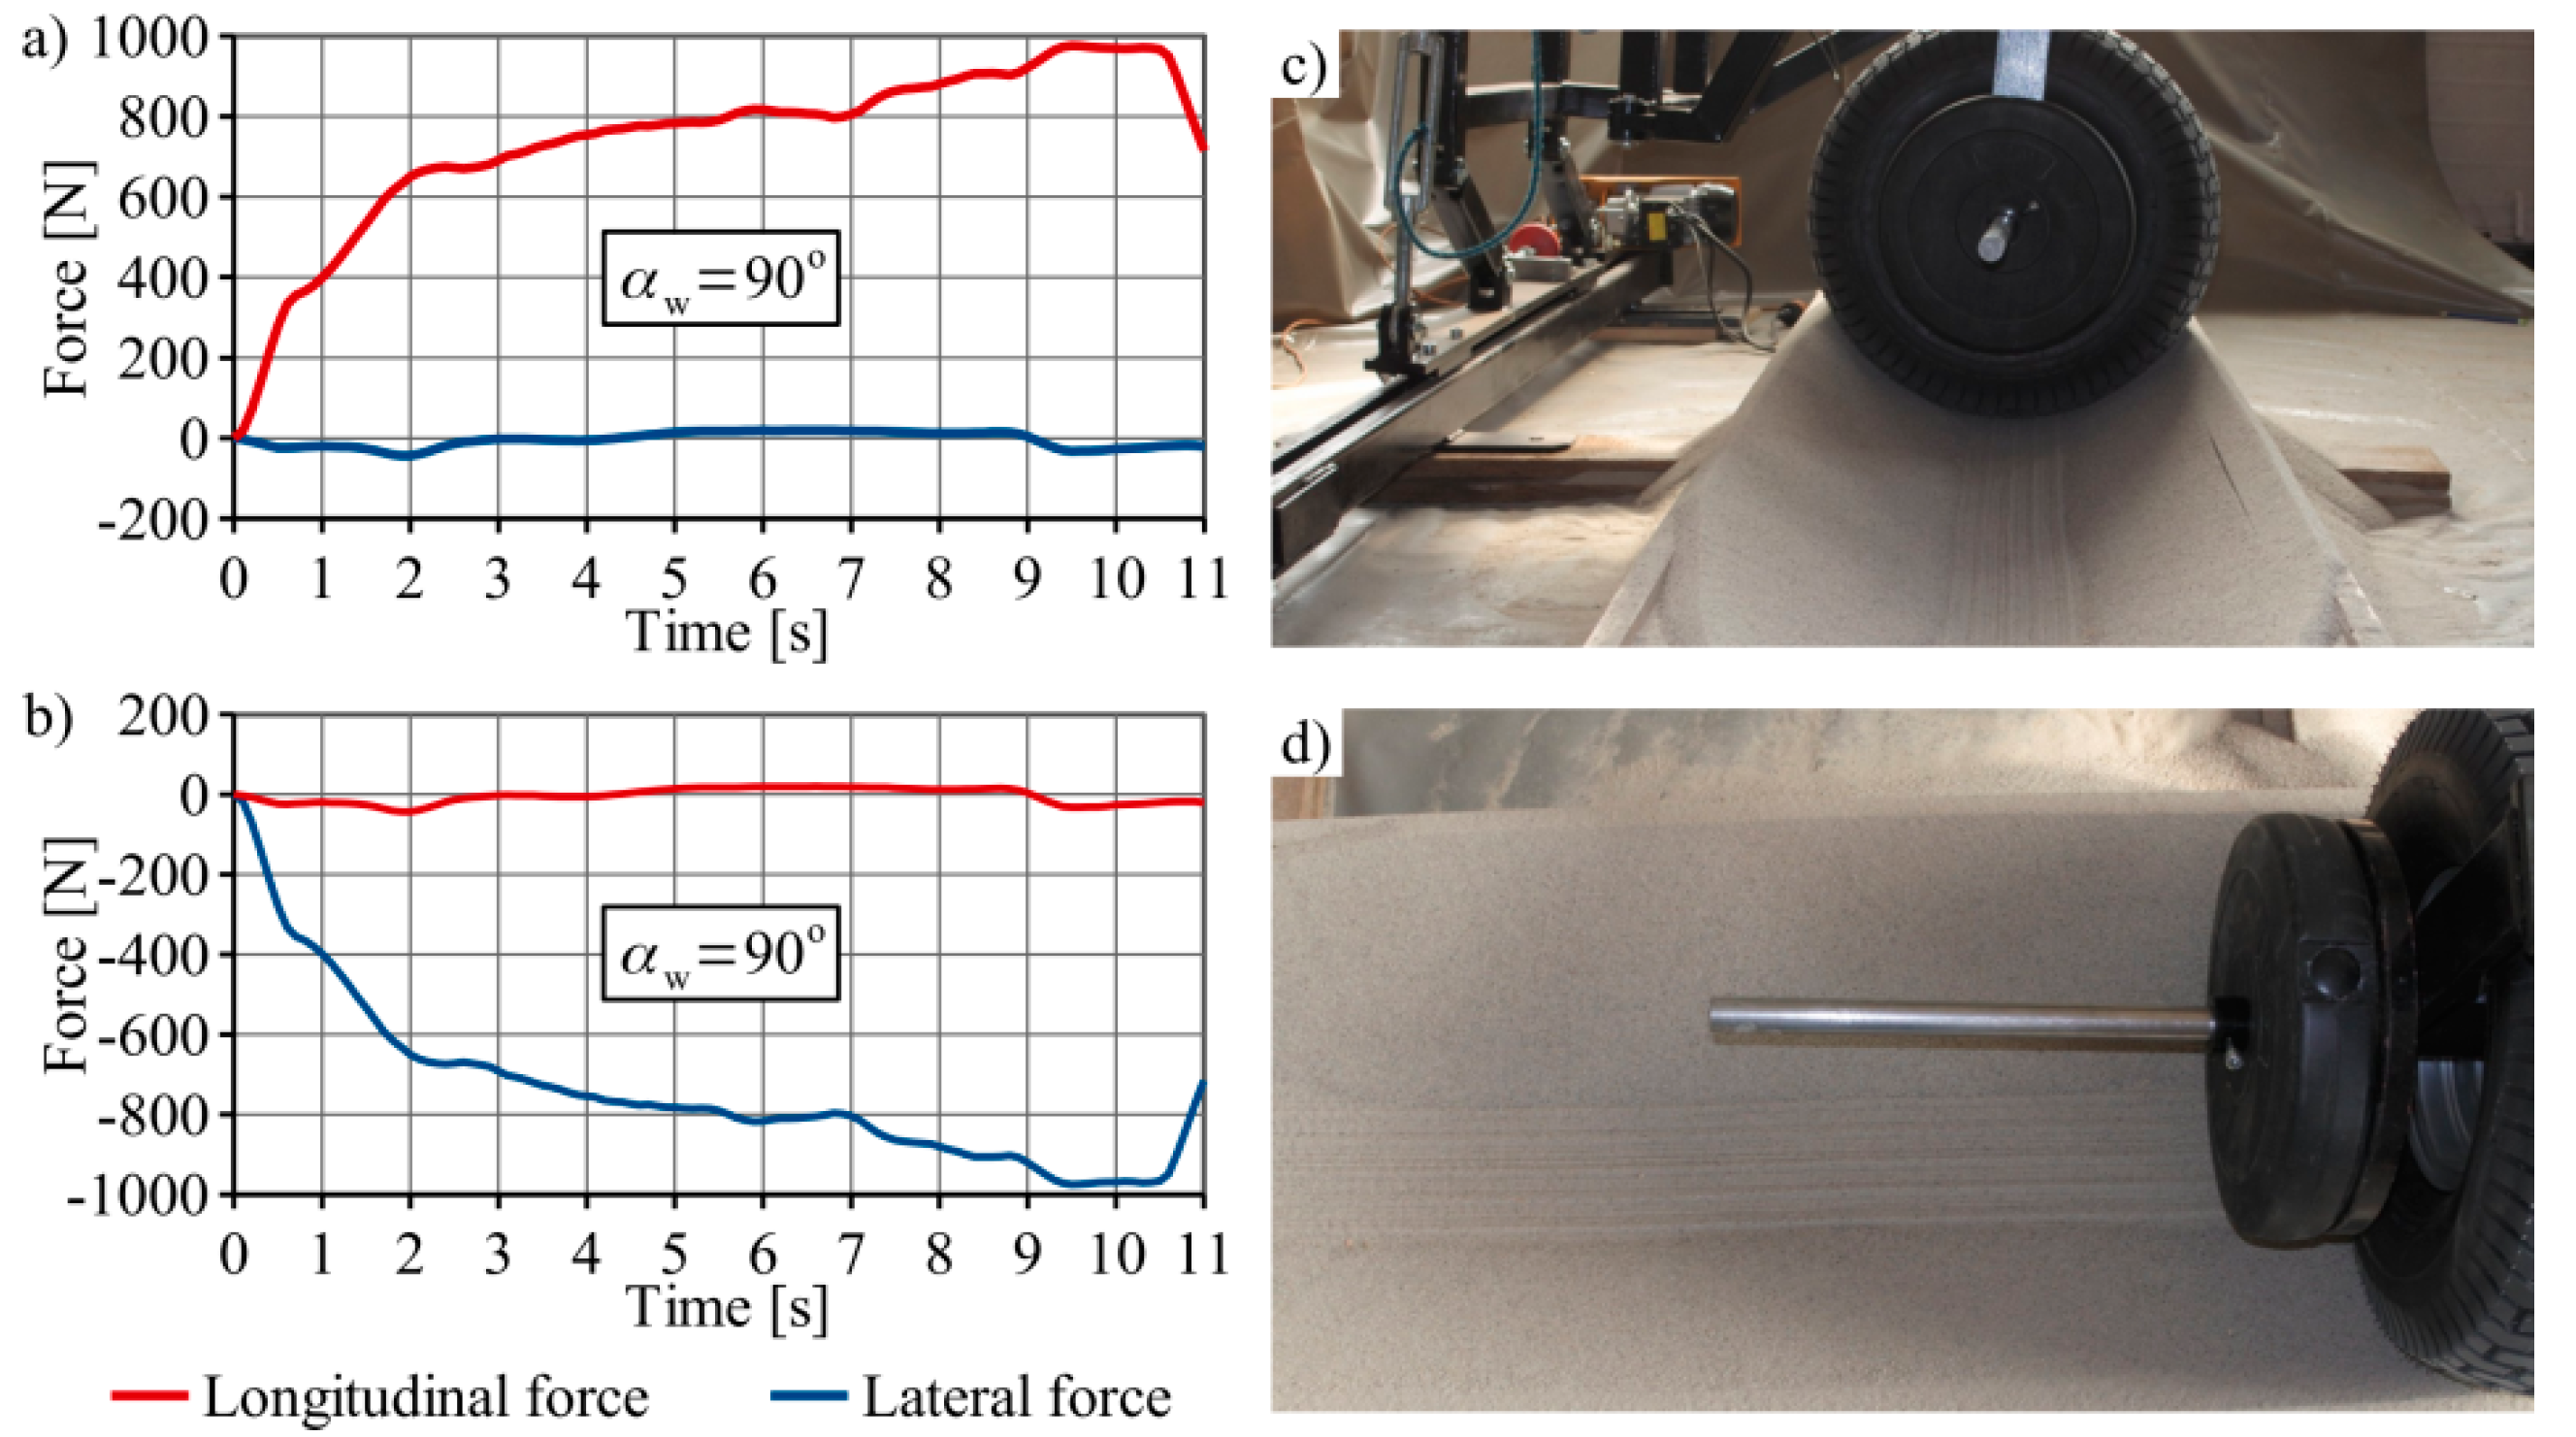
As
Figure 3,
Figure 4,
Figure 5 and
Figure 6 show, the values of the longitudinal load varied during the measurement period. At the start of the experiment, the wheel was placed on the surface of the sand, and then the propulsion system was activated. The values of the load increased as the sand piled up in front of the wheel, thus causing the traction effort to increase. The main purpose of the test was to investigate the influence of the angle of attack on the resulting longitudinal and lateral forces.
The longitudinal force increased with the angle of attack, and was similar for the values 60° and 90°. For the 60° angle, the wheel’s speed decreased; this can be seen in the photos that show the tire track, where the pattern of the wheel’s tread cannot be seen in the track. The lateral force for the angles 0° and 90° was similar.
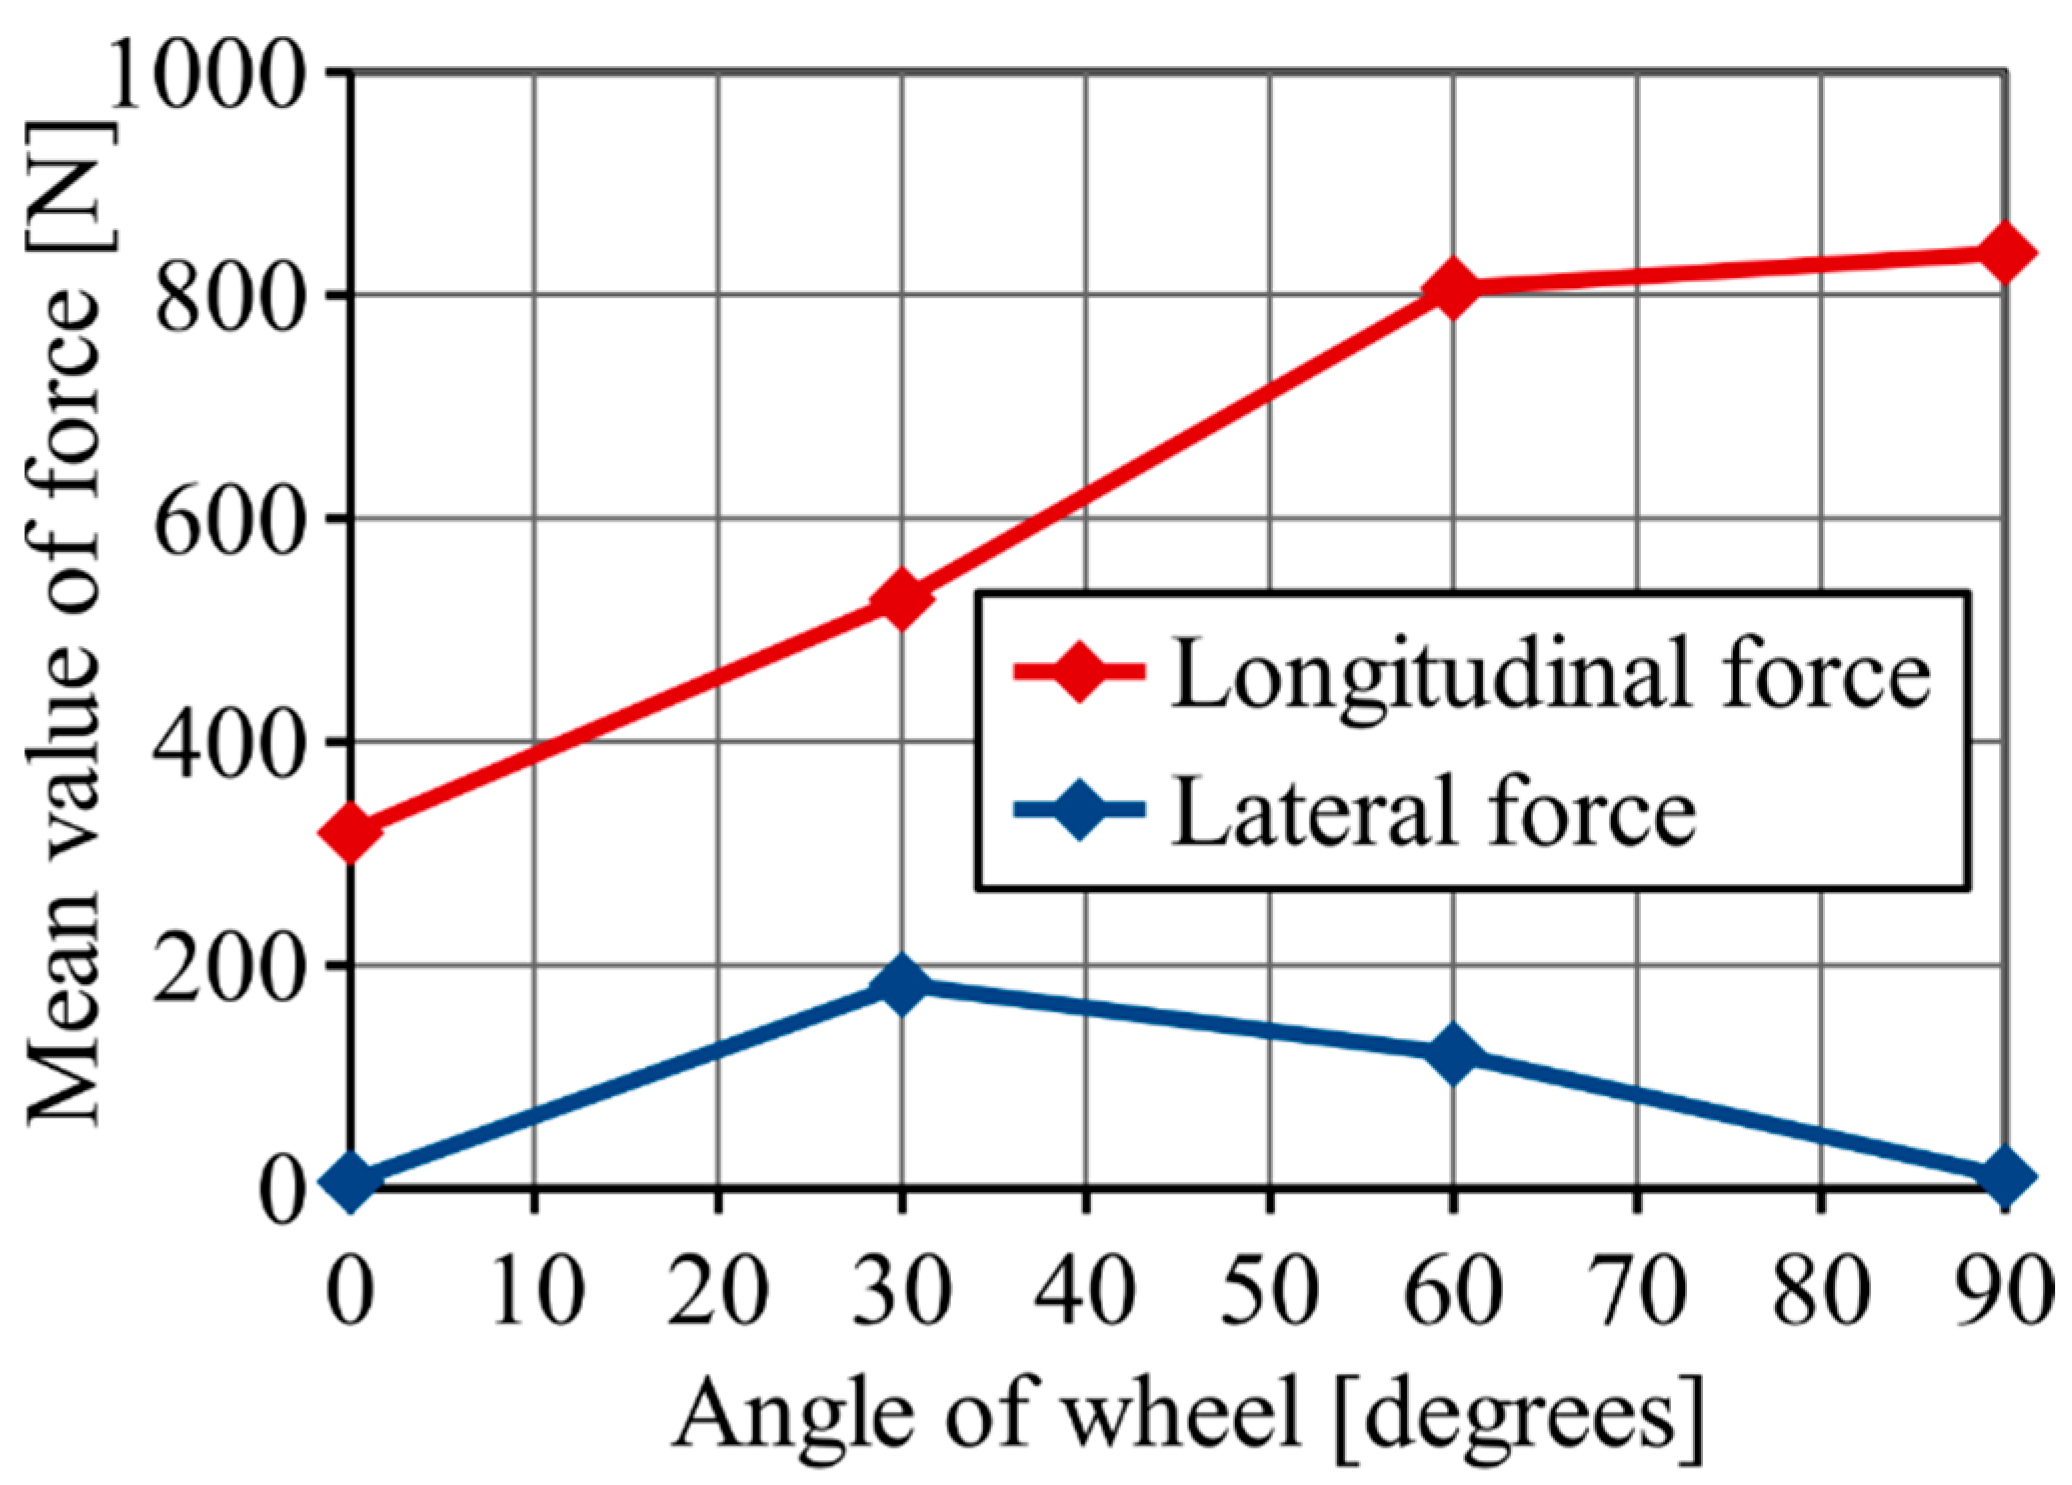
As a result of the experiment, the mean values of the longitudinal and lateral forces were calculated.
As can be seen in
Figure 7, the highest value of the lateral force was when the angle of attack was equal to 30°. As the angle of attack increased, the wheel slip caused the lateral force to decrease.
The model in the presented tests was aimed at determining the rolling resistance of the surface of the wheel.
The longitudinal and lateral loads were measured during the laboratory test. In the next step of the methodology, the FE model has been developed. Verification of the model was carried out to obtain the best correlation between the model and the test results. As the laboratory and field tests could not cover all required field conditions, an FE model has been used to provide the missing data.
3. Methods
As mentioned before, the DEM method [
22,
23] was implemented in the LS-DYNA environment by Hallquist in 2015 and is based on a model that was developed by Peter Alan Cundall [
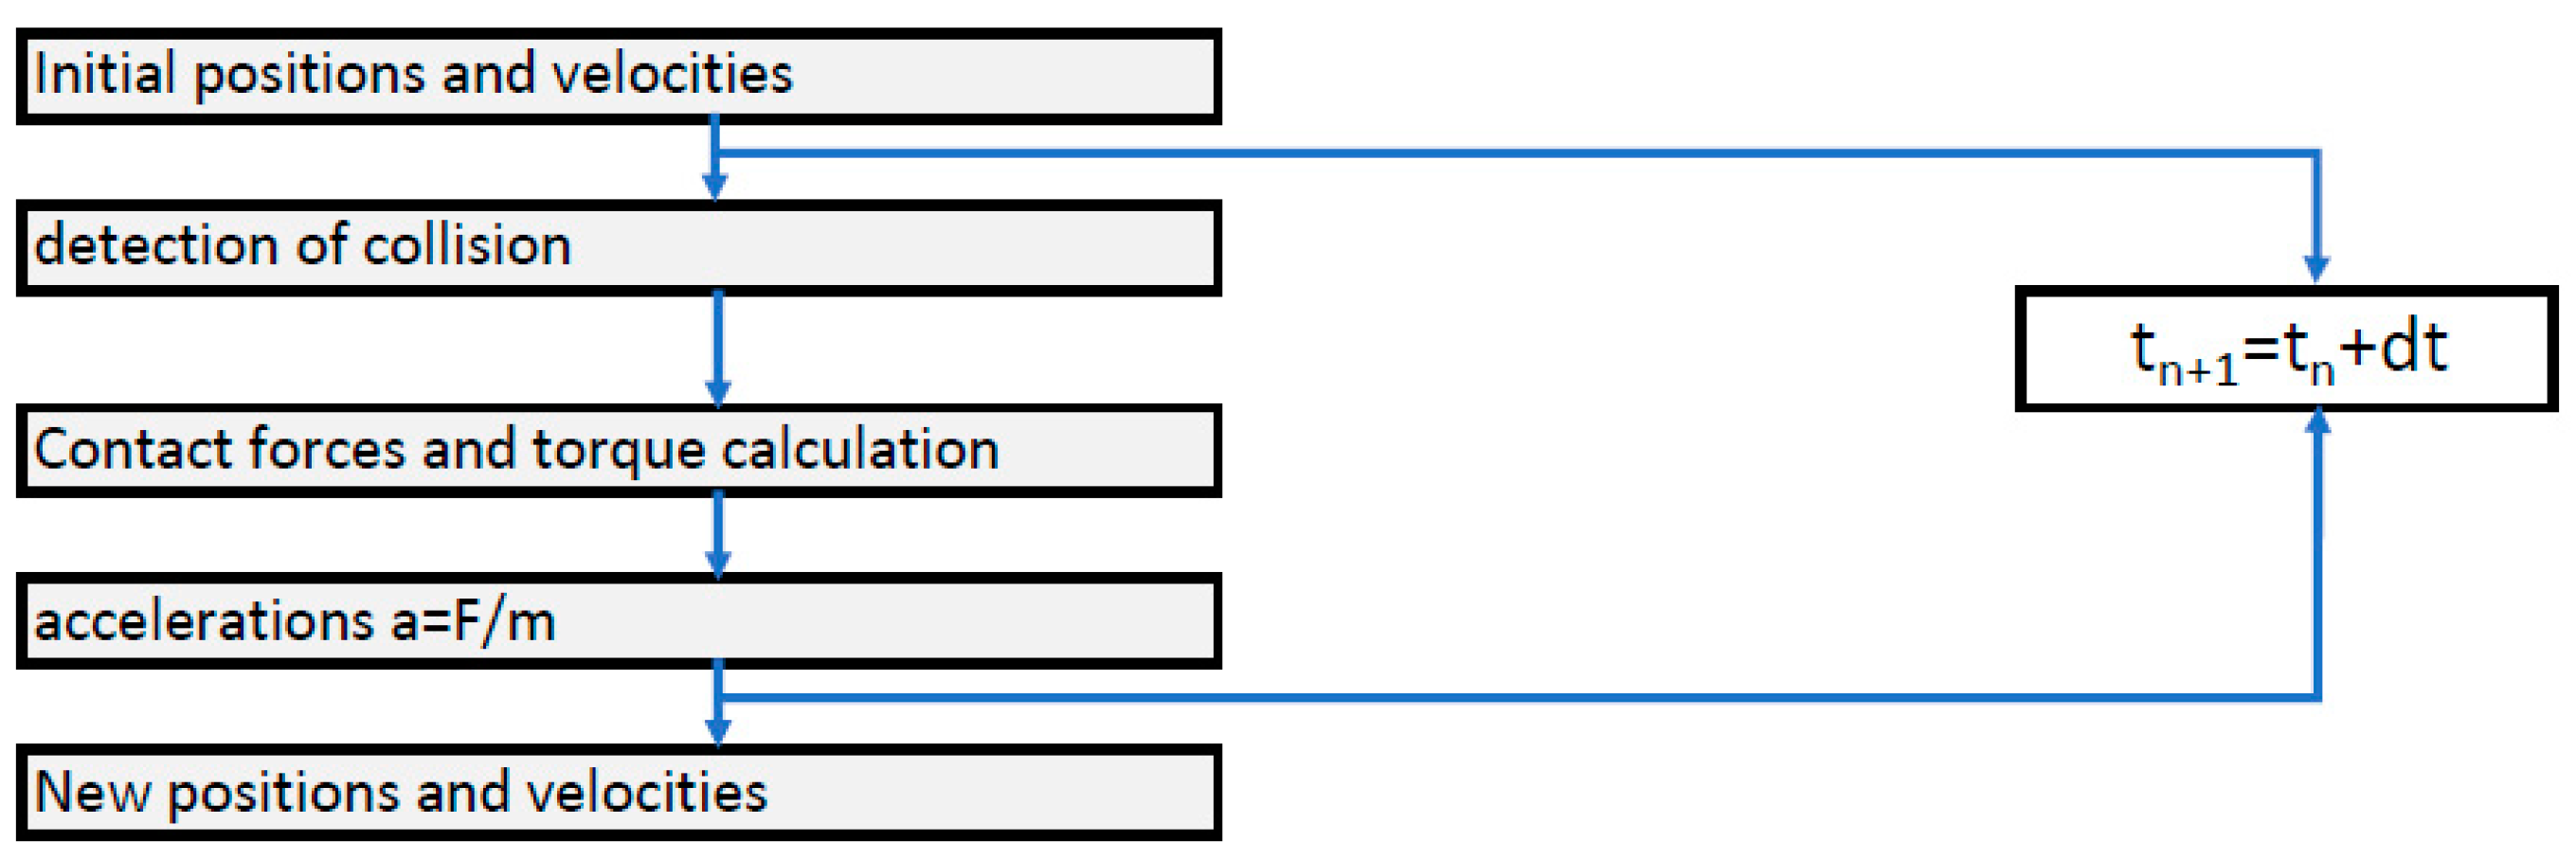
10], an engineer who invented the Discrete-Element Method. The translational and rotational motion of each particle is calculated at each time step using Newton’s laws of dynamics (
Figure 8), while the interaction between the particles is realized via contact algorithms in the penalty function. In LS-DYNA, particles are perfectly spherical; therefore, this can yield different results to the experimental tests [
24].
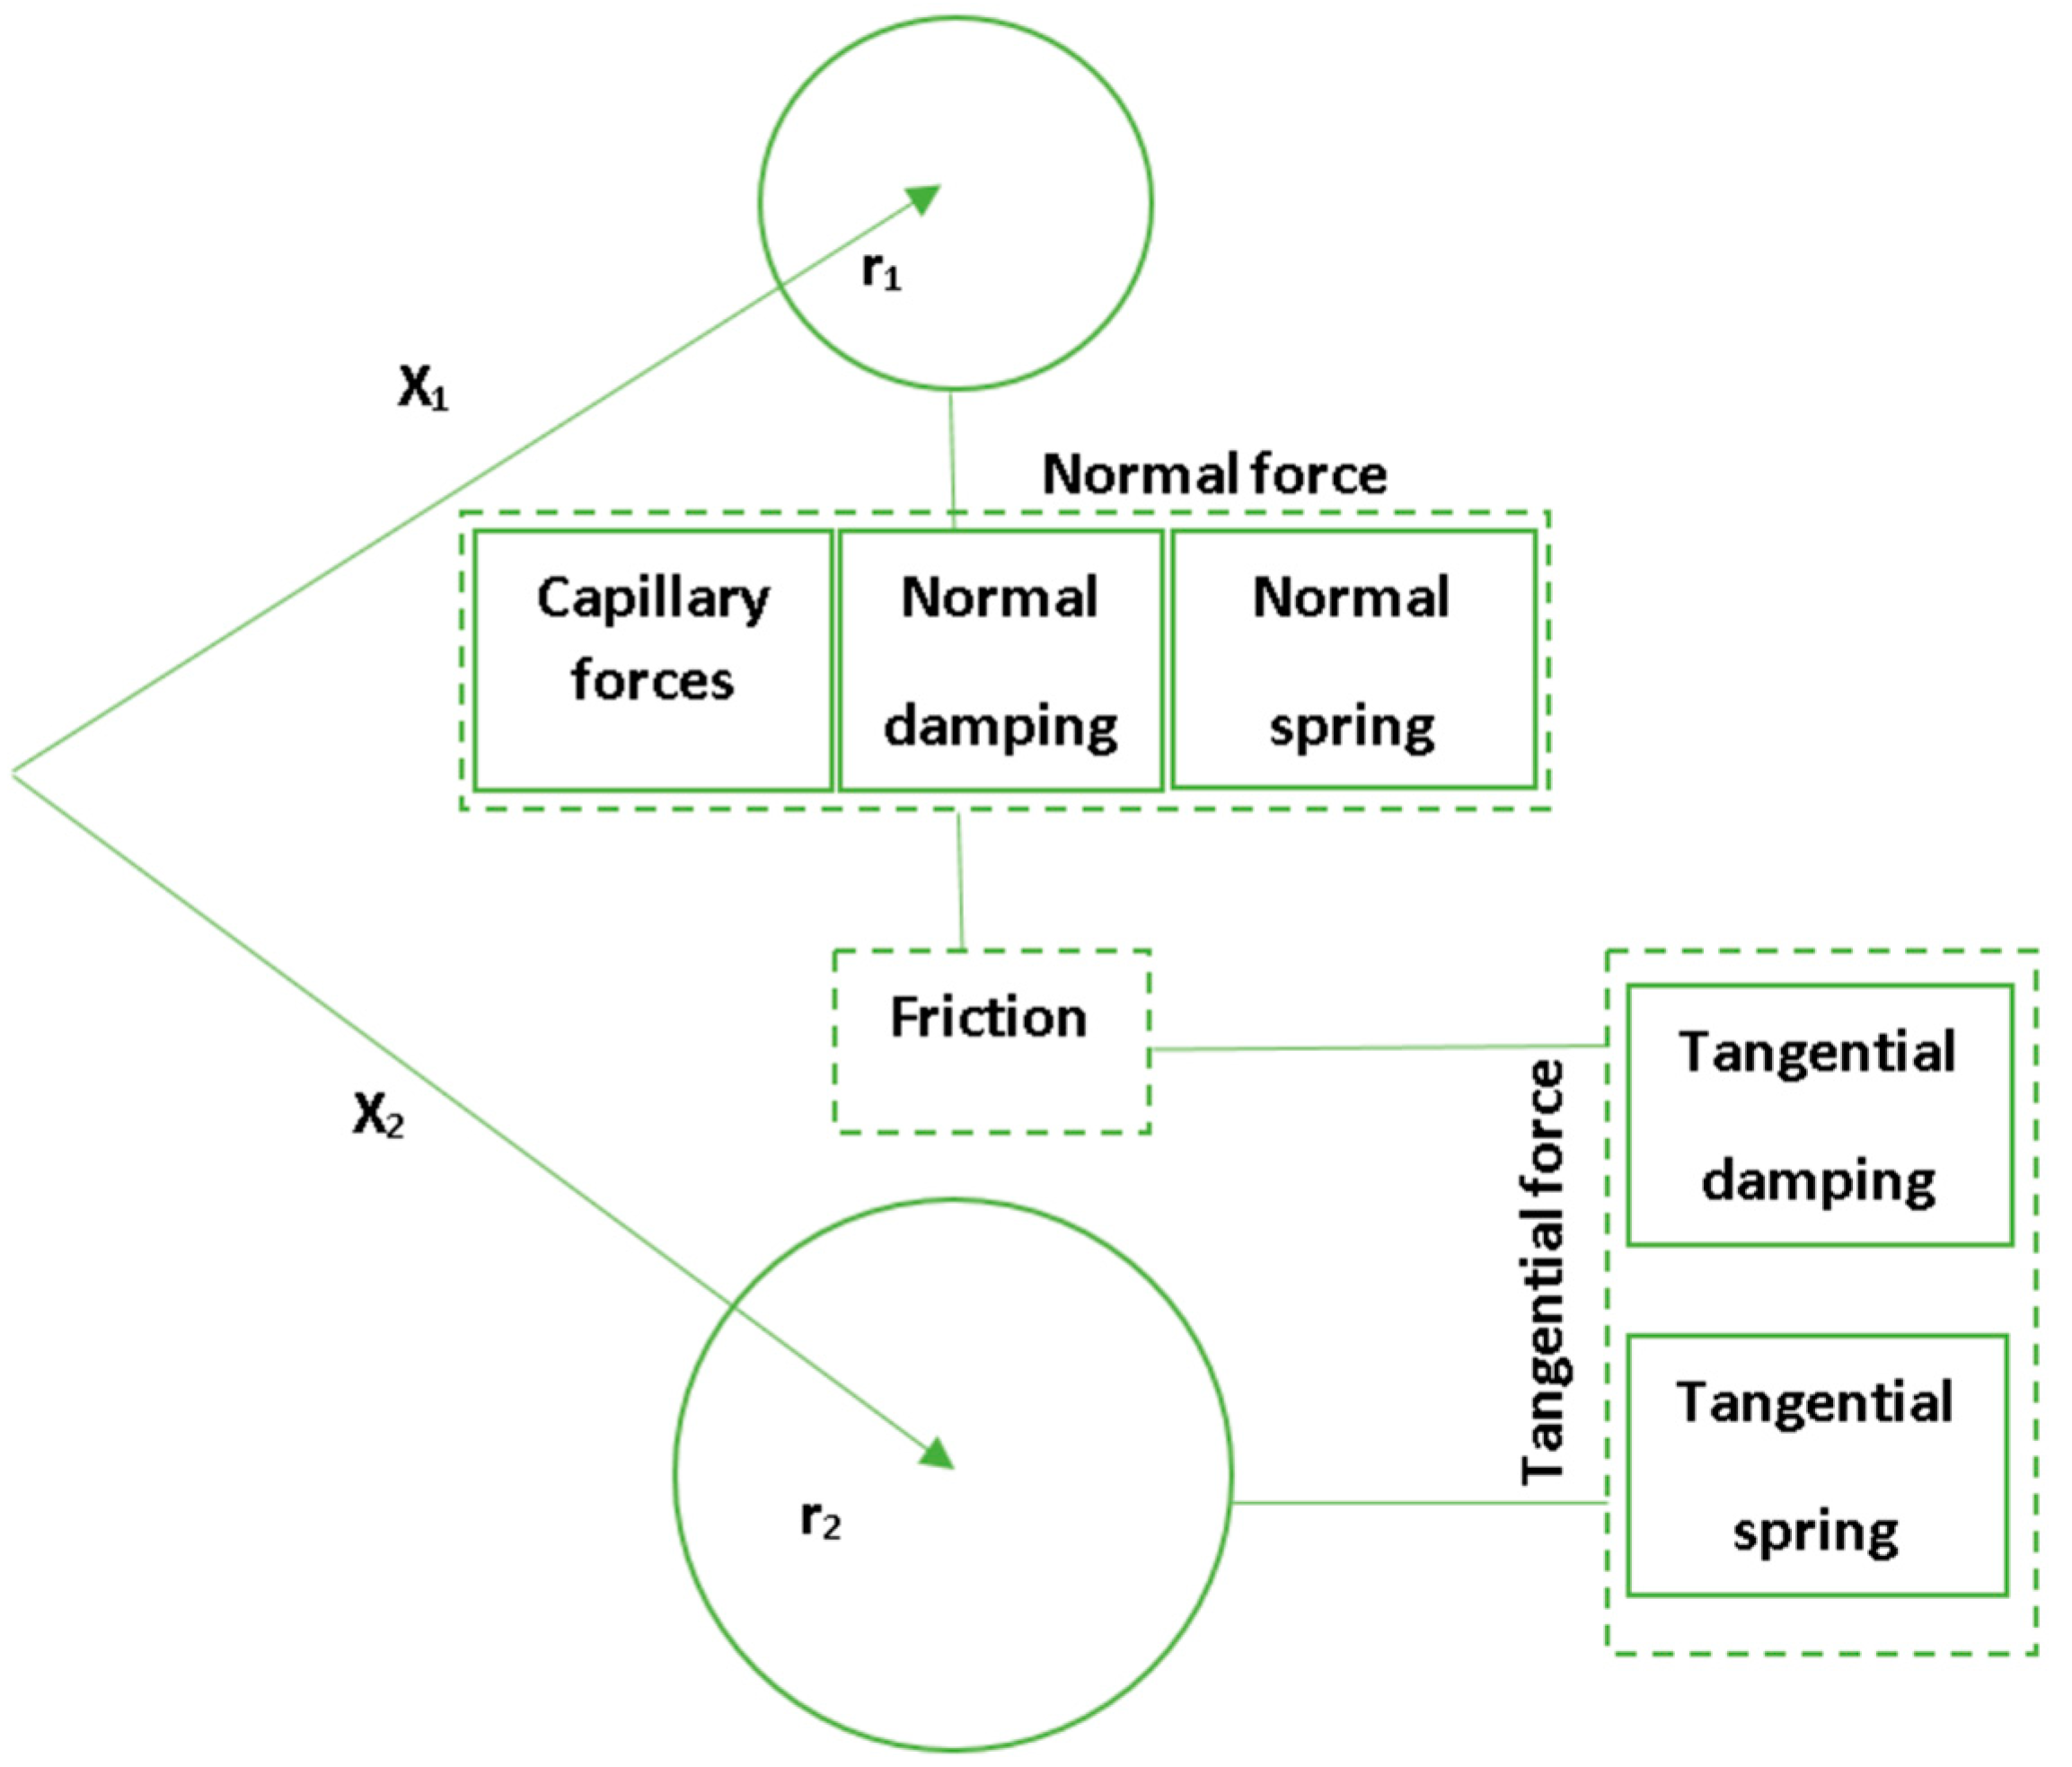
The normal contact forces are defined by the following formula [
25,
26,
27]:
where,
is the interaction distance and
X1 and
X2 are the coordinates of particles 1 and 2, as presented in
Figure 9.
The spring constant,
Kn, is defined as:
where
r1 and
r2 are the radii of particles 1 and 2, respectively, and
k1 and
k2 are the compression moduli of the particles. NORMK is a parameter of the user-defined penalty function, which can be used to artificially change the stiffness and extend or shorten the time-step in the DEM method,
, which is calculated as follows:
where, TSSFAC is the scale factor for the time-step and m is the mass of the DEM element. The default value given by Karajan [
25,
27], i.e., NORMK = 0.01, was used in the simulations in this paper.
The stiffness of the tangent spring was determined based on the formula:
where SHEARK is the stiffness factor; a default value of 2/7 was used.
The normal damping force was determined from the dependence:
where the normal damping coefficient
Dn was determined from the formula:
The normal damping coefficient was in the range from 0 to 1.
The tangential damping force was determined by the relationship:
where the tangential damping coefficient
Dn was determined by the formula:
The tangential damping parameter was in the range from 0 to 1.
The value of the friction force was determined from the dependence:
where, fric is the coefficient of friction and the force FN is the sum of the normal force, Fn, and the normal damping force, Fndamp. The resistance resulting from the rotation of the particles was implemented using the torque
Mr, which caused a delay in the rotation of the particles, from the equation:
where, fricr is the rolling resistance factor that was specified by the user.
It can be seen how important the appropriate selection of the material parameters is when determining the correct contact; direct measurement is not always possible. Following this, a number of numerical simulations can be performed until satisfactory results that correspond with the results from the experimental tests are obtained.
The parameters that are important for preserving the sand during the dynamic simulations are:
The NDAMP and TDAMP damping parameters—their values were set in accordance with the recommendations in the literature [
25,
27]; this value was up to 0.7. The friction coefficient, fricr, and the static friction coefficient, frics, were taken from the values in the literature, as was the rolling friction factor, fricr. An increase in fricr only caused a slight increase in the stiffness of the particles with a regular spherical shape; for real irregular seeds, this effect would be greater. However, better numerical methods for modeling particles with complex shapes are still needed [
28].
4. Numerical Model
Due to the application of the DEM elements and the high intensity of the calculations and time consumption, it was decided to simplify the physical model. In the first stage, the tire model with an airbag that is used in the automotive industry was changed to a rigid tire [
11] because it caused added noise and created difficulty in interpreting the results. The influence of the tread was also neglected; therefore, the tread was removed from the model. The next step was to redesign the wheel-pulling system to minimize the number of elements in the LS-DYNA environment (
Figure 10).
According to the material used during the experimental tests, the size of the sand grains was assumed to be in the range of 1.5–2 mm. The size of the particles was smaller compared to those presented in the literature [
1,
29]. As a result, the model consisted of 775,645 nodes and the total number of elements was 774,625, of which 751,546 were DEM elements, 5985 were solid elements, 17,094 were shell elements, and 2 were mass elements.
Table 1,
Table 2 and
Table 3 present the material properties and the DEM parameters that were used in LS-DYNA [
26]. To maintain a consistent system of units in LS-DYNA, mass was applied in tons, length in mm, time in seconds, force in N, and stress in MPa. The applied mechanical properties of the sand, as well as the properties of the discrete elements and the coupling between the DEM elements (
Table 1,
Table 2 and
Table 3), were taken from the literature [
26]; the DEM simulations in the literature were in good agreement with the experimental results.
Table 1 presents the mechanical properties of sand.
Table 2 presents the properties of the discrete elements discussed in
Section 3.
For the coupling between the DEM elements and the FEM elements, the friction coefficients must be set.
Discrete, flexible, and rigid elements can be found in the create mode, in order to use rigid body dynamics with joints [
30,
31,
32].
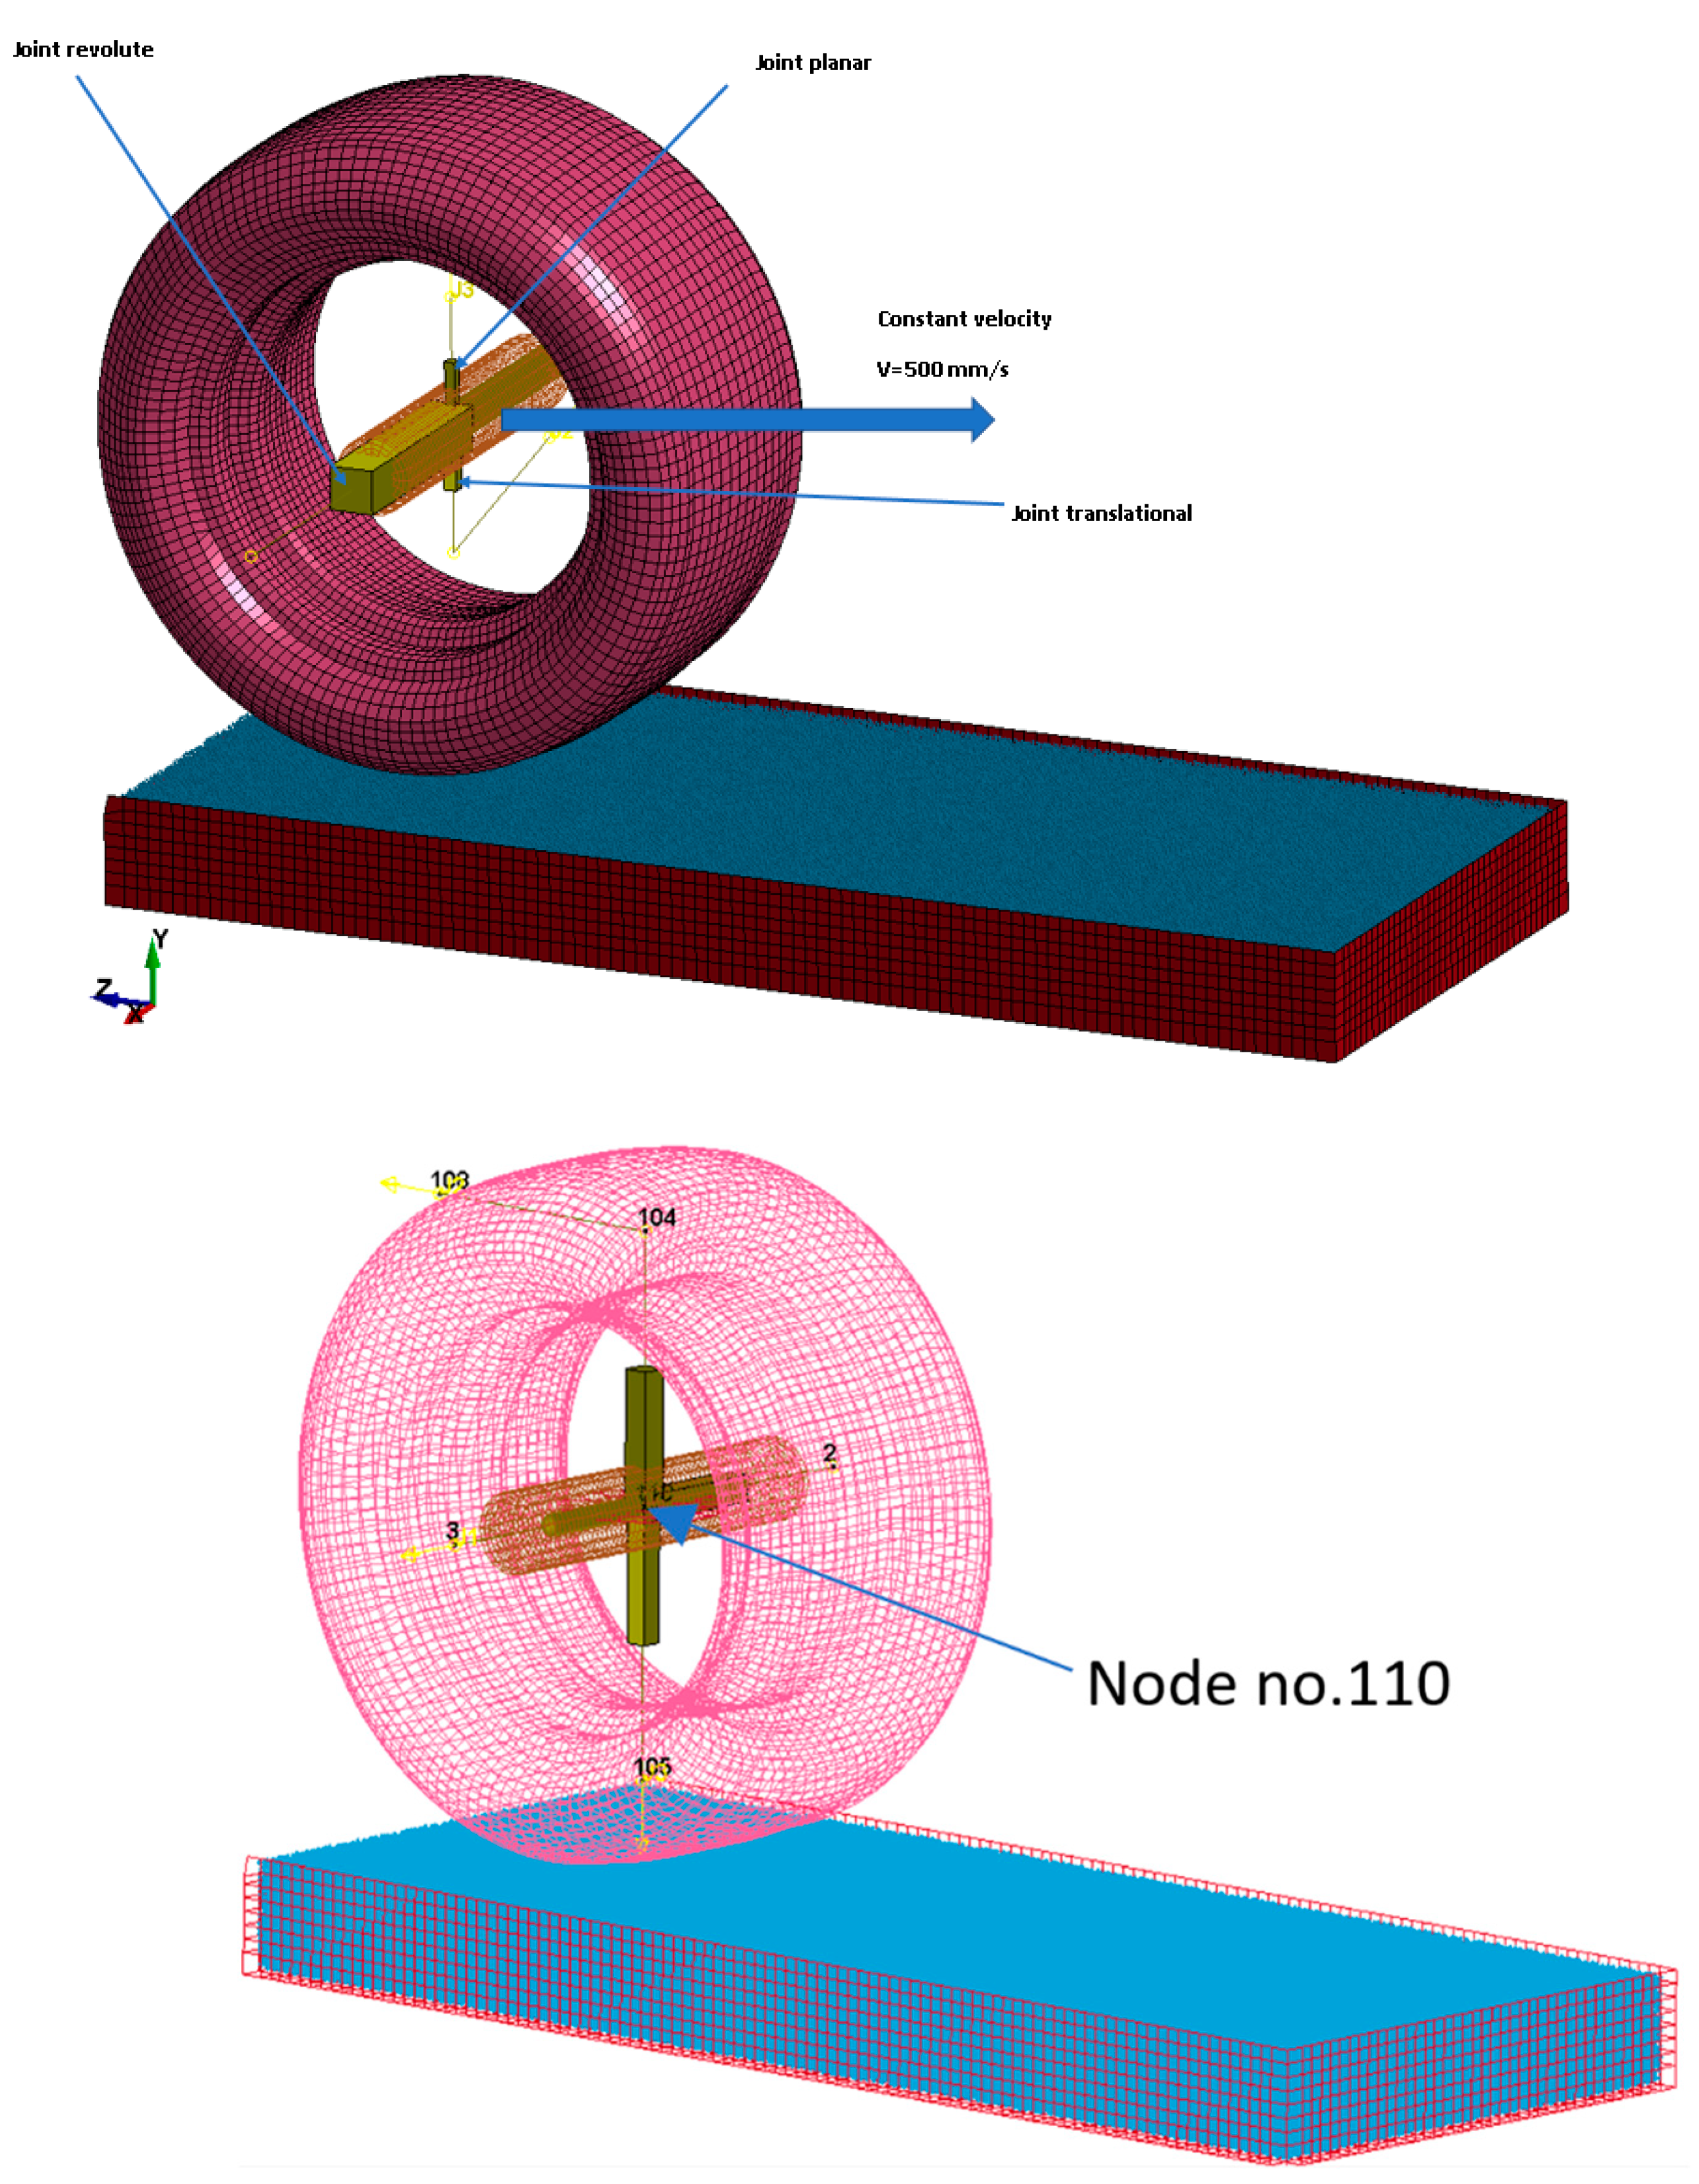
In order for the resistance forces on the X, Y, and Z axes to be measured during the wheel’s approach at different angles, the model used three different joints: a revolute joint between the tire and the wheel’s axis, a translational joint, and a planar joint between the wheel’s axis and the shaft (
Figure 9). Through the use of these joints, it was possible to freely lower the wheel and force the wheel to rotate as a result of the friction with the ground. The joints were applied between the nodes of the rigid parts, applied by the function: *CONSTRAINED_EXTRA_NODES_NODE.
In the model, the sand occupied a volume of 1012 mm by 412 mm by 86 mm in order to reflect the wheel riding over a loose surface.
A very important aspect is the center of gravity; in order to avoid additional moments of forces, the center of gravity of all the components in the wheel must be the same. In the global coordinate system, the center of gravity was identified by node no. 110, as shown in
Figure 11.
5. Results
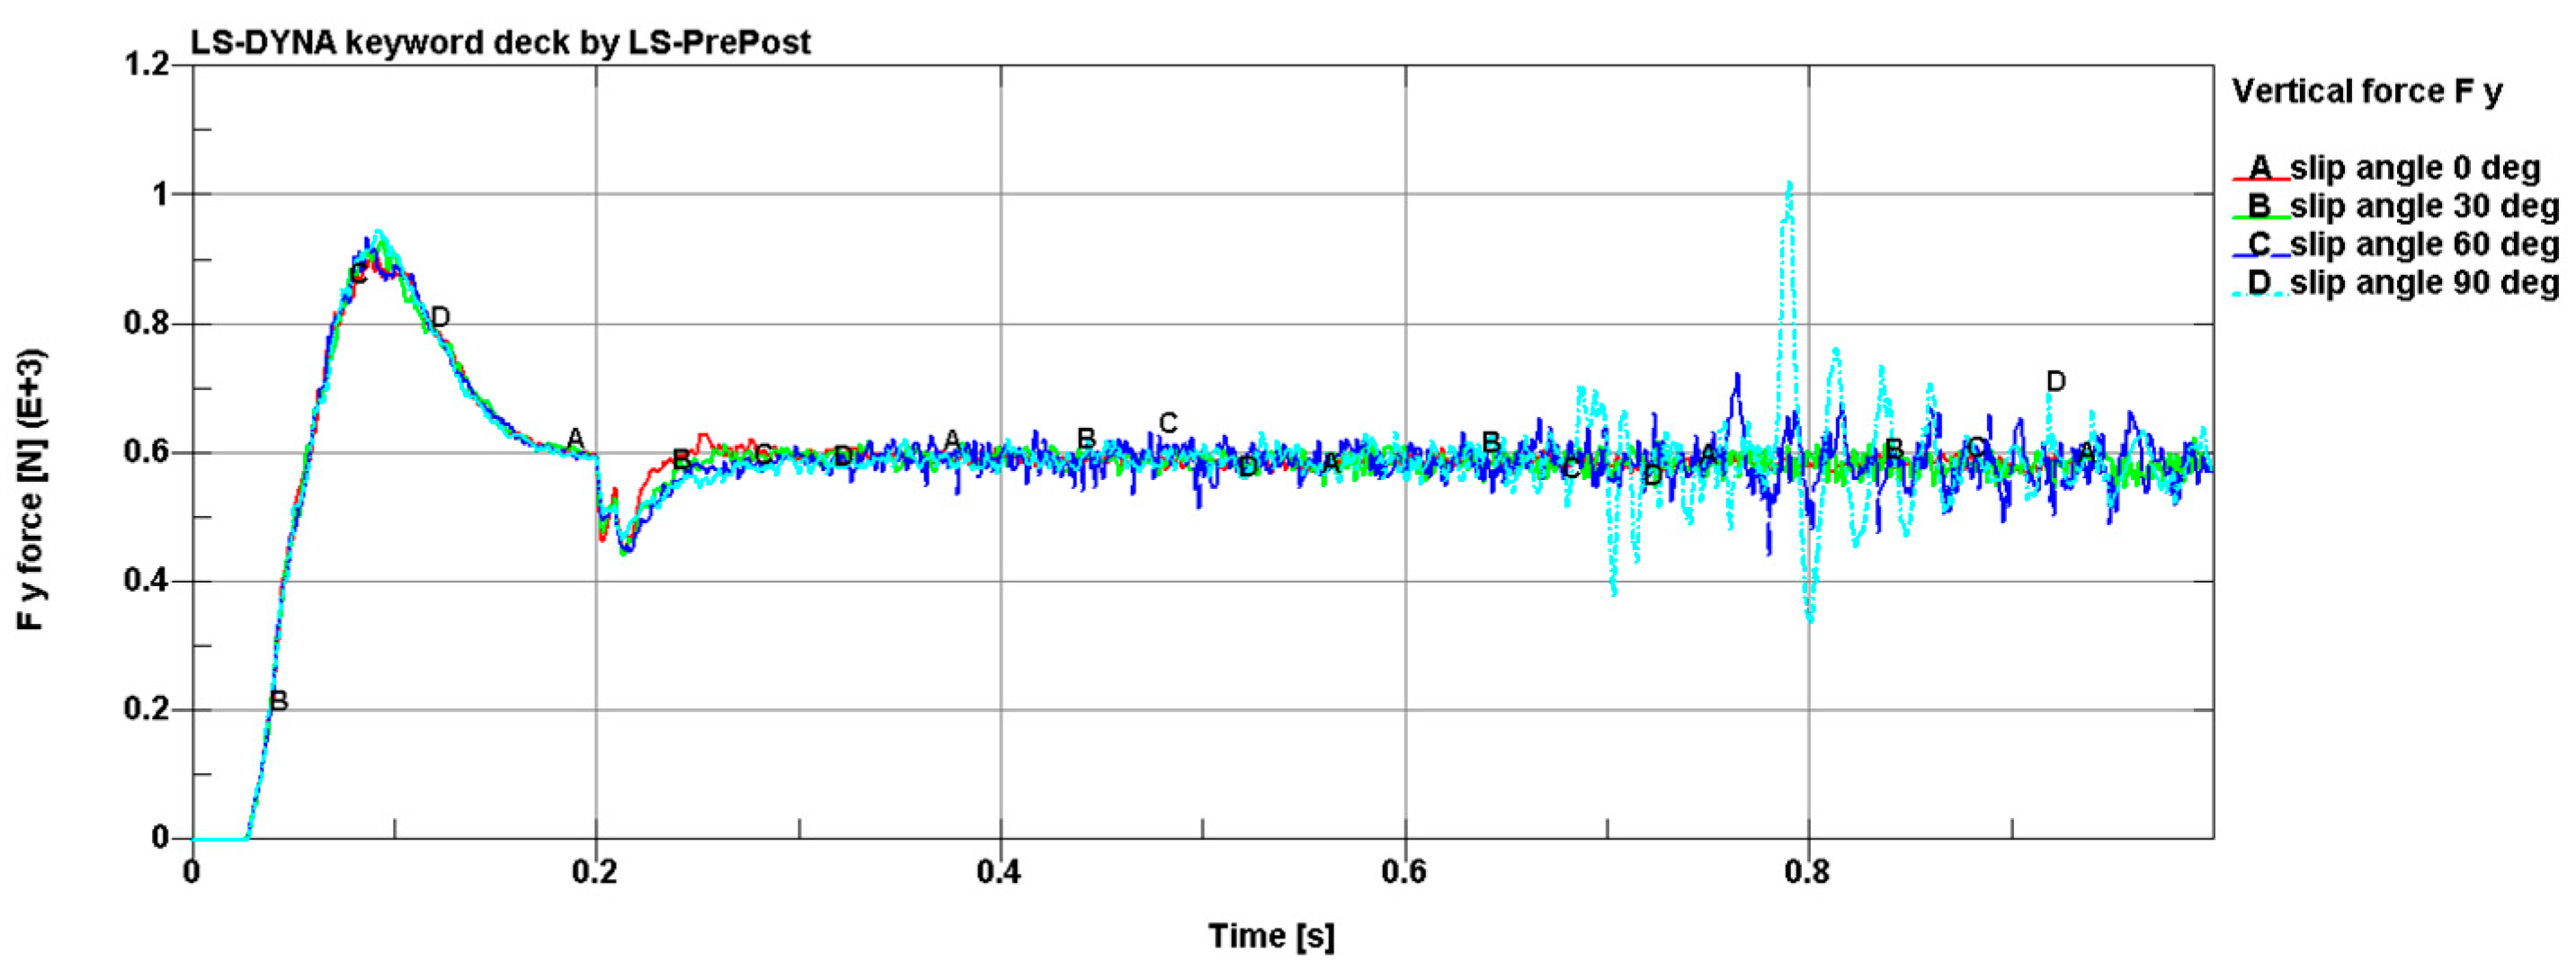
Simulations were carried out for four different wheel slip angle variants, being straight ahead, 30°, 60°, and 90°, where the Fy force stabilized in 0.3 s on the revolute joint with a force of 600 N. This resulted from the weight of the wheel together with the weight of the system (total weight 61.19 kg).
In the first phase of the simulation, the drop test was applied to the tire with the system to determine the sinkage level. One of the methods for presenting the results were displacement counters of the discrete elements in the Y direction [
3]. This could be used to determine if there was enough width for the tire to move (
Figure 12).
In the next step, after determining the depth at which the wheel collapsed in the sand, the rigid body that generated movement with a constant velocity of 500 mm/s was placed at a height that was consistent with the center of the axis of the rotation of the wheel (
Figure 13). As in the case of the drop tests, four variants were performed: driving straight ahead, and driving at an angle of 30 degrees, 60 degrees, and 90 degrees.
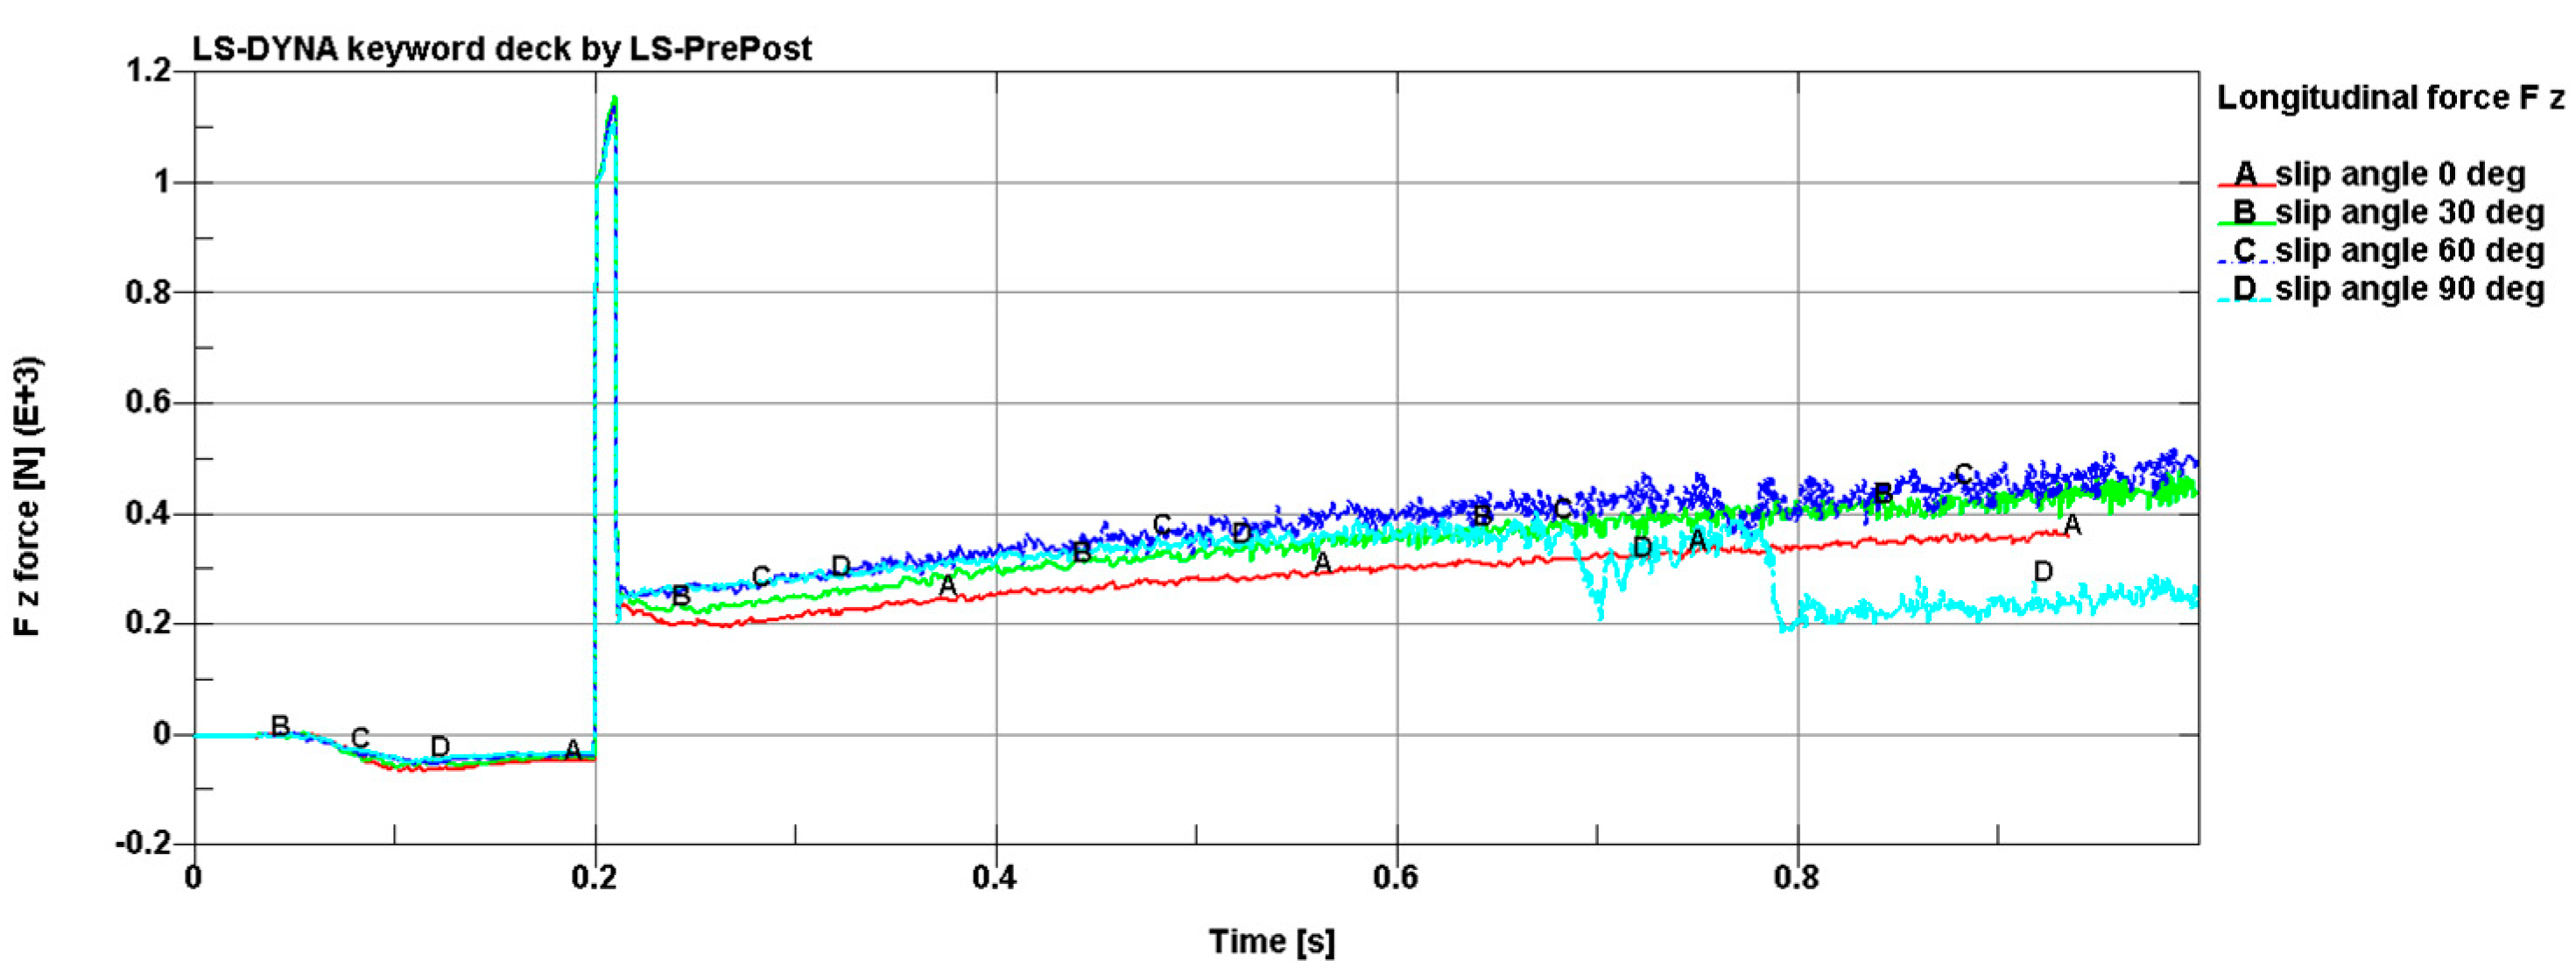
The longitudinal force, Flong, was parallel to the direction of movement, Fz, and was responsible for generating the traction torque; this can be assumed to be the traction effort force. In the case of a skid-steered vehicle, each wheel generates a resistance force during slip and this is necessary to estimate the vehicle’s turning performance.
In the numerical model, the forces and the moments of the forces were measured relative to the global coordinate system of the revolute joint presented in
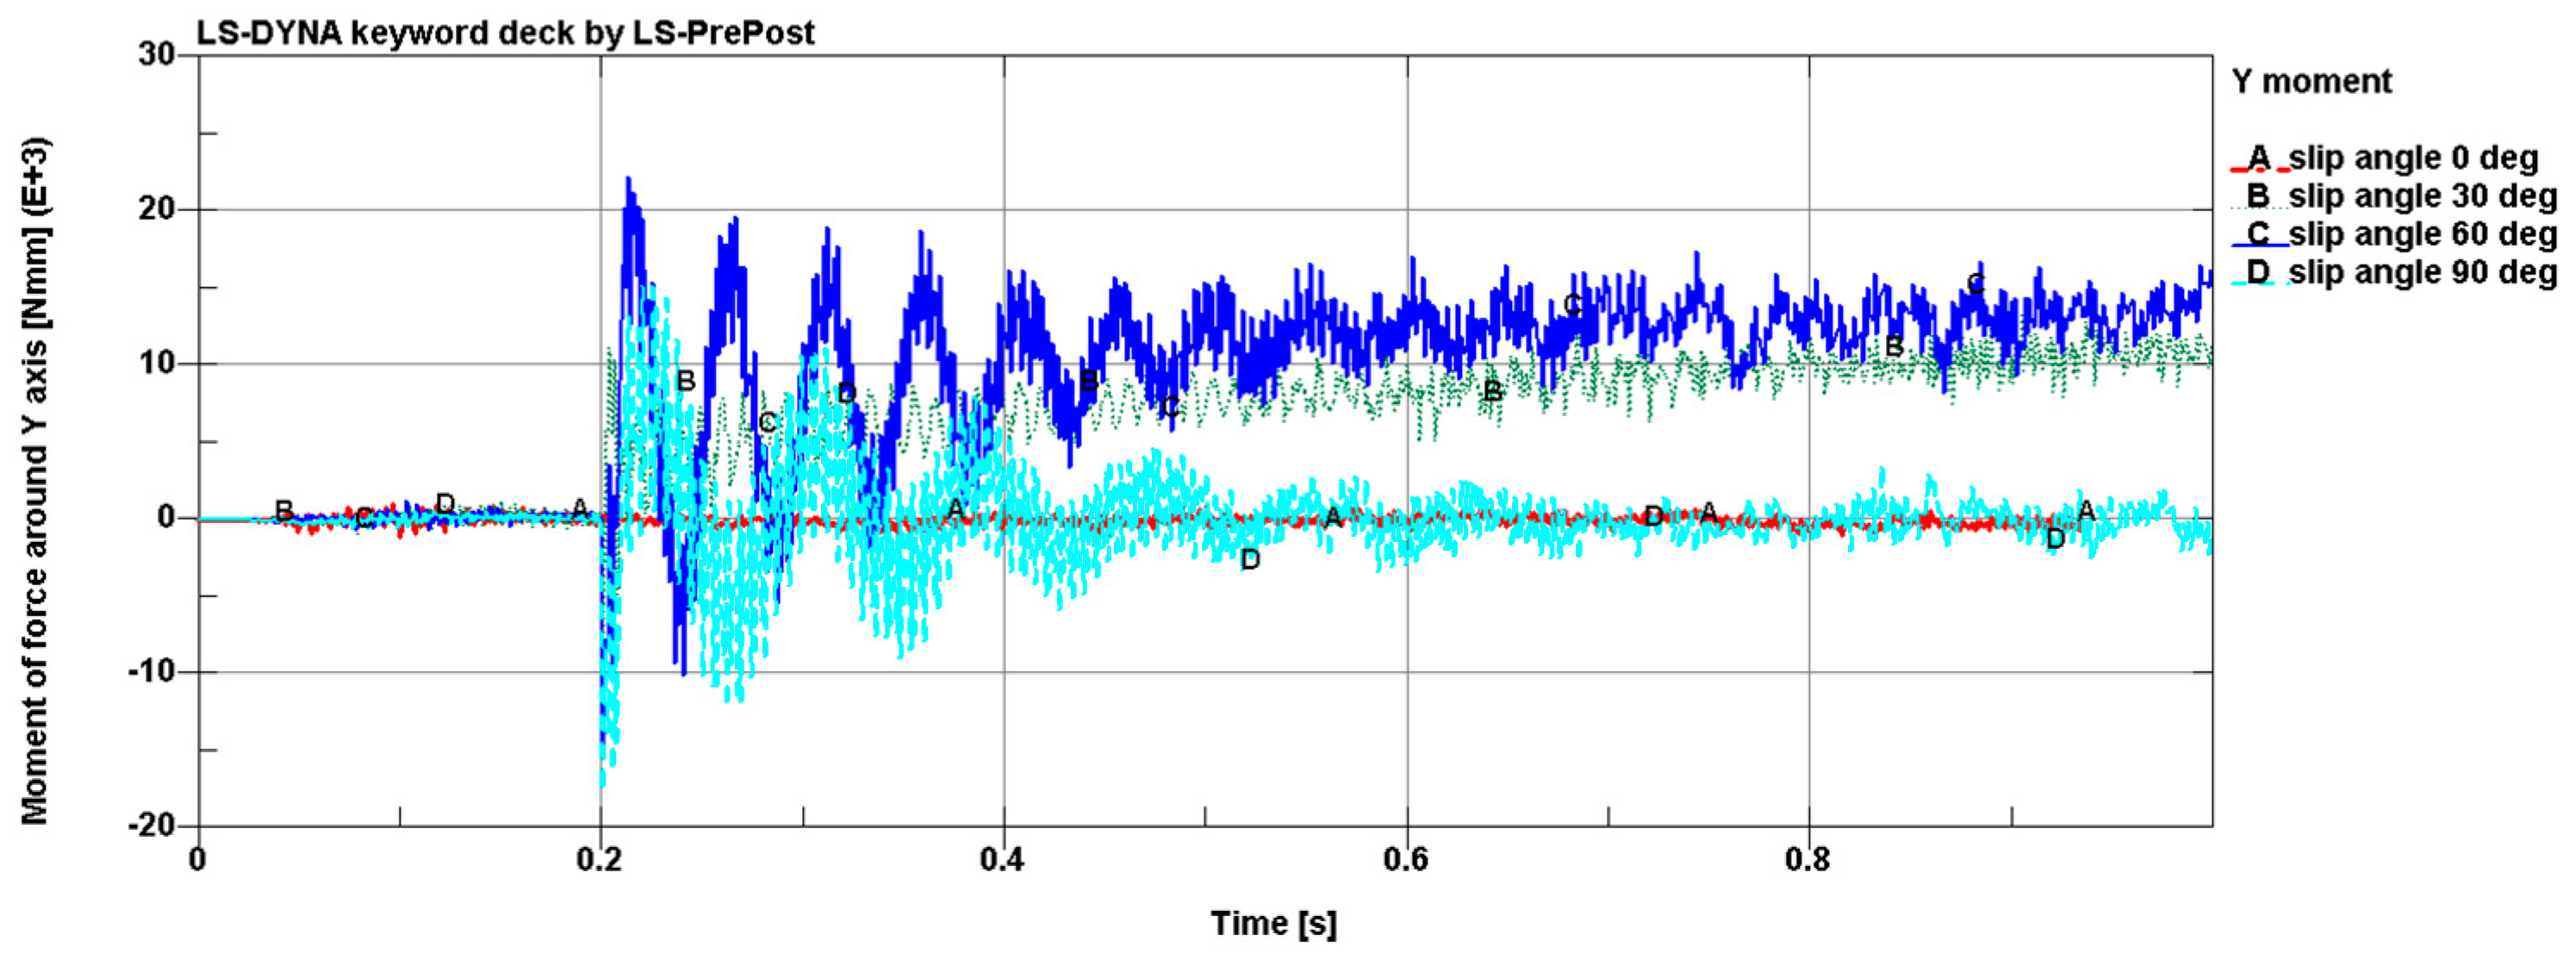
Figure 11. The moment of the force around the y-axis and the components of the force, Fx, Fy, and Fz, generated by the resistance force during wheel slip are presented in
Figure 14.
Figure 14 presents the distribution of the moments of the forces around the y-axis, which had a significant influence on the distribution of the lateral and longitudinal forces. As can be seen, the moment of force around the y-axis for a wheel with a slip angle of 0° was near zero, and the value increased with the increase of the slip angle. However, for a slip angle of 90°, the moment of the force around the y-axis was equal to zero.
The lateral force distribution presented in
Figure 15 shows that, with a slip angle of 0°, Fx was near 0; this means that the wheel was only experiencing a longitudinal force. With a slip angle of 30°, a negative value was measured at the revolute joint. With the increase of the slip angle, the force Fx reached a larger negative value; this was a result of the large moment of the forces around the y-axis, as seen in
Figure 16. The situation changed with a slip angle of 90°, where the moment of the force around the y-axis was zero and had no influence on the distribution of Fx; the value of the lateral force was zero, and this situation was similar to the force for the slip angle that was equal to 0°.
Through the analysis of
Figure 16, it can be seen that, with the change in the slip angle, the component of the force Fy was the same on average, but an increase in the vibration amplitude with the increase of the slip angle could be seen for the revolute joint. The reason for this was that more sand had been picked up by the wheel (0.78 s).
As can be seen in
Figure 17, with the change in the slip angle, the component of force Fz increased due to the increased number of sand particles. For a slip angle of 90°, the grain particles flew out of the path (0.78 s) and the value of the force dropped sharply. That was a limitation from the small width of the sand-covered path on which the wheel was rolling.
6. Conclusions
In this paper, both numerical and experimental tests have been presented for a wheel’s overrun on sand. A novel approach for calculating the traction effort of off-road vehicles has been developed through a combination of both experimental laboratory and field tests, as well as the results of numerical calculations. The proposed method will be implemented in the analysis software that is dedicated to the fast calculation of the traction effort for skid-steered, off-road vehicles to optimize their transmission system. The novel approach describes the precise implementation of contact phenomenon between the wheel and the ground, and the manner in which the experimental research results have been compared with the numerical simulation using the finite-element method, the discrete -element method, and rigid body dynamics in the LS-DYNA software.
However, for more complex cases, the simulation could only model the general trend. The forces from the revolute joint could be treated as a measure of the resistance force when the wheel was rolling on the sand. The model assumed that the sand particles were a regular spherical shape, while, in reality, they vary in both shape and dimensions. The density of the sand affected the response of the system; the greater the number of sand particles, the longer the calculation time that was required. The NDAMP and NORMK parameters in
Table 2 significantly influenced the behavior of the particles. The terms DAMP and BSORT in
Table 3 reduced the leakage between the DEM elements and FEM elements. As the experimental research and numerical model were aimed at verifying the accuracy of the entire methodology, the sand-covered path that was used was relatively short and narrow. Further modifications of the experimental layout are planned; lengthening the path will allow a steady state to be obtained and widening it will prevent any possible collision of the tire with the walls of the path.
The numerical model presented in this paper is an appropriate base for further calculation. The trends in the forces that changed in relation to the slip angle of the wheel were similar when the experimental results were compared with the numerical simulations. The moment of the force around the y-axis of the wheel increased with the increase of the slip angle. With the increase of the slip angle, the force Fx reached a larger negative value; this was the result of the occurrence of a larger moment of the forces around the y-axis. However, for a slip angle of 90°, the moment of the force around the y-axis was equal to zero. With the increase of the slip angle, the force Fx reached a larger negative value; this was the result of the occurrence of the high moment of forces around the y-axis. The situation changed with a slip angle of 90°, where the moment of the force around the y-axis was zero and had no influence on the distribution of Fx; the value of the lateral force was zero, which was similar to the case for a slip angle of 0°. When the slip angle was changed, the component of the force Fy was the same on average; an increased amplitude of the vibration could be seen as the slip angle increased, this was caused by more sand being picked up by the wheel.
Since the test cannot be performed for all wheel designs and road conditions, numerical calculations will be used to complement the test data. A fully developed model of the tire–road and tire–ground interactions will then be transferred to the software that will be used for a numerically efficient calculation of the traction effort.
