Article

Study on Establish a Brittle Fracture Prediction Considering Different Crack Opening Modes Using Mixed-Mode Ratio

1
Department of Architecture, Sojo University, Kumamoto 860-0082, Japan
2
Architecture Course, National Institute of Technology, Ariake College, Omuta 836-8585, Japan
3
Nagai Steel Works Corporation, Uki 869-0524, Japan
*
Author to whom correspondence should be addressed.
Appl. Mech. 2021, 2(4), 849-862; https://doi.org/10.3390/applmech2040049
Submission received: 14 September 2021 / Revised: 9 October 2021 / Accepted: 13 October 2021 / Published: 18 October 2021
(This article belongs to the Special Issue Mechanical Design Technologies for Beam, Plate and Shell Structures)

Abstract

:
In this study, we propose a method for predicting the occurrence of brittle fractures in the beam-to-column joints of steel structures, considering different crack opening modes. We conducted experiments on beam-to-diaphragm joint specimens with varying plastically constrained cracks to reproduce brittle fractures. The experiments’ results demonstrated the effectiveness of the toughness scale model and the Weibull stress approach. In addition, we propose the mixed-mode ratio, which is a quantitative index of the mode difference, and we applied it to the finite element models of the specimens. In this study, we evaluate the validity of the mixed-mode ratio and explore the differences in crack opening modes, as they pertain to the occurrence of brittle fractures.

1. Introduction

Brittle fractures in the welded joints of building structures were first observed in the devastating 1994 Northridge earthquake [1]. In Japan, the 1995 Kobe earthquake, which registered a magnitude of 7.2 on the Richter scale, resulted in significant damage to buildings due to brittle fracture. These fractures resulted from welding defects or cope holes in the webs on the bottom flange side of the welds [2]. After the earthquakes, various experimental studies, such as those conducted by the Architectural Institute of Japan [3], proved that brittle fractures occur owing to ductile cracks propagation by singularities in the shapes around the bottoms of cope holes and end tabs.
Several indices, such as J-value and crack tip opening displacement (CTOD) [4], which are used for the evaluation of brittle fractures, allow an overly safe assessment of building structures. This is because brittle fractures occur as a result of significant deformations of building structures, the stress–strain state at the crack tip constantly changes owing to ductile crack propagation, whereas the plastic constraint state at the crack tip of the material specimen used to obtain the fracture toughness significantly differs from that of the actual building structure. There currently exist various methods focused on the differences in plastic constraints, which are useful for the prediction and evaluation of brittle fractures. For example, the Japan Welding Engineering Society [5] proposed WES2808, which is a method for correcting the fracture driving force using the plastic constraint correction factor and the temperature shift concept. The applicability of their proposed method also expands to the CTOD design curve. Meanwhile, we demonstrated the effectiveness of the toughness scale model (TSM) [6] and Weibull stress approach [7], which is an extension of the Ritchie–Knott–Rice model [8], for the effective prediction of the failure of buildings based on previous studies on the occurrence of brittle fractures in beam-to-diaphragm joint specimens [9]. A study on the estimation of plastic deformation capacity [10] showed that the Weibull stress approach could be used to account for the effects of plastic constraints and cyclic loading. There is interest in the reliability of cracks, and not just in building structures. Coro et al. proposed a new model for structures made by additive manufacturing by extending the method developed for welded components [11]. Regarding fatigue crack propagation, a unique code that includes crack propagation was proposed for gas turbine welded structures [12].
In addition, other factors, such as different crack opening modes, affect the onset of brittle fractures. The defects at the ends of welds in building structures are affected by complex stresses, and the modes mentioned above act in a combinatorial manner [13]. Crack deformations can be classified into three modes, as follows: opening mode (Mode I), in-plane shear (Mode II), and out-of-plane shear (Mode III). As the current Weibull stress approaches assume the dominance of Mode I, they cannot be used to determine the influence of Modes II and III [14]. Thus, the development of an approach that ensures the accurate evaluation of fracture initiation considering different crack deformation modes would play a significant role in improving our understanding of the risk of brittle fracture occurrence in building structures.
In this study, we focused on the different modes acting on weld defects and we propose a mixed-mode ratio as a quantitative index for the ratios of Mode I to Mode II. The mixed-mode ratio may be inaccurate when a ductile crack propagates significantly. We targeted ductile crack growth of up to 20 mm in this study. Furthermore, we classified the brittle fracture results of several experiments using the mixed-mode ratio as the index and subsequently investigated its relationship with plastic deformation.

2. Fracture Tests

We conducted fracture tests on beam-to-diaphragm joint specimens that simulate full-penetration weld joints to reproduce the brittle fracture of a building structure after significant deformation. The experiments were intended to replicate the phenomenon of ductile crack growth from the end of the full-penetration weld between the flange and the diaphragm, followed by a brittle fracture. This study aimed to reproduce the experimental results through finite element analysis, achieve an effective prediction of the occurrence of brittle fractures through the TSM and Weibull stress approaches, and investigate the effect of different modes on the prediction accuracy. The variables used in the experiments included the location, shape, depth, and inserted tip radius of the crack. Among the several specimens used in the experiments, six specimens showed the occurrence of brittle fractures.

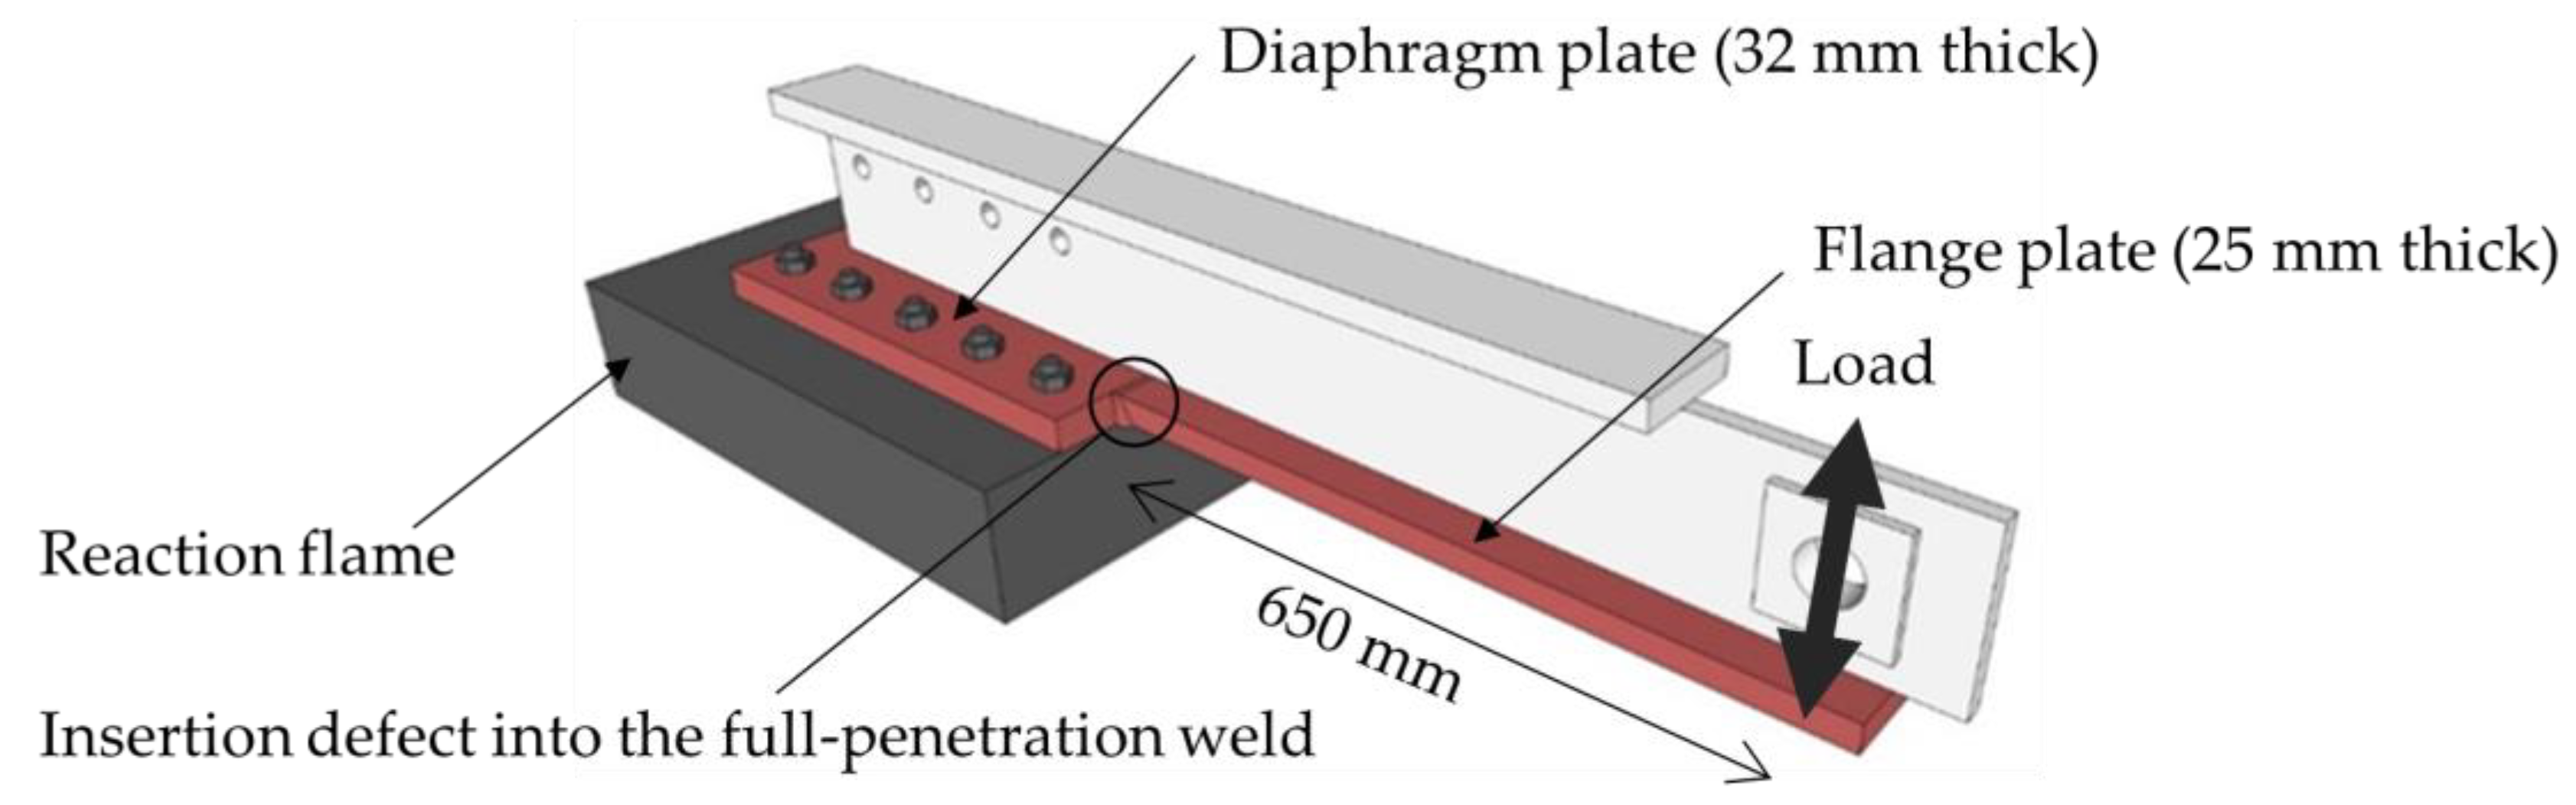
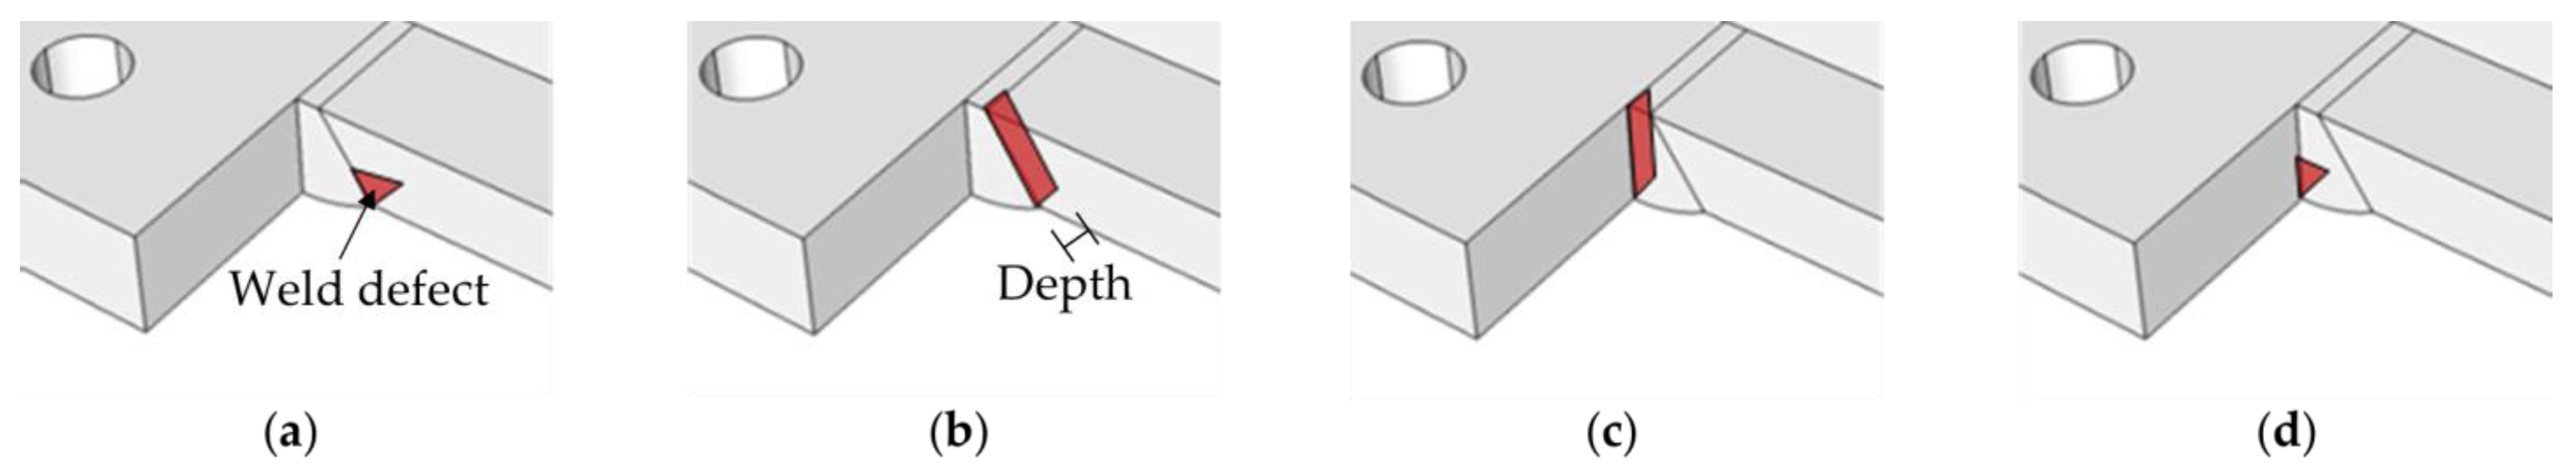
2.1. Specimens and Experimental Variables

The specimens used in the experiments included an I-section beam connected to rectangular hollow section (RHS) column joints through a diaphragm, as shown in Figure 1.
The bottom flange, diaphragm, and end of the full-penetration weld, which is shown in red in Figure 1, were simulated to create a beam-to-diaphragm joint specimen, which is shown in Figure 2.
The flange was 25 mm thick and 100 mm wide, the diaphragm was 32 mm thick and 225 mm wide, and the web was 16 mm thick and 150 mm long. All the plates were manufactured using SN490B, in accordance with the specifications provided by the Japanese Industrial Standards (JIS). All the welding assemblies were completed in the factory. The bottom flange was welded to the diaphragm through full-penetration welding using YGW18 in accordance with JIS. The welding process comprised seven layers and 10 passes. The heat input of each layer was below 40 kJ/cm, and the temperature between passes was under 350 °C.
The experimental variables included insertion location, shape, depth, and tip radius of the defect inserted at the beginning and at the end of the weld. Figure 3 shows the defect types. Table 1 shows a list of the experimental variables.
We considered two defect insertion locations: the diaphragm side and the flange side. We considered two defect shapes: through crack (TC) and surface crack (SC). The distance from the face of the flange to the crack tip represented the defect depth. The different crack tip radii of the defects were produced using two methods: copperplate insertion and mechanical notching. Based on the result after the brittle fracture, the crack tip radius obtained through a copper plate exhibited a sharp tip radius of approximately 0 mm. Figure 4 shows the copper plate insertion of the specimen.
The microscopic measurement of the mechanical notch defect confirmed the bluntness of the crack tip with a radius of approximately 0.15 mm. Figure 5 shows a magnified image of the notch tip.

2.2. Material Properties

In this study, we focused on ductile cracks propagating from the tip of the defect to the brittle fracture after significant deformation. To reproduce the brittle fracture initiation after ductile crack propagation, the fracture toughness of each specimen was determined through Charpy impact tests. The experimental temperature of the beam-to-diaphragm joint specimens was investigated based on the energy transition temperature. Table 2 shows the results of the Charpy impact test. The positions of the test pieces are the base metal of the flange plate, diaphragm plate, heat-affected zone (HAZ), and deposited weld metal (DEPO).
For the FTC and FSC specimens, the experimental temperature was set to −20 °C, which is slightly above the transition temperature of the welded metal, because the transition temperature of the flange was high. Although high transition temperatures were recorded at the diaphragms of the DTC and DSC specimens, the brittle fracture was expected to occur in the welded metal or in the HAZ. Therefore, the experimental temperature was set to −45 °C, which was between that of the two specimens.
The tensile coupon tests were conducted using the test pieces cooled to a temperature similar to that used in the experiments. Table 3 shows the results of the tensile coupon tests. Jc, which is the critical J value, was determined to be 152.46 N/mm through the single-edge notched bending (SENB) tests of the FTC and FSC specimens.

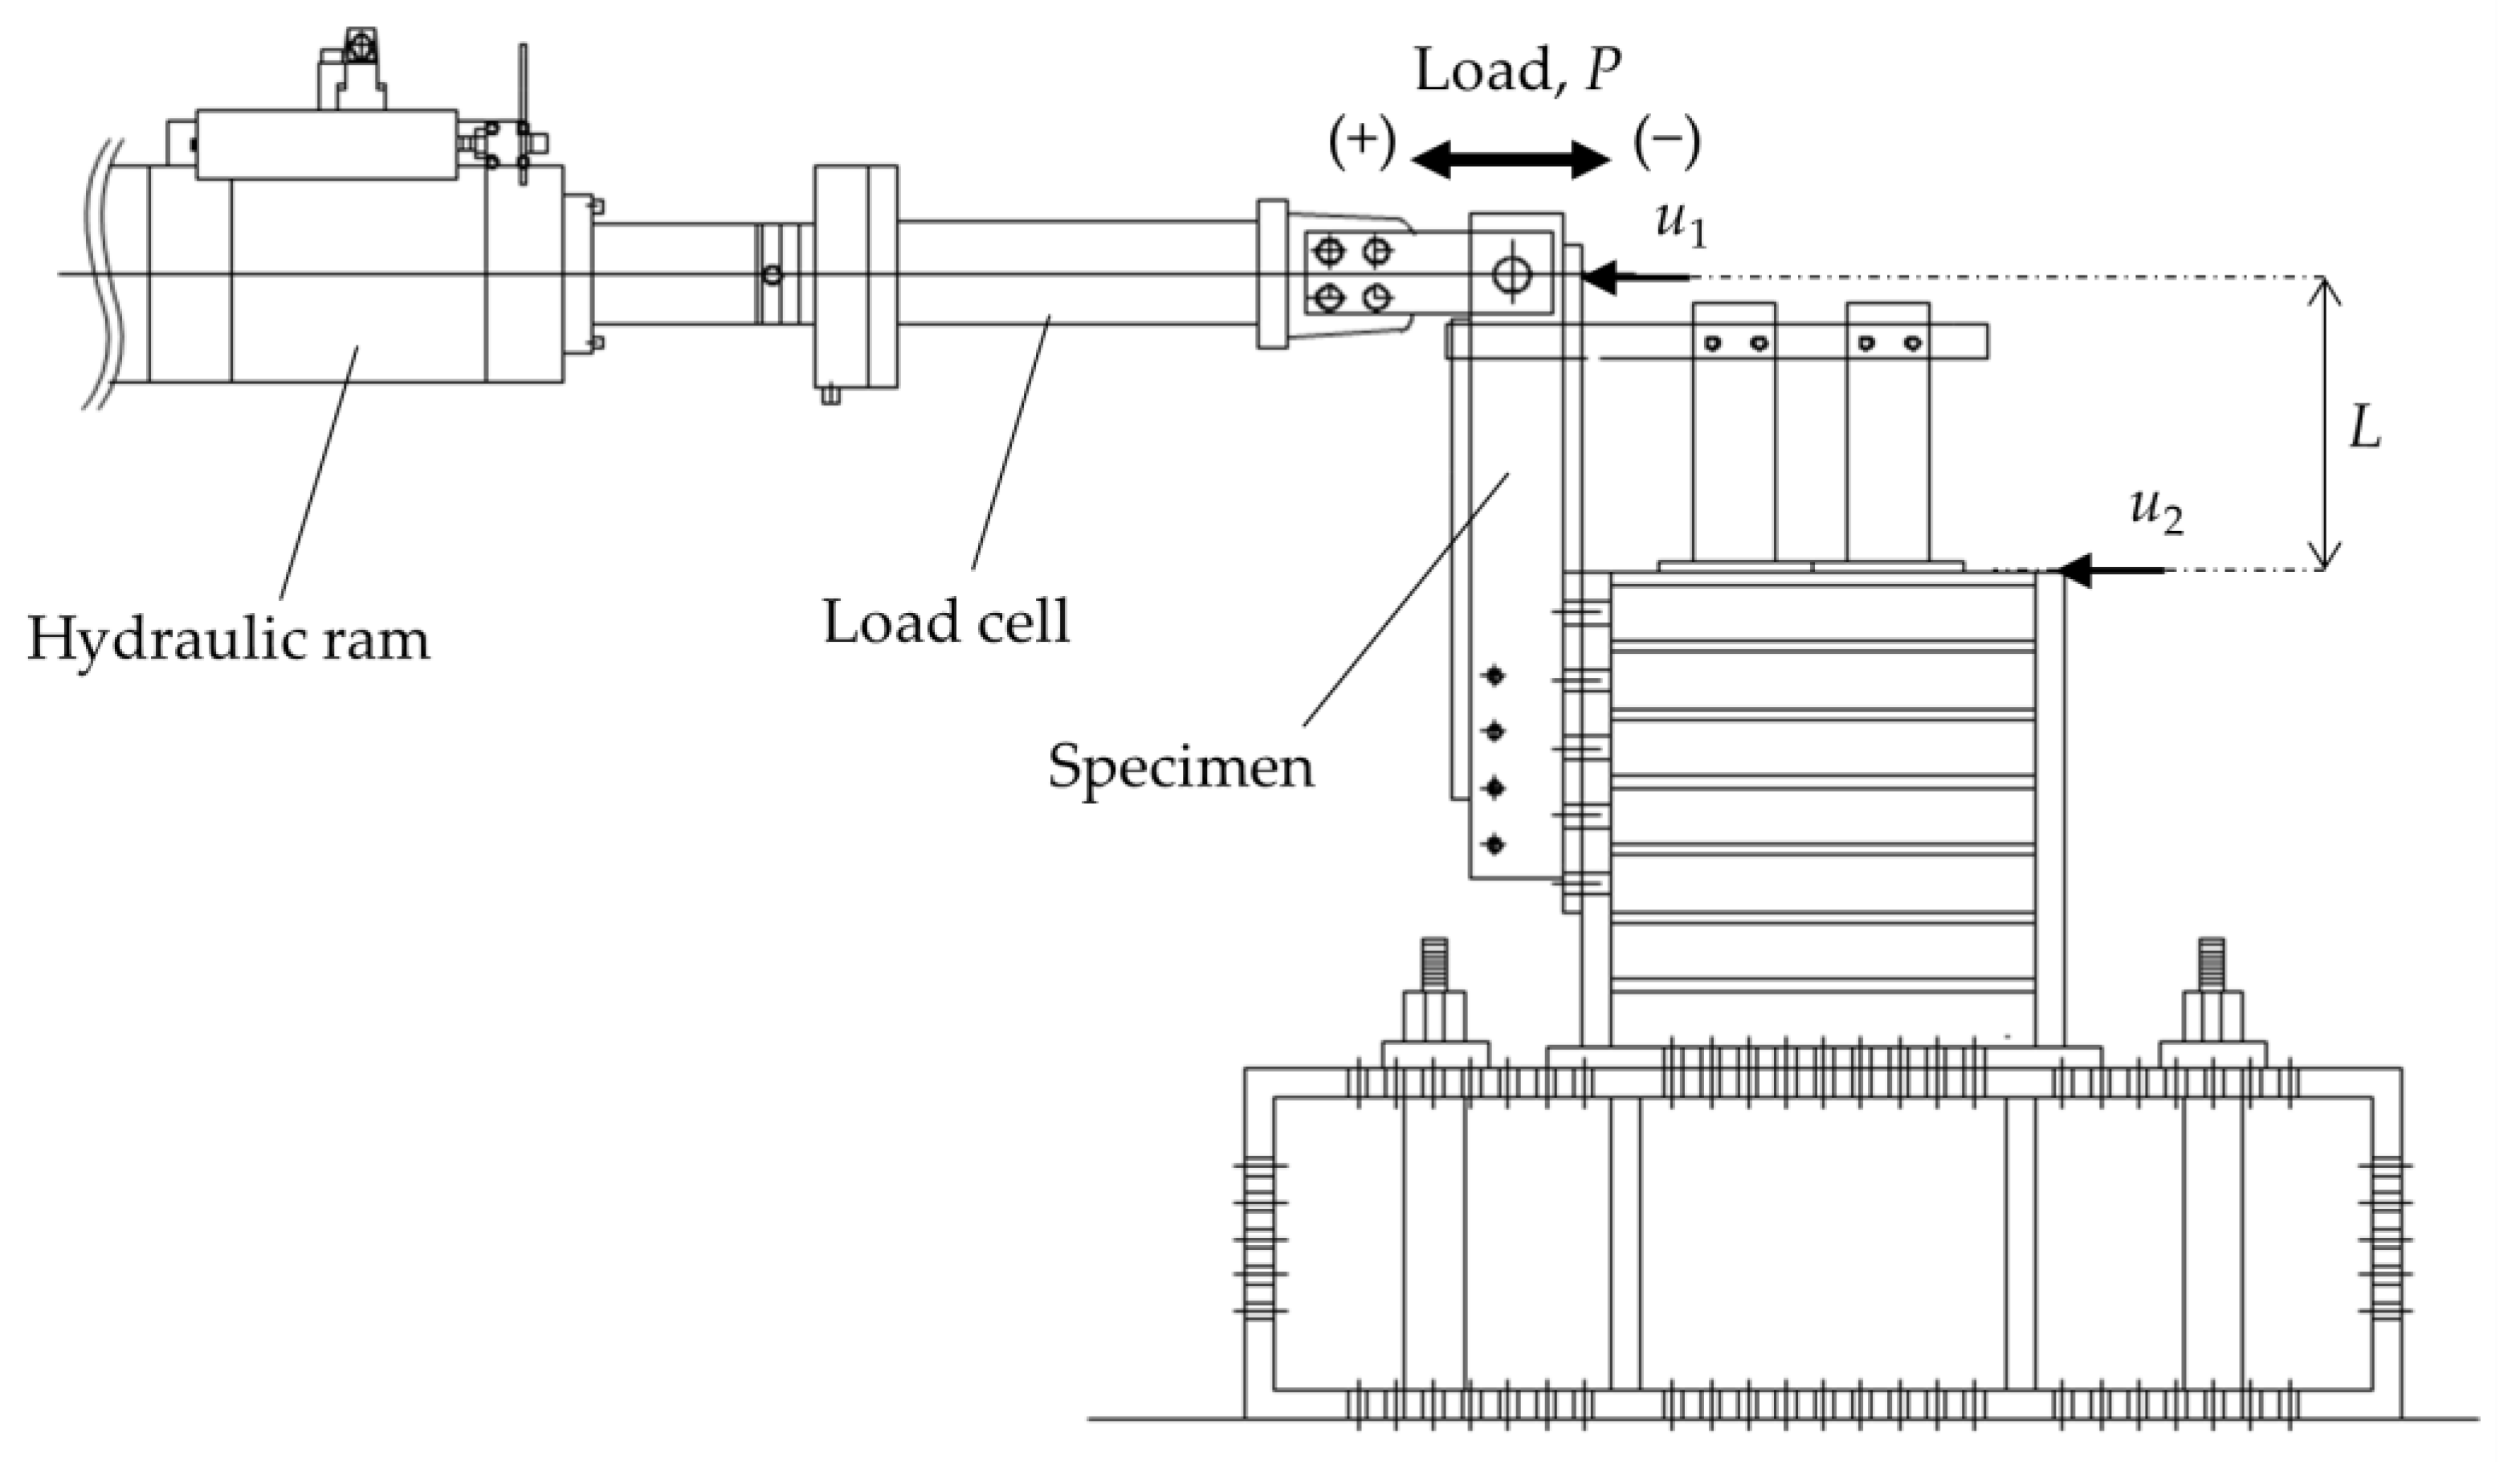
2.3. Testing Procedures

The diaphragm was fixed to the base using high-tension bolts and was loaded quasi-statically using hydraulic jacks. Figure 6 shows the installation and loading procedures of the test specimens.
The bending moment M and the relative rotation angle θ were calculated by:
M = P     L ,
θ = u 1 u 2 L ,
where L is the distance from the fixed end to the loading position, and u1 and u2 are the values measured using a high-sensitivity displacement meter at the position shown in Figure 6.
The tests were conducted at a ram head displacement rate of 0.05 mm/s. Cyclic loading comprised a few cycles in the elastic range. Subsequently, cantilever rotations of θp, 2θp, and 3θp with positive (tension) and negative (compression) displacement at each amplitude were conducted until failure. The full plastic moment Mp was calculated using the measured yield strengths of the materials. The rotations at the full plastic moment θp were calculated by dividing Mp by the elastic stiffness of the cantilever, which was determined using the slopes at the unloading portions of the hysteresis loops.

2.4. Test Results

Brittle fractures occurred in all specimens. Table 4 shows the experimental results of the strength and deformation of the specimens. We used the cumulative deformation factor η to indicate the plastic deformation capacity (see Appendix A for additional information on η).
Figure 7 shows the ductile crack growth and brittle fracture surface originating from the ductile crack tip.
Figure 8 shows the hysteresis loops obtained from the experiments.

3. Failure Moment Prediction

To numerically reproduce the experimental results, we performed finite element (FE) analysis using the general-purpose analysis software called ABAQUS (Ver. 2021, Dassault Systèmes, Paris, French). The elements were eight-node reduced integration elements following the von Mises yield condition. The hardening law follows isotropic hardening, and the Poisson’s ratio was set to 0.3. For the material definition, the tensile test results were converted to true stress-logarithmic strains, and 13 points were used to approximate the data. The model was fabricated as a half model, and the minimum element size was set to 0.05 mm at the defect tip. The defect shape was determined by evaluating the fracture surface after the experiment. Monotonic loading was followed. This analysis did not consider the propagation of the ductile crack. An example of the analytical model is shown in Figure 9.

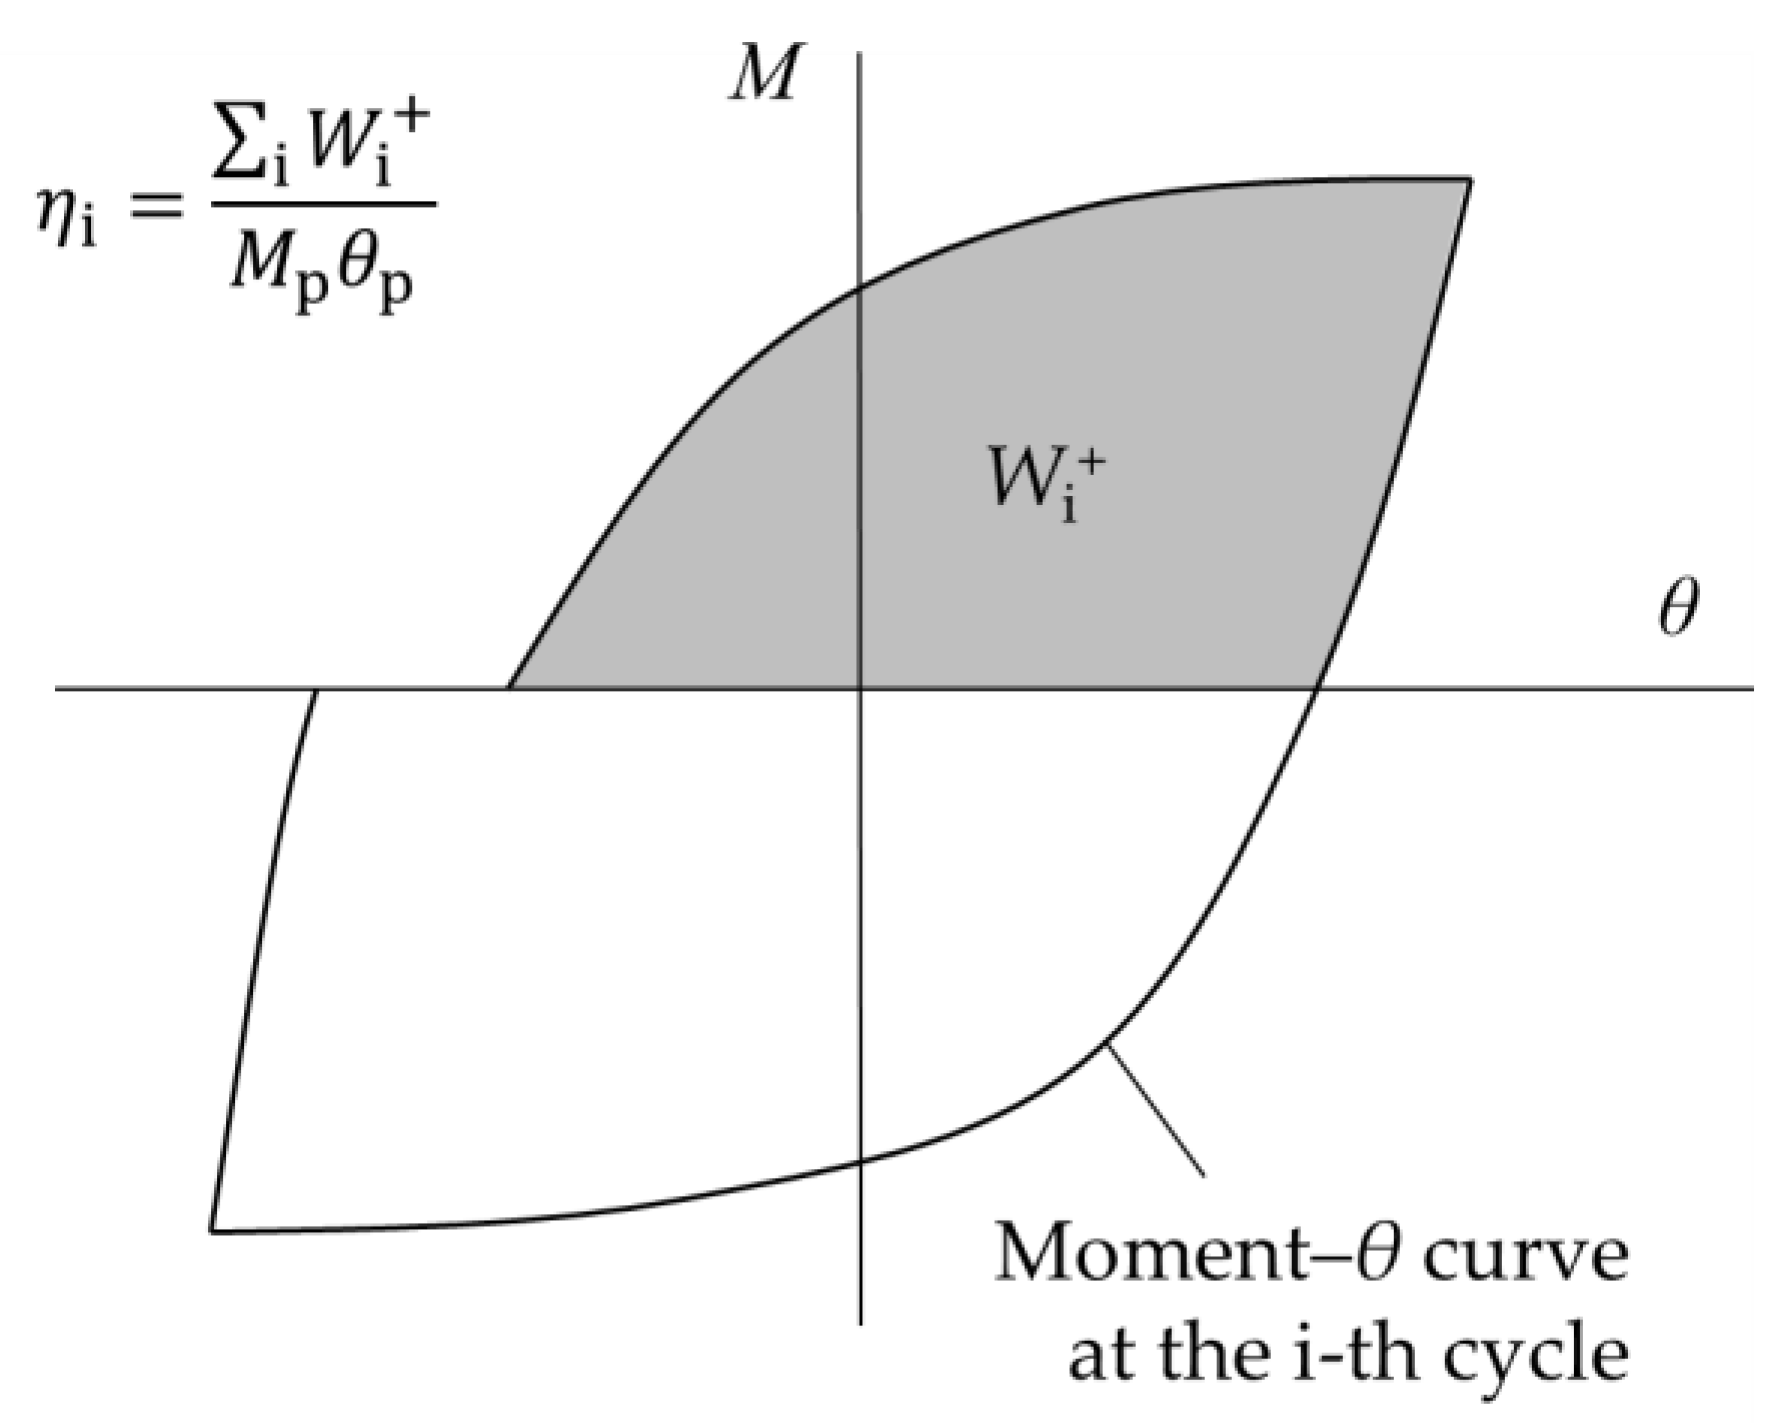
3.1. Elastic–Plastic Analysis of the Test Results

Figure 10 shows the comparison between the experimental and the analysis results. As the analysis was based on one-sided loading, the experimental results involved skeletal curves, with the history curve replaced by monotonic loading. The experimental and analytical results corresponded well. Therefore, the analysis captured the macroscopic behavior of the specimens during the experiments.

3.2. TSM Approach

Under small-yield conditions, the fracture toughness at the crack tip can be determined univocally using the J-integral. However, as the deformation of the member increases and the plasticity increases, the fracture limit of the material cannot be determined using the J-integral due to a plastic constraint. The SENB specimens used to obtain J were subjected to a more significant plastic constraint at the crack tip. Anderson and Dodds [6] focused on the extent of this high-stress region. They proposed that for specimens under different plastic constraints, the probability of the occurrence of brittle fractures is equal when the volumes of the high-stress regions at the crack tips are equal.
In this study, the apparent fracture toughness value appJc was determined by increasing the J value through the high-stress region. The flat area of the crack tip bounded by a constant maximum principal stress contour replaced the volume of the highly stressed region. The maximum principal stress was assumed to be σ1 = 3σY.
Figure 11 shows an example of the determination of appJc. The calculated fracture moment for each specimen was the bending moment when J reached appJc, not Jc.

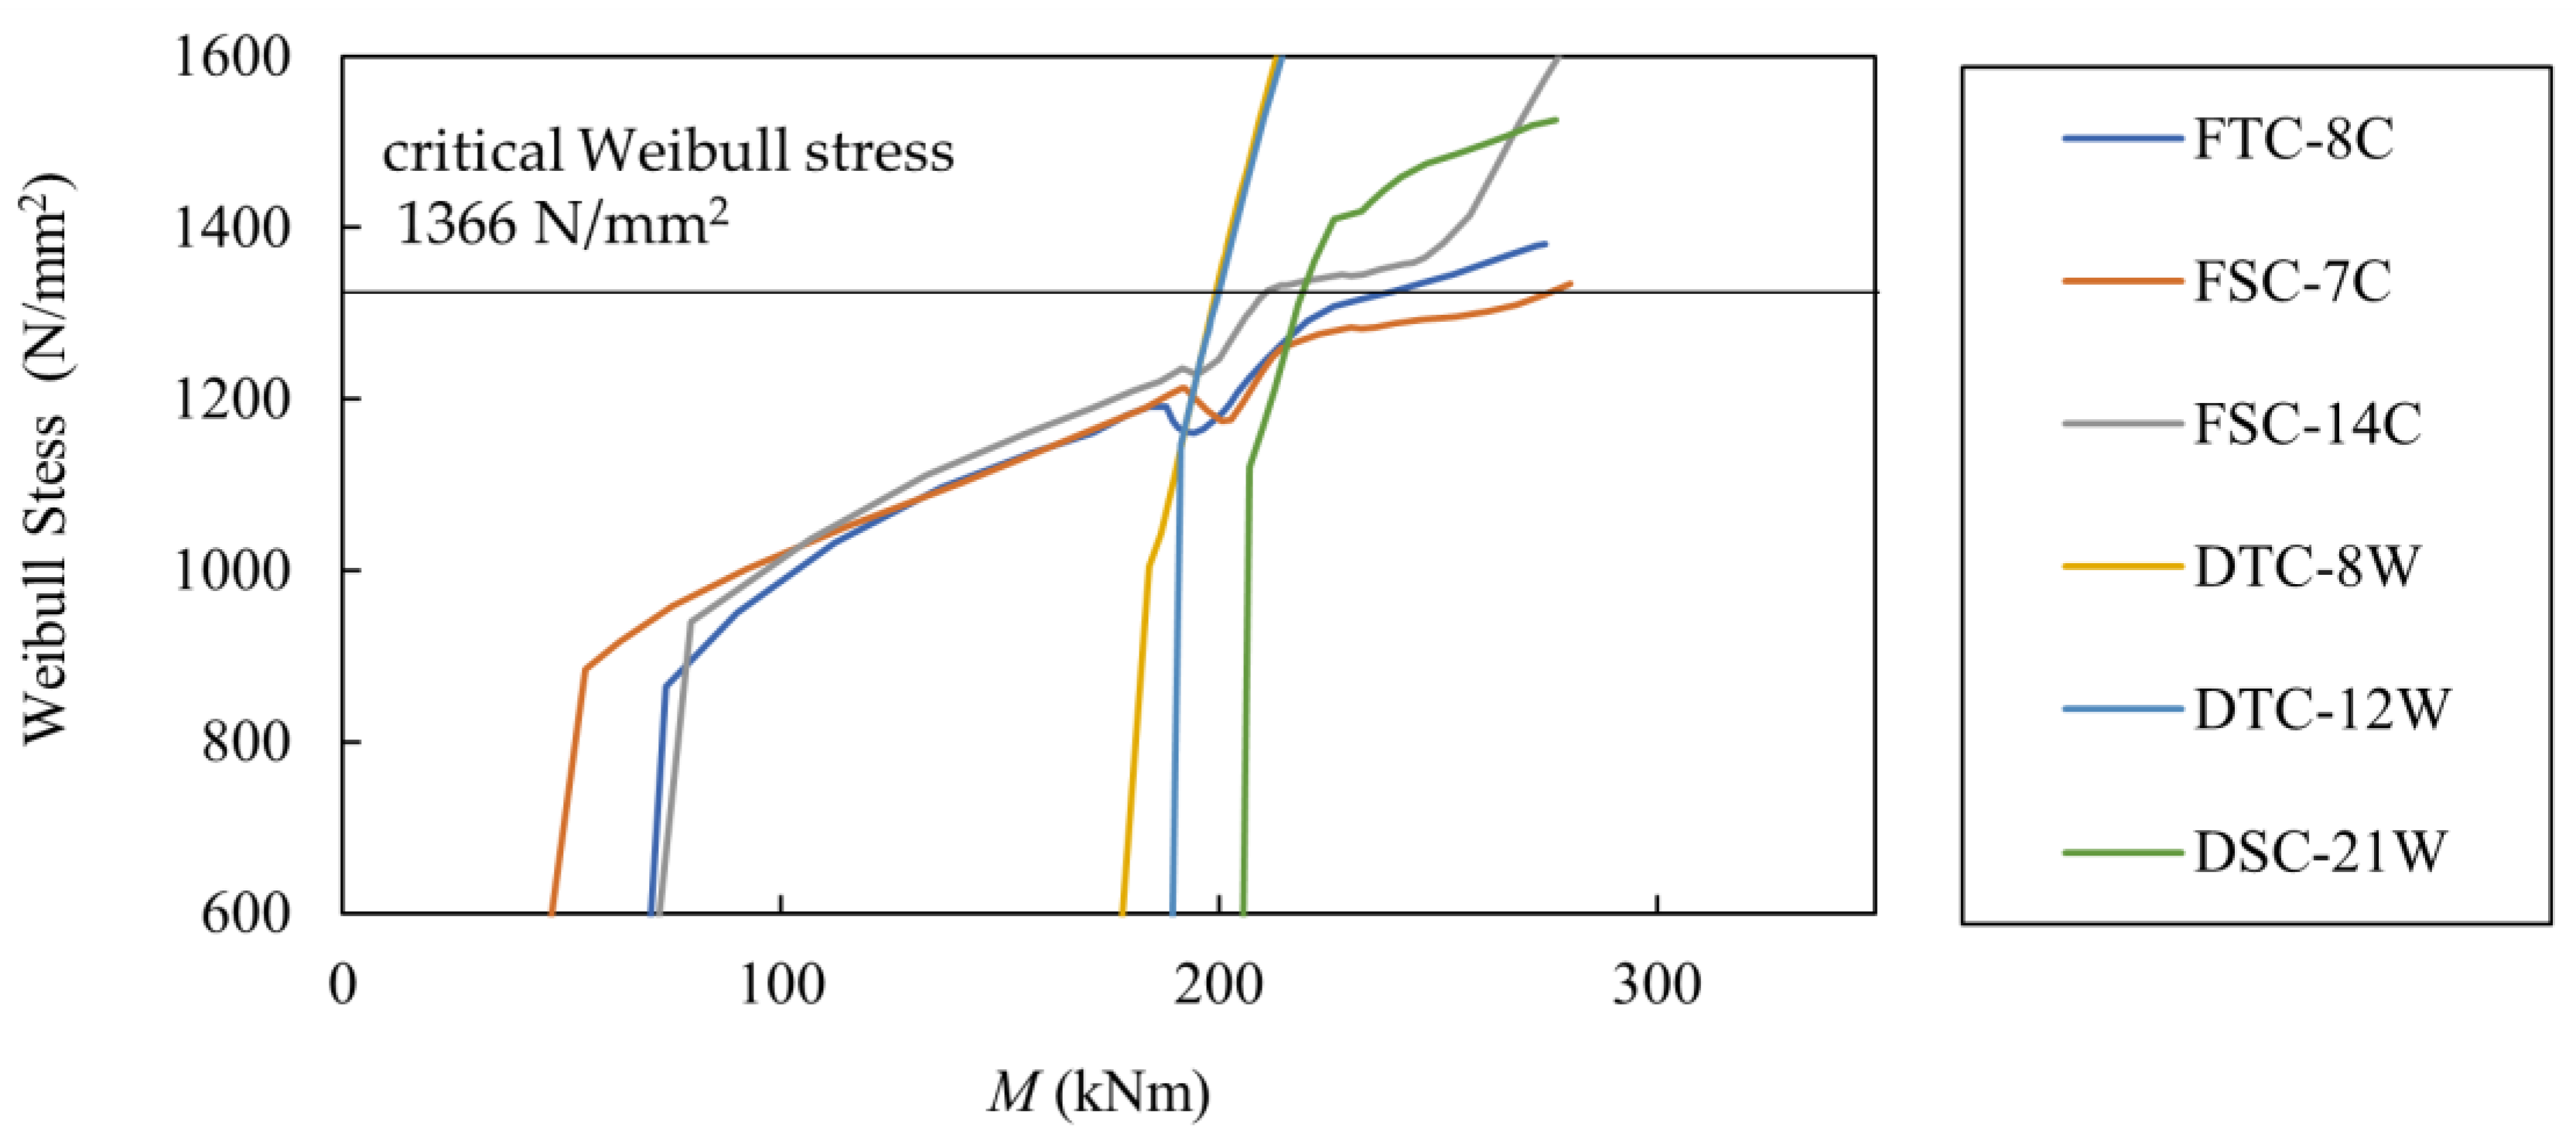
3.3. Weibull Stress Approach

A significant variation in fracture toughness was observed, especially, when transitioning from ductile cracks to brittle fractures. This variation can be attributed to the factors that cause brittle fractures at the crack tip. Beremin [7] proposed a local approach for evaluating the variations in fracture toughness using a statistical method. Based on this approach, brittle fractures occur when a microcrack is subjected to a specific effective stress, in which the limit of the weakest microcrack is regarded as the limit of the entire material. In other words, brittle fractures are considered to follow the weakest link model. Because the failure probability of the weakest link model follows a Weibull distribution, the probability of brittle fracture occurrence is expressed as:
F ( σ W ) = 1 exp [ ( σ W σ u ) m ] ,
where σW denotes the Weibull stress, σu denotes the scale parameter corresponding to the Weibull stress with a cumulative probability of failure that is equal to 63.2%, and m is the Weibull slope which is a shape parameter that characterizes the scatter of the Weibull stress. For structural steel, m ranges from 10 to 50 [16]. Typically, m has a low value in the case of low-level, broadly distributed fracture toughness. In this study, the fracture process zone was the region with a maximum principal stress at the crack tip of 3σY or greater. This parameter can be expressed as follows:
σ W m = 1 V 0 V p σ eff m d V ,
where σeff denotes the effective stress, Vp denotes the fracture process zone, and V0 is a unit volume, set to 1 mm3.
The maximum likelihood estimation proposed by Riesch-Oppermann and Diegele [17] was used to calculate m. In this study, we used the maximum principal stress as the effective stress. The fracture process zone was determined as the region in which the maximum principal stress exceeded 3σY or greater. Based on the results obtained through several SENB tests, m was determined to be 32. The critical value of the Weibull stress, σW,cr = 1324 N/mm2, was determined as the Weibull stress at Jc = 152.46 N/mm in the analysis.
Figure 12 shows the relationship between the Weibull stress and the bending moment for each specimen. The calculated failure moment was achieved when the Weibull stress reached the limit determined through elastic–plastic analysis.

3.4. Prediction Results

The predicted failure moments of the beam-to-diaphragm joint specimens were calculated according to the procedure described in Section 3.2 and Section 3.3. The results are summarized in Table 5, where TSMMpre and WMpre represent the predicted bending moments of failure calculated using the TSM approach and the Weibull approach, respectively.
Based on the similar magnitudes of the predicted bending moments, the results of the fracture prediction methods were verified. For the FTC-8C, FSC-7C, and FSC-14C defects with sharp crack tips, both approaches accurately predicted the occurrence of fractures. Both approaches also demonstrated high accuracy in predicting the fracture behavior of FSC-7C, in which brittle fractures occurred after significantly high plastic deformations (η = 24), suggesting that both approaches can be used to effectively predict brittle fractures after a significant deformation of building structures. In contrast, low prediction accuracy was noted for the DTC-8W, DTC-12W, and DSC-21W specimens. This can be attributed to the crack tips and relaxed plastic constraint of these specimens. Thus, this contradicts the idea that the Weibull stress approach is unaffected by plastic constraints. In addition to the differences in the crack tip radii, prediction accuracy could also be affected by the defect location. The location and shape of the defect also affect the plastic constraint; however, the crack opening mode is also different. The following section will focus on differences in the crack opening mode and discuss their impact on prediction accuracy.

4. Effect of the Crack Opening Modes

Different crack opening modes affect the crack tip depending on the type, depth, and location of a crack. Although various modes act in combination in a building structure, only Mode I is involved in the SENB test when obtaining the fracture toughness value. As Mode III, which is an out-of-plane shear type fracture, has minimal effect of the occurrence of brittle fractures, this study focused on Modes I and II only and proposes a mixed-mode ratio RI as the first step to capture the effect of different modes on the initiation of brittle fractures.

4.1. Mixed-Mode Ratio Methodology

In their study on the effect of different crack opening modes through material testing, Shimizu et al. [14] defined the ratio of Mode II to Mode I using the energy release rate in the initial deformation stage. In this study, we considered the ratio of Mode II to Mode I using the stress intensity factor. The mixed-mode ratio RI is defined as follows:
R I = 2 π tan 1 K I K II ,
where KI and KII represent the stress intensity factors for Mode I and Mode II, respectively, and RI represents the slope of KI and KII, which has a maximum value of 1.0 and decreases with the increase in Mode II.

4.2. Elastic Analysis of the Stress Intensity Factor

The stress intensity factor is the maximum value on the circumferential integral path at 0.2 mm from the crack tip. The stress intensity factor was defined for small-scale yielding conditions and is calculated for linear isotropic materials using ABAQUS. The direction of crack propagation is considered as the direction of the maximum energy release rate. The analytical model and other conditions for the elastic analysis of the stress intensity factor were similar to those of the elastic–plastic analysis.
Figure 13 shows an example of the comparison between the elastic and the elastic–plastic analyses. Although we observed a gap between the results after yielding, the transitions of the elastic and elastic–plastic analyses appeared almost identical in the initial stage of the deformation. Therefore, the KI values and KII at θ = 0.01 rad, which were linearly correlated, were adopted to calculate RI.

4.3. Relationship between Mixed-Modes and Fracture Toughness

The effect of the mixed-mode ratio, which quantifies the difference in the crack opening modes, on fracture toughness was investigated. The mixed-mode ratios for each specimen are listed in Table 6. To compare the crack tip and mode differences, the results of FTC-8W, FSC-7W, and FSC-14W are also listed in Table 6, in addition to the six tested specimens.
Comparing FTC-8C and FTC-8W, FSC-7C and FSC-7W, and FSC-14C and FSC-14W, it appears that RI was not affected by the differences in the crack tip radius. Meanwhile, the defect depth caused a slight difference, such as that between FSC-7C and FSC-14C. As for the defect position, RI decreased for defects on the diaphragm side, as observed for FTC-8W and DTC-8W. This result is consistent with the assumption that the defects on the diaphragm side, which are horizontal to the loading direction, were subjected to stronger shear deformation than those on the flange side. For FTC-8C and FSC-7C, the difference in the defect shape had a relatively considerable effect on RI. In both cases, the defects demonstrated higher RI values than the surface defects compared to the flange- or diaphragm-side defects.
For the defects, the crack tip line was parallel to the axis of symmetry of the specimen and was under a crack opening mode similar to that of the notched tensile test at both ends, resulting in different RI values. Considering the experimental results of η as a measure of plastic deformation, the plastic deformation capacity tended to increase as RI decreased, i.e., as the percentage of Mode II crack increased. However, these variations also resulted in brittle fractures, as shown for DTC-8W and DTC-12W, where the trends of the defect depth and plastic deformation capacity were reversed, whereas that of other conditions remained the same. Thus, further research is required to determine the factors that affect fracture toughness.
Figure 14 shows the relationship between RI and fracture prediction accuracy, as shown in Table 5. High prediction accuracy was obtained for the three specimens with RI above 0.90 and with Mode I as the dominant mode, whereas the prediction accuracy for the three specimens with lower values of RI varied. No clear correlation was obtained. This suggests that the increased influence of Mode II resulted in an increased difficulty of failure prediction.

5. Conclusions

In this study, the TSM and Weibull stress approaches were used to predict the occurrence of brittle fractures in building structures using beam-to-diaphragm joint specimens. In addition, we attempted to quantify the mixed-mode ratio of the crack opening modes as an initial approach to investigate the prediction of brittle fractures under different crack opening modes. The findings of this study are as follows:
  • The TSM and Weibull stress approaches generated similar predictions. Further, both methods can be used for the prediction of brittle fractures. The prediction results obtained through both methods were similar.
  • We calculated the mixed-mode ratio RI using the stress intensity factor at the initial stage of deformation. Up to θ = 0.01 rad, the results obtained through the elastic and the elastic–plastic analyses were similar, and RI followed a linear trend.
  • RI demonstrated differences in the crack opening modes owing to deformations in crack tips, regardless of the crack tip radii. Based on RI, crack opening mode differences resulting from crack location and shape can be appropriately classified. The relationship between fracture prediction and RI suggests that different crack opening modes affect the brittle fractures of building structures.
Ductile crack growth was not considered in the analysis of this study. Therefore, if a substantial ductile crack propagates, the mixed-mode ratio may not capture the difference in modes for the actual specimen. Further study is needed to clarify the mixed-mode ratio’s range of application and evaluate ductile crack growth.

Author Contributions

Data curation, T.A.; Formal analysis, T.A.; Investigation, T.A., K.A. and T.I. (Tsutomu Iwashita); Methodology, K.A. and T.I. (Tsutomu Iwashita); Resources, T.I. (Toshiomi Itatani); Writing—original draft, T.A. All authors have read and agreed to the published version of the manuscript.

Funding

This study was partly supported by the Japanese Society for the Promotion of Science Grant-in-Aid for Scientific Research, No. 19K04699 and No. 19K04721.

Institutional Review Board Statement

Not applicable.

Informed Consent Statement

Not applicable.

Data Availability Statement

Not applicable.

Conflicts of Interest

The authors declare no conflict of interest. The funders had no role in the design of the study or in the collection, analyses, or interpretation of data as well as in the writing of the manuscript or in the decision to publish the results.

Appendix A

The cumulative plastic deformation factor η is defined as the sum of ηi sustained by the specimen until failure occurs and is expressed as follows:
η = i η i ,
where ηi represents the plastic energies dissipated during the i-th positive cycles, which are non-dimensionalized by dividing the energy by Mpθp, and is obtained as follows:
η i = i W i + M p θ p ,
where Wi+ denotes the energy absorbed at the i-th positive cycle, as shown in Figure A1.
Figure A1. Energy absorbed at the i-th positive cycle.
Applmech 02 00049 g0a1

References

  1. Federal Emergency Management Agency (FEMA). Internal guidelines: Evaluation, repair, modification, and design of welded steel moment-frame structures. In FEMA-267, Prepared by the SAC Joint Venture for FEMA; FEMA: Washington, DC, USA, 1995. [Google Scholar]
  2. Kinki, A.I.J. Reconnaissance Report on Damage to Steel Building Structures Observed from the 1995 Hyogoken-Nanbu Earthquake. Committee on Steel Building Structures. The Kinki Branch of the Architectural Institute of Japan. 1995. Available online: http://news-sv.aij.or.jp/kinki/activity/research/s_struct/tekkotu-e.pdf/ (accessed on 14 October 2021).
  3. Kinki, A.I.J. Full-Scale Test on Plastic Rotation Capacity of Steel Wide-Flange Beams Connected with Square Tube Steel Columns. Committee on Steel Building Structures. The Kinki Branch of the Architectural Institute of Japan. 1997. Available online: https://www.jstage.jst.go.jp/article/jssc1994/4/16/4_16_27/_article/-char/en (accessed on 14 October 2021). (In Japanese).
  4. British Standards Institution. Guidance on Methods for Assessing the Acceptability of Flaws in Metallic Structures, BS 7910. 1999. Available online: https://www.academia.edu/33758342/Guide_to_methods_for_assessing_the_acceptability_of_flaws_in_metallic_structures (accessed on 14 October 2021).
  5. WES2808. The Japan Welding Engineering Society: Method of Assessing Brittle Fracture in Steel Weldments Subjected to Large Cyclic and Dynamic Strain. 2003. Available online: http://www-it.jwes.or.jp/wes_ki/en/iwes.jsp?ct1=1&ct2=2 (accessed on 14 October 2021).
  6. Anderson, T.L.; Dodds, R.H., Jr. Specimen size requirements for fracture toughness testing in the ductile-brittle transition region. J. Test. Eval. 1991, 19, 123–134. [Google Scholar]
  7. Beremin, F.M. A local criterion for cleavage fracture of a nuclear pressure vessel steel. Metall. Trans. A 1983, 14, 2277–2287. [Google Scholar] [CrossRef]
  8. Ritchie, R.O.; Knott, J.F.; Rice, J.R. On the relationship between critical tensile stress and fracture toughness in mild steel. J. Mech. Phys. Solids 1973, 21, 395–410. [Google Scholar] [CrossRef]
  9. Akahoshi, T.; Azuma, K.; Iwashita, T. Prediction of brittle fracture initiating at defects in the end of complete penetration groove welds. In Proceedings of the 25th International Ocean and Polar Engineering Conference, Kona, HI, USA, 21–26 June 2015; Volume 4, pp. 189–196. [Google Scholar]
  10. Iwashita, T.; Azuma, K. Prediction of brittle fracture in notched specimens under cyclic loading. J. Constr. Steel Res. 2019, 162, 105721. [Google Scholar] [CrossRef]
  11. Coro, A.; Macareno, L.M.; Aguirrebeitia, J.; López de Lacalle, L.N. A Methodology to Evaluate the Reliability Impact of the Replacement of Welded Components by Additive Manufacturing Spare Parts. Metals 2019, 9, 932. [Google Scholar] [CrossRef] [Green Version]
  12. Coro, A.; Abasolo, M.; Aguirrebeitia, J.; Lopez de Lacalle, L. Inspection scheduling based on reliability updating of gas turbine welded structures. Adv. Mech. Eng. 2019, 11. [Google Scholar] [CrossRef] [Green Version]
  13. Qian, X.; Li, Y.; Ou, Z. Ductile tearing assessment of high-strength steel X-joints under in-plane bending. Eng. Fail. Anal. 2013, 28, 176–191. [Google Scholar] [CrossRef]
  14. Shimizu, K.; Ohata, M.; Shoji, H.; Kato, T.; Tanigawa, H. Local Approach for Elastic-Plastic Fracture Assessment of Cracked Component under Mixed Mode Loading. In Proceedings of the 29th International Offshore and Polar Engineering Conference, Honolulu, HI, USA, 16–21 June 2019; ISOPE: Mountain View, CA, USA, 2019. [Google Scholar]
  15. Azuma, K.; Akahosh, T.; Iwashita, T. Prediction of brittle fracture from defects at groove face of complete joint penetration welded joints. Weld. World 2016, 60, 757–766. [Google Scholar]
  16. Minami, F.; Ohata, M.; Shimanuki, H.; Handa, T.; Igi, S.; Kurihara, M. Method of constraint loss correction of CTOD fracture toughness for fracture assessment of steel components. Eng. Fract. Mech. 2006, 73, 1996–2020. [Google Scholar] [CrossRef]
  17. Riesch-Oppermann, H.; Diegele, E. Elements of A Fracture Mechanics Concept for the Cleavage Fracture Behavior of RAFM Steels Using Local Fracture Criteria; FZKA Report; Forschungszentrum: Karlsruhe, Germany, 2002; Volume 6668. [Google Scholar]
Figure 1. Target parts of the experiments.
Applmech 02 00049 g001
Figure 2. Configuration of the beam-to-diaphragm joint specimen.
Applmech 02 00049 g002
Figure 3. Locations and shapes of the defects: (a) flange surface crack (FSC), (b) flange through crack (FTC), (c) diaphragm through crack (DTC), and (d) diaphragm surface crack (DSC).
Applmech 02 00049 g003
Figure 4. Copper plate insertion of the FTC specimen: (a) before and (b) after welding.
Applmech 02 00049 g004
Figure 5. Tip radius of the wire-cut notch of the DTC specimen: (a) notch position and (b) magnified view.
Applmech 02 00049 g005
Figure 6. Positions for the load application and displacement measurements.
Applmech 02 00049 g006
Figure 7. Fracture surfaces of the (a) FTC-8C and (b) FSC-14C specimens.
Applmech 02 00049 g007
Figure 8. Hysteresis loops of the specimens: (a) FTC-8C, (b) FSC-7C, (c) FSC-14C, (d) DTC-8W, (e) DTC-12W, and (f) DSC-21W. The vertical axes of the loops are non-dimensionalized by dividing their values by Mp. (ac): Reprinted with permission from Ref. [15]. Copyright 2016 Springer Nature.
Applmech 02 00049 g008
Figure 9. Typical mesh for FE Analysis.
Applmech 02 00049 g009
Figure 10. Moment vs. rotation curves obtained through the experimental and FE analysis.
Applmech 02 00049 g010
Figure 11. Failure moment prediction using TSM: (a) J-integral vs. area curves and (b) J-integral vs. moment curves.
Applmech 02 00049 g011
Figure 12. Weibull stress vs. moment curves.
Applmech 02 00049 g012
Figure 13. Comparison of the elastic and elastic–plastic analyses.
Applmech 02 00049 g013
Figure 14. Relationship of the prediction accuracy and RI of (a) TSM approach and (b) Weibull stress approach.
Applmech 02 00049 g014
Table 1. Experimental variables for the specimens.
SpecimenDefect LocationDefect ShapeDefect Depth
(mm)
Defect Tip
Radius
(mm)
FTC-8CFlange sideThrough crack8
FSC-7CFlange sideSurface crack7
FSC-14CFlange sideSurface crack12
DTC-8WDiaphragm sideThrough crack80.15
DTC-12WDiaphragm sideThrough crack120.15
DSC-21WDiaphragm sideSurface crack210.15
Table 2. Charpy impact test results.
SpecimenSectionvE0 (J)vEshelf (J)vTE (°C)
FTC, FSCFlange plate114.4201.2−5.0
Diaphragm plate169.8237.2−20.1
HAZ195.1218.6−39.5
DEPO189.0214.8−34.8
DTC, DSCFlange plate200.0247.7−34.3
Diaphragm plate136.5268.3−12.6
HAZ136.5300.0−58.6
DEPO136.5300.0−33.6
vE0: Charpy absorbed energy at 0 °C; vEshelf: shelf energy obtained through the Charpy tests; vTE: energy transition temperature.
Table 3. Tensile coupon test results.
SpecimenSectionYield Stress
(MPa)
Tensile Strength
(MPa)
Young’s
Modulus
(GPa)
FTC, FSCFlange plate347534213
Diaphragm plate375556210
Web plate375536206
DTC, DSCFlange plate388566218
Diaphragm plate377580210
Web plate352557213
Table 4. Strength magnification and deformation capacity of the specimens.
SpecimenMf
(kNm)
Mf/Mpη
FTC-8C243.11.418.5
FSC-7C275.21.5424.3
FSC-14C219.41.274.2
DTC-8W305.21.5532.9
DTC-12W291.41.4635.4
DSC-21W265.81.3416.5
Mf: Moment at brittle fracture; η: Cumulative deformation factor.
Table 5. Failure moment prediction results.
SpecimenExperimentTSM ApproachWeibull Approach
MfJcappJcTSMMpreMf/TSMMpremσW,crWMpreMf/WMpre
(kNm)(N/mm)(N/mm)(kNm)(N/mm2)(kNm)
FTC-8C243.1152.46400.7249.50.97321324238.001.02
FSC-7C275.2480.5273.81.01275.321.00
FSC-14C219.4338.5226.40.97210.651.04
DTC-8W305.2152.1209.71.46204.791.49
DTC-12W291.4185.7211.81.38199.901.46
DSC-21W265.8406.0237.11.12219.141.21
Mf: moment at brittle fracture occurrence; TSMMpre: predicted failure moment using the TSM approach; WMpre: predicted failure moment using the Weibull approach.
Table 6. Mixed-mode ratios for each specimen.
SpecimenExperimental ResultsMixed-Mode Ratio
MfηθKIKIIRI
(kNm) (rad)(Pa·m1/2)(Pa·m1/2)
FTC-8C243.180.01149721.00
FTC-8W171651.00
FSC-7C275.22410511400.92
FSC-7W962360.98
FSC-14C219.4413851320.94
FSC-14W13151210.94
DTC-8W305.23315422510.90
DTC-12W291.43517773730.87
DSC-21W265.81620466340.81
Publisher’s Note: MDPI stays neutral with regard to jurisdictional claims in published maps and institutional affiliations.

