A Study on a New Method for Flexoelectric Coefficient Estimation of the Flexoelectric Unimorph Sensing Element


Abstract
:1. Introduction
2. Structural Analysis
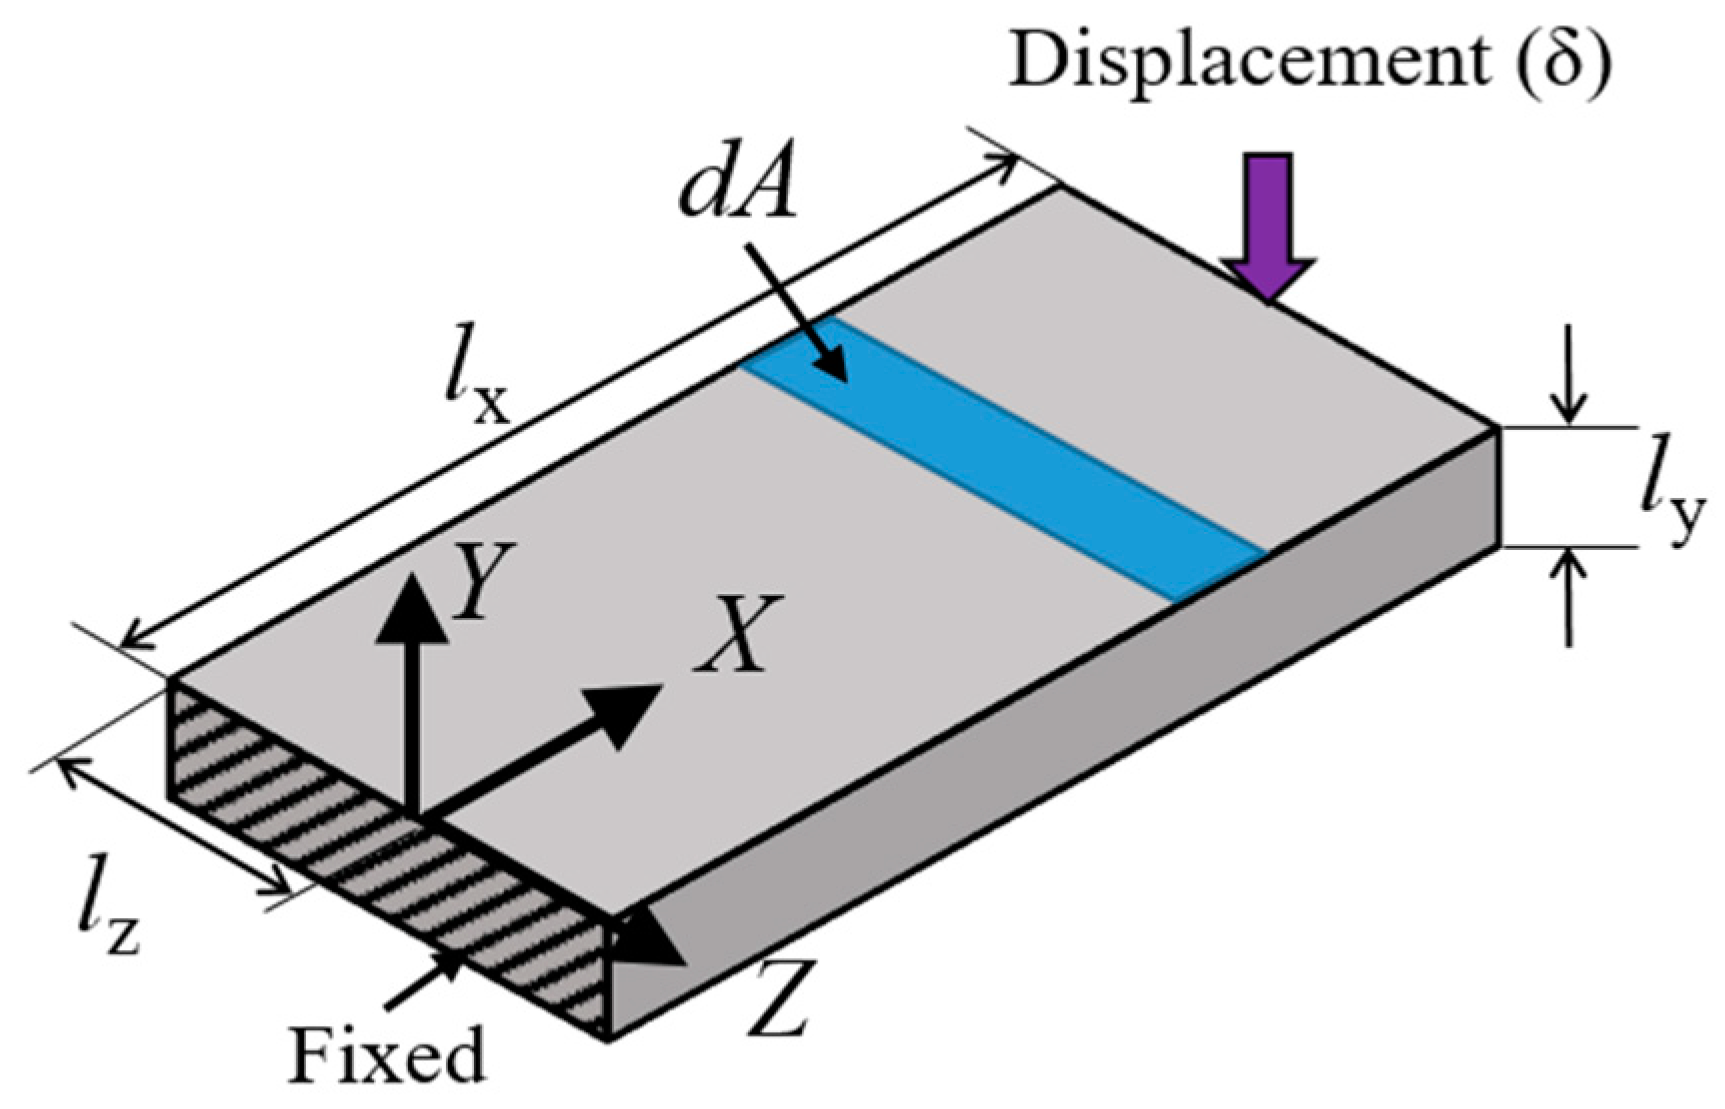
2.1. Flexoelectricity and the Sensing Element
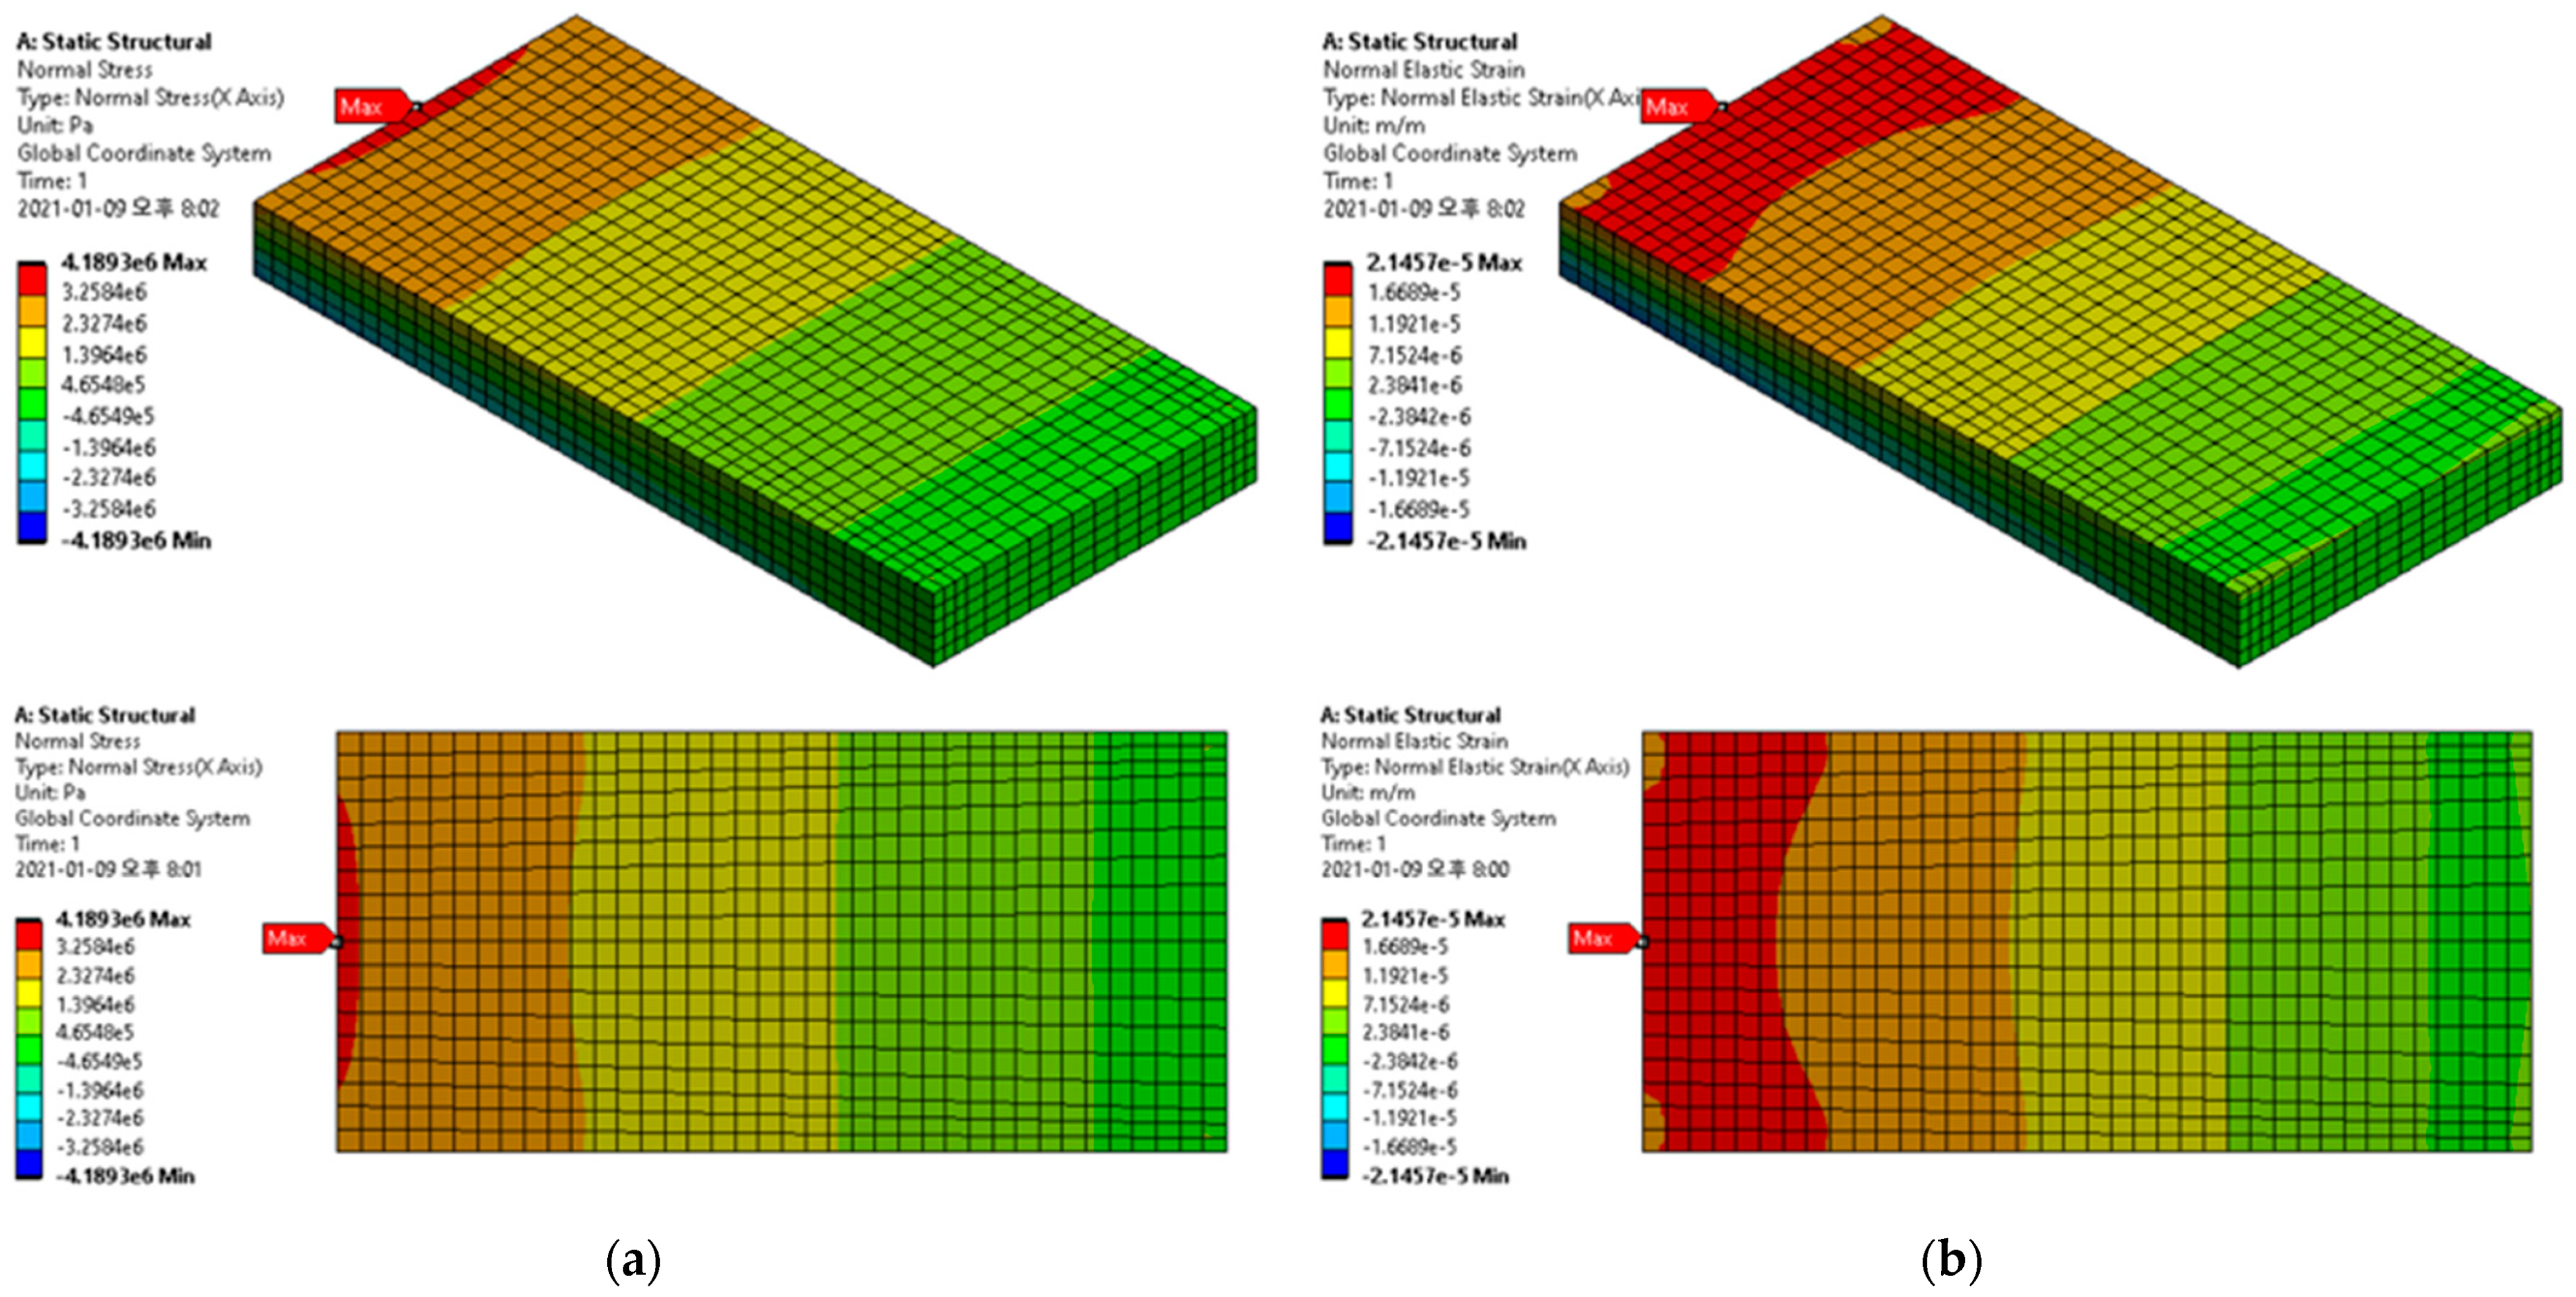
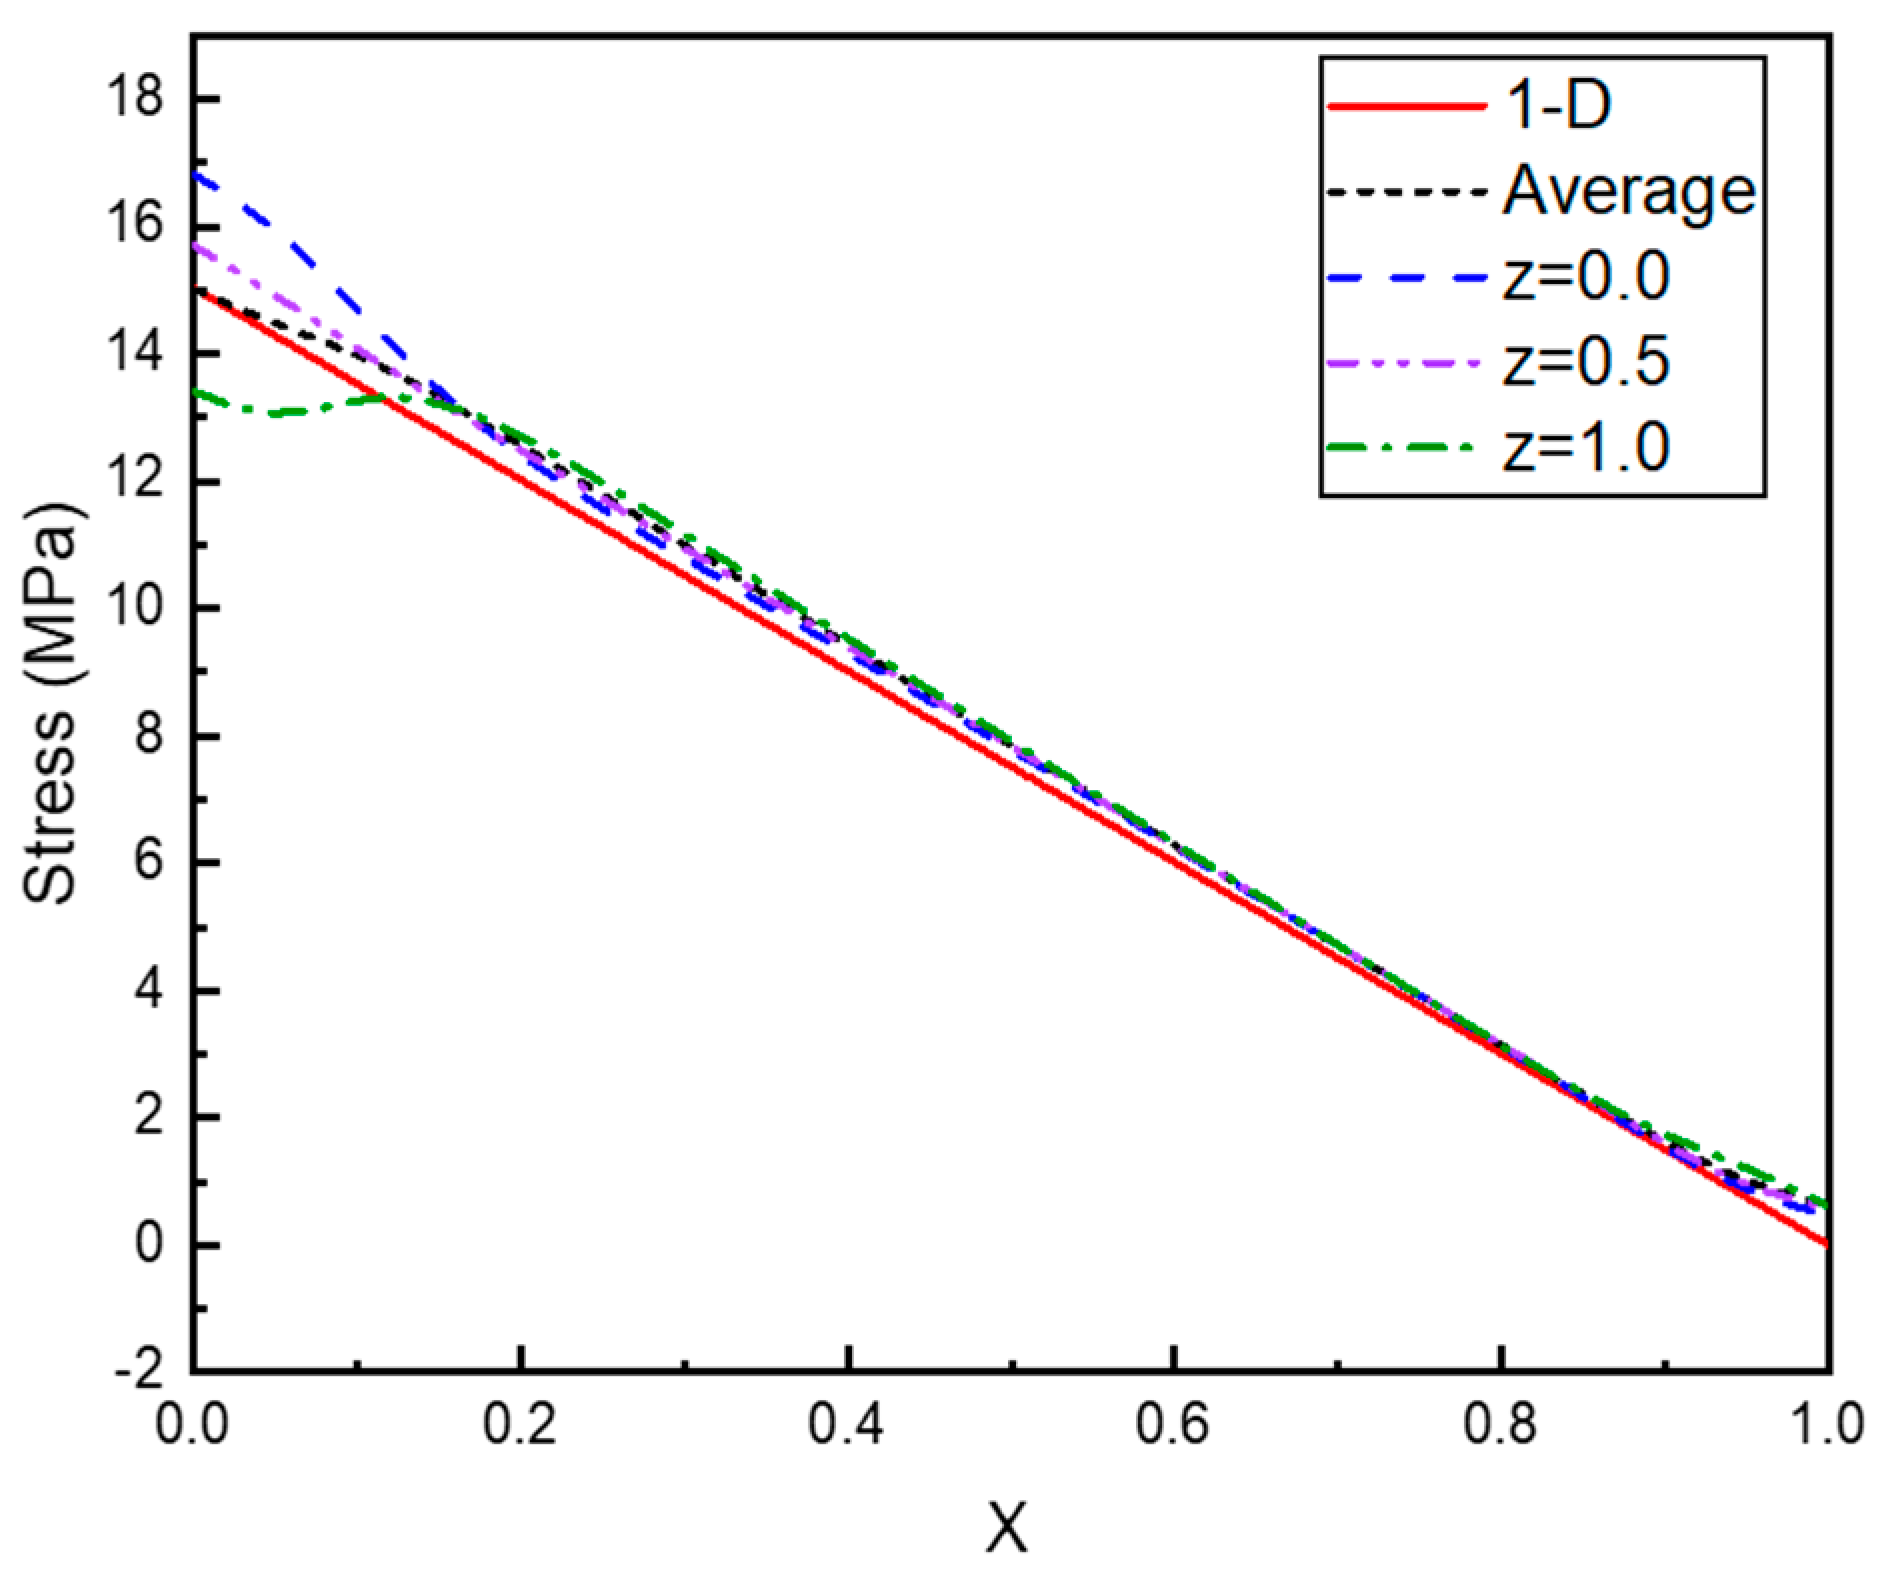
2.2. Stress
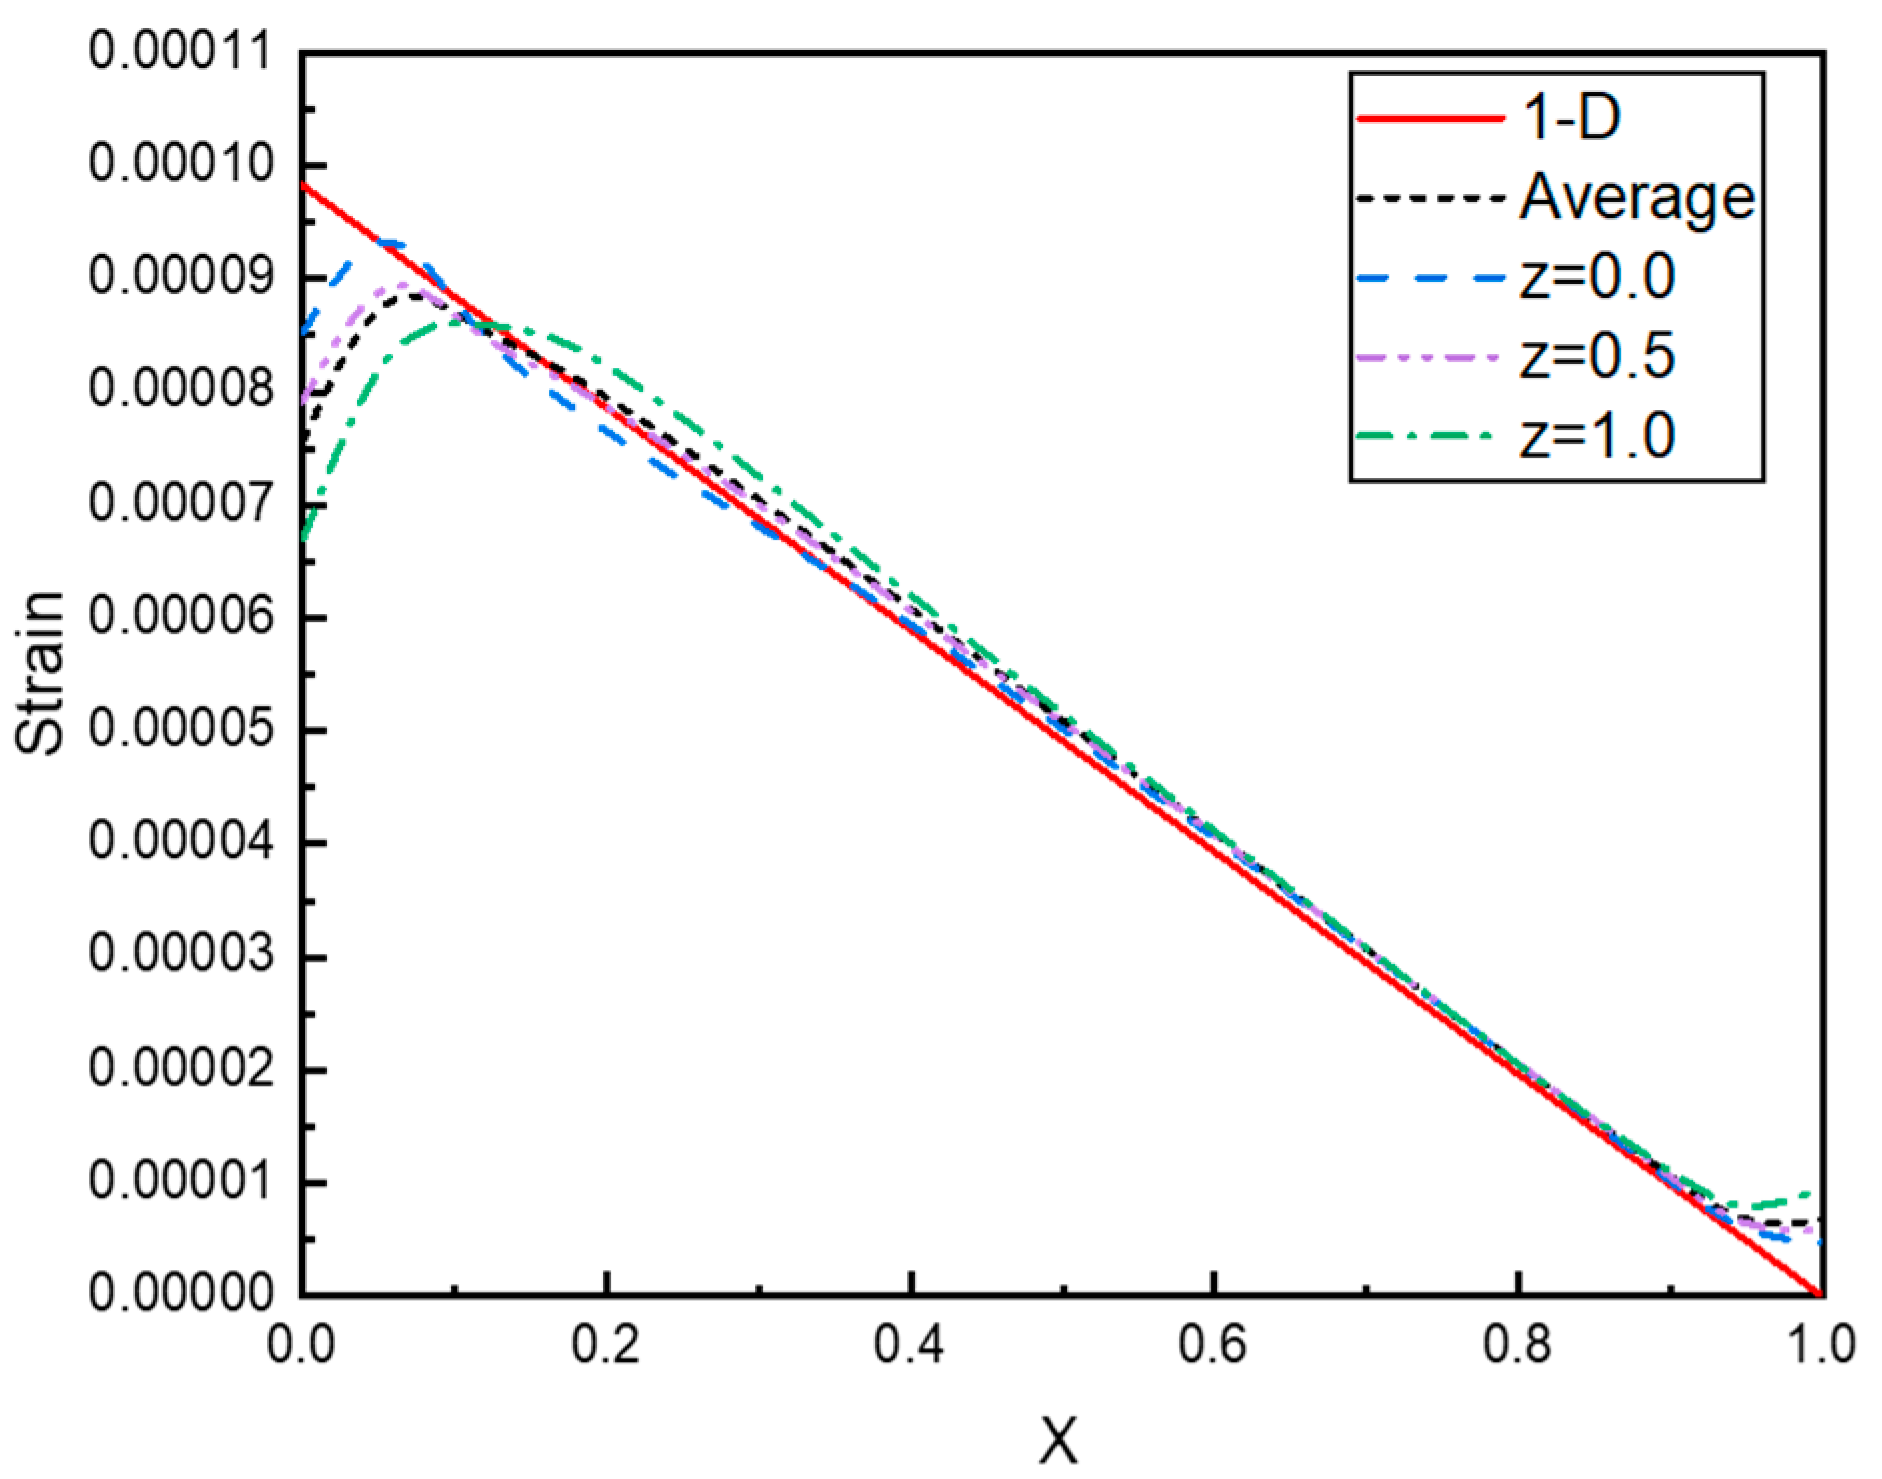
2.3. Strain
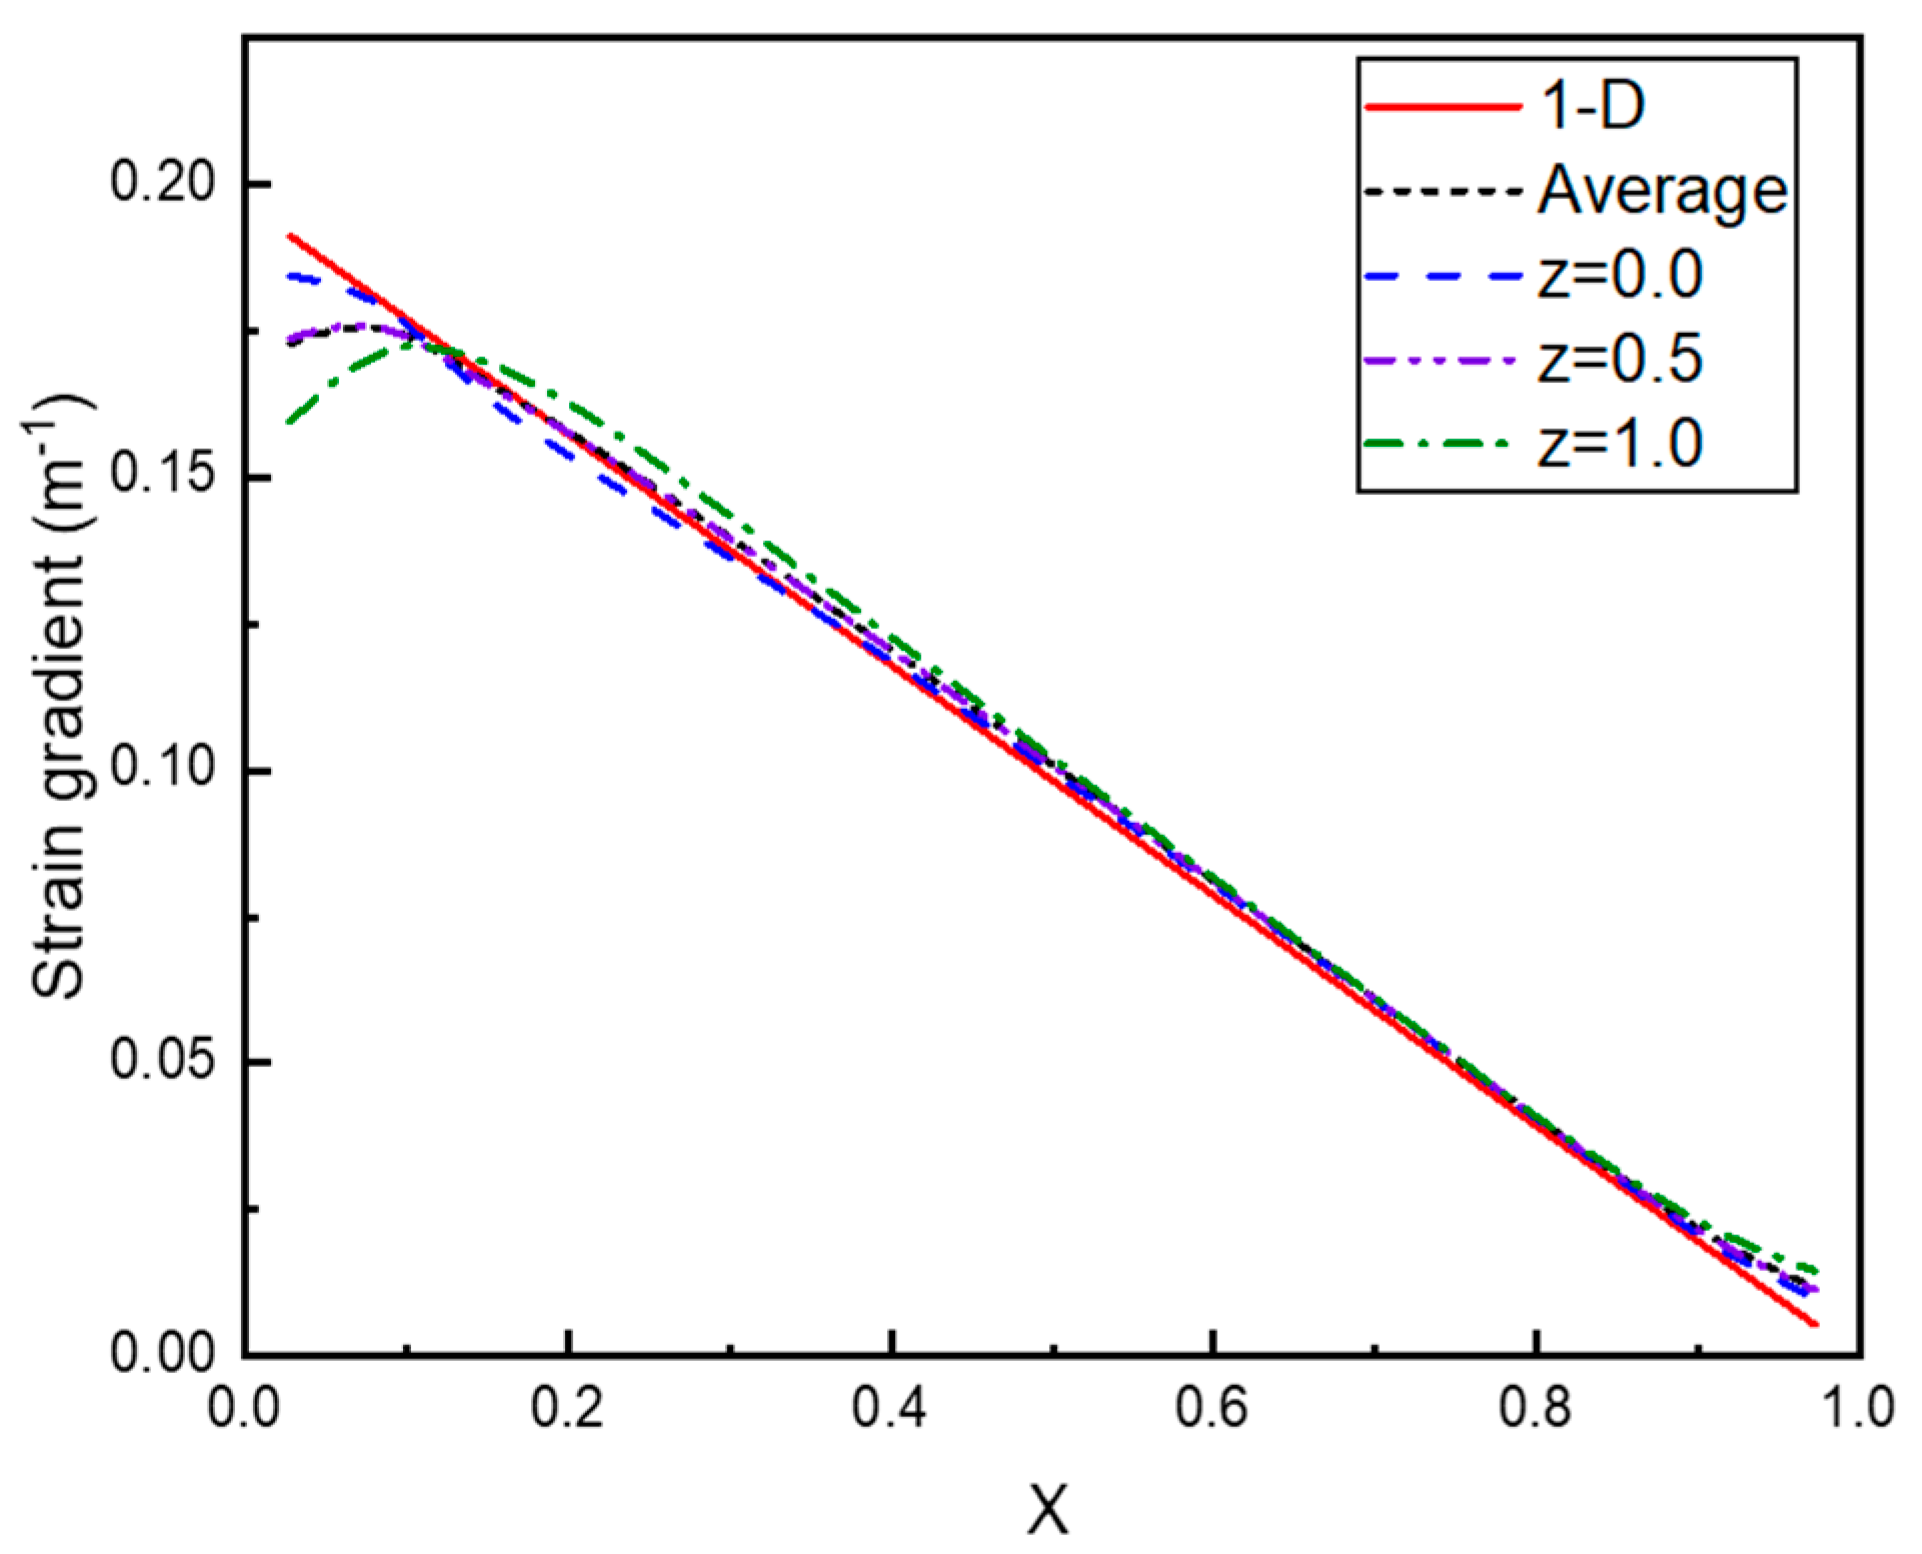
2.4. Strain Gradient
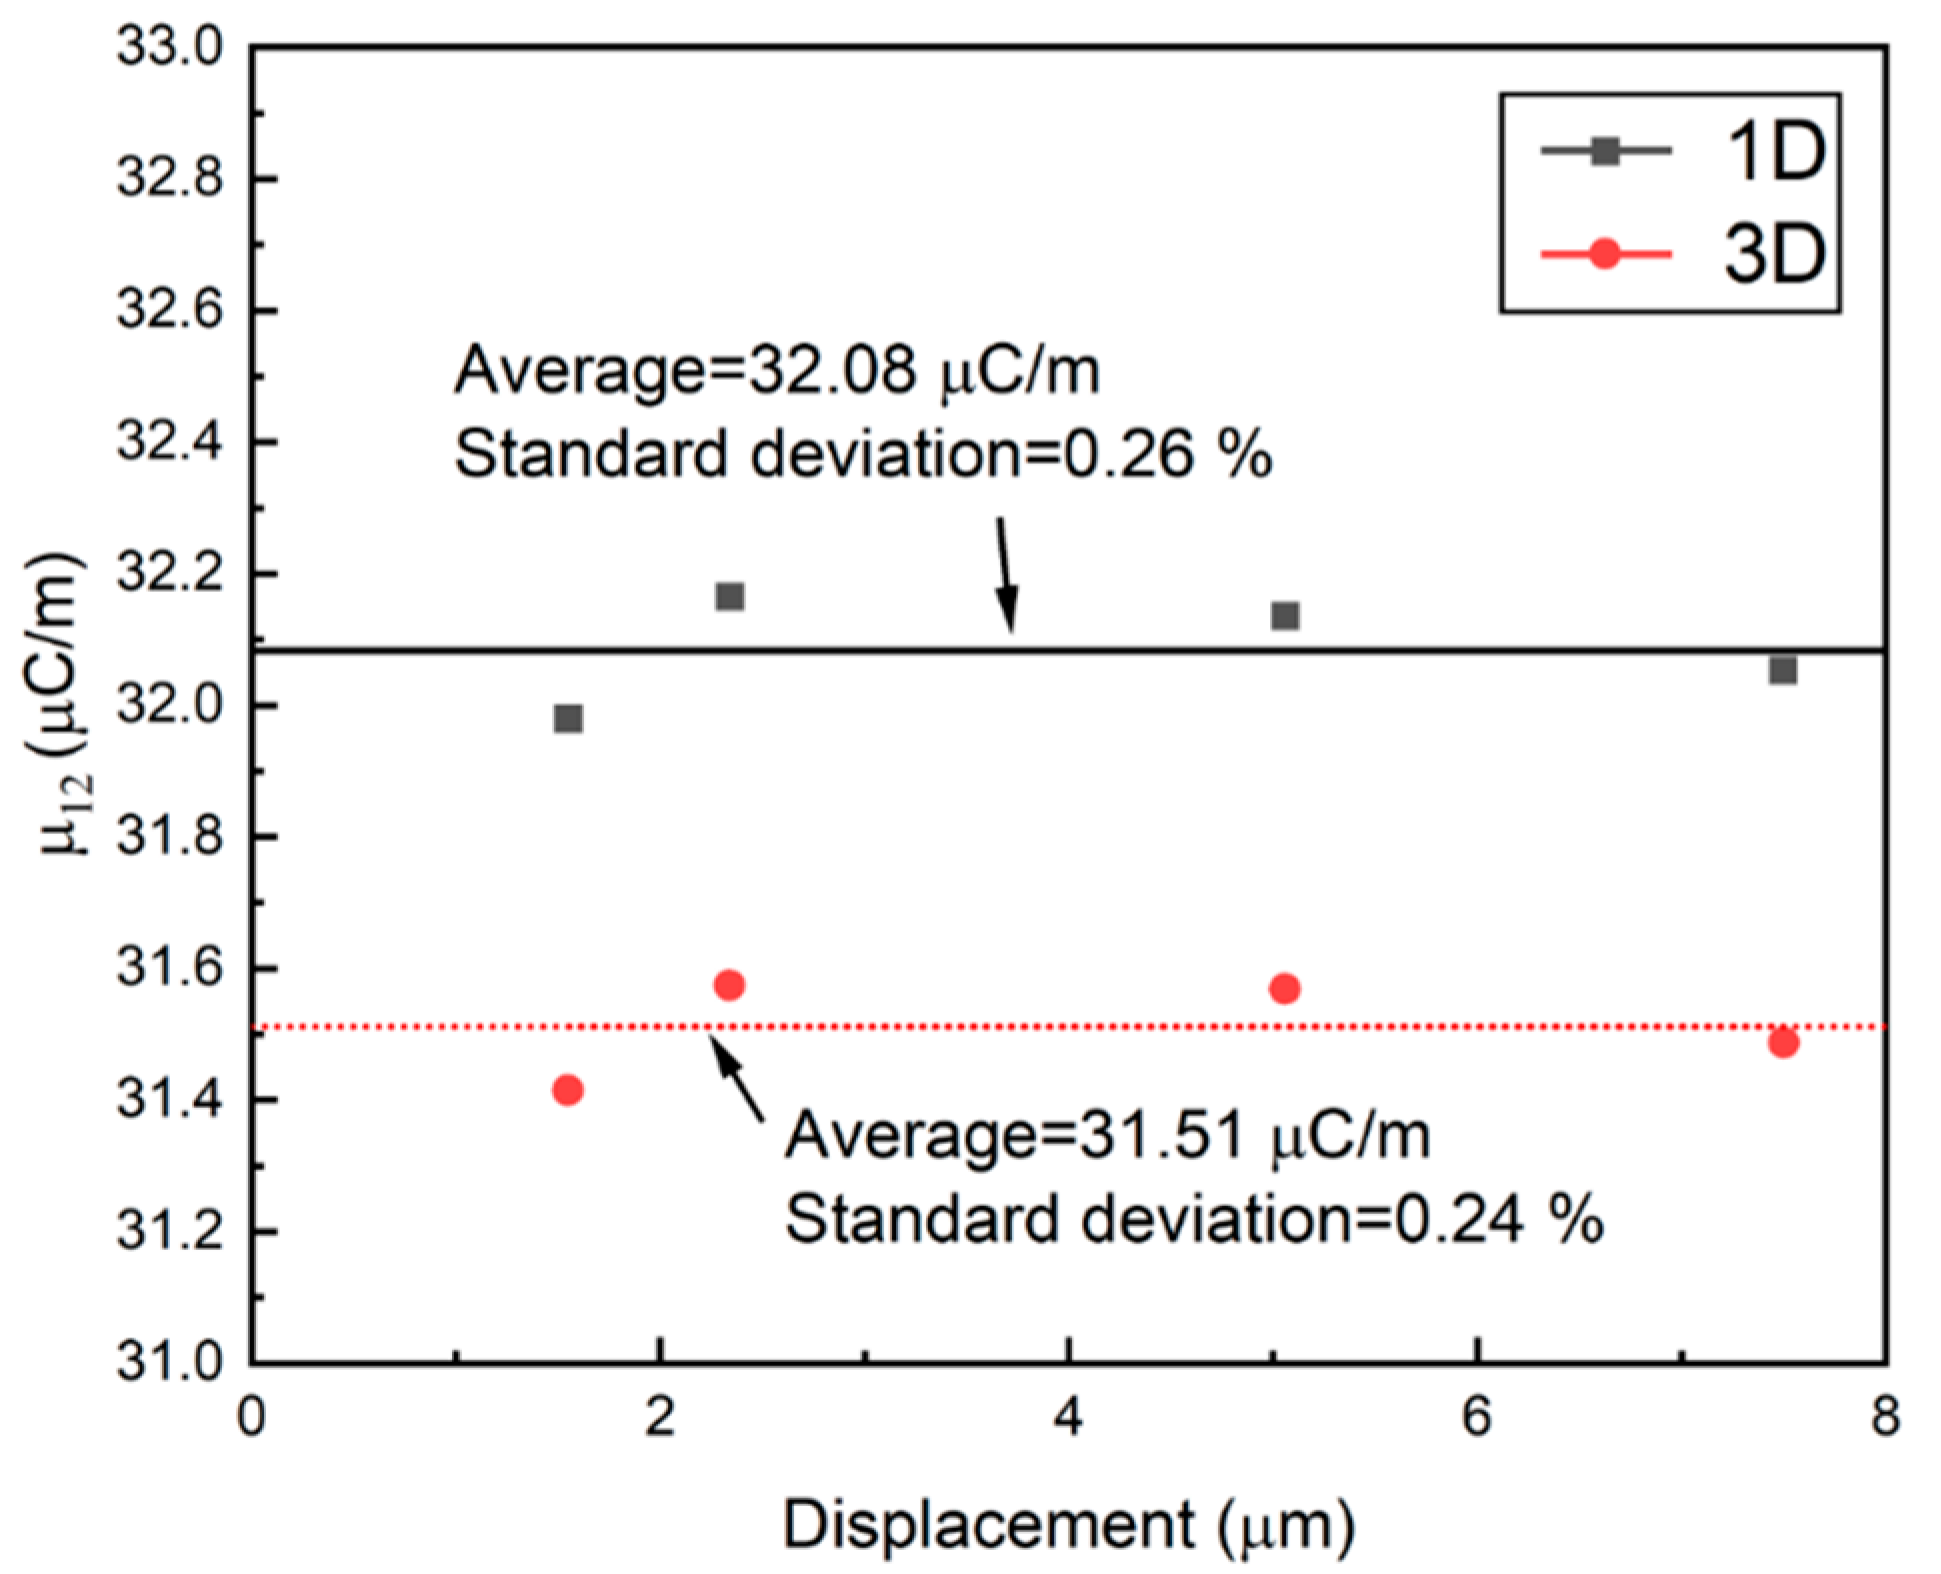
3. Discussion
Author Contributions
Funding
Institutional Review Board Statement
Informed Consent Statement
Conflicts of Interest
References
- Kogan, S.M. Piezoelectric effect during inhomogeneous deformation and acoustic scattering of carriers in crystals. Sov. Phys.-Solid State 1964, 5, 2069–2070. [Google Scholar]
- Huang, W.; Kim, K.; Zhang, S.; Yuan, F.-G.; Jiang, X. Scaling effect of flexoelectric (Ba,Sr)TiO3 microcantilevers. Phys. Status Solidi (RRL) Rapid Res. Lett. 2011, 5, 350–352. [Google Scholar] [CrossRef]
- Eremeyev, V.A.; Ganghoffer, J.-F.; Konopińska-Zmysłowska, V.; Uglov, N.S. Flexoelectricity and apparent piezoelectricity of a pantographic micro-bar. Int. J. Eng. Sci. 2020, 149, 103213. [Google Scholar] [CrossRef]
- Jiang, X.; Huang, W.; Zhang, S. Flexoelectric nano-generator: Materials, structures and devices. Nano Energy 2013, 2, 1079–1092. [Google Scholar] [CrossRef]
- Kwon, S.R.; Huang, W.B.; Zhang, S.; Yuan, F.G.; Jiang, X. Study on a flexoelectric microphone using barium strontium titanate. J. Micromech. Microeng. 2016, 26, 045001. [Google Scholar] [CrossRef] [Green Version]
- Huang, W.; Kwon, S.R.; Yuan, F.G.; Zhang, S.; Jiang, X. A flexoelectric micro-accelerometer. In Proceedings of the ASME 2012 International Mechanical Engineering Congress and Exposition, Houston, TX, USA, 9–12 November 2012; pp. 597–603. [Google Scholar]
- Huang, W.; Yan, X.; Kwon, S.R.; Zhang, S.; Yuan, F.-G.; Jiang, X. Flexoelectric strain gradient detection using Ba0.64Sr0.36TiO3 for sensing. Appl. Phys. Lett. 2012, 101, 252903. [Google Scholar] [CrossRef]
- Kwon, S.R.; Huang, W.B.; Zhang, S.; Yuan, F.G.; Jiang, X.N. Flexoelectric sensing using a multilayered barium strontium titanate structure. Smart Mater. Struct. 2013, 22, 115017. [Google Scholar] [CrossRef] [Green Version]
- Kwon, S.R. A Study on the Flexoelectric Coefficient in the Frustum Pyramid Sensing Element with the Rigid Laminates at the Upper and Bottom Surfaces. Trans. Korean Soc. Mech. Eng. A 2020, 44, 1–6. [Google Scholar] [CrossRef]
- Ma, W.; Cross, L.E. Flexoelectric polarization of barium strontium titanate in the paraelectric state. Appl. Phys. Lett. 2002, 81, 3440–3442. [Google Scholar] [CrossRef]
- Chu, B.; Zhu, W.; Li, N.; Cross, L.E. Flexure mode flexoelectric piezoelectric composites. J. Appl. Phys. 2009, 106, 104109. [Google Scholar] [CrossRef]
- Ma, W.; Cross, L.E. Flexoelectric effect in ceramic lead zirconate titanate. Appl. Phys. Lett. 2005, 86, 072905. [Google Scholar] [CrossRef]
- Ma, W.; Cross, L.E. Flexoelectricity of barium titanate. Appl. Phys. Lett. 2006, 88, 232902. [Google Scholar] [CrossRef]
- Ma, W.; Cross, L.E. Observation of the flexoelectric effect in relaxor Pb(Mg1/3Nb2/3)O3 ceramics. Appl. Phys. Lett. 2001, 78, 2920–2921. [Google Scholar] [CrossRef]
- Zhu, W.; Fu, J.Y.; Li, N.; Cross, L.E. Piezoelectric composite based on the enhanced flexoelectric effects. Appl. Phys. Lett. 2006, 89, 192904. [Google Scholar] [CrossRef]
- Kwon, S.R. Study on the flexoelectric characteristics in the sensing element of a duplex frustum pyramid. J. Mech. Sci. Technol. 2018, 32, 5839–5843. [Google Scholar] [CrossRef]


| Young’s modulus (GPa) | 153 |
| Poisson’s ratio | 0.33 |
| lx (mm) | 10.7 |
| ly (mm) | 1 |
| lz (mm) | 2.54 |
| Displacement (µm) | Charge Output (pC) | µ12 1-D (µC/m) | µ12 3-D (µC/m) |
|---|---|---|---|
| 7.50 | 171.2 | 32.05 | 31.49 |
| 5.06 | 115.8 | 32.14 | 31.57 |
| 2.34 | 53.6 | 32.16 | 31.57 |
| 1.55 | 35.3 | 31.98 | 31.41 |
| Average | 32.08 | 31.51 | |
Publisher’s Note: MDPI stays neutral with regard to jurisdictional claims in published maps and institutional affiliations. |
© 2021 by the authors. Licensee MDPI, Basel, Switzerland. This article is an open access article distributed under the terms and conditions of the Creative Commons Attribution (CC BY) license (https://creativecommons.org/licenses/by/4.0/).
Share and Cite
Kwon, S.R.; Roh, Y. A Study on a New Method for Flexoelectric Coefficient Estimation of the Flexoelectric Unimorph Sensing Element. Appl. Mech. 2021, 2, 841-848. https://doi.org/10.3390/applmech2040048
Kwon SR, Roh Y. A Study on a New Method for Flexoelectric Coefficient Estimation of the Flexoelectric Unimorph Sensing Element. Applied Mechanics. 2021; 2(4):841-848. https://doi.org/10.3390/applmech2040048
Chicago/Turabian StyleKwon, Seol Ryung, and Yongrae Roh. 2021. "A Study on a New Method for Flexoelectric Coefficient Estimation of the Flexoelectric Unimorph Sensing Element" Applied Mechanics 2, no. 4: 841-848. https://doi.org/10.3390/applmech2040048
APA StyleKwon, S. R., & Roh, Y. (2021). A Study on a New Method for Flexoelectric Coefficient Estimation of the Flexoelectric Unimorph Sensing Element. Applied Mechanics, 2(4), 841-848. https://doi.org/10.3390/applmech2040048