Article

EEG-Based Assessment of Cognitive Resilience via Interpretable Machine Learning Models

by
Ioannis Kakkos
1,2,*,
Elias Tzavellas
3,
Eleni Feleskoura
1,
Stamatis Mourtakos
3,4,
Eleftherios Kontopodis
1,
Ioannis Vezakis
2,
Theodosis Kalamatianos
1,
Emmanouil Synadinakis
3,
George K. Matsopoulos
2,
Ioannis Kalatzis
1,
Errikos M. Ventouras
1 and
Aikaterini Skouroliakou
1
1
Department of Biomedical Engineering, University of Werst Attica, 12243 Athens, Greece
2
Biomedical Engineering Laboratory, Department of Electrical and Computer Engineering, National Technical University of Athens, 15780 Athens, Greece
3
First Department of Psychiatry, Aiginition Hospital, School of Medicine, National and Kapodistrian University of Athens, 11528 Athens, Greece
4
Department of Nutrition and Dietetics, School of Health Sciences and Education, Harokopio University, 17676 Athens, Greece
*
Author to whom correspondence should be addressed.
AI 2025, 6(6), 112; https://doi.org/10.3390/ai6060112
Submission received: 17 April 2025 / Revised: 21 May 2025 / Accepted: 27 May 2025 / Published: 29 May 2025

Abstract

Background: Cognitive resilience is a critical factor in high-performance environments such as military operations, where sustained stress can impair attention and decision-making. In the present study, we utilized EEG and machine learning to assess cognitive resilience in elite military personnel. Methods: For this purpose, EEG signals were recorded from elite military personnel during stress-inducing attention-related and emotional tasks. The EEG signals were segmented into two temporal windows corresponding to the initial stress response (baseline) and the adaptive/recovery phase, extracting power spectral density features across delta, theta, alpha, beta, and gamma bands. Different machine learning models (Decision Tree, Random Forest, AdaBoost, XGBoost) were trained to classify temporal phases. Results: XGBoost achieved the highest accuracy (0.95), while Shapley Additive Explanations (SHAP) analysis identified delta and alpha bands (particularly in frontal and parietal regions) as key features associated with adaptive mental states. Conclusions: Our findings indicate that resilience-related neural responses can be successfully distinguished and that interpretable AI frameworks can be used for monitoring cognitive adaptation in high-stress environments.

1. Introduction

Resilience refers to the capacity of individuals to maintain or regain psychological and cognitive functioning when exposed to stressful or difficult situations. It is conceptualized both as a dynamic process of adaptation and as a trait-like characteristic enabling positive outcomes despite significant stressors [1,2]. In military settings, resilience becomes particularly critical, as personnel are required to perform complex cognitive and operational tasks under conditions of high physical and psychological pressure [3]. Among the dimensions of resilience, cognitive resilience—the ability to sustain and optimize cognitive function such as attention, working memory, and executive control under stress—is vital to operational success and mission readiness [4]. Military environments are characterized by chronic exposure to high-stakes stressors, including uncertainty, danger, and heavy workload, all of which can lead to cognitive overload and performance deterioration [5]. Consequently, understanding the mechanisms underlying cognitive resilience is essential for developing interventions that safeguard mental performance.
Electroencephalography (EEG) has emerged as a powerful neurophysiological tool to study real-time brain dynamics under stress due to its high temporal resolution, portability, and cost-effectiveness [6]. Unlike traditional assessments based on self-reports, EEG provides direct insights into neural activity associated with stress responses and cognitive adaptability [7]. Several studies have illustrated the associations of EEG brain rhythms with regard to cognitive resilience, providing indications for long-term neural adaptation to stress [8]. As such, frequency bands such as delta (1–4 Hz), theta (4–8 Hz), alpha (8–13 Hz), and beta (13–30 Hz) have been found to reflect different facets of mental workload, emotional regulation, and coping mechanisms under stress [9,10]. For instance, a negative correlation between resilience scores and brain network flexibility in specific regions within the delta, alpha, and beta bands has been observed, suggesting that individuals with higher resilience may exhibit less flexible (more stable) brain networks in these frequency bands [11]. Furthermore, beta band activity has been shown to increase during continuous task engagement and is thought to reflect elevated cognitive effort and arousal under stress [12,13].
EEG-derived markers of resilience are known to vary depending on the nature of the stressor, the specific brain regions activated, and the methodological framework employed [14]. In this context, the integration of machine learning (ML) with EEG analysis has emerged as a powerful strategy for advancing the study of cognitive resilience. These techniques can capture subtle and nonlinear relationships in EEG data (that may not be detectable using statistical methods), enabling the automated classification of cognitive states and the identification of complex neural patterns associated with stress adaptation [15]. Previous studies employing a variety of ML approaches to classify EEG signals related to stress and mental workload consistently report promising levels of accuracy. For instance, Dimitrakopoulos et al. [16] applied multiband EEG cortical connectivity to perform both within- and cross-task mental workload classification. By constructing functional brain networks in source space, and implementing a sequential forward selection algorithm and a Support Vector Machine classifier, their approach achieved up to 88% within- and 87% cross-task classification accuracies. Similarly, Hag et al. [17] implemented a hybrid feature extraction pipeline that integrated both time–frequency-domain features and functional connectivity measures to classify stress induced by arithmetic tasks. Their results showed peak performance using Support Vector Machines, emphasizing the value of combining spectral and network-based features. In another study, Siddiqui et al. [18] implemented a connectivity framework using resting-state EEG to classify individuals as high or low in resilience. As such, they extracted graph-theoretical features—such as global efficiency, clustering coefficient, and characteristic path length—from directed connectivity matrices to train a Support Vector Machine (SVM) classifier, which achieved an accuracy of 80.6% in distinguishing low- from high-resilience participants. Furthermore, Safari et al. [19] proposed a hierarchical framework for classifying mental workload using EEG-based directed connectivity, feature selection (e.g., Relief-F, mRMR), and multiple ML models, reaching up to 89.53% accuracy with SVMs. Moreover, Nirde et al. [20] compared traditional ML models with deep learning architectures. They found that deep learning models achieved classification accuracies of up to 96.8% when trained on well-curated spectral features, demonstrating the high potential of both conventional and advanced ML methods for reliable EEG-based workload classification. Despite the encouraging outcomes of these studies, most research in this domain has been constrained by datasets derived from general population cohorts, which may not fully capture the neural dynamics of individuals operating in extreme or high-performance environments. Moreover, studies that integrate neurophysiological data with explainable and interpretable ML approaches to assess and model stress-related cognitive adaptation mechanisms remain scarce.
In this regard, recent advancements have seen the integration of EEG and ML in military contexts to predict post-traumatic stress disorder (PTSD) in veterans [21], or focusing on developing EEG-based systems to monitor personnel performance and operational capabilities in real time [22]. Furthermore, Brain–Computer Interfaces (BCIs) have been suggested to assess the control signal parameters in military operations, prosthetics, and communication [23]. However, the utilization of explainable AI to highlight the neural substrates involved in stress resilience has not yet been explored, particularly in populations such as military personnel, where understanding the mechanisms of cognitive adaptation is critical for sustaining performance under pressure. Based on this gap, we hypothesized that high-performance (resilient) individuals would exhibit measurable shifts in EEG features over the course of sustained stress-inducing tasks, reflecting neural adaptation to cognitive load.
To test this hypothesis, EEG data were recorded from Hellenic Navy SEALs (HN-SEALs) (a specialized military unit characterized by intensive psychological and physical training) during continuous engagement in cognitive tasks designed to simulate operational stress. To the best of our knowledge, this is the first study to apply interpretable machine learning models to EEG data for assessing cognitive resilience in elite military personnel under sustained stress. As such, different ML algorithms were implemented, utilizing power spectral density features to classify between the initial stress response (baseline) and the adaptive/recovery phase. Additionally, Shapley Additive Explanations (SHAP) was utilized to identify key spectral features, elucidating the neurophysiological basis of resilience and adaptive responses to cognitive stress.

2. Materials and Methods

2.1. Subjects

Twenty-seven (27) male participants were recruited in the study (mean age = 24.2 ± 3.4 years). The participants consisted of members of the Hellenic Navy Sea Air Land (HN-SEALs), an elite military unit specialized in conducting special operations. All had normal or corrected-to-normal vision, while reporting no psychiatric history, cognitive or neurological impairment, and long-term medication intake. A signed written consent form was obtained from all subjects. The study was conducted according to the guidelines of the Declaration of Helsinki and followed strict ethical protocols approved by the Ethics Committee of the Hellenic Navy General Staff and Harokopio University of Athens (protocol Number 55/5-4-2017).

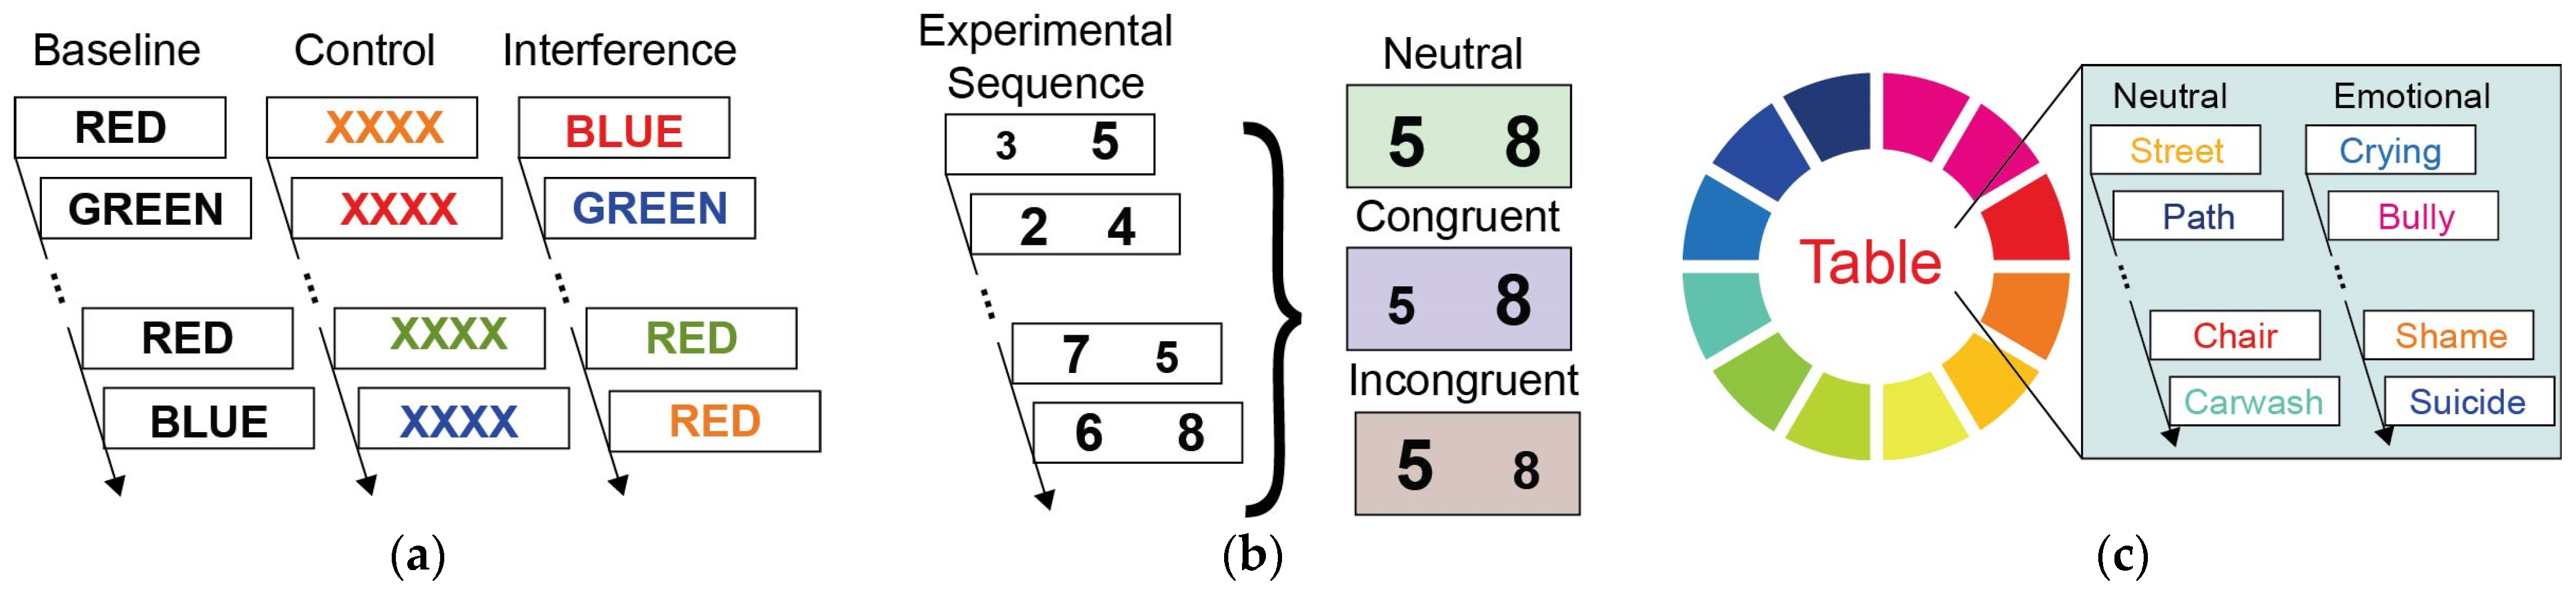
2.2. Experimental Design

The experimental procedure consisted of three tasks (two attention-related and one emotional), implemented to assess sustained attention, cognitive control, and resilience to stress. Attention-related tasks included the Stroop Color Word Test (SCWT) [24] and Stroop Numerical Test (SNT) [25], while the Stroop Emotion Test (ES) [26] was implemented as an emotional task. In this study, all three tasks were implemented to serve as an indicator of resilience. Specifically, the SCWT was employed to manipulate selective attention and cognitive flexibility, SNT to impact automatic and controlled mental processes, and ES to affect emotional responses to attentional processes and cognitive interference. Figure 1 illustrates the Stroop task protocol used to induce cognitive and emotional stress, showing the sequence of stimuli and participant responses across task types (Stroop color–word, number, and emotion). Below, the experimental settings of all three tasks are briefly described.
SCWT: The SCWT included three subtasks: (i) reading color words printed in black ink (baseline), (ii) naming the ink colors of non-linguistic symbols, i.e., XXXX (control), and (iii) naming the ink colors of incongruent color words (interference condition) (Figure 1a). Each subtask consisted of 100 words/colors, with subjects requested to read as many words or colors as possible within 1 min.
SNT: The SNT extended the SCWT paradigm by measuring interference in numerical processing. As such, SNT subtasks consisted of (i) trials that presented numbers on the same physical size and same magnitude (neutral), (ii) trials that displayed numbers with an equivalent size to their magnitude (congruent, e.g., a large-sized “8” and a small-sized “3”), and (iii) trials that presented numbers, the size of which differed from their magnitude (incongruent, e.g., a small-sized “8” and a large-sized “3”) (Figure 1b). Participants were instructed to identify the larger number from each pair displayed on the computer screen by pressing a key on the keyboard. Number size was estimated based either on numerical magnitude or physical size. Each trial was presented in a random order (across all three subtasks), with a total of 180 trials, divided into 6 blocks of 30 trials each. Between each block, a fixation cross on a black background was displayed on the computer screen, lasting 500 ms.
ES: In the ES task, participants were requested to identify the ink color of presented word stimuli while disregarding their semantic meaning. During the task, a colored ring (divided into distinct segments) appeared on the screen, with a word (displayed in varying colors) presented in the ring center. Subjects were instructed to match each word’s color to the corresponding segment color on the surrounding ring using the mouse. The task consisted of a total of 120 words (60 neutral and 60 emotional), with each word appearing five times in a randomized color sequence (each in a different color) (Figure 1c).

2.3. Data Acquisition and Preprocessing

EEG data were acquired via a wireless cap (Enobio-20; Neuroelectrics, Spain), with a sampling rate of 500 Hz, while a 50 Hz notch filter was applied to minimize residual line noise. Electrode sites included 19 scalp locations (Fp1, Fp2, F3, F4, F7, F8, Fz, C3, C4, Cz, T8, T7, P3, P4, P7, P8, Pz, O1, O2) according to the 10–20 International System. EEG preprocessing was implemented using a previously validated pipeline [27]. This included down-sampling to 256 Hz and a 1–40 Hz FIR band-pass filter. Following this, the signals were re-referenced to the average, detrended, and baseline-adjusted. To remove ocular artifacts, Independent Component Analysis (ICA) was utilized, removing components that represented eye movements via visual inspection. After artifact correction, no individual time segments were discarded. Only one participant was excluded entirely due to pervasive noise across all channels (leaving 26 subjects for subsequent analyses), ensuring sufficient SNR across the remaining data. All preprocessing procedures were implemented with the EEGLAB v2023.0 plugin using MATLAB R2023a (The MathWorks Inc., Natick, MA, US) [28].

2.4. Segmentation and Feature Extraction

As mentioned above, the present study explores how different spectral properties of EEG signals relate to variations in stress resilience. While the number of participants (N = 26) may appear limited for conventional machine learning applications, it is important to note that the population under study (i.e., elite military personnel) is highly selective, and access is strictly controlled due to operational and ethical constraints. On this premise, we employed a time-segmentation strategy to extract data samples across two resilience states, thus increasing the effective data volume as described below.
Specifically, the first and last 5 min of EEG recordings were extracted with the first 5 min indicating baseline stress responses at task onset (Class 1) and the last 5 min denoting adaptive/recovery (stress resilient) responses (Class 2). As such, for each 5 min epoch, a 10 s sliding window with a 5 s overlap was applied (2560 time points per window), resulting in 59 × 26 = 1534 segments per class across all participants. To provide an indication of the contribution of each frequency band to the EEG signal, the power spectral density (PSD) was estimated for each channel for each segment [29]. In detail, Welch’s method was applied to each of the 19 EEG channels using a 256-point FFT to estimate power spectral density. PSD values were then computed for delta (1–4 Hz), theta (4–7 Hz), alpha (8–12 Hz), and beta (13–30 Hz) frequency bands, yielding a total of 19 channels × 5 bands = 95 frequency-domain features for each segment.

2.5. Classification

To evaluate whether the two conditions presented distinct characteristics regarding alterations of the resilience cognitive states between the beginning and end of the tasks, we implemented a variety of different ML methodologies including Decision Trees, Random Forest, AdaBoost, and XGBoost classifiers.
Briefly, Decision Trees are constructed by recursively partitioning the dataset based on the feature that provides the highest information gain, which is derived from entropy (a measure of uncertainty within a set of data) [30]. During tree construction, the algorithm evaluates all features at each node and selects the one that yields the greatest information gain to split the data. This process is applied recursively until the achievement of pure nodes or a minimum number of samples per split. Expanding on the Decision Tree algorithm, Random Forest constructs a large number of Decision Trees during training and outputs the mode of their predictions (bagging) [31]. Each tree is trained on a bootstrap sample of the original data (sampling with replacement), and at each split in the tree, a random subset of features is considered. In a similar manner, AdaBoost and XGBoost use Decision Trees as building blocks to combine multiple weak learners to create a strong predictive model. As such, they are designed to build trees sequentially, where each new tree focuses on correcting the errors of the previous ones. In the AdaBoost algorithm, all training samples are assigned equal weights. After each iteration, the misclassified samples receive increased weights, so that the next weak learner concentrates on them. Each weak learner contributes to the final model with a weight proportional to its accuracy, and the ensemble prediction is formed via a weighted majority vote [32]. Unlike AdaBoost, XGBoost minimizes the gradient of the loss function using a second-order Taylor expansion of the loss function around the current predictions. Moreover, XGBoost can handle sparse data (e.g., data with lots of zeros or missing values) while also preventing overfitting using L1 and L2 regularization [33].
Classification employed a stratified 10-fold cross-validation to minimize bias and avoid overfitting, partitioning the dataset into 10 subsets (folds) while maintaining proportional representation of the class labels [34]. During this procedure, the model was trained iteratively on nine subsets and evaluated on the tenth subset. This process was repeated ten times, with each iteration utilizing a different subset for testing. All algorithms were implemented in Python (v.3.10), using the Scikit-learn (v 1.6) library.

2.6. Model Evaluation and Hyperparameter Tuning

The performance of each classification model was evaluated by computing the average metrics (accuracy, F1-score, precision, and recall) across the test sets obtained from a 10-fold cross-validation procedure. Hyperparameter tuning was conducted using an exhaustive grid search strategy combined with 10-fold cross-validation to identify the optimal configuration that maximizes model performance [35]. After determining the optimal hyperparameters (Table 1), the models were retrained using the entire training dataset with the selected parameters.

2.7. Feature Importance for Model Interpretability

In this study, our goal was not only to achieve high classification performance, but also to provide indications of cognitive changes across different stress resilience states. As such, model interpretability played a central role in understanding the relationship between EEG features and classification outcomes. To this end, Shapley Additive Explanations (SHAP) were employed to evaluate the explainability and interpretability of the models [27]. In general, SHAP is a widely recognized method, assigning a numerical value to each input feature, to quantify its contribution to individual predictions. Specifically, for a given prediction, SHAP calculates how much each individual feature contributes to the deviation of the model’s output from its average (baseline) prediction. This is achieved by evaluating the effect of including each feature across all possible combinations of the remaining features, ensuring that both main effects and interactions are considered. SHAP values represent the average marginal impact of a feature on the model output and satisfy properties such as local accuracy (the sum of all SHAP values equals the difference between the prediction and the model’s average output), consistency (if a feature has a greater effect on the model in one setting compared to another), and missingness (assigning a zero SHAP value for features that have no influence). The methodology of the implemented framework is presented in Figure 2.

3. Results

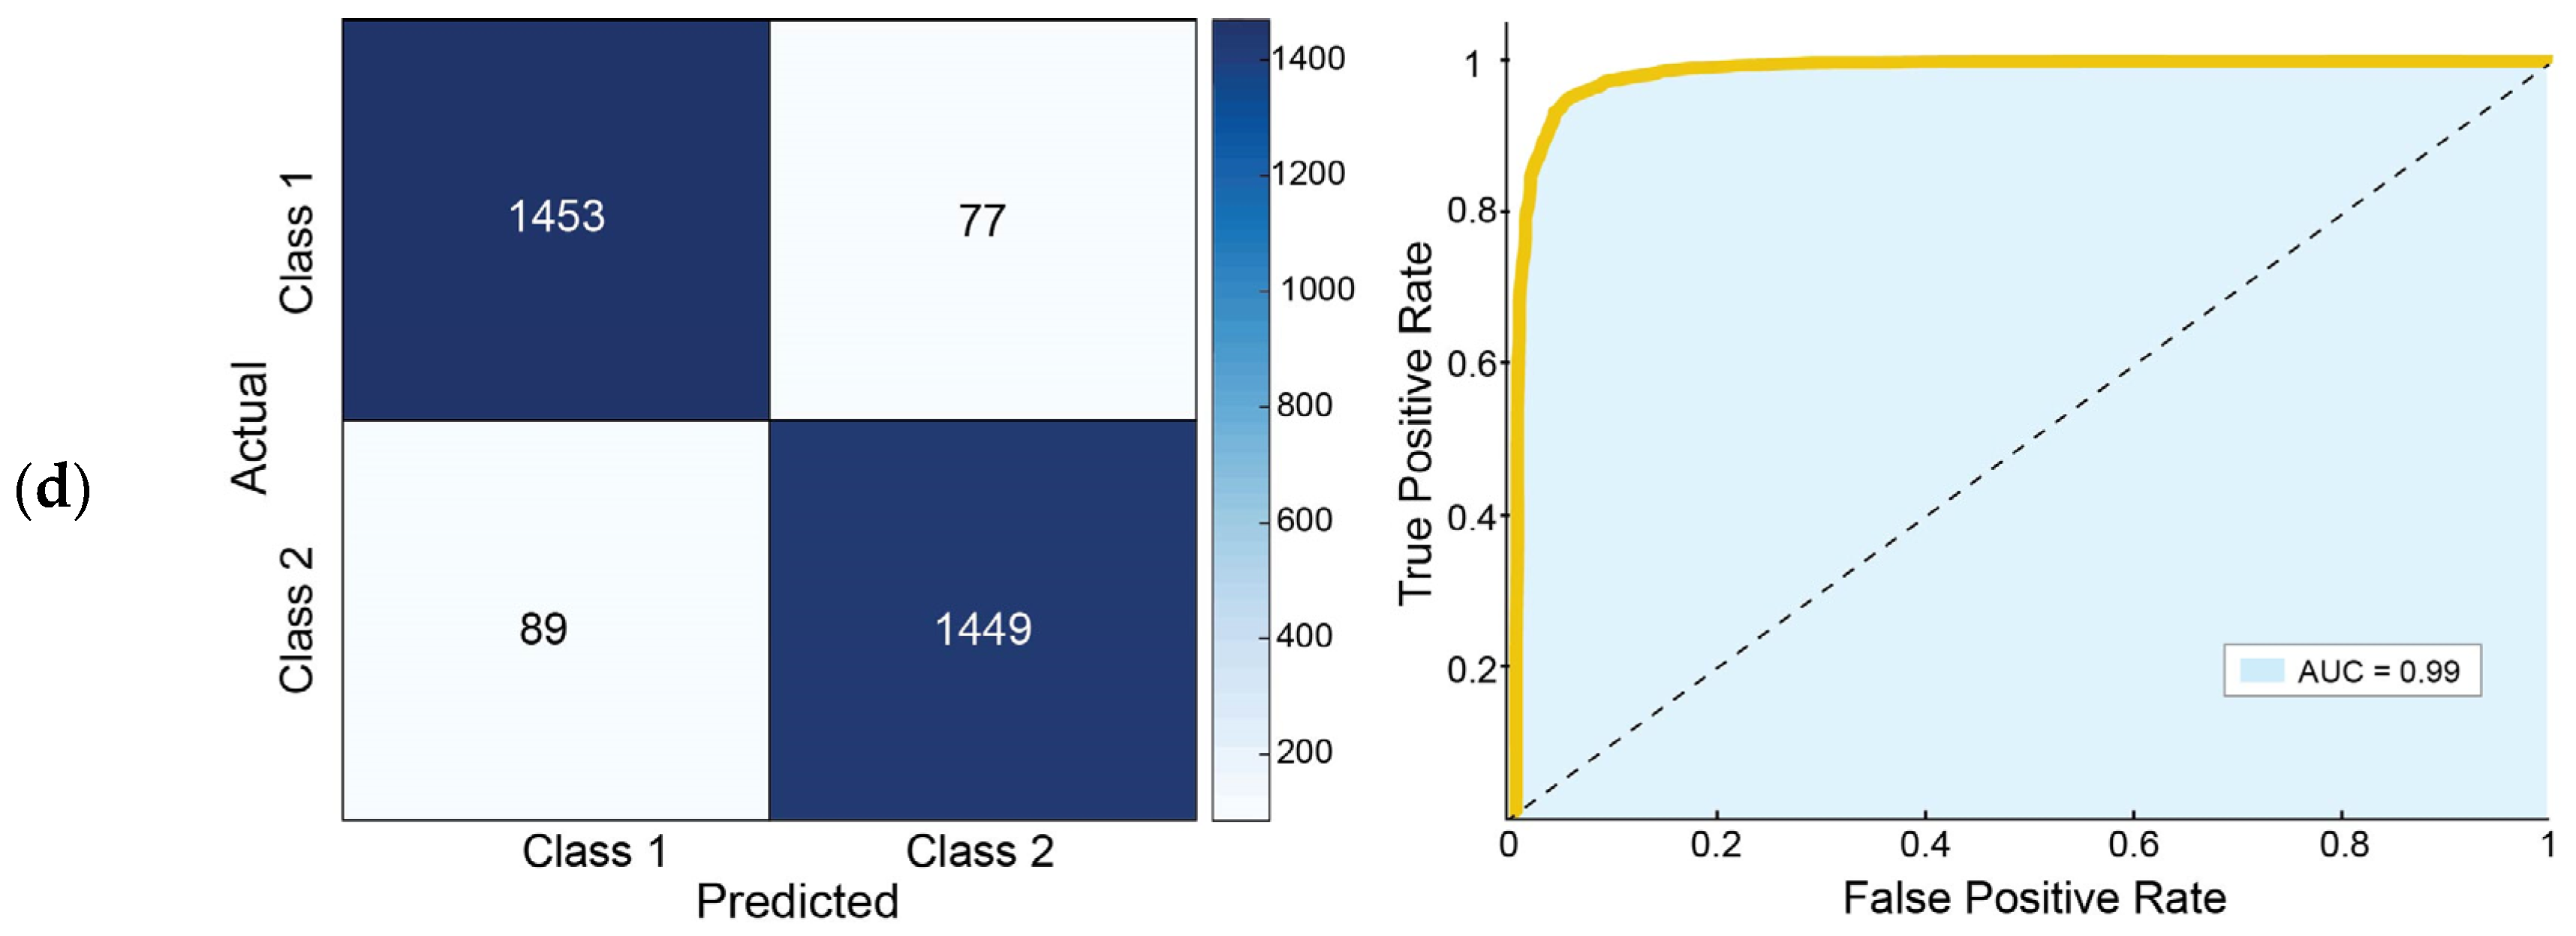
3.1. Classification Performance

To identify the neural patterns associated with the varying resilience state, we employed Decision Trees, Random Forest, AdaBoost, and XGBoost classifiers, as described above. Furthermore, to confirm no overfitting in the classifiers’ performance, we additionally carried out 1000 permutation tests using the same 10-fold cross-validation, randomly reassigning class labels in each iteration. This allowed the estimation of classification accuracy distributions while determining the likelihood (p-value) that a randomized accuracy would outperform each classifier [36]. The results of the different classifiers are presented in Table 2.
The highest performance was achieved by the XGBoost algorithm, with 0.95 classification accuracy (precision = 0.95; recall = 0.94), followed by Random Forest (accuracy = 0.94; precision = 0.93; recall = 0.94). The Decision Tree (accuracy = 0.86; precision = 0.86; recall = 0.86) and AdaBoost (accuracy = 0.87; precision = 0.86; recall = 0.87) classifiers presented comparable performance to each other but were outperformed by both XGBoost and Random Forest (Figure 3). Permutation testing confirmed that all classification models performed significantly above chance level (p < 0.05).

3.2. SHAP Analysis for Model Interpretability

To interpret the model’s decision-making process, SHAP values were computed for the classifier with the best performance (i.e., XGBoost). The top 20 features, ranked by their mean absolute SHAP values, are presented in Figure 4 in order to highlight the most influential predictors contributing to classification outcomes.
In this regard, delta band activity demonstrated a consistent contribution to the classification task, with 7 delta-related features ranked among the top 20, predominantly localized in frontal regions (4 out of 7). Similarly, the alpha band exhibited notable involvement, contributing 6 features to the top 20, primarily associated with occipital (2 out of 6) and parietal (2 out of 6) electrode sites. Beta, theta, and gamma bands followed in terms of feature importance (2 beta, 2 theta and 3 gamma activity features) each showing varying degrees of relevance across different scalp locations. Regarding the spatial distribution of informative features, a predominance in frontal regions (8 features) was observed, followed by parietal (6), central (3), occipital (2), and temporal (1) regions. At the electrode level, F7 emerged most frequently (3 out of the 20 top-ranked features), followed by C3, Fp1, P8, and P3 (each appearing twice).

4. Discussion

In this study, we explored EEG spectral features in combination with ML methodologies to assess cognitive resilience among elite military personnel during sustained stress tasks. Among the four classifiers implemented, XGBoost achieved the highest performance with 95% accuracy, 0.95 precision, and 0.94 recall. The implemented classifiers successfully distinguished between initial stress responses and adaptive recovery phases, highlighting distinct neurophysiological patterns underlying resilience.
Regarding the classification results, all ML models used were effective in the identification of the neural patterns associated with varying resilience states based on EEG-derived features. Among the models, the XGBoost algorithm achieved the highest accuracy (0.95), with Random Forest achieving a comparable but slightly lower performance (accuracy = 0.94). Both ensemble-based methods outperformed the Decision Tree and AdaBoost classifiers, which demonstrated slightly reduced accuracy (0.86 and 0.87, respectively). Further testing with Support Vector Machines and logistic regression provided unsatisfactory results (with 0.56 and 0.61 classification accuracy), suggesting that boosting and bagging techniques can offer enhanced capacity to discriminate between EEG complex characteristics.
It is worth noting that, although some studies report slightly higher classification performance, our results are comparable in terms of classification accuracy, while outperforming the majority of ML-based approaches [17,19,20,37]. However, direct comparisons are inherently limited due to variations in experimental tasks, feature extraction, and dataset characteristics. Nonetheless, they are related to stress and resilience, enabling an indicative comparison. To that end, studies reporting superior results (i.e., accuracy ≈ 0.97) are based on deep learning architectures [17], which, despite their high modeling capacity, typically require large-scale datasets and substantial computational resources, rendering them less suitable for smaller samples. Furthermore, the significance of our models was statistically validated using 1000 permutation tests, confirming that the observed accuracies were unlikely to have occurred by chance (p < 0.05), and thus, overfitting was successfully avoided. Moreover, since the classifiers were trained across subjects rather than within subjects, the high accuracy values reflect the strong generalization capability of the models across individuals.
Regarding the model interpretability analysis, the spatial distribution of informative features highlights a clear predominance in frontal regions. Specifically, SHAP analysis of the XGBoost classifier revealed that the top 20 most influential features included 7 from the delta band, with 4 of these located in frontal regions. This spatial pattern is in line with other studies emphasizing the role of frontal regions, indicating frontal EEG asymmetry and spectral power alterations in stress regulation and emotional processing [38,39]. Notably, electrode F7 appeared in 3 of the top 20 features, emphasizing the consistent involvement of left frontal neural dynamics, and aligning with the findings of Tai et al. [40], who reported increased left frontal activity as a biomarker of psychological resilience.
As far as spectral resilience-related patterns are concerned, the delta and alpha bands were the most dominant contributors to model predictions. In detail, delta-related features (n = 7) exhibited a significant contribution to the classification task, accounting for 35% of the top 20 SHAP-ranked features. This could indicate improved emotional regulation and post-stress recovery, since decreased delta power has been suggested to serve as a neural marker of higher resilience [11,41]. The alpha band (n = 6) also demonstrated a substantial role, with features primarily distributed across occipital and parietal areas. Although the presence of parietal alpha features corresponds to previous findings (potentially reflecting adaptive modulation in response to stress [42]), its role in resilience appears complex. For instance, some studies have shown that elevated alpha power can co-occur with anxiety [43], whereas others interpret increased alpha activity as indicative of cognitive and emotional stability, both of which are essential components of psychological resilience [42,44]. Moreover, it should be noted that parietal and occipital activation is linked to visual processing and attentional control [45], and as such may partially arise from the visual and cognitive demands of the Stroop task itself, rather than representing stress resilience-specific neural activity. Beta, theta, and gamma bands also contributed to classification, albeit to a lesser extent. This is aligned with prior works suggesting gamma power alterations under stress conditions and their potential relationship to arousal and attentional processes [46,47]. In a similar way, theta band features have been associated with adaptive coping mechanisms and attention-related effort, making it a plausible contributor to resilience-related neural patterns [48,49]. On the other hand, the role of beta activity in stress and resilience remains controversial. While some studies suggest increased frontal beta power with stress reactivity [13,50], others report no significant correlation between beta activity and stress responses [44].
From a clinical and neurocognitive perspective, the observed alterations in delta and alpha band activity in the frontal and parietal regions may reflect core components of adaptive functioning [51]. In fact, frontal delta desynchronization has been linked to enhanced emotional regulation and reduced stress reactivity [52,53], while parietal alpha modulation has been associated with attentional control and cognitive interference [54,55]. These patterns suggest that individuals demonstrating resilience may engage neural mechanisms that promote stability and efficient information processing under prolonged stress. In clinical practice, these findings may inform interventions aimed at enhancing stress adaptation (such as neurofeedback training or targeted cognitive rehabilitation), particularly in individuals at risk for stress-related disorders such as PTSD or burnout.
Despite the promising results, several limitations of the present study should be taken into consideration when interpreting neural mechanisms associated with resilience. As such, the structure of the experimental protocol may have introduced variability in mental workload (e.g., stress levels), potentially limiting the extent to which the observed brain activity reflects resilience-related processes. Although efforts were made to control for such confounding factors, it is important to note that data collection occurred immediately prior to the most demanding week of military training. Therefore, elevated levels of subjective stress (unrelated to the experimental task) may have influenced the results. In addition, the relatively small sample size constrains the broader applicability of the findings. On this premise, the current analysis employed conventional ML algorithms that are suitable for small datasets. Due to this limitation, deep learning models were not applied, since they typically require extensive training data to effectively learn spatial-temporal representations [56]. While the current results provide valuable insights, future works with larger datasets could explore convolutional and recurrent neural networks to better capture the complex spatial and temporal dynamics of EEG signals, thus improving classification performance and enabling more sophisticated real-time applications. Another limitation concerns the feature extraction methodology. This study focused exclusively on power spectral analysis of EEG signals, which has proven effective in identifying stress-related patterns [57]. However, incorporating additional feature domains (such as time-domain characteristics, event-related potentials (ERPs), or functional connectivity measures [58]) could provide a more comprehensive understanding of the neural dynamics underlying stress and resilience. From this standpoint, we aim to expand our work in the future, aiming to replicate these findings across diverse feature domains and stress paradigms, while incorporating multimodal physiological data (e.g., heart rate variability, skin conductance, pupil dilation) to enhance the interpretability and generalizability of EEG-based resilience biomarkers. Additionally, we plan to increase the sample size by including both military and general population cohorts, enabling more robust generalization and subgroup analysis. Furthermore, we intend to incorporate dynamic connectivity features and event-related potentials to investigate the temporal evolution of stress adaptation, cognitive fatigue, and stress dysregulation with higher resolution.

5. Conclusions

In this study, we combined EEG spectral analysis with interpretable machine learning to assess cognitive resilience among elite military personnel during sustained cognitive and emotional stress tasks. EEG data collected during Stroop-based paradigms were segmented into baseline and adaptive phases to capture the temporal dynamics of stress adaptation. The XGBoost classifier achieved the highest performance, with a classification accuracy of 0.95, precision of 0.95, and recall of 0.94, confirming the robustness of the approach. Beyond its quantitative effectiveness, the integration of SHAP-based interpretability revealed that spectral features from the delta and alpha bands were the most influential in model predictions, particularly those originating from frontal (e.g., F7) and parietal regions. The predominance of frontal delta and parietal alpha activity among the top-ranked features supports their established roles in emotional regulation and cognitive control during stress. The findings of this study highlight several promising opportunities. First and foremost, they demonstrate the feasibility of using EEG data in conjunction with interpretable AI to assess cognitive resilience non-invasively in high-performance settings. Secondly, they identify specific spectral biomarkers (particularly delta and alpha activity) as key indicators of neural adaptation during prolonged stress exposure. Last but not least, they provide a foundation for the development of real-time resilience monitoring systems that could be deployed in military or clinical environments to support training, risk detection, and personalized interventions. At the same time, challenges such as the relatively limited sample size (while justified by the elite nature of the participant group) restrict generalizability and call for replication across broader populations. Additionally, translating these findings into field-deployable solutions will require integration with complementary physiological data and careful consideration of usability and ethical implications. Addressing these challenges will be essential for scaling the proposed framework into practical, reliable, and context-aware tools for resilience monitoring and support.

Author Contributions

Conceptualization, E.T. and S.M.; methodology, E.F., I.K. (Ioannis Kakkos) and E.K.; software, E.F. and I.V.; validation, E.K., I.K. (Ioannis Kalatzis) and E.M.V.; formal analysis, E.M.V. and G.K.M.; investigation, S.M.; resources, E.F., E.S. and S.M.; data curation, E.T., E.S. and I.V.; writing—original draft preparation, E.K. and E.F.; writing—review and editing, E.K., I.V., T.K. and I.K. (Ioannis Kalatzis); visualization, E.F. and I.K. (Ioannis Kakkos); supervision, I.K. (Ioannis Kalatzis) and A.S.; project administration, G.K.M. and A.S. All authors have read and agreed to the published version of the manuscript.

Funding

This research received no external funding.

Institutional Review Board Statement

The study was conducted in accordance with the Declaration of Helsinki, and approved by the Institutional Review Board of Harokopio University of Athens (55/5-4-2017).

Informed Consent Statement

Informed consent was obtained from all subjects involved in the study.

Data Availability Statement

The data are not publicly available due to privacy reasons and can be made Savailable on request from the corresponding author.

Acknowledgments

We would like to thank Georgia Vassiliou for her valuable assistance in the data collection.

Conflicts of Interest

The authors declare no conflicts of interest.

Abbreviations

The following abbreviations are used in this manuscript:
AdaBoostAdaptive Boosting
BCIBrain–Computer Interfaces
EEGElectroencephalography
ESStroop Emotion Test
HN-SEALsHellenic Navy SEa Air Land
ML Machine Learning
PTSDPost-traumatic stress disorder
SCWTStroop Color Word Test
SHAPShapley Additive Explanations
SNTStroop Number Test
SVMSupport Vector Machine
XGBoosteXtreme Gradient Boosting

References

  1. Luthar, S.S.; Cicchetti, D. The Construct of Resilience: Implications for Interventions and Social Policies. Dev. Psychopathol. 2000, 12, 857–885. [Google Scholar] [CrossRef] [PubMed]
  2. Fletcher, D.; Sarkar, M. A Grounded Theory of Psychological Resilience in Olympic Champions. Psychol. Sport Exerc. 2012, 13, 669–678. [Google Scholar] [CrossRef]
  3. Mastroianni, G.R.; Mabry, T.R.; Benedek, D.M.; Ursano, R.J. The Stresses of Modern War. In Biobehavioral Resilience to Stress; Routledge: London, UK, 2008; ISBN 978-0-429-24956-3. [Google Scholar]
  4. Jha, A.P.; Stanley, E.A.; Kiyonaga, A.; Wong, L.; Gelfand, L. Examining the Protective Effects of Mindfulness Training on Working Memory Capacity and Affective Experience. Emotion 2010, 10, 54–64. [Google Scholar] [CrossRef]
  5. Flood, A.; Keegan, R.J. Cognitive Resilience to Psychological Stress in Military Personnel. Front. Psychol. 2022, 13, 809003. [Google Scholar] [CrossRef] [PubMed]
  6. Niedermeyer, E.; da Silva, F.H.L. Electroencephalography: Basic Principles, Clinical Applications, and Related Fields; Lippincott Williams & Wilkins: London, UK, 2005; ISBN 978-0-7817-5126-1. [Google Scholar]
  7. Katmah, R.; Al-Shargie, F.; Tariq, U.; Babiloni, F.; Al-Mughairbi, F.; Al-Nashash, H. A Review on Mental Stress Assessment Methods Using EEG Signals. Sensors 2021, 21, 5043. [Google Scholar] [CrossRef]
  8. Kaldewaij, R.; Koch, S.B.J.; Hashemi, M.M.; Zhang, W.; Klumpers, F.; Roelofs, K. Anterior Prefrontal Brain Activity during Emotion Control Predicts Resilience to Post-Traumatic Stress Symptoms. Nat. Hum. Behav. 2021, 5, 1055–1064. [Google Scholar] [CrossRef]
  9. Dimitrakopoulos, G.N.; Kakkos, I.; Anastasiou, A.; Bezerianos, A.; Sun, Y.; Matsopoulos, G.K. Cognitive Reorganization Due to Mental Workload: A Functional Connectivity Analysis Based on Working Memory Paradigms. Appl. Sci. 2023, 13, 2129. [Google Scholar] [CrossRef]
  10. Gallegos Ayala, G.I.; Haslacher, D.; Krol, L.R.; Soekadar, S.R.; Zander, T.O. Assessment of Mental Workload across Cognitive Tasks Using a Passive Brain-Computer Interface Based on Mean Negative Theta-Band Amplitudes. Front. Neuroergonomics 2023, 4, 1233722. [Google Scholar] [CrossRef]
  11. Paban, V.; Modolo, J.; Mheich, A.; Hassan, M. Psychological Resilience Correlates with EEG Source-Space Brain Network Flexibility. Netw. Neurosci. 2019, 3, 539–550. [Google Scholar] [CrossRef]
  12. Protzak, J.; Gramann, K. EEG Beta-Modulations Reflect Age-Specific Motor Resource Allocation during Dual-Task Walking. Sci. Rep. 2021, 11, 16110. [Google Scholar] [CrossRef]
  13. Rejer, I.; Wacewicz, D.; Schab, M.; Romanowski, B.; Łukasiewicz, K.; Maciaszczyk, M. Stressors Length and the Habituation Effect-An EEG Study. Sensors 2022, 22, 6862. [Google Scholar] [CrossRef] [PubMed]
  14. Matthews, G.; Panganiban, A.R.; Wells, A.; Wohleber, R.W.; Reinerman-Jones, L.E. Metacognition, Hardiness, and Grit as Resilience Factors in Unmanned Aerial Systems (UAS) Operations: A Simulation Study. Front. Psychol. 2019, 10, 640. [Google Scholar] [CrossRef] [PubMed]
  15. Wu, K.; Yuan, J.; Ge, X.; Kakkos, I.; Qian, L.; Wang, S.; Yu, Y.; Li, C.; Sun, Y. Brain Network Reorganization in Response to Multi-Level Mental Workload in Simulated Flight Tasks. IEEE Trans. Cogn. Dev. Syst. 2024, 1–12. [Google Scholar] [CrossRef]
  16. Dimitrakopoulos, G.N.; Kakkos, I.; Dai, Z.; Lim, J.; deSouza, J.J.; Bezerianos, A.; Sun, Y. Task-Independent Mental Workload Classification Based Upon Common Multiband EEG Cortical Connectivity. IEEE Trans. Neural Syst. Rehabil. Eng. 2017, 25, 1940–1949. [Google Scholar] [CrossRef]
  17. Hag, A.; Handayani, D.; Pillai, T.; Mantoro, T.; Kit, M.H.; Al-Shargie, F. EEG Mental Stress Assessment Using Hybrid Multi-Domain Feature Sets of Functional Connectivity Network and Time-Frequency Features. Sensors 2021, 21, 6300. [Google Scholar] [CrossRef]
  18. Siddiqui, A.; Abu Hasan, R.; Saad Azhar Ali, S.; Elamvazuthi, I.; Lu, C.-K.; Tang, T.B. Detection of Low Resilience Using Data-Driven Effective Connectivity Measures. IEEE Trans. Neural Syst. Rehabil. Eng. 2024, 32, 3657–3668. [Google Scholar] [CrossRef]
  19. Safari, M.; Shalbaf, R.; Bagherzadeh, S.; Shalbaf, A. Classification of Mental Workload Using Brain Connectivity and Machine Learning on Electroencephalogram Data. Sci. Rep. 2024, 14, 9153. [Google Scholar] [CrossRef] [PubMed]
  20. Nirde, K.; Gunda, M.; Manthalkar, R.; Gajre, S. EEG Mental Arithmetic Task Levels Classification Using Machine Learning and Deep Learning Algorithms. In Proceedings of the 2023 3rd International conference on Artificial Intelligence and Signal Processing (AISP), Vijayawada, India, 18–20 March 2023; pp. 1–8. [Google Scholar]
  21. Li, Q.; Coulson Theodorsen, M.; Konvalinka, I.; Eskelund, K.; Karstoft, K.-I.; Bo Andersen, S.; Andersen, T.S. Resting-State EEG Functional Connectivity Predicts Post-Traumatic Stress Disorder Subtypes in Veterans. J. Neural Eng. 2022, 19, 066005. [Google Scholar] [CrossRef]
  22. Oie, K.; McDowell, K.; Metcalfe, J.; Hairston, W.D.; Kerick, S.; Lee, T.; Makeig, S. The Cognition and Neuroergonomics (CaN) Collaborative Technology Alliance (CTA): Scientific Vision, Approach, and Translational Paths; Army Research Lab: Adelphi, MD, USA, 2012; Volume ARL-SR-0252. [Google Scholar]
  23. Czech, A. Brain-Computer Interface Use to Control Military Weapons and Tools. In Proceedings of the Control, Computer Engineering and Neuroscience; Paszkiel, S., Ed.; Springer International Publishing: Cham, Switzerland, 2021; pp. 196–204. [Google Scholar]
  24. Scarpina, F.; Tagini, S. The Stroop Color and Word Test. Front. Psychol. 2017, 8, 557. [Google Scholar] [CrossRef]
  25. Schillinger, F.L.; De Smedt, B.; Grabner, R.H. When Errors Count: An EEG Study on Numerical Error Monitoring under Performance Pressure. ZDM Math. Educ. 2016, 48, 351–363. [Google Scholar] [CrossRef]
  26. Fang, Z.; Lynn, E.; Huc, M.; Fogel, S.; Knott, V.J.; Jaworska, N. Simultaneous EEG + fMRI Study of Brain Activity during an Emotional Stroop Task in Individuals in Remission from Depression. Cortex 2022, 155, 237–250. [Google Scholar] [CrossRef] [PubMed]
  27. Zorzos, I.; Kakkos, I.; Miloulis, S.T.; Anastasiou, A.; Ventouras, E.M.; Matsopoulos, G.K. Applying Neural Networks with Time-Frequency Features for the Detection of Mental Fatigue. Appl. Sci. 2023, 13, 1512. [Google Scholar] [CrossRef]
  28. Delorme, A.; Makeig, S. EEGLAB: An Open Source Toolbox for Analysis of Single-Trial EEG Dynamics Including Independent Component Analysis. J. Neurosci. Methods 2004, 134, 9–21. [Google Scholar] [CrossRef] [PubMed]
  29. Alam, R.; Zhao, H.; Goodwin, A.; Kavehei, O.; McEwan, A. Differences in Power Spectral Densities and Phase Quantities Due to Processing of EEG Signals. Sensors 2020, 20, 6285. [Google Scholar] [CrossRef]
  30. Quinlan, J.R. C4.5: Programs for Machine Learning, 1st ed.; Morgan Kaufmann: San Mateo, CA, USA, 1992; ISBN 978-1-55860-238-0. [Google Scholar]
  31. Breiman, L. Random Forests. Mach. Learn. 2001, 45, 5–32. [Google Scholar] [CrossRef]
  32. Freund, Y.; Schapire, R.E. A Decision-Theoretic Generalization of On-Line Learning and an Application to Boosting. J. Comput. Syst. Sci. 1997, 55, 119–139. [Google Scholar] [CrossRef]
  33. Dimitrakopoulos, G.N.; Vrahatis, A.G.; Plagianakos, V.; Sgarbas, K. Pathway Analysis Using XGBoost Classification in Biomedical Data. In Proceedings of the 10th Hellenic Conference on Artificial Intelligence, Patras, Greece, 9–12 July 2018; ACM: Patras, Greece; pp. 1–6. [Google Scholar]
  34. Kohavi, R. A Study of Cross-Validation and Bootstrap for Accuracy Estimation and Model Selection. In Proceedings of the 14th International Joint Conference on Artificial Intelligence—Volume 2, Montreal, QC, Canada, 20–25 August 1995; Morgan Kaufmann Publishers Inc.: San Francisco, CA, USA, 1995; pp. 1137–1143. [Google Scholar]
  35. Shekar, B.H.; Dagnew, G. Grid Search-Based Hyperparameter Tuning and Classification of Microarray Cancer Data. In Proceedings of the 2019 Second International Conference on Advanced Computational and Communication Paradigms (ICACCP), Gangtok, India, 25–28 February 2019; pp. 1–8. [Google Scholar]
  36. Golland, P.; Liang, F.; Mukherjee, S.; Panchenko, D. Permutation Tests for Classification. In Learning Theory, Proceedings of the 18th Annual Conference on Learning Theory, COLT 2005, Bertinoro, Italy, 27–30 June 2005; Auer, P., Meir, R., Eds.; Springer: Berlin, Heidelberg, 2005; pp. 501–515. [Google Scholar]
  37. Shon, D.; Im, K.; Park, J.-H.; Lim, D.-S.; Jang, B.; Kim, J.-M. Emotional Stress State Detection Using Genetic Algorithm-Based Feature Selection on EEG Signals. Int. J. Environ. Res. Public Health 2018, 15, 2461. [Google Scholar] [CrossRef]
  38. Herman, J.P.; Figueiredo, H.; Mueller, N.K.; Ulrich-Lai, Y.; Ostrander, M.M.; Choi, D.C.; Cullinan, W.E. Central Mechanisms of Stress Integration: Hierarchical Circuitry Controlling Hypothalamo–Pituitary–Adrenocortical Responsiveness. Front. Neuroendocrinol. 2003, 24, 151–180. [Google Scholar] [CrossRef]
  39. Alonso, J.F.; Romero, S.; Ballester, M.R.; Antonijoan, R.M.; Mañanas, M.A. Stress Assessment Based on EEG Univariate Features and Functional Connectivity Measures. Physiol. Meas. 2015, 36, 1351–1365. [Google Scholar] [CrossRef]
  40. Tai, A.P.L.; Leung, M.-K.; Geng, X.; Lau, W.K.W. Conceptualizing Psychological Resilience through Resting-State Functional MRI in a Mentally Healthy Population: A Systematic Review. Front. Behav. Neurosci. 2023, 17, 1175064. [Google Scholar] [CrossRef]
  41. Master, S.L.; Amodio, D.M.; Stanton, A.L.; Yee, C.M.; Hilmert, C.J.; Taylor, S.E. Neurobiological Correlates of Coping through Emotional Approach. Brain Behav. Immun. 2009, 23, 27–35. [Google Scholar] [CrossRef]
  42. Chikhi, S.; Matton, N.; Blanchet, S. EEG Power Spectral Measures of Cognitive Workload: A Meta-Analysis. Psychophysiology 2022, 59, e14009. [Google Scholar] [CrossRef] [PubMed]
  43. Knyazev, G.G.; Bocharov, A.V.; Levin, E.A.; Savostyanov, A.N.; Slobodskoj-Plusnin, J.Y. Anxiety and Oscillatory Responses to Emotional Facial Expressions. Brain Res. 2008, 1227, 174–188. [Google Scholar] [CrossRef]
  44. Vanhollebeke, G.; De Smet, S.; De Raedt, R.; Baeken, C.; van Mierlo, P.; Vanderhasselt, M.-A. The Neural Correlates of Psychosocial Stress: A Systematic Review and Meta-Analysis of Spectral Analysis EEG Studies. Neurobiol. Stress. 2022, 18, 100452. [Google Scholar] [CrossRef] [PubMed]
  45. Vossel, S.; Geng, J.J.; Fink, G.R. Dorsal and Ventral Attention Systems. Neuroscientist 2014, 20, 150–159. [Google Scholar] [CrossRef] [PubMed]
  46. Song, B.-G.; Kang, N. Removal of Movement Artifacts and Assessment of Mental Stress Analyzing Electroencephalogram of Non-Driving Passengers under Whole-Body Vibration. Front. Neurosci. 2024, 18, 1328704. [Google Scholar] [CrossRef]
  47. Minguillon, J.; Lopez-Gordo, M.A.; Pelayo, F. Stress Assessment by Prefrontal Relative Gamma. Front. Comput. Neurosci. 2016, 10, 101. [Google Scholar] [CrossRef]
  48. Dell’Acqua, C.; Dal Bò, E.; Moretta, T.; Palomba, D.; Messerotti Benvenuti, S. EEG Time–Frequency Analysis Reveals Blunted Tendency to Approach and Increased Processing of Unpleasant Stimuli in Dysphoria. Sci. Rep. 2022, 12, 8161. [Google Scholar] [CrossRef]
  49. Gärtner, M.; Grimm, S.; Bajbouj, M. Frontal Midline Theta Oscillations during Mental Arithmetic: Effects of Stress. Front. Behav. Neurosci. 2015, 9, 96. [Google Scholar] [CrossRef]
  50. Ehrhardt, N.M.; Fietz, J.; Kopf-Beck, J.; Kappelmann, N.; Brem, A.-K. Separating EEG Correlates of Stress: Cognitive Effort, Time Pressure, and Social-Evaluative Threat. Eur. J. Neurosci. 2022, 55, 2464–2473. [Google Scholar] [CrossRef]
  51. Liu, Y.; Li, Z.; Bai, Y. Frontal and Parietal Lobes Play Crucial Roles in Understanding the Disorder of Consciousness: A Perspective from Electroencephalogram Studies. Front. Neurosci. 2023, 16, 1024278. [Google Scholar] [CrossRef] [PubMed]
  52. Allegretta, R.A.; Rovelli, K.; Balconi, M. The Role of Emotion Regulation and Awareness in Psychosocial Stress: An EEG-Psychometric Correlational Study. Healthcare 2024, 12, 1491. [Google Scholar] [CrossRef]
  53. Poppelaars, E.S.; Harrewijn, A.; Westenberg, P.M.; van der Molen, M.J.W. Frontal Delta-Beta Cross-Frequency Coupling in High and Low Social Anxiety: An Index of Stress Regulation? Cogn. Affect. Behav. Neurosci. 2018, 18, 764–777. [Google Scholar] [CrossRef]
  54. van Schouwenburg, M.R.; Zanto, T.P.; Gazzaley, A. Spatial Attention and the Effects of Frontoparietal Alpha Band Stimulation. Front. Hum. Neurosci. 2017, 10, 658. [Google Scholar] [CrossRef] [PubMed]
  55. Deng, Y.; Reinhart, R.M.; Choi, I.; Shinn-Cunningham, B.G. Causal Links between Parietal Alpha Activity and Spatial Auditory Attention. eLife 2019, 8, e51184. [Google Scholar] [CrossRef]
  56. Roy, Y.; Banville, H.; Albuquerque, I.; Gramfort, A.; Falk, T.H.; Faubert, J. Deep Learning-Based Electroencephalography Analysis: A Systematic Review. J. Neural Eng. 2019, 16, 051001. [Google Scholar] [CrossRef] [PubMed]
  57. Al-Shargie, F.; Kiguchi, M.; Badruddin, N.; Dass, S.C.; Hani, A.F.M.; Tang, T.B. Mental Stress Assessment Using Simultaneous Measurement of EEG and fNIRS. Biomed. Opt. Express 2016, 7, 3882–3898. [Google Scholar] [CrossRef]
  58. Rodeback, R.E.; Hedges-Muncy, A.; Hunt, I.J.; Carbine, K.A.; Steffen, P.R.; Larson, M.J. The Association Between Experimentally Induced Stress, Performance Monitoring, and Response Inhibition: An Event-Related Potential (ERP) Analysis. Front. Hum. Neurosci. 2020, 14, 189. [Google Scholar] [CrossRef]
Figure 1. An overview of the Stroop task protocol used to induce cognitive and emotional stress for (a) the Stroop Color Word Test (assessing cognitive inhibition); (b) the Number Stroop (evaluating interference from numeric magnitude and size); and (c) the Emotion Stroop (measuring emotional interference from negative and neutral words).
Ai 06 00112 g001
Figure 2. A schematic of the implemented framework. The diagram illustrates the full methodological pipeline, beginning with the EEG acquisition during Stroop-based cognitive and emotional tasks. Data were preprocessed and segmented into baseline and adaptive phases, and spectral features were extracted across delta, theta, alpha, and beta bands. These features were then used to train machine learning models, which were evaluated using standard performance metrics. SHAP analysis was finally employed to interpret the contribution of individual features to model decisions.
Ai 06 00112 g002
Figure 3. The confusion matrices and ROC-AUC curves for the ML models: (a) Decision Tree; (b) Random Forest; (c) AdaBoost; (d) XGBoost.
Ai 06 00112 g003aAi 06 00112 g003b
Figure 4. SHAP summary plot illustrating the top 20 features contributing to the XGBoost classifier’s predictions. Features are ranked by their mean absolute SHAP values, reflecting their overall importance to model output, with the name denoting the EEG band and the electrode. Each point represents a SHAP value for an individual instance, with color indicating the corresponding feature value (red = high, pushing the model toward the positive class (baseline); blue: low, feature values push the model toward the negative class (resilience).
Ai 06 00112 g004
Table 1. Hyperparameter configuration.
ClassifierHyperparameterValue
Decision TreeMaximum Tree DepthUnlimited
Minimum Samples per Split2
Random ForestMaximum Tree DepthUnlimited
Minimum Samples per Split2
Number of Trees200
AdaBoostLearning Rate0.1
Maximum Tree Depth6
Number of Boosting Rounds200
XGBoostLearning Rate1.0
Number of Weak Learners200
Table 2. Classification performance results.
ModelAccuracyF1-ScorePrecisionRecall
Decision Tree0.86 **0.860.860.86
Random Forest0.94 ***0.940.930.94
AdaBoost0.87 **0.870.860.87
XGBoost0.95 ***0.950.950.94
** p-value < 0.01; *** p-value < 0.001.
Disclaimer/Publisher’s Note: The statements, opinions and data contained in all publications are solely those of the individual author(s) and contributor(s) and not of MDPI and/or the editor(s). MDPI and/or the editor(s) disclaim responsibility for any injury to people or property resulting from any ideas, methods, instructions or products referred to in the content.

