Article

Baleen–Plastic Interactions Reveal High Risk to All Filter-Feeding Whales from Clogging, Ingestion, and Entanglement

by
Alexander J. Werth
1,*,
Shirel R. Kahane-Rapport
2,
Jean Potvin
3,
Jeremy A. Goldbogen
4 and
Matthew S. Savoca
4
1
Department of Biology, Hampden-Sydney College, Hampden-Sydney, VA 23943, USA
2
Department of Biological Sciences, California State University, Fullerton, CA 92831, USA
3
Department of Physics, WATER Institute, Saint Louis University, St. Louis, MO 63103, USA
4
Department of Oceans, Hopkins Marine Station, Stanford University, Pacific Grove, CA 93950, USA
*
Author to whom correspondence should be addressed.
Oceans 2024, 5(1), 48-70; https://doi.org/10.3390/oceans5010004
Submission received: 27 November 2023 / Revised: 30 December 2023 / Accepted: 30 January 2024 / Published: 1 February 2024
(This article belongs to the Special Issue Marine Mammals in a Changing World, 2nd Edition)

Abstract

:
Baleen whales are ecosystem sentinels of microplastic pollution. Research indicates that they likely ingest millions of anthropogenic microparticles per day when feeding. Their immense prey consumption and filter-feeding behavior put them at risk. However, the role of baleen, the oral filtering structure of mysticete whales, in this process has not been adequately addressed. Using actual baleen tissue from four whale species (fin, humpback, minke, and North Atlantic right) in flow tank experiments, we tested the capture rate of plastics of varying size, shape, and polymer type, as well as chemical residues leached by degraded plastics, all of which accumulated in the baleen filter. Expanded polystyrene foam was the most readily captured type of plastic, followed by fragments, fibers, nurdles, and spherical microbeads. Nurdle and microbead pellets were captured most readily by right whale baleen, and fragments were captured by humpback baleen. Although not all differences between polymer types were statistically significant, buoyant polymers were most often trapped by baleen. Plastics were captured by baleen sections from all regions of a full baleen rack, but were more readily captured by baleen from dorsal and posterior regions. Baleen–plastic interactions underlie various risks to whales, including filter clogging and damage, which may impede feeding. We posit that plastics pose a higher risk to some whale species due to a combination of factors, including filter porosity, diet, habitat and geographic distribution, and foraging ecology and behavior. Certain whale species in specific marine regions are of the greatest concern due to plastic abundance. It is not feasible to remove all plastic from the sea; most of what is there will continue to break into ever-smaller pieces. We suggest that higher priorities be accorded to lessening humans’ dependence on plastics, restricting entry points of plastics into the ocean, and developing biodegradable alternatives.

1. Introduction

In many ways, synthetic plastic polymers represent one of the greatest success stories of modern human history. Relative to other materials such as paper, wood, and glass, plastics offer five major benefits: they are exceptionally durable, lightweight, moldable (hence the name “plastic”), inexpensive, and easy to produce. Unfortunately, these clear advantages have proven disadvantageous in the environmental landscape of the twenty-first century [1]. The two traits that most distinguish plastics—and a large part of their appeal—are their persistence and ubiquity. Plastics break into smaller pieces via chemical processes including extended UV radiation, interactions with seawater, and mechanical forces such as waves, tides, and currents [1]. Recent research indicates that recycling efforts merely generate additional plastic pieces of smaller size, facilitating their spread [2]. Plastic pollution research has suffered from a lack of harmonization of terms, until recently [3]. Experts now classify pieces by size, ranging from very large mega- (>1 m) to increasingly smaller macro- (<1 m), meso- (<2.5 cm), microplastics, (<5 mm), and nanoplastics smaller than 1 µm [3]. Plastics of all sizes are further characterized as primary or secondary, depending on whether they exist in their originally manufactured form or if they represent broken or otherwise degraded pieces smaller than their original form.
Although our dawning awareness of plastics’ downsides developed slowly, it has culminated in a current flood of studies underscoring these risks [4,5,6,7,8,9,10]. Plastic pollution has now been found throughout the lithosphere, hydrosphere, atmosphere, cryosphere, and biosphere [11,12,13,14,15]. Although estimates vary, over 170 trillion pieces now litter the ocean [16], forming a global “plastic smog” with its own microbial ecosystem or “plastisphere” [14,17]. Another recent study [18] determined that the annual input of new plastics into the ocean is, at 500 kilotons, slightly less than previously estimated, but nonetheless concluded that the residence time of plastics is greater than formerly thought, such that plastics persist longer and, if not removed, have more time to break and spread. Further studies indicate that plastics wreak immunological, endocrine, and other physiological damage [19,20,21]. Marine microbes hitch rides on plastic debris [22] and plastics alter gut microbiota and weaken immune systems, leaving humans and animals vulnerable to disease [23,24].
Plastics are particularly insidious in aquatic environments because they often float, and thus, most types of organisms readily encounter them [18,25]. Plastics accumulate along current fronts and form shelters that attract organisms [26,27]. They are easily ingested by primary consumers that obtain nutrients via indiscriminate filter feeding [27,28]. In addition, several studies [29,30,31,32,33,34,35,36,37] report that aquatic animals may preferentially seek to ingest plastics due to the appealingly “tasty” chemicals that plastics release in water, including various oligomers and monomers that include micronutrients or mimic organic compounds. In this way, plastics easily enter trophic webs, binding all inhabitants of an ecosystem.
Large filter-feeding organisms are at greater risk of plastic ingestion for multiple reasons. Due to the simple yet invariant rules of thermodynamics, larger organisms must consume more food. Although biodilution occurs in ascending trophic pyramids, filter-feeding whales consume colossal amounts of food but do so low on the trophic pyramid [31], placing them at a particularly unique risk. Further, there is a high risk of filter feeders ingesting small plastics not only directly from the environment (i.e., in ingested seawater) but also indirectly via trophic (dietary) transfer—that is, within bodies of ingested organisms [27,38,39,40,41]. Even if some particles pass undigested through the guts of organisms that ingest plastics directly and via trophic transfer, there is a higher likelihood that various internal tissues and organs will retain and assimilate pollutants [15].
As the largest animals on Earth, whales (Mammalia: Cetacea) are at an exceptionally high risk of ingesting plastics [11,28,41,42,43]. A flurry of recent studies has documented the presence of various-sized plastics within digestive tracts or incorporated into tissues of whales [44]. This involves several species of toothed whales (Odontoceti), including sperm [45,46,47,48], pilot, beluga [49], and beaked whales [50,51,52,53], as well as dolphins and porpoises [54,55,56]. Plastics have also been found in baleen whales (Mysticeti), including right [57], gray [28], fin [58,59,60,61,62], Bryde’s [27], sei [27], minke [63], and humpback whales [64]. As a consequence of their need for large quantities of food, mysticetes forage mainly where prey is abundant. Cetaceans are often observed within the Great Pacific Garbage Patch [65], but they likely forage little in oligotrophic gyres where plastics accumulate substantially, and such accumulations are likely unimportant for baleen–plastic interaction and ingestion. More concerning are heavily polluted locations where mysticetes are known to forage regularly, such as off the southern and eastern coasts of Asia and in the Mediterranean Sea [5,66].
Because mysticetes are filter feeders that engulf and process huge volumes of prey- (and plastic-) laden seawater each day when feeding, they are likely to capture and ingest plastics both directly from seawater and indirectly from bodies of their prey items due to the scale and efficiency of their filtration [40]. Recent studies have estimated the amount of plastic fragments ingested by baleen whales: as much as ten million pieces per day for a blue whale [40]. Numerous recent empirical studies have supported these levels of plastic ingestion in separate ecosystems and baleen whale species [27,28,40]. However, the oral baleen filter itself has not yet received sufficient attention for its role in removing and accumulating environmental plastics from seawater within the whale’s mouth. Indeed, this project originated indirectly via unforeseen observations from laboratory flow tank experiments using buoyant plastic particles to study baleen’s functional and biomechanical properties [67]. It was discovered that plastic particles, intended simply to indicate flow directions and serve as a stand-in for tiny particulate prey, were captured at unexpectedly high rates by the baleen filter [68]. Therefore, this study was undertaken to determine and more precisely characterize the risks posed to baleen whales from their standard mode of filter feeding. Specifically, we aimed to determine how well whales’ oral baleen filter captures plastic pieces of varying size and type with experiments deploying actual baleen tissue in a circulating flow tank (flume). Further, we sought to investigate factors affecting capture, including parameters associated with different plastics (such as size, density, and buoyancy) and with whales themselves (such as swim speed during foraging and forces associated with ingestion, intraoral filtration, and water expulsion). A relationship between removal of plastic via baleen entanglement/clogging and plastic accumulation at the oropharynx/ingestion is also proposed. Our greater aim was to use results of this comparative experimental study to determine more accurately the specific risks posed to whales by plastic filtration and ingestion, as well as to better understand ways to prevent or mitigate these risks.
Although published studies regarding interactions between cetaceans and marine plastic pollution have not specifically focused on the role of the keratinous oral baleen filter in collecting plastics, previous accounts have indicated or suggested at least seven potentially harmful consequences (Figure 1). These include (1) direct and indirect (i.e., trophic) capture of micro- and macroscopic plastic pieces by the baleen filter, after which any plastic retained by the filter can (2) remain within baleen and clog the filter, temporarily or permanently impeding its future function, or alternatively fall off the baleen and be swept or expelled outside the mouth, or (3) be channeled into the digestive tract. Plastic can pass through the gut untouched, (4) cause intestinal impactions (or gut “plasticosis” [63,69,70], or (5) be assimilated or otherwise incorporated into muscle or other body tissues, particularly if the plastic pieces are of very small size [20,44,71]. Further, larger pieces of plastic debris such as ropes, nets, buoys, or other debris (often from discarded fishing gear [72,73]) can (6) entangle whale bodies or body parts, including flippers and flukes, hindering whales’ locomotion, respiration, feeding, and other activities, or (7) lodge within baleen racks, not so much clogging as damaging the filter by bending plates and opening gaps between them, which obviously affects filtration adversely. Our study specifically focused on basic baleen–plastic interactions. Additional projects are needed to better assess risks of micro- and nanoplastic assimilation and sequestration within tissues [44], as well as larger-scale filtration dynamics of impaired baleen racks due to gear entanglement.
Finally, we sought to investigate whether particular species or populations of whales are at a higher risk from plastic pollution, including not only the oral capture of plastics but also larger-scale feeding-related risks such as entanglement and filter clogging. We investigated baleen from the skim-feeding North Atlantic right whale (Balaenidae) and three species of lunge-feeding rorquals (Balaenopteridae). In summary, we found that plastic pollution poses serious risks to all cetacean species. An array of diverse behavioral, ecological, and morphological factors, including but not limited to varying foraging strategies, geographic distributions and habitats, and filter porosities, result in differing and often elevated risks to each whale species.

2. Material and Methods

2.1. Biological Specimens

We used baleen plates from humpback (Megaptera novaeangliae), fin (Balaenoptera physalus), common or Northern minke (Balaenoptera acutorostrata), and North Atlantic right (Eubalaena glacialis) whales. The collection was carried out by the NOAA/NMFS Northeast Marine Mammal Stranding and Disentanglement Network (VA, MA) or the NOAA/NMFS Southeast Marine Mammal Stranding Network (NC, FL) under U.S. Permits 17350 and 18786. All baleen specimens were obtained from adult animals that died naturally and were procured by certified stranding networks in accordance with MMPA and other applicable statutes. All samples came from specimens that were stranded along the Atlantic coast of USA, except for 11.8 kg of humpback whale (specimen #RMNH.MAM.5506) baleen, which was obtained from the Naturalis Biodiversity Center, Leiden, The Netherlands, on 3 January 2018, from a whale that was stranded along the North Sea coast of the Netherlands in 2012, following CITES permitting (transaction #2082682 to the Smithsonian National Museum of Natural History, Washington, DC, USA). Baleen samples were frozen for shipment and storage, then thawed at room temperature and kept submerged in flowing water for at least seven days prior to flow tank testing.

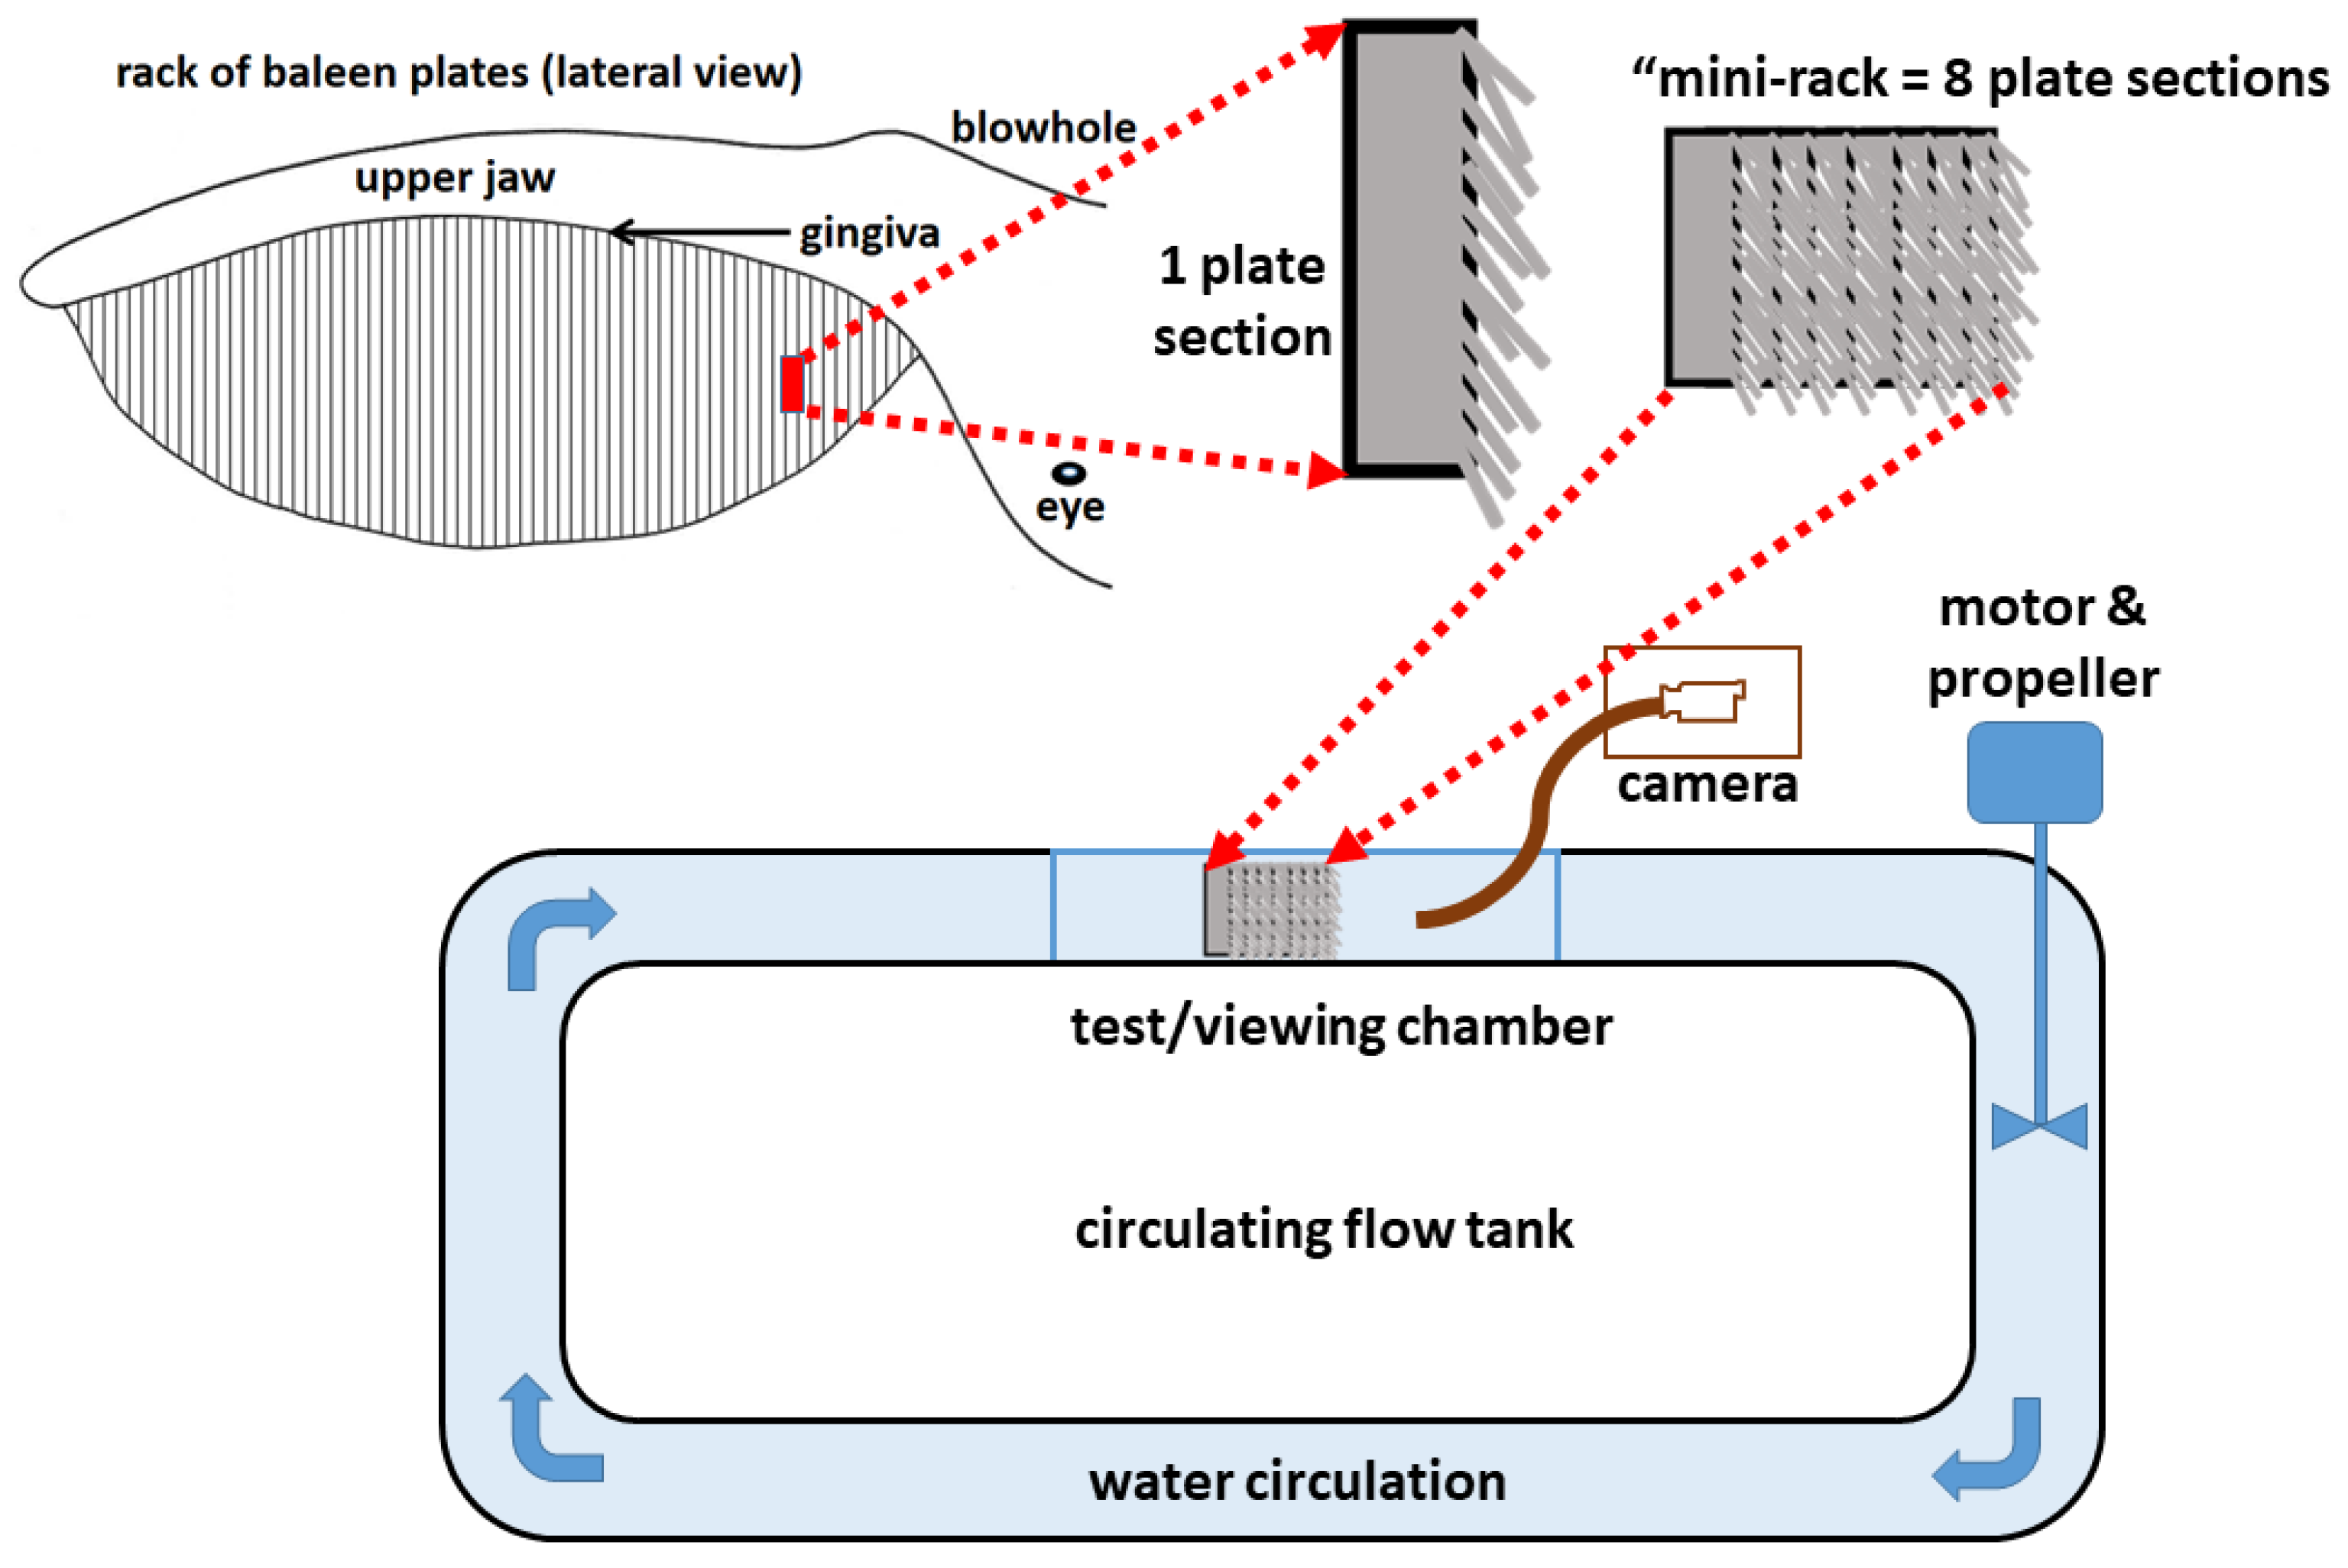
2.2. Flow Tank Testing

Baleen plates were cut into 18 cm long × 10 cm wide sections and assembled into “mini-racks” of eight pieces, each separated by a 1 cm intra-plate gap (from a plastic or cardboard strip), simulating the normal arrangement of baleen in vivo [74]. Where possible, mini-racks were created by cutting sections from adjacent plates; for the North Atlantic right whale baleen, four sections were cut from each of two adjacent plates in a rack to create the eight-piece mini-rack (Figure 2). For a later set of experiments, plate sections were specifically cut from plates in different regions of the whale mouth (i.e., plate sections came from different locations along a full baleen rack), as described later. For a few final trials, larger humpback whale baleen mini-rack units were used (Figure 3C,D), including 24 plate sections as expanded versions of the mini-rack units. Note that only major baleen plates (not medial minor plates [75]) were cut to produce the sections comprising each baleen mini-rack.
For all species, each baleen plate section was approximately 0.3 cm thick, and each piece included one edge of the lingual or medial margin of a baleen plate featuring freely eroded fringes (Figure 2), also known as baleen bristles or hairs (Figure 3E). The same mini-rack was used for each trial of baleen from a particular species. Each mini-rack was secured by clamping it to a metal rod, then submerged below the water surface in a 90 L circulating flow tank (flume). The flume was made of PVC sections in a vertical loop, modeled on a design by S. Vogel [67], with a transparent Plexiglas top in which a flat viewing window was installed through which the ruled grid behind the test chamber could be seen (Figure 2 and Figure 3E). The working section of the tank’s test chamber had a length of 70 cm and a cross-sectional area of 900 cm2, with 1–2% blockage from baleen samples when present. Water flow speed through the tank varied from 0.15–1.4 m/s. Varying flow speeds were achieved by (a) selecting different motor speeds, (b) using metal propellers of differing diameter, and (c) adjusting a rheostat to alter the motor’s input voltage. Before and after experimental trials, flow speed was checked and calibrated with a digital flow meter (model MFP51, Geopacks, Hatherleigh, Devon, UK). Most trials were performed with flow speeds commensurate with intraoral currents generated in vivo during swimming in the range of 0.15–0.9 m/s, which is consistent with published swimming speeds of balaenid and balaenopterid whales during skim- or lunge-feeding at the surface or deeper in the water column [76,77,78,79,80]. Baffles at each end of the test section promoted laminar flow. After preliminary experiments testing the effects of water temperature on plastic capture rate (and finding no effect), all flow experiments were performed in freshwater or seawater at 19 °C. Baleen was submerged before flow commenced, with plates arranged in the tank (Figure 2) perpendicular to flow (i.e., a 90° angle of attack), simulating the direction of flow in a whale mouth in vivo [67].

2.3. Experimental Design and Statistical Power Analysis

Given the breadth and complexity of our experimental setup (testing baleen–plastic interactions from baleen of four whale species in multiple ways, including five different shapes, three sizes, and six types of plastic debris in varying flow speeds, etc.), we used a linear mixed-effects statistical model to analyze correlation and variance–covariance structures. We conducted a basic power analysis prior to data collection to ensure that our null hypothesis testing would be valid and robust. Using WebPower 4.5.2 (an online R package), we determined the minimum sample size needed to avoid Type II (false-negative) errors due to insufficient statistical power: for basic functional (debris capture) testing, N = 5 replicates (for each plastic variable; N = 450 total) with 0.80 power (p), representing greater than 80% confidence for significance at the 0.05 level. This was the same (N = 450) for each flow speed used in the videorecorded flume testing (30 s trials). For the residue analysis, we used a minimum N = 12 samples per species, with N = 3 flume trial replicates per each flow speed (total N = 216). Data from each component of the study were analyzed statistically (using SigmaPlot 13.0) via parametric paired t-tests to compare different treatments from the same species, including linear regression via Pearson’s tests to study relationships between variables, and ANOVA (with post-hoc Bonferroni correction) to compare results of plastic interactions in different species. All data are shown with error bars = standard deviation.

2.4. Video Analysis

Flow sequences (recorded at or edited to 30 s in duration) were videorecorded laterally and anteriorly underwater from within the flume (Figure 2) and from outside the flume via a planar viewing window on the side of the test chamber, by a digital endoscope (VideoFlex SD, Umarex Laserliner, Arnsberg, Germany) with an illuminated 17 mm camera head recording JPEG images and AVI video (30 frames per second; 5/25/50 cm focal distances). Anterior views were used to set up the experimental protocol, but for continuity and uniformity, only lateral views were used in the final analysis. The recorded field of view covered the entire baleen mini-rack (Figure 3E,F). Video was viewed frame-by-frame via GoPro Studio v. 2.5.7, with landmarks digitized via Tracker v. 4.92. Kinematic analysis focused on the number of plastic pieces captured (defined as adhering to baleen for ≥2 s) relative to water flow speed. Initially, flow tank runs were scored simply by summing the total number of plastic pieces captured within the entire field of view over the 30 s of the trial; this count provided a clear, easy, and effective method and a useful basis of comparison. However, this method depended on the density of plastic debris encountering baleen. Even if each trial began with standardized density, pieces did not easily recirculate within the flume at the same rate. Therefore, trials were rescored not by simple counting but instead as a percentage of the total number of visible plastic pieces passing through the videorecorded field of view within the 30 s trial (=capture rate for N particles or NCR).
For each set of experimental variables, trials were conducted ≥5 times (total N = 450 for each flow speed, except for trials on plastic residues, with N = 3 or total N = 216), with paired t-tests/Pearson’s tests and ANOVA testing of data from replicates, as outlined in the previous section.
As mentioned above, the cutoff for debris “capture” in video analysis was set at 2 s. This duration was determined after initial analysis because many particles (including pellets, fibers, fragments, etc.) were observed to briefly contact baleen tissue during their flow through and around the mini-racks, but in a majority of cases (>50%), particles “bounce” off the baleen almost immediately or adhere to it very briefly (~1 s) before flowing away. Particles that touch elements of the baleen filter for >1 s generally remain trapped there for long durations (>2 s), although they too can be washed away, particularly in the case of smaller (microplastic) particles. Hence, the 2 s cutoff was used to define capture.
Determining actual plastic ingestion into the gut requires accounting for possibilities of particles either moving past one baleen plate (Figure 1) toward the next downstream plate or directly to the oropharynx or else passing through the filter to exit into the ocean due to smaller particle size relative to fringe porosity and intra-baleen plate gap width. Estimating such a number from capture percentages (as defined above) was done as follows. Using particle counts, one starts by considering the total number (Ntot) of particles soon to arrive at the location of a baleen plate (Figure 1), a number also equal to the sum of the number of particles passing through baleen while following the crossflow between plates [67,81] (Nthrough), those bypassing the plate altogether (Nbypass), and the plastic entangling with fringes (“capture”; Nentangle). This sum can be further expressed in terms of the capture rate measurement described above (NCR), yielding Nentangle/Nbypass = NCR, and through fringe–baleen crossflow [82], estimated via the ratio Nthrough/Ntotal = φ(ρparticles/ρwater)CCFF. Here, parameters φ, ρparticles, ρwater, CCFF correspond to fringe-plate section porosity [83], mass density of the plastic particulates, mass density of seawater, and water flow fraction passing through the baleen filter [81,82], respectively. Inserting this into the particle count expressed as a fraction of the total (Ntotal) yields the following equation, after solving for the bypass ratio, Nbypass/Ntotal:
N bypass N total = ( 1 1 + N C R ) ( 1 φ ρ particles ρ waters C CFF )
Note that where plastic particulates are larger than the largest fringe gaps, the value of the crossflow coefficient (CCFF) effectively becomes zero.

2.5. Plastic Pollutants Used

Baleen tissues of different whale species were exposed in each series of comparative trials to one of several kinds of plastics, which varied according to (a) shape, (b) size, and (c) chemical type. A fourth series of preliminary trials focused on (d) chemical residues leached from plastics, as explained below. Plastic debris varied in buoyancy: some types/sizes were highly buoyant, especially at low flow speeds, whereas other pieces of neutral buoyancy flowed through the middle of the tank’s water column. Some pieces sank to the bottom as flow stopped when trials concluded.
The density of plastic pieces (i.e., number of fragments per volume of water) used in trials varied according to the shape, size, and type of plastic. Densities ranged from approximately 15,000 spheres per m3 for latex microbeads (average diameter 710 um) to 10–50 fragments per m3 for larger macro- and mesoplastics. Although there is tremendous variance in the concentration of plastic debris in natural marine environments, these concentrations are generally high. However, this study focused less on generating realistic ingestion estimates and more on developing a mechanistic understanding of how baleen captures synthetic polymer particles. Note that not all combinations or permutations of plastic shape, size, etc., were possible or attempted for this study. For example, trials that compared plastic capture by whale species used solely microbead spheres and macro- and mesoplastic fragments; trials that compared different plastic polymer types used only fragments of micro-, macro-, and mesoplastics. A drain at the bottom of the tank allowed water and any plastic to be removed from the tank, especially between trials using different types or sizes of plastic debris. Each flow trial involved only each type of plastic (i.e., fibers or fragments), not combined plastics of multiple shapes or sizes, etc., with the notable exception that microbeads were used in some trials of larger plastics because the microbeads were useful in visualizing flow. In these cases where microbeads were used, even though the focus was on another type of plastic, a smaller density of beads was used; approximately 10% of the tested density where the focus was on microbead capture (i.e., ~1000–2000 beads/m3 instead of 15,000 beads/m3).
Microplastic (<5 mm) pieces were allowed to recirculate through the circular flume, but larger pieces and all sections of plastic cord were contained by screens installed at each end of the test section. This was done to prevent any plastic debris from entangling the propeller or otherwise interfering with flow, but it meant that debris remained in the test section and recirculated to a lesser degree than smaller pieces. Video analysis indicated that approximately 30% of plastic pieces were stuck to the downstream screen, especially at high flow speeds (≥75 cm/s). Nonetheless, most pieces were buoyant and easily recirculated, allowing many chances for circulating plastic to be trapped by the baleen filter.

2.5.1. Plastic Shapes

Plastics used in the flow trials included five different forms: (1) fragments of irregular size, (2) linear fibers, and (3–5) three kinds of spherical pellets: tiny microbeads, expanded polysytene (hereafter called “foam”) spheres, and nurdles used as components for injection molding or other manufacturing. Some trials also used 10 cm long sections of plastic cord rope, made of polypropylene or nylon.

2.5.2. Plastic Sizes

Additionally, trials included three general sizes of plastics, especially for the fragments: (1) microplastics less than 5 mm in size/diameter, (2) macroplastics from 5 mm to 2.5 cm, and (3) mesoplastics larger than 2.5 cm. Spherical pellets ranged from transparent, white, or blue microplastic latex beads averaging 710 µm in diameter (Sargent–Welch #50024, 0696-00-K, Rochester, NY, USA) to red or white macroplastic nurdles ranging from 5 to 8 mm in diameter, made of acrylonitrile butadiene styrene (ABS) and obtained in 2005 from LEGOLAND California (Carlsbad, CA, USA). The 10 cm long sections of plastic rope were of varying diameter: 3 mm, 8 mm, and 14 mm. No large megaplastics (i.e., >1 m) or microscopic nanoplastics (<1 µm) were used in the flow tank experiments for this study.

2.5.3. Plastic Resin/Polymer Types

Limited trials of micro-, macro-, and mesoplastic fragments focused on different chemical types of plastics, with types based on the universal international recycling scheme. Thus, trials were conducted with type #1 polyethylene terephthalate (PET), #2 high density polyethylene (HDPE), #3 polyvinyl chloride (PVC), #4 low density polyethylene (LDPE), #5 polypropylene (PP), and #6 polystyrene (PS). Together, these polymers make up ~95% of all plastic production and range from positively to negatively buoyant in seawater [84]. Plastics of category/type #7 (all other plastics) were not specifically used. All plastics used for this experiment involved “found” objects collected as outdoor and indoor environmental debris in central Virginia, USA. Fragments for each of the six recycling types 1–6 were obtained from debris as follows: type #1 (PET) from clear water and other bottles; #2 (HDPE) from milk/detergent/soda jugs, toys, mats, and water bottles; #3 (PVC) from wire coatings, packaging, toys, and bags; #4 (LDPE) from shopping bags, sacks, and wrappers; #5 (PP) from bottles/caps, containers, yogurt cups, and plastic tape; #6 (PS) from egg cartons, foam trays, and fast food “clamshell” containers. All plastics of these types were identified by the recycling code on the plastic source from which the fragments were created by tearing or snapping by hand or by cutting with scissors or an X-Acto razor knife.

2.5.4. Plastic Residues

Finally, some trials used chemicals leached from plastics after sitting in glass beakers of heated (40–45 °C) water for >10 days. Although these chemical residues from mechanically broken/degraded plastics were not tested for final identification, we believe, based on published literature regarding similar plastics and their degradation [62,85], that these residues were primarily styrene monomers and dimers and polystyrene oligomers, although some samples may have included bisphenol A (BPA) as well. Small amounts (10–20 mL) of these residues were poured into the moving water of the flow tank so that their interaction with baleen tissue could be recorded and studied. Unlike the trials with different plastic debris pieces of varying shape, size, and type, in which the capture rate was analyzed by video analysis, the capture of plastic residues could not be effectively observed via video. Thus, the baleen mini-racks were visually examined, both within the water-filled tank and especially in the air after removal from the flow tank, once the flow had ceased. Photography could then document the presence of residues on flat portions of baleen plates [68]. Although chemical residues were also observed on baleen fringes, it was ultimately deemed too difficult and subjective to determine their presence there. Attempts were made to judge amounts of residue on baleen plates as high, low, or intermediate, but this also proved difficult, so any chemical residue was simply scored as present or absent. As with trials using plastic pieces, all tank water was drained, flushed, and replaced following flow trials investigating plastic residues.

3. Results

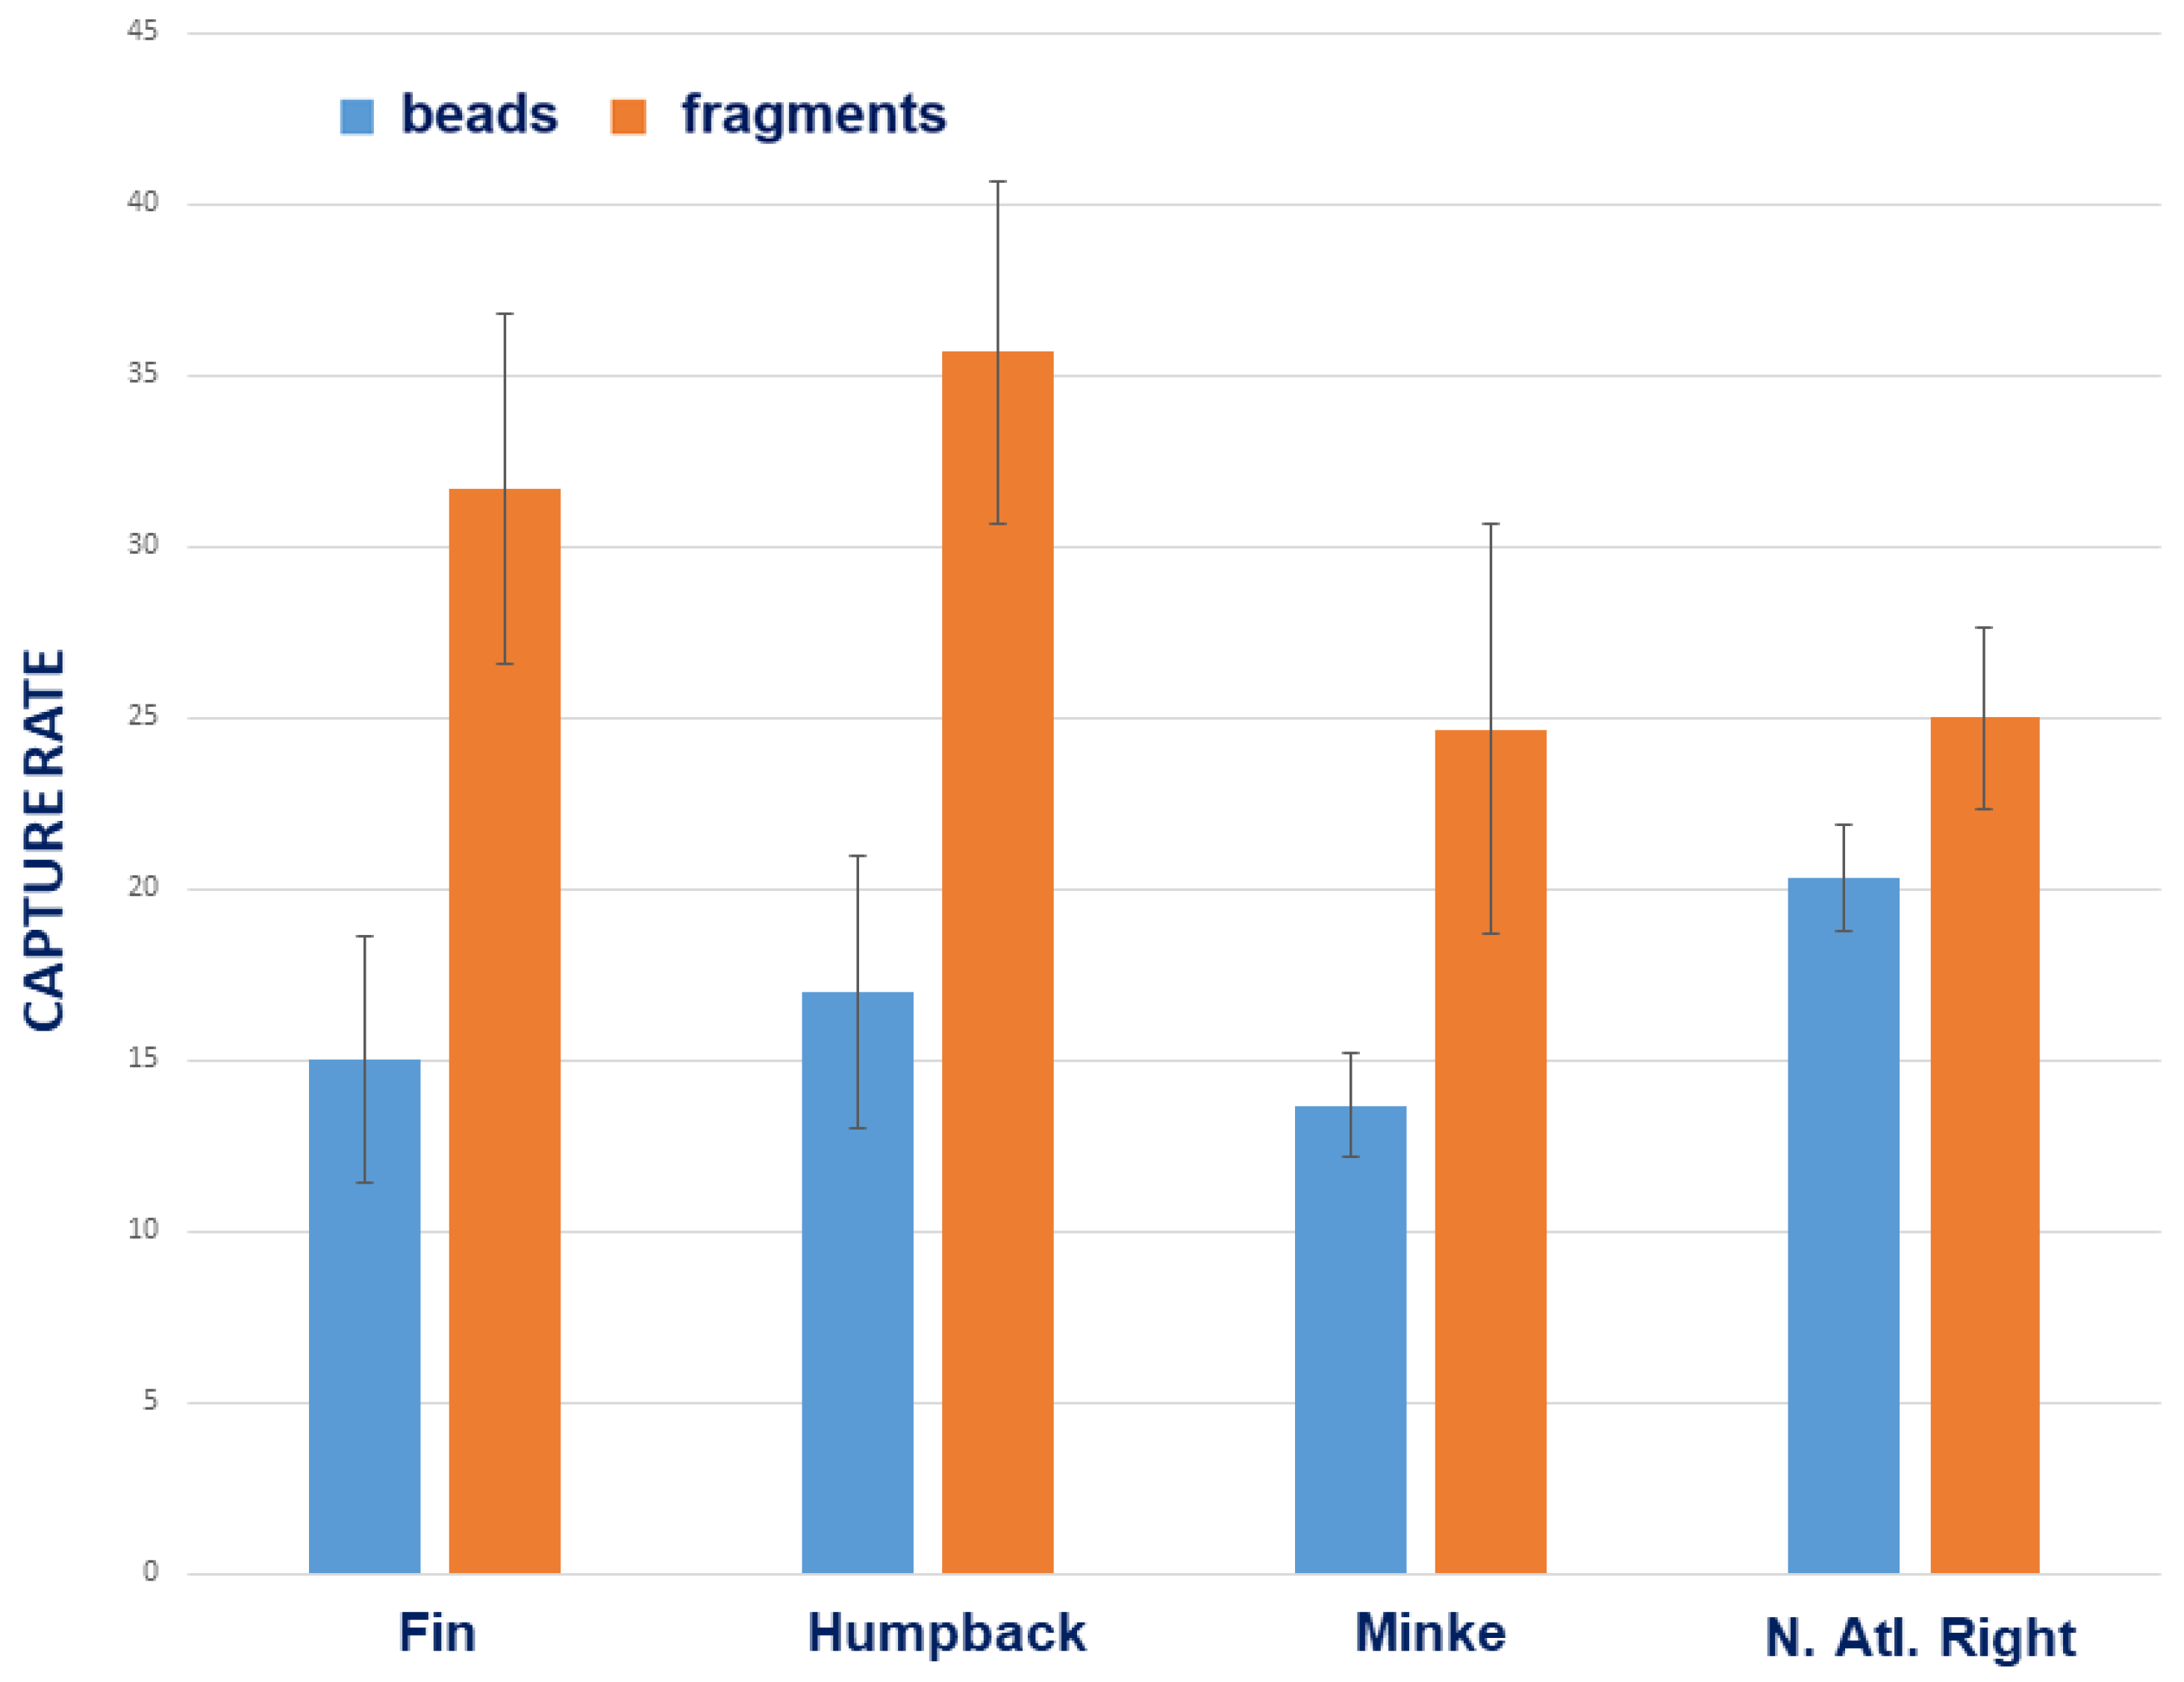
3.1. Comparative Species Results

Micro- and macroplastic pieces, including spherical pellets (microbeads averaging 710 µm in diameter and mesoplastic nurdles ranging from 5 to 8 mm in diameter) and irregularly shaped mesoplastic fragments (5 mm to 2.5 cm in diameter), were readily captured by all whale baleen specimens used in the flow tank experiments (Figure 3). For all shapes of plastic, all baleen samples (all species) captured, through three trials, an average of 29.53 (±4.33)% of pieces videorecorded flowing through the baleen mini-rack. For microbeads, the average capture rate (all species) was 17.0 (±4.0)%, for macroplastic nurdle pellets, it was 23.67 (±4.51)%, for fibers it was 27.67 (±6.03)%, for foam pieces it was 42.67 (±2.08)%, and for irregularly shaped microplastic fragments, it was 35.67 (±5.03)%.
Capture rates varied by species but were most widespread for microbeads and fragments, with more fragments captured than beads (Figure 4). Beads had a capture rate of 15 (±4.33)% in fin whale baleen, 17 (±4.1)% in humpback whale baleen, 13.67 (±4.0)% in minke whale baleen, and 20.33 (±1.53)% in right whale baleen. For fragments, the capture rates were 31.67 (±5.13)% in fin, 35.67 (±5.0)% in humpback, 24.67 (±6.0)% in minke, and 25.0 (±2.65)% in right whale baleen. Thus, although the results did not demonstrate statistical significance, right whale baleen captured more beads than baleen from any of the three rorqual species tested (p-value = 0.33; r = 0.69), whereas humpback baleen captured the most fragments (p-value = 0.48) (Figure 4).

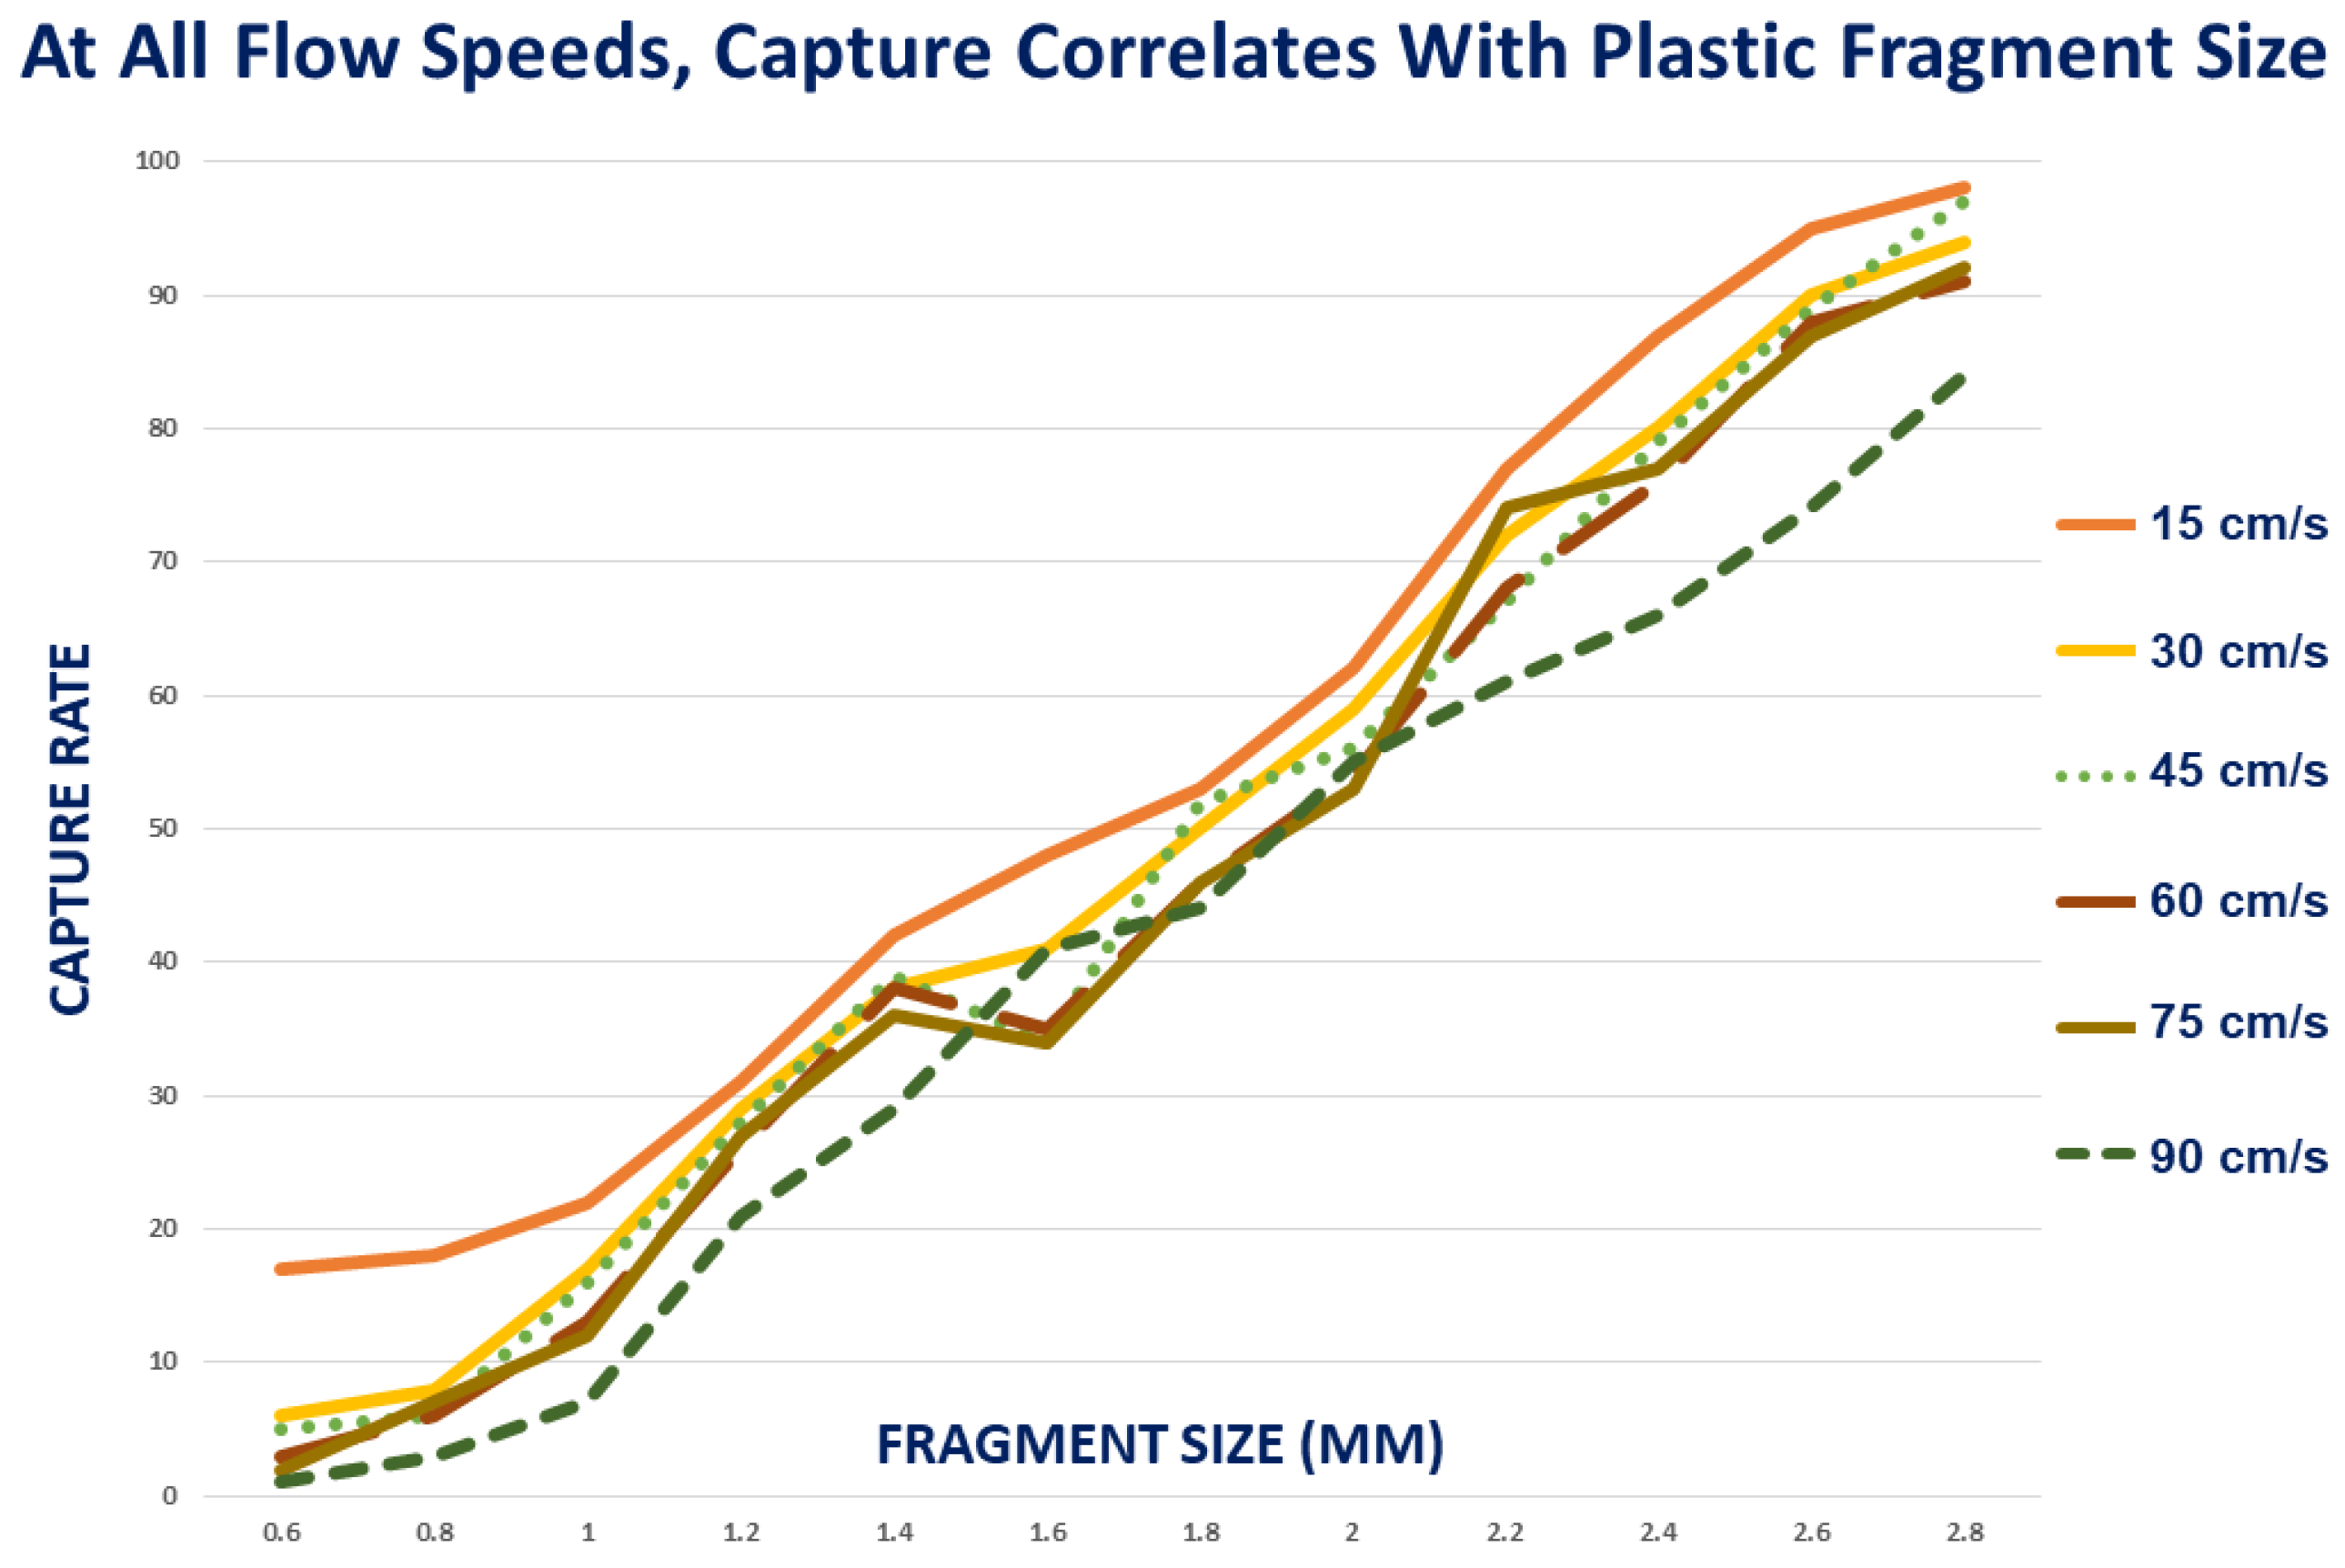
3.2. Effect of Fragment Size

There was an unsurprisingly strong positive correlation between the sizes of plastic pieces used in the trials and their capture rate (r = 0.89; p-value = 0.03; Figure 5). Larger pieces were significantly more easily captured; they also were retained within the baleen filter for longer durations than smaller pieces (r = 0.71; p-value = 0.08), which, even if captured, were more likely to be quickly swept free from baleen at all flow speeds.

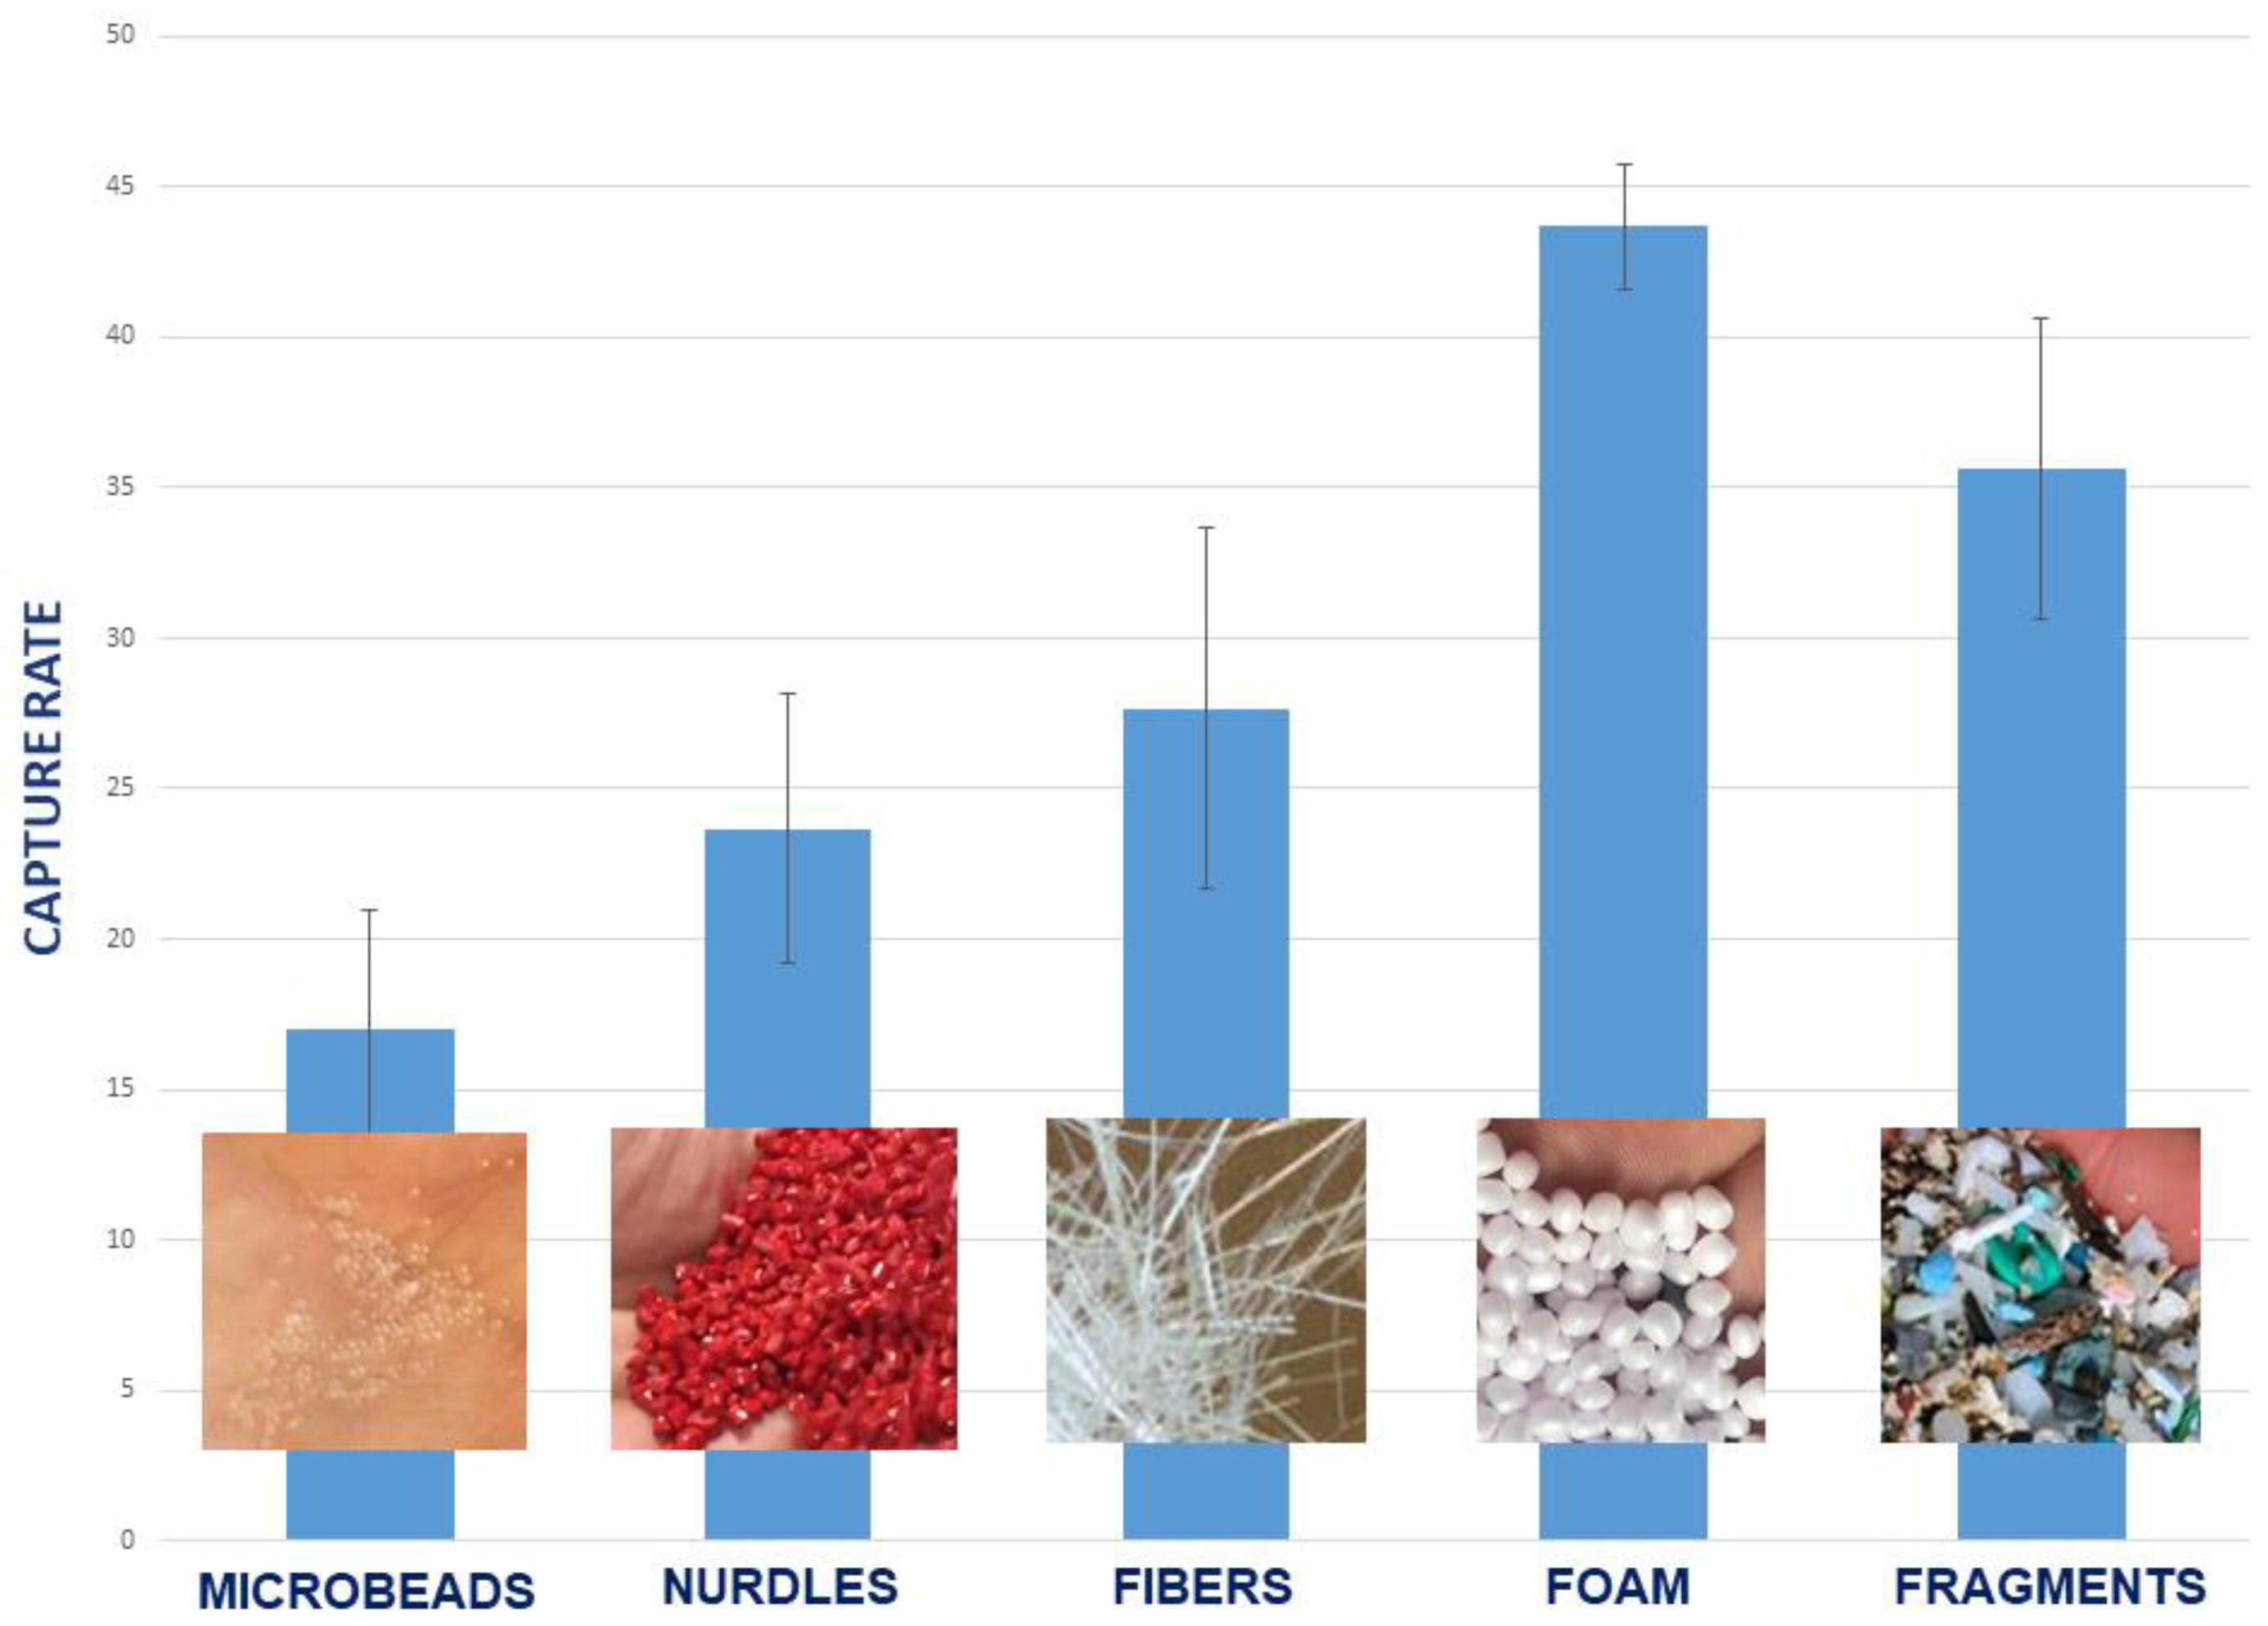
3.3. Effect of Plastic Fragment Shape

Trials with different kinds of plastic debris showed that different micro- and macroplastic pieces are captured and retained differently within the baleen filter (Figure 6). After experimenting with these shapes and concluding that humpback whale baleen achieved the highest overall capture rates for all shapes except microbeads (caught most readily by right whale baleen), more replicates of trials (5× for each shape) were conducted with humpback baleen. Capture rate results for humpback baleen were as follows (Figure 6): 17 (±4.1)% for microbeads, 23.67 (±4.51)% for nurdles, 27.67 (±6.03)% for fibers, 43.67 (±2.08)% for foam, and 35.67 (±5.03)% for fragments. Foam pieces were captured at the highest rate, more than twice that of microbeads; relative to other plastic pieces, foam was the only shape to demonstrate (barely) any significantly different rate of capture (p-value = 0.047). Irregularly shaped microplastic fragments were the second most captured pieces. The overall capture rate for all types/shapes was 29.53 (±4.33)%.

3.4. Effect of Flow Parameters

We sought to test the impact of varying flow regimes on the capture rate of plastic debris in baleen of all tested species. To do this, we initially adjusted parameters such as angle of attack (simulating different pathways of flow into, through, and out of the mouth), water temperature (simulating different seasons, habitats, or geographic regions), and flow speed (simulating different speeds of whale swimming during foraging). We found no statistically significant or noteworthy effects of these variables (on baleen of any species; p-value = 0.32), except for a slightly negative correlation between capture and flow speed for all species (r = −0.19; Figure 5). In faster flows, baleen fringes captured fewer plastic particles, or if pieces did contact baleen briefly, they were not in contact long enough (≥2 s) to be counted as “captured” because they were quickly swept away.

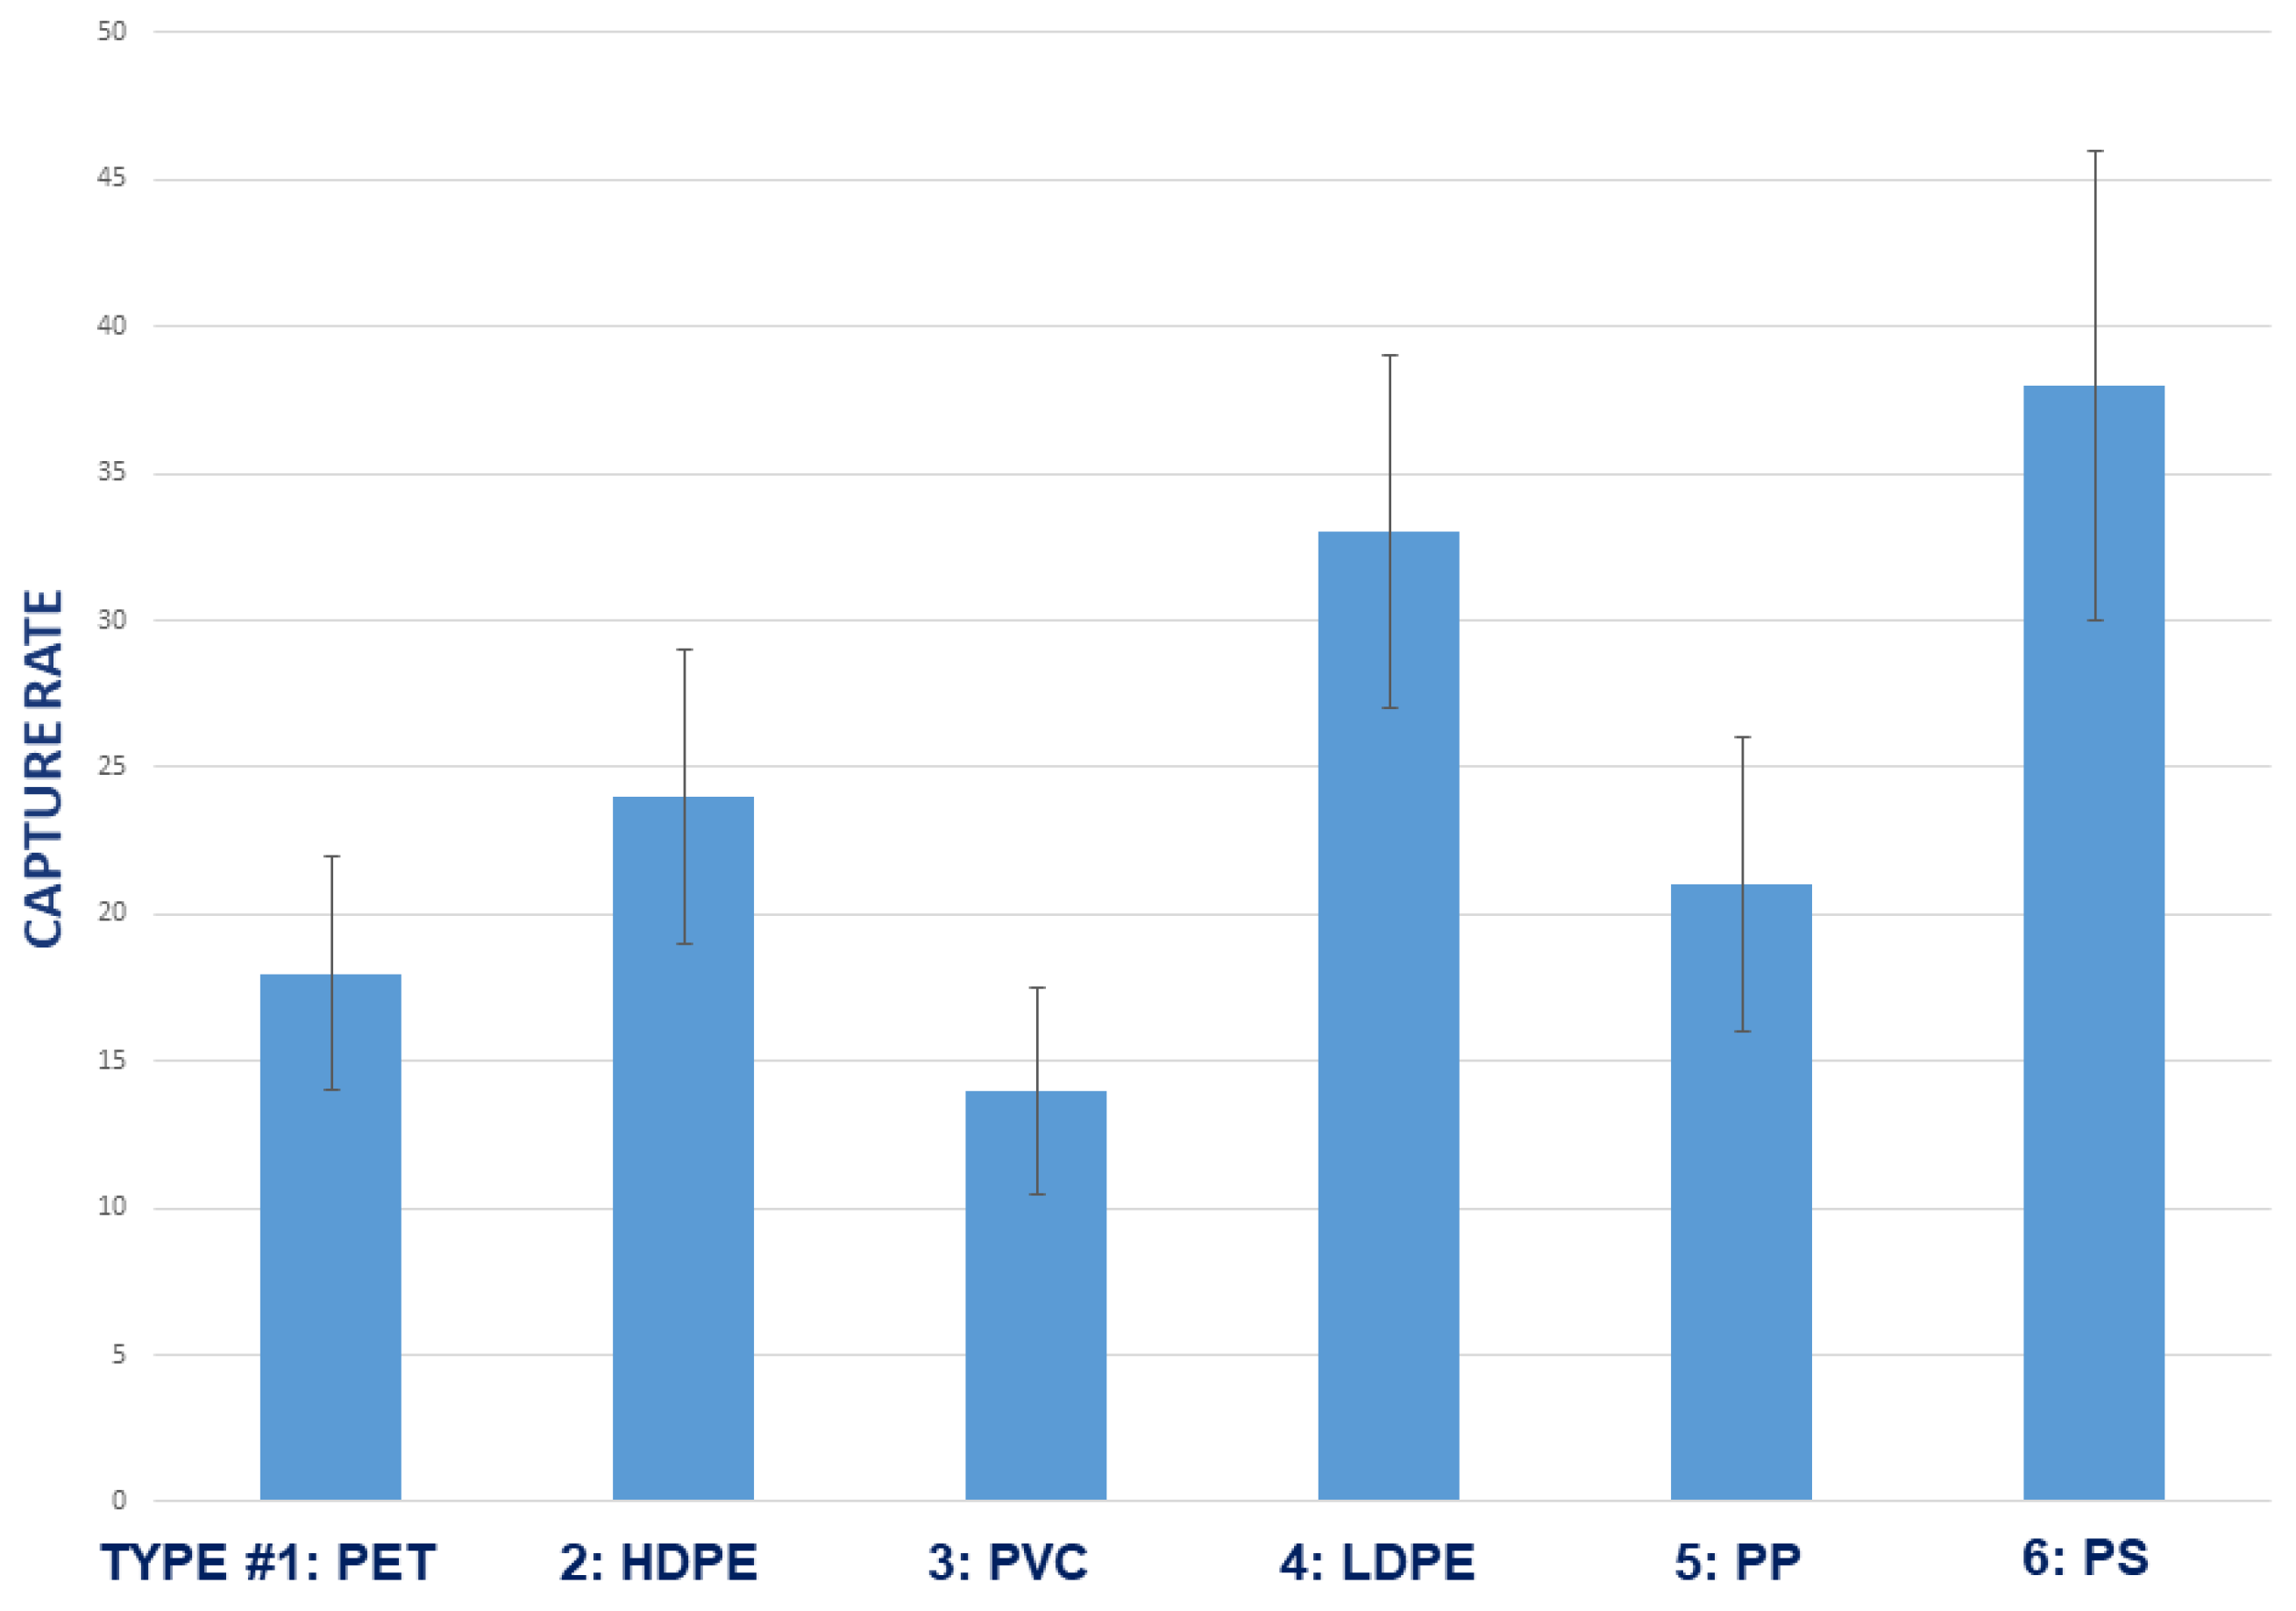
3.5. Effect of Plastic Polymer Type

Trials examining interactions of humpback whale baleen with different chemical types of plastic polymer or resin, following the universal recycling code, showed some differences, although not all were statistically significant (Figure 7). The capture rates by plastic recycling code were as follows: Type #1 (PET) 18 ± 4%, #2 (HDPE) 24 ± 5%, #3 (PVC) 14 ± 3.5%, #4 (LDPE) 33 ± 6%, #5 (PP) 21 ± 5%, #6 (PS) 38 ± 8%. Polystyrene and low-density polyethylene were captured at significantly higher rates (r = 0.82; p-value = 0.04), while polyethylene terephthalate and polyvinyl chloride had the lowest rates (p-value = 0.26).

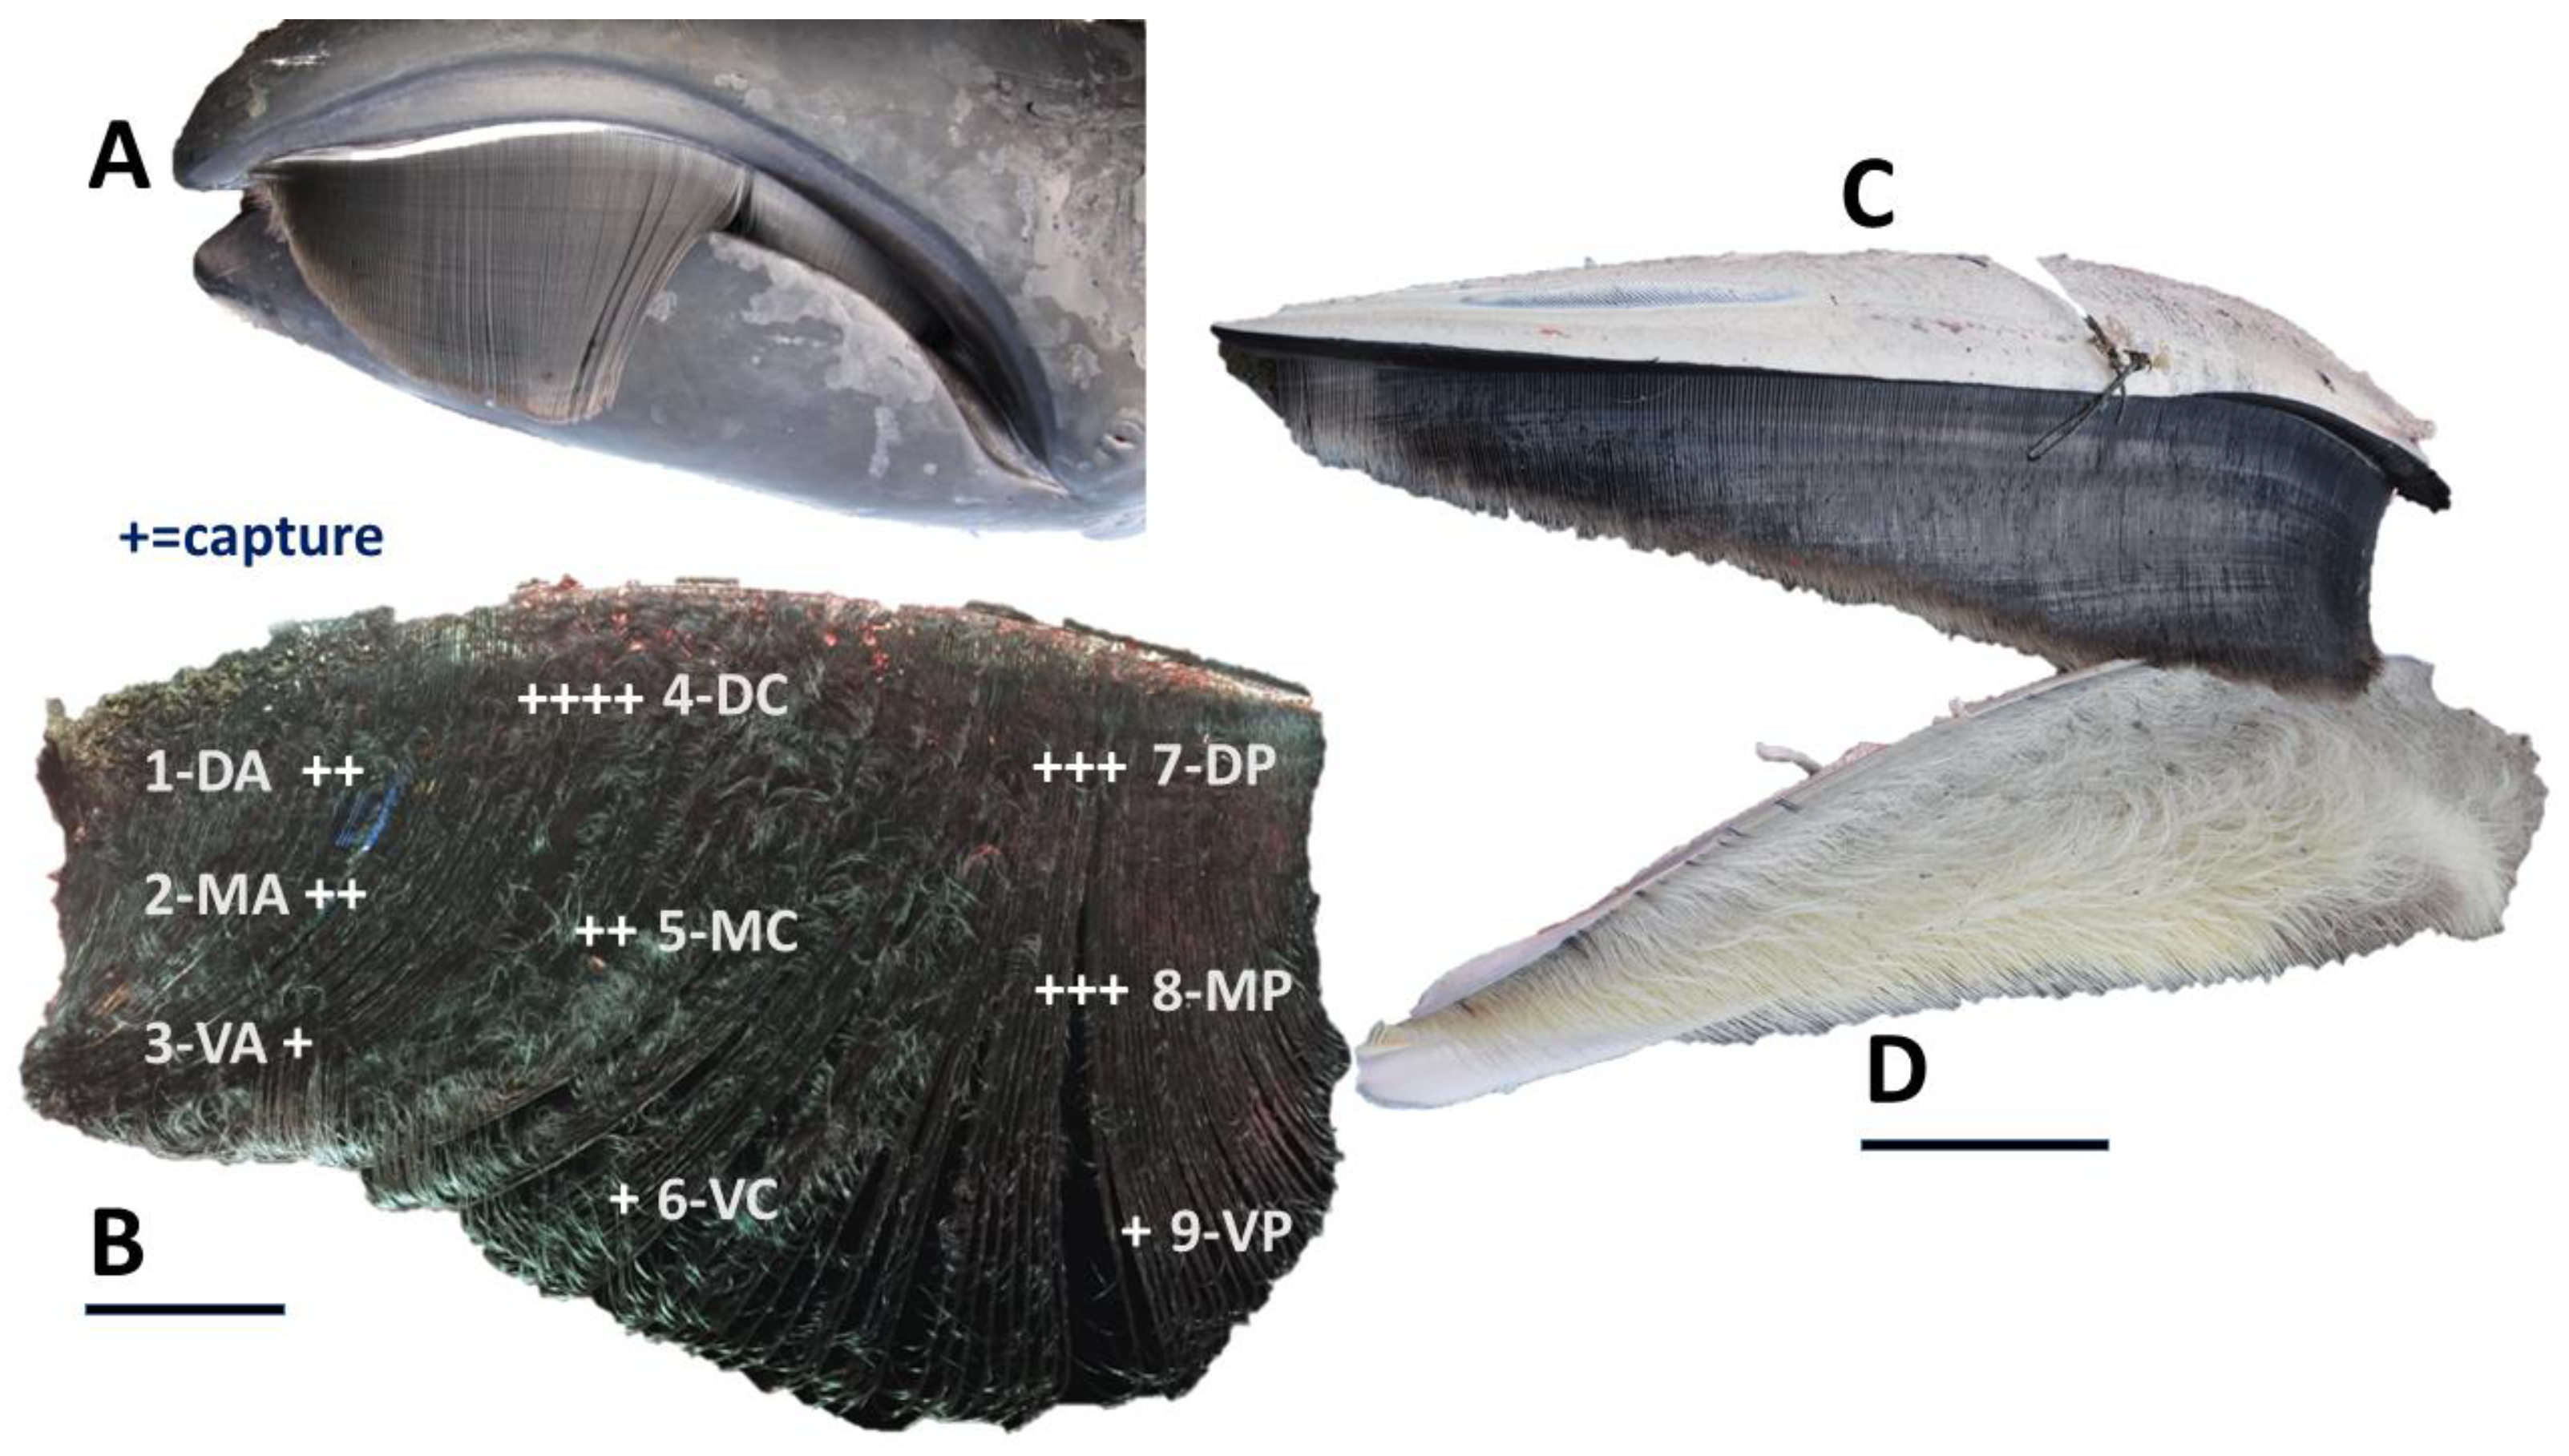
3.6. Differential Capture within Regions of Baleen Rack

An attempt was made to determine whether baleen taken from different regions of a complete baleen rack varied in its ability to capture plastic, given that baleen tissue may differ slightly between regions, particularly in terms of the length, diameter, and density of fringe “hairs” [67,82,83]. For three of the four whale species tested (fin, humpback, and right), mini-racks were compared using baleen from nine distinct spatial locations within the mouth (Figure 8): dorsal anterior (DA), mid-anterior (MA), ventral anterior (VA), dorsal central (DC), mid-central (MC), ventral central (VC), dorsal posterior (DP), mid-posterior (MP), and ventral posterior (VP). Results of fin and humpback whale baleen did not show significant differences between regions. Right whale baleen did show two clear trends, with slightly more plastic captured toward the dorsal (upper) and posterior region of the rack, and a slightly higher overall capture rate for the dorsal central region (Figure 8), but again, these were not statistically significant (p-value = 0.31).

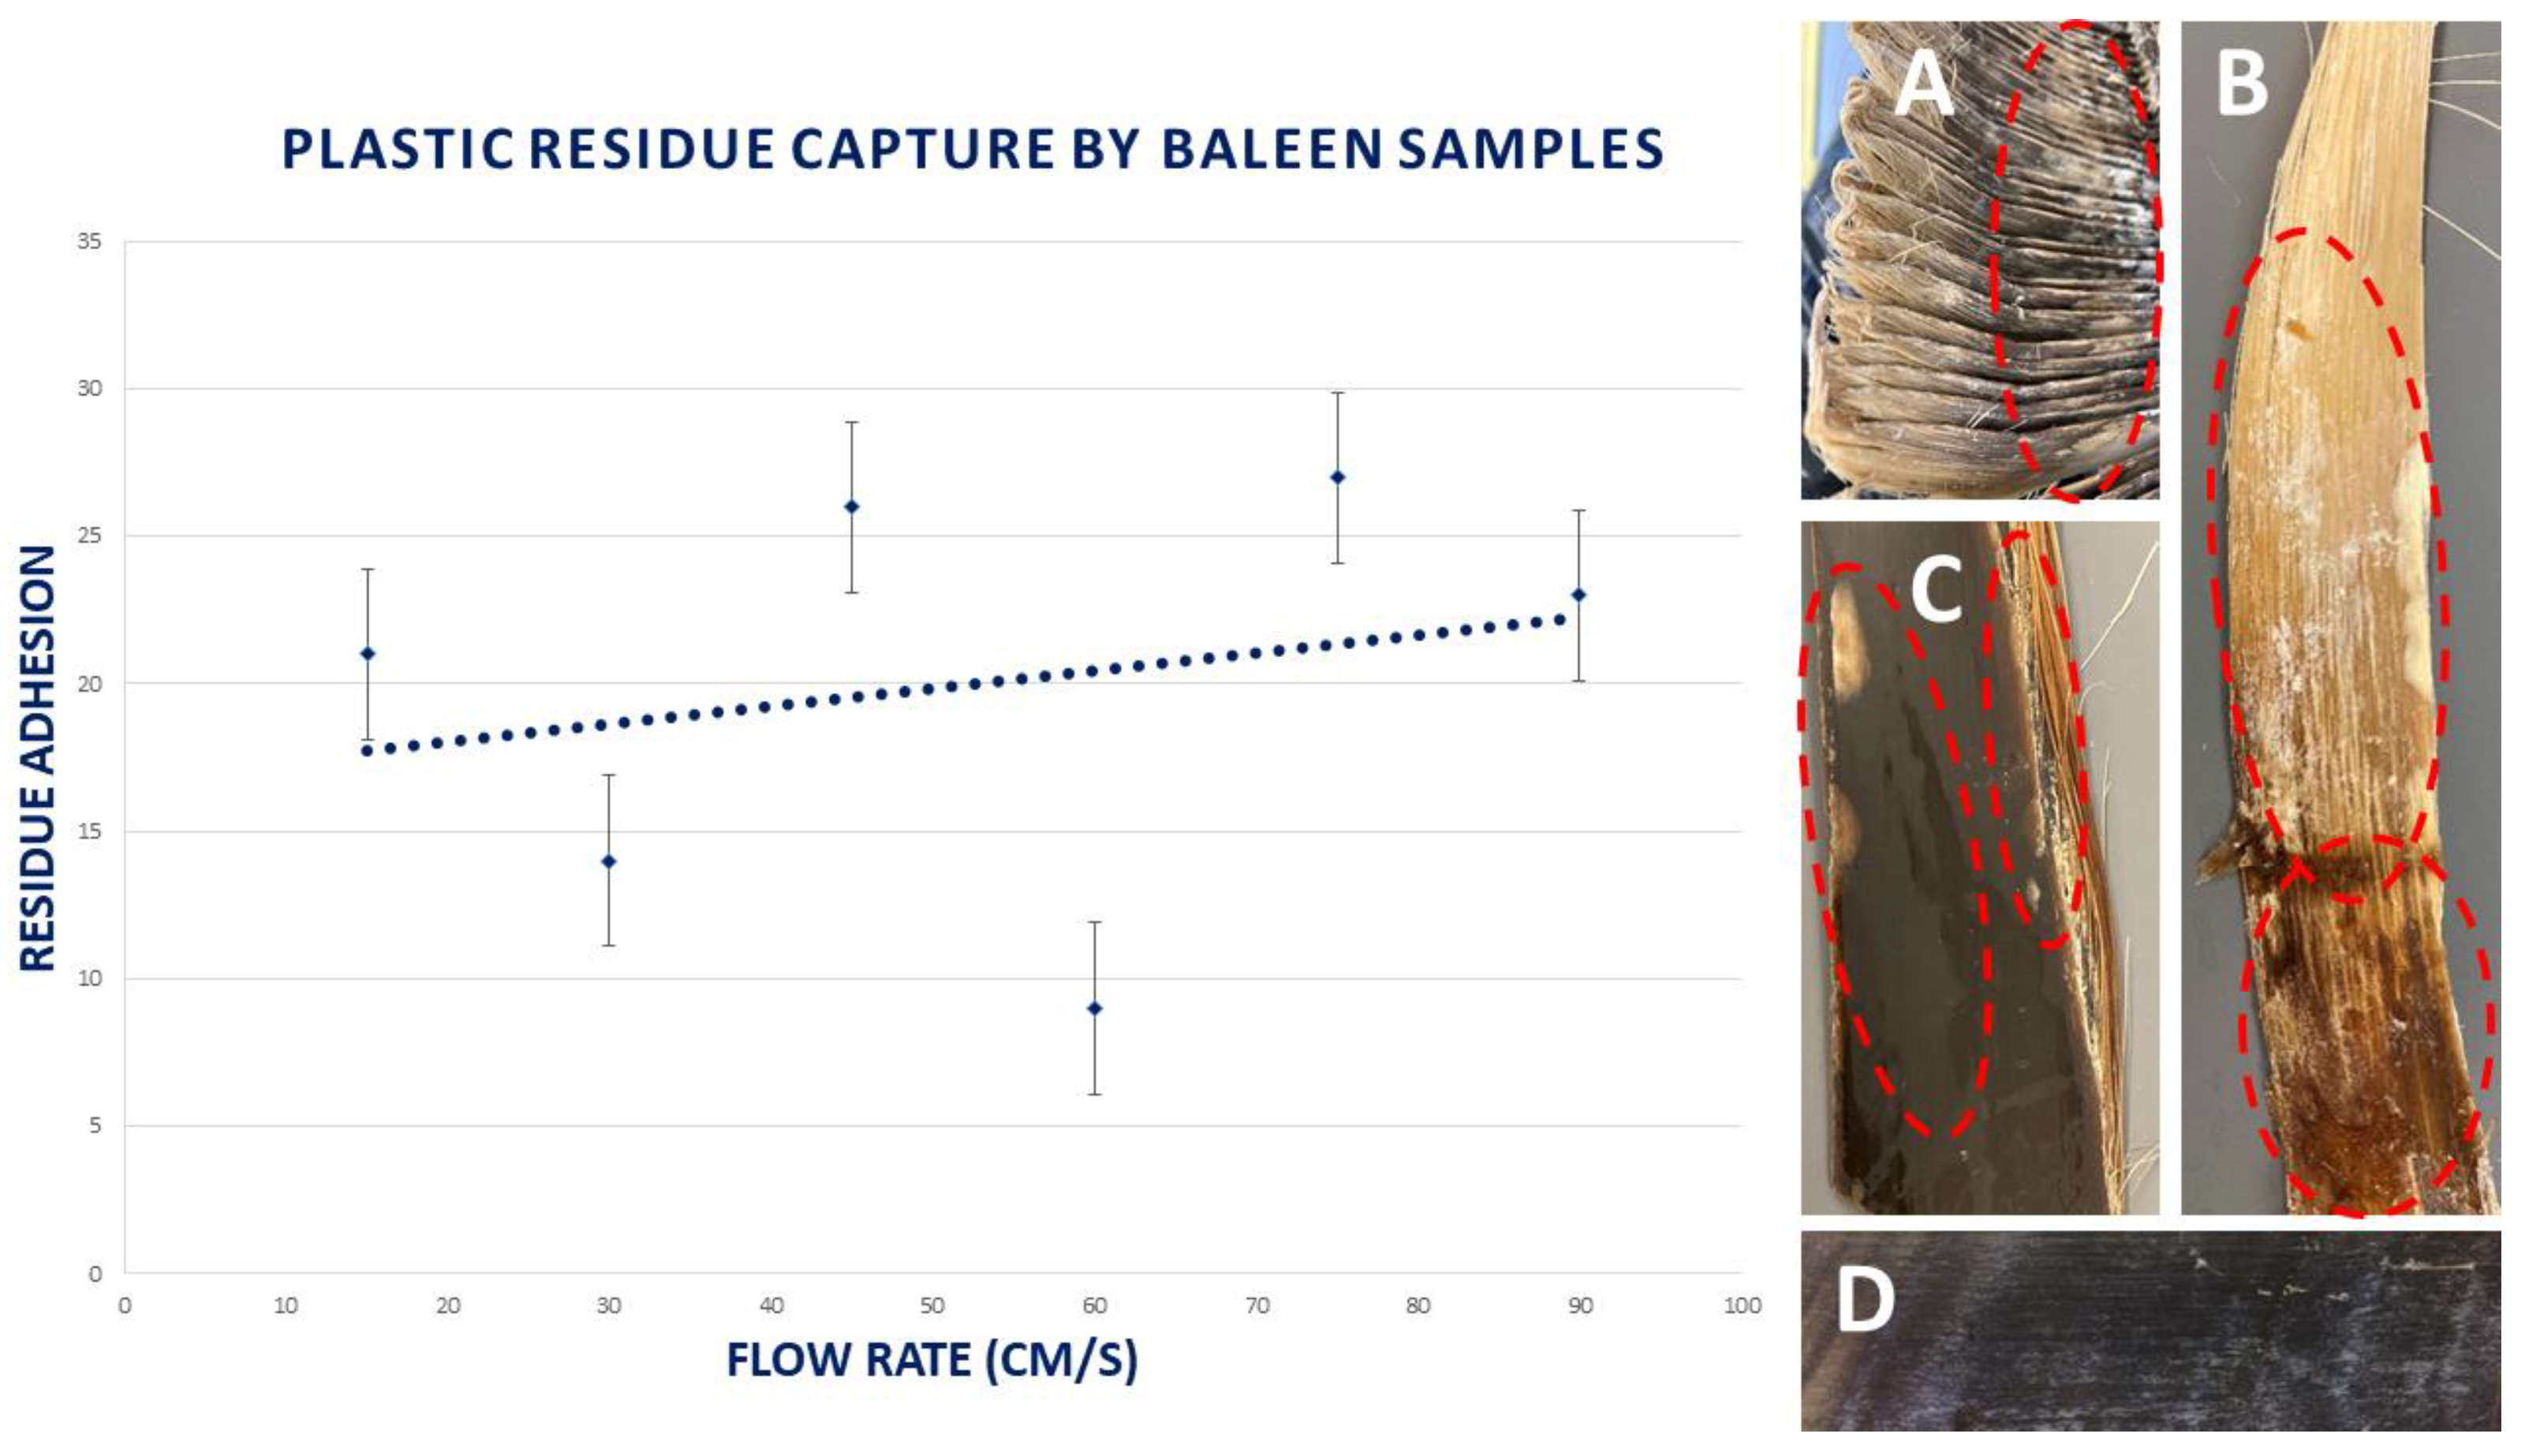
3.7. Capture of Plastic Residues

Trials to determine whether and how well baleen captured chemical residues leached from degraded and heated plastics confirmed that residues were captured by baleen from each of the four tested whale species. Residue capture was scored as the overall number of baleen surfaces (eight plates with two flat sides each, for 16 total sides) with adhering chemical residue as confirmed by observation in water or air following a 30-flow trial. Residue adherence ranged from 9–27 ± 3.5%, and there was a slight but insignificant trend toward higher capture at higher flow speeds (Figure 9), seen in all species (r = 0.27; p-value = 0.31). The residues appeared on baleen tissue as spots that were lightly or darkly discolored or iridescent (Figure 9). No species proved obviously better at capturing or adhering plastic residue. It initially appeared that humpback and right whale baleen had more residue, but upon closer review, it was deemed that this was likely an artifact from the baleen of each species initially having different colors and variably shiny or matte surfaces depending on the pigmentation of the flattened outer keratin layer [68].

3.8. Filter Bypass and Ingestion Rate Estimation

Plastic particulates not flowing cross-wise through baleen [81] or tangling within fringes bypass the filter and accumulate near the oropharynx for ingestion (Figure 1). Estimating such mass can be done via Equation (1), after inferring the value of Ntotal and fringe porosity at each baleen plate (Figure 8), a step that was not possible with the circulating flow setup used here. Estimating filter bypass fraction (Nbypass/Ntotal) at each plate can be achieved after considering likely values for porosity (φ~10–20%) [83], crossflow mass fraction (CCFF~0.3–0.5 without fringes [81] and <0.1 with fringes [82]), and the plastic-to-water mass ratio (ρparticles/ρwater; kg/m3 of plastic in the sample over kg/m3 of sample’s water.) Plastics encountered at densities of 10 or fewer particles per cubic meter [86] per Equation (1) would yield Nbypass/Ntotal~(1 + NCR)−1~0.74–0.86 at each station per Figure 4. Compounding particle capture effects of entanglement (“capture”) while moving posteriorly past three plates (Figure 8) would yield~0.83 = 0.51 of the mass arriving at the oropharynx (one of the scenarios considered in [40]). Obviously, entanglement increases clogging and reduces the total particles being ingested, but it also interferes with the crossflow prey–water separation process.

4. Discussion

4.1. Comparative Species Results

Analysis of flume results revealed that baleen of all tested mysticete species readily captured plastic pieces of all sizes, shapes, and types. This demonstrates that baleen’s ability to collect plastic pollution is a potentially major concern for fin, humpback, minke, and right whales, and, given the spread of results for all tested species, including error bars (Figure 4), very likely for all baleen whale species. Previous studies have suggested that the capture of plastic is a problem for filter feeders [31], but previous estimates of mysticete plastic ingestion [40] have focused on ingestion via trophic transfer. Our ongoing research confirms that baleen itself plays a prominent role in collecting plastic pollution, leading to direct ingestion (Figure 1).
In our study, right whale baleen captured slightly more small spherical pieces (microplastic beads) than baleen of other species, and humpback whale baleen captured slightly more macro- (5–25 mm) and mesoplastic (>25 mm) plastic fragments than baleen of other tested species, but these differences were not significant (Figure 4). Flow regimes also had no significant effects on plastic capture by baleen (Figure 5). However, recall that “capture” was defined as plastic pieces clinging to baleen for at least two seconds, and that in faster flows, pieces were more likely to be swept free from baleen. In life, such pieces might be briefly (<2 s) filtered from water and rapidly swept into the mouth, where they might pass unharmed through the gut (Figure 1), or, alternatively, where they might become impacted in the digestive tract or even absorbed (particularly in the case of small micro- and nanoplastics) and assimilated into bodily tissues [44]. Thus, our arbitrary definition of “capture” (with a two-second cutoff), although helpful for methodological purposes, might not be realistic for the real-world effects of plastic pollution in vivo. The issue of temporary capture of plastic debris via baleen leading to ingestion versus permanent capture leading to reduced functionality of the filter (or other impairment of foraging ability) is a focus of ongoing research. Nonetheless, our main conclusion is that all baleen is effective at capturing plastic, placing all mysticetes at risk.

4.2. Analysis of Diverse Plastic Pollutants

Baleen captured larger pieces of plastic debris more readily (Figure 5), although the above-mentioned caveat that smaller pieces might still be filtered from seawater into a whale’s mouth and then quickly released into the mouth means that plastics of all sizes probably pose risks to whales. However, our study suggests that plastics of all sizes pose different threats to baleen whales (Figure 10). Mesoplastics and smaller pieces pose a higher risk of being swallowed and potentially assimilated into bodily tissues. This is true whether tiny plastics are encountered directly or indirectly via trophic transfer (i.e., within bodies of ingested prey items). Larger macro- and mesoplastics are also at risk of being swallowed, where they are more likely than small debris items to become impacted within the digestive system (i.e., stomach chambers and sections of the small and large intestines). Pieces larger than mesoplastics would be too large to be swallowed given the narrow diameter of the esophageal opening [87]. However, meso- and macroplastics appear to pose the highest risk of filter clogging (Figure 10). Megaplastics (>1 m), the largest pieces of plastic debris, also (like smaller pieces) pose risks of clogging the filter and esophagus, but in addition, they carry further risks of body entanglement and temporary or permanent damage to individual baleen plates or an entire rack of baleen. All mysticetes are obligate filter feeders. However, megaplastics are unlikely to be found in schools of aggregating bulk prey. Even if plastic pieces do not enter a whale’s gut, they can, if captured by the baleen filter, still create major feeding-related problems (Figure 1) if they clog or damage the filter or if they impair motions of a whale’s jaws, head, or other body parts (such as the flippers, flukes, and tail stock) essential to locomotion or other feeding-related movements. Like clogging, entanglement and related deformation bending of baleen can create gaps within the filter, altering flow regimes and interfering with normal filtration and prey collection processes.
With regard to different shapes of plastics, we found that pieces of foam, irregularly shaped fragments, fibers, nurdles, and microbeads were all readily captured (in that descending order of frequency; Figure 6). Plastic resins of all types were captured easily (by baleen of all tested species), although polystyrenes and polyethylenes (both high- and low-density PE) were captured most frequently (Figure 7). This might be due to differential buoyancy: PS and PE tend to float, whereas PET and PVC (captured by baleen at lower rates) tend to sink. It is worth noting, with regard to potential baleen–plastic interactions, that PEs are the most commonly found plastic within the water column [88], and quite specifically where mysticetes commonly feed [40]. PEs and PP are known to drift long distances and are the most commonly found plastic at the surface [89]. Still, most consumer products are a blend of different plastic polymer types, along with numerous dyes and other chemical additives [90].
Our study also indicated that baleen obtained from all regions within a full rack, and thus from all regions of the mouth, captures plastic pieces (Figure 8). The precise directions, degrees, and forces of flow within the mouth during baleen bulk filtration are not entirely known; this remains an active area of investigation. However, it is crucial that no matter where within a whale’s mouth plastic is encountered—no matter where in the baleen filter it makes contact—there is a good chance the plastic will be indiscriminately filtered from water and may cause adverse impacts. Plastics are collected by baleen’s medial fringes (on the internal or lingual side of a rack) but also in spaces between plates. Clogging, entanglement, and damaged (e.g., bent) plates can occur throughout the entire baleen filter.
Whales can remove small, accumulated plastics from their baleen filter by shaking or nodding the head [74]. However, this would most likely cause released plastic debris to be swallowed, thereby trading one pathology for another. Further, larger pieces of clogging or entangled plastics cannot be removed from baleen by head shaking.
Balaenid (bowhead and right) whales are continuous skim feeders that use long (3+ m), finely-fringed baleen plates to separate and retain tiny (1–10 mm) copepods wherever they accumulate in dense patches, whether at the surface, near the bottom, or at mid-water depth [74]. The fine filter of these skimming whales [91,92] and long duration of filtration activity [92] put them at high risk of acquiring and ingesting tiny microbeads or other abundant plastic debris (Figure 4). Balaenids’ slow-speed, long-duration foraging behavior, often at or near the surface [67], also results in frequent entanglement with fishing gear or other ropes (Figure 10), which can quickly or slowly kill a whale or create lasting damage to its oral filter. In contrast, balaenopterid or rorqual (groove-throated) whales, including the fin, humpback, and minke species included in this study, normally feed on larger schooling fish or invertebrates, which are engulfed within a single mouthful via rapid gulping lunges at all depths [74]. Rorquals include the largest, most active whales, putting them at high risk of direct or indirect (trophic) ingestion of all kinds of plastic debris [40]. Although baleen of gray whales, Eschrichtius robustus, was not included in this experimental study, it has been documented [28] that gray whales are at high risk due to the fact that nearly all of their feeding involves suction-based ingestion of shallow-water coastal sediments, which are typically rich with nutritious benthic invertebrates but also where much plastic debris accumulates from riverine and coastal runoff.
Although biological risks attributable to chemical residues from the production and degradation of plastics are not yet clearly known [62,85], these residues are also captured or adhere to the alpha-keratin surfaces of baleen tissue (Figure 9). We suggest that these as of yet unknown risks might be substantial if, like plastic pieces, such chemical residues are swallowed, incorporated into whale tissues, ultimately clogging or impairing the baleen filter’s effectiveness, or otherwise affecting a whale’s behavior and foraging efficiency.

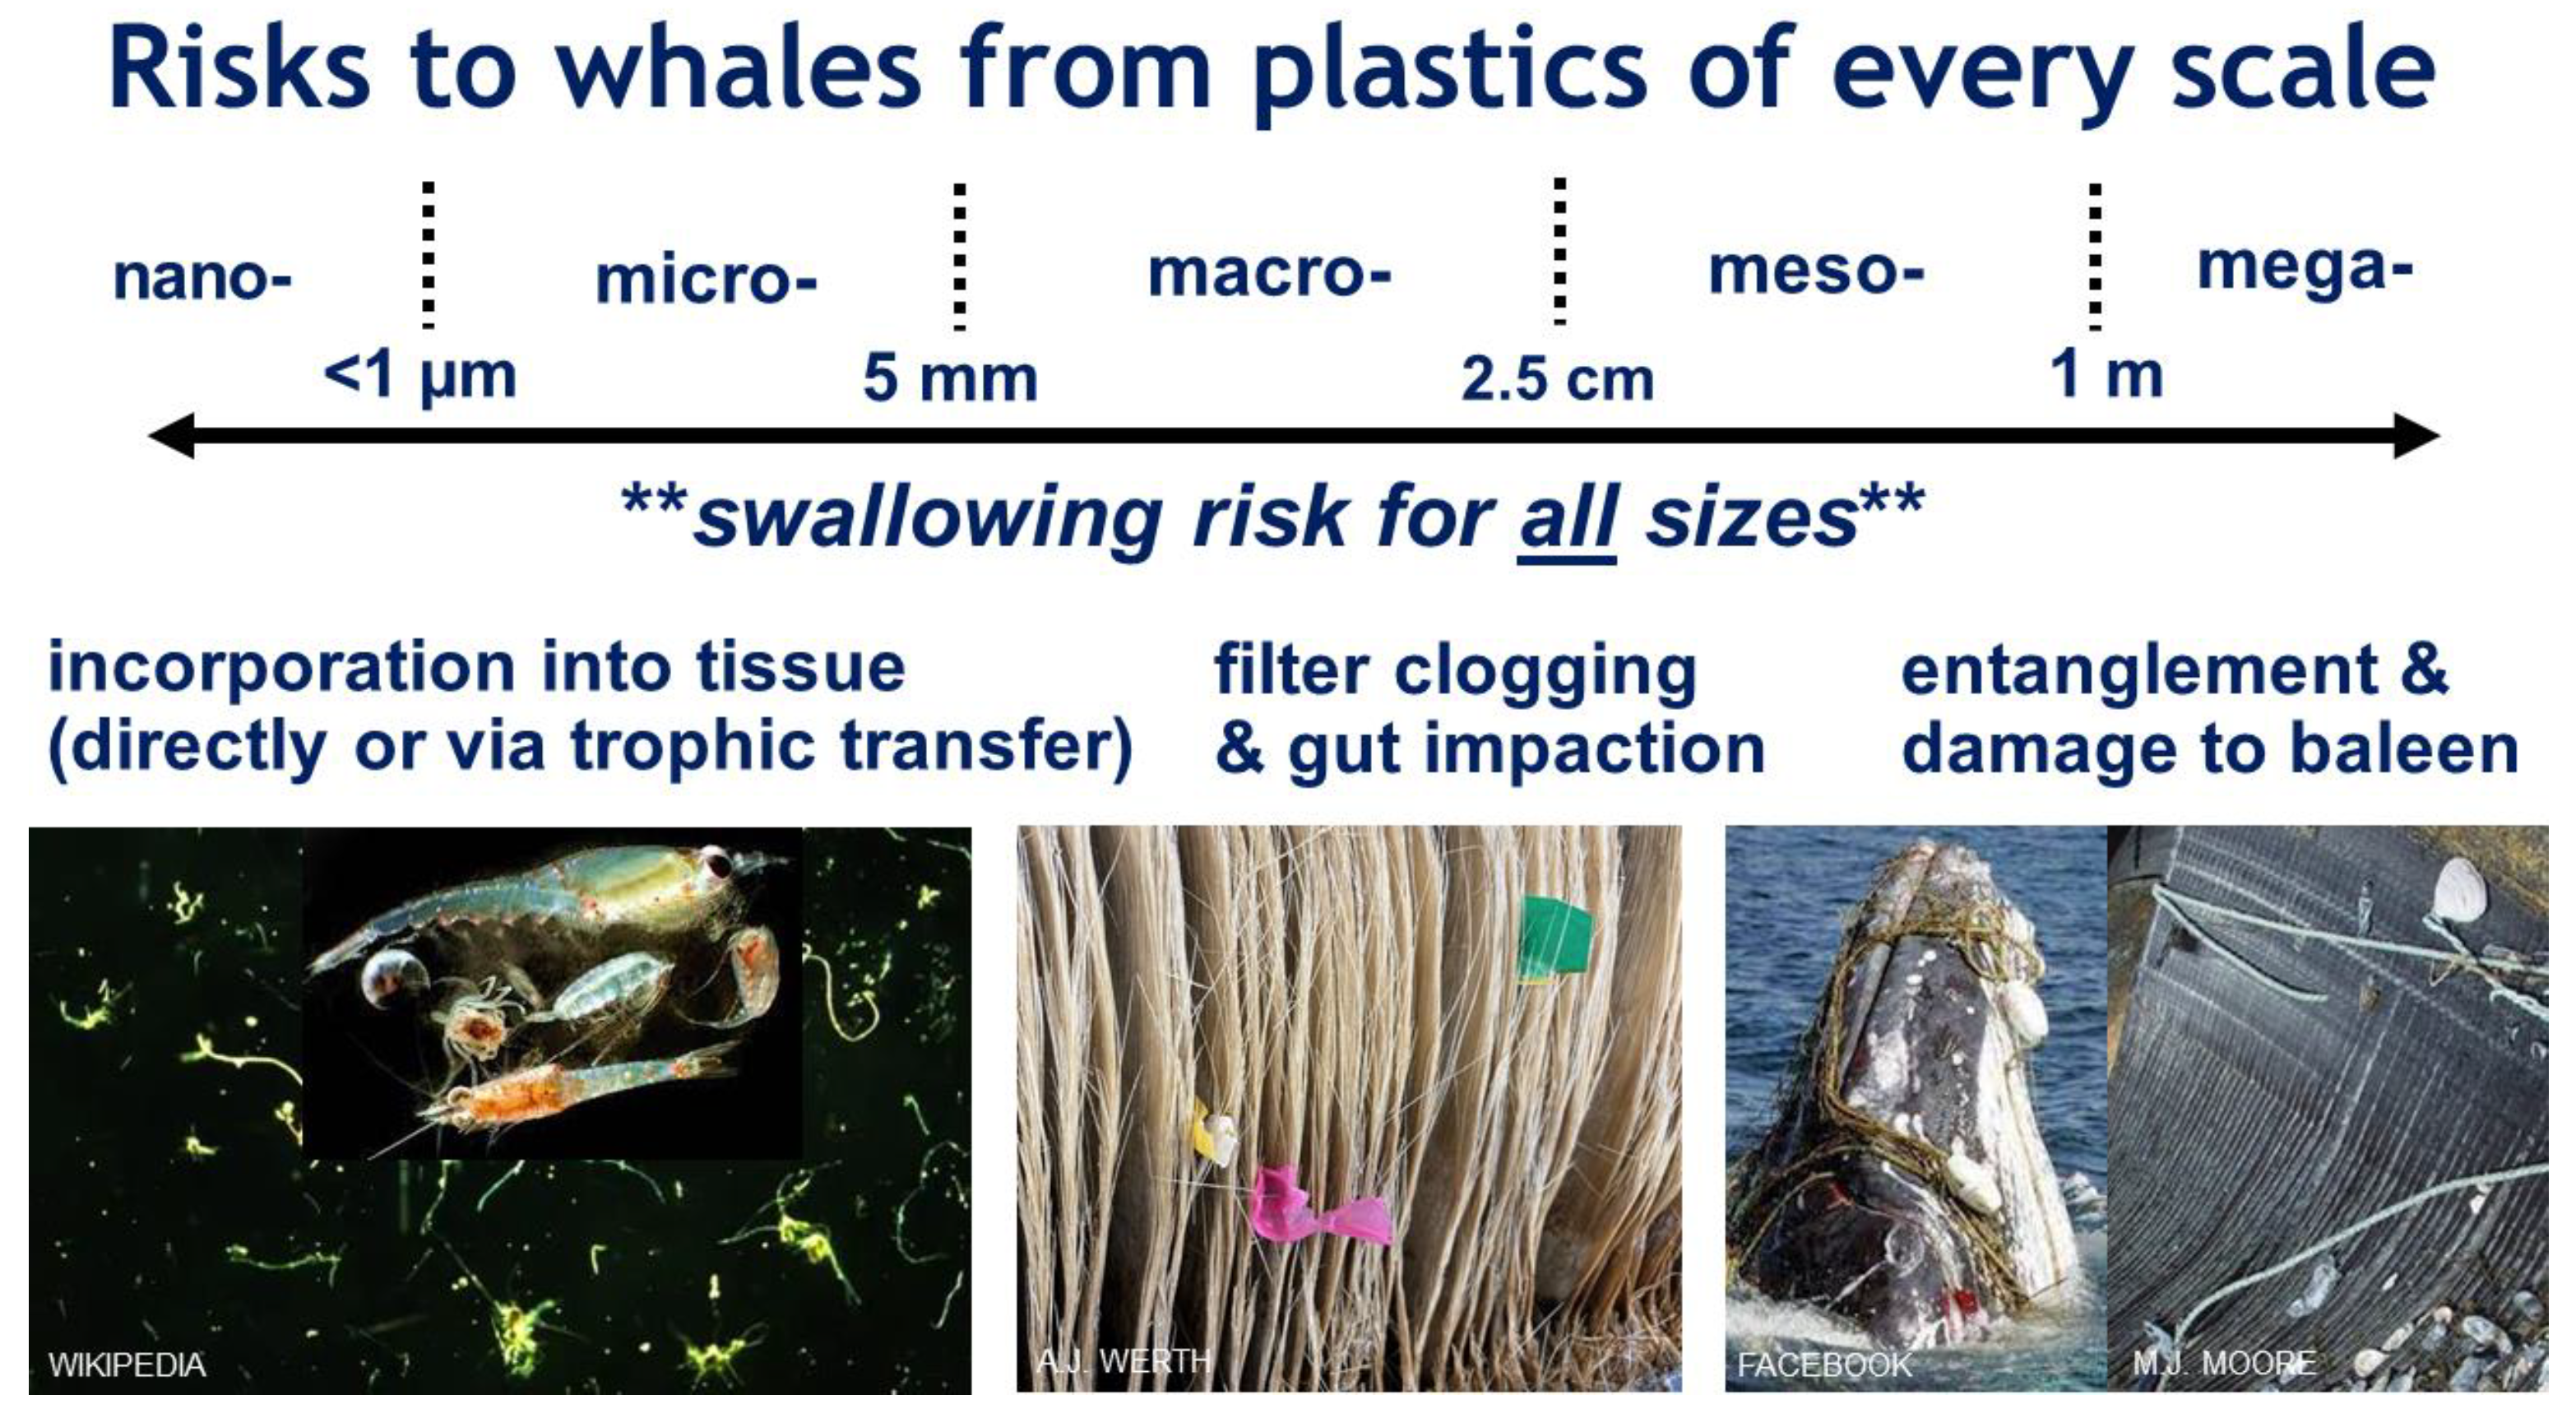
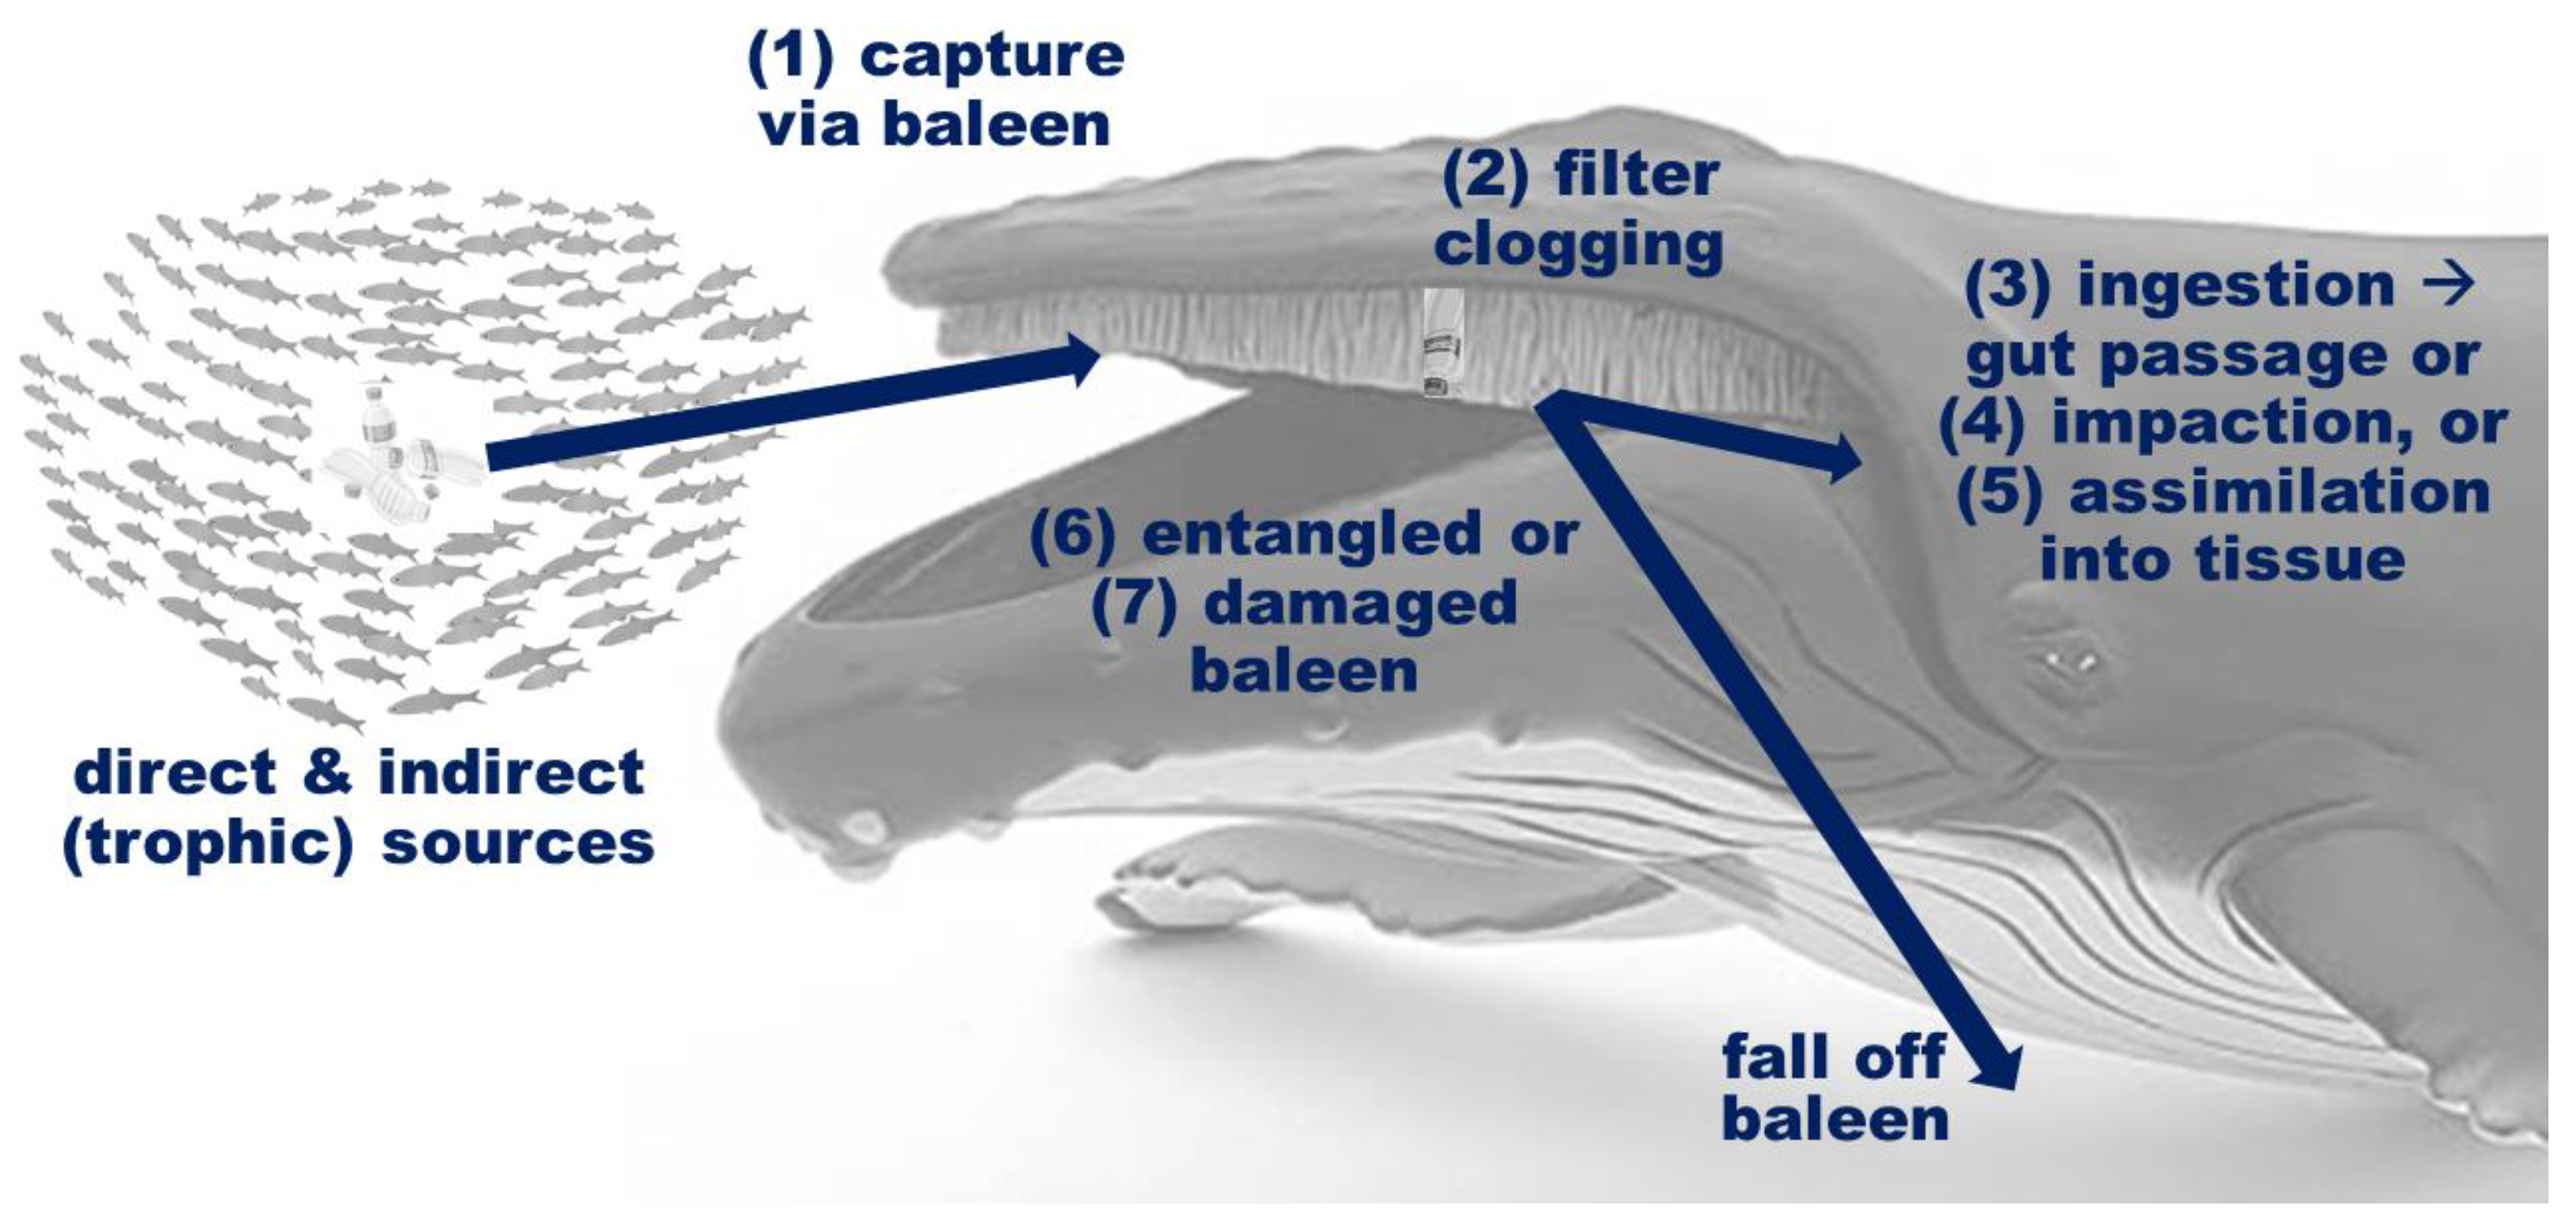
4.3. Risk Factors of Plastics for Various Cetacean Species

Kahane-Rapport et al. [40] calculated that whales consume up to ten million pieces of plastic per day—potentially trillions over the course of a lifetime. The risk of plastic ingestion for diverse whale species varies according to multiple parameters: ecological (e.g., feeding method, depth, and behavior), biogeographic (habitat and distribution), oceanographic and bathymetric (e.g., currents and gyres in marine circulation patterns), and other abiotic and biological factors, such as size and lifespan, not to mention differences in the baleen filter itself (number and dimensions of plates and eroded fringes, etc.).
Because odontocetes (toothed whales, dolphins, and porpoises) target individual food items, they can preferentially seek and ingest buoyant plastics that visually, acoustically, or chemically resemble prey (for example, plastic bags resembling salps or jellyfish), or that are simply located in regions where cetaceans habitually feed. Necropsies of stranded sperm, pilot, and beaked whales (and other odontocetes) have revealed numerous diverse plastics found lodged within the stomach chambers or intestines, including nets, ropes, and dozens of plastic bags. Plastic ingestion may be the primary cause of death or a major contributing factor. Once a cetacean ingests one such plastic item, it may come to regard other such items as food, starting a habit of ingesting plastics [9,10,11,12,45,46,47,48,49,50,51,52,53,54]. Further, whales that are sick or weakened may ingest plastics because they are less able to capture live prey, creating a vicious cycle of plastic ingestion [45]. The bulk filtration of mysticetes creates different risks than the precisely targeted feeding of odontocetes seeking individual items. The high volume of water filtered during foraging, whether continuous (as in balaenid skim feeding) or intermittent (as in lunge feeding of rorquals or suction ingestion of gray whales), poses another major risk factor for baleen whales relative to toothed whales. The experimental study reported here outlined slightly different yet overall largely similar risks to varying whale species due to their particular type of baleen tissue.
Plastic, like prey, is not randomly distributed in the ocean. Unfortunately, the same oceanographic forces that aggregate the prey species of whales also aggregate plastic pollutants, often in the same locations. Because foraging is energetically expensive, whales and other marine organisms seek to maximize caloric intake while minimizing energy expenditure when locating and acquiring food. For this reason, they seek densely concentrated aggregations of zooplankton or schooling fish, which often form at current fronts or other interfaces created by currents and gyres. These frequently attract larger organisms such as forage fish, which, in turn, attract whales. Further, many organisms have been shown to be actively attracted to chemicals within or leached by plastics [33,34,35], some of which appear to be similar to dimethyl sulfide (DMS). This common organosulfur compound produces the characteristic “seafood odor”, which is apparently a key attractant for many foraging marine species, including whales [36,37]. For these reasons, marine plastic debris accumulates, both freely within seawater and eventually inside bodies of small organisms that whales feed on, by means and in locations that attract whales and promote ingestion by whales. In short, the factors that enable plastics to accumulate non-randomly in marine habitats are the very same factors that play key roles in whale feeding. Whether whales encounter plastics via trophic transfer from schooling krill, copepods, or forage fish they eat, or from freely floating or submerged plastic particles that are indiscriminately filtered by the intraoral baleen tissue, all cetaceans have a high probability of locating and ingesting plastic. Oral “play” with plastics, as documented in many cetacean species [93], further increases risks of ingestion and entanglement.
Nonetheless, recent studies have reported that the vast majority (>90%) of plastic ingested by baleen whales is due to trophic transfer [27,40], thus bypassing the role of baleen capture in this process. Consequently, we believe that focusing on regions of overlap between mysticete feeding grounds and extreme levels of water-bound plastics shows where our findings could be most relevant and applicable to inform risk assessments. We consider highly polluted regions first, then identify species that frequent these heavily contaminated waters.
In the open ocean, the highest densities of plastic occur in oligotrophic subtropical gyres [94,95]. Although mysticetes traverse these regions on their seasonal migrations, they are unlikely to do much foraging while there. However, there are sedentary populations in regions with exceptionally high plastic pollution that may be at threat. A prime example involves resident fin whales in the Mediterranean Sea, a region that has among the highest plastic debris densities anywhere on Earth [96]. As a result, this fin whale population has already been suggested as a bioindicator of plastic pollution in the Mediterranean Sea [97]. In Southeast Asian waters, Eden’s whales (B. edeni) and the little-known Omura’s whale (B. omurai) face threats because this region has the highest rates of plastic discharge to the nearshore marine environment anywhere on the planet [98]. Indian Ocean blue whales (B. musculus indica) spend their entire lives in the tropical and subtropical Indian Ocean [99], which in addition to having an emerging plastic gyre [100,101], also has a rapidly expanding human population on all sides of the basin. In other words, plastic pollution–wildlife interactions in this region are likely to worsen. Fin and common minke whales that inhabit the Yellow and East China Seas are also at risk for the same reasons [56]. The highly endangered Rice’s whale (B. ricei) in the Gulf of Mexico should also be monitored as well; the holotype specimen was killed by an ingested plastic fragment that perforated its intestine [102].

4.4. Reducing and Mitigating Threats to Baleen-Filtering Whales from Plastic Pollution

Threats to whales and other marine life from plastic pollution, both primary and secondary (i.e., broken or degraded pieces from a larger original source), have been increasingly publicized. This includes plastic ingestion directly from the water column and trophic transfer. Many solutions have been proposed, but two simple solutions are ultimately most likely to reduce the threat. First, more empirical research is needed about baleen–plastic interactions and effects, from filter clogging to swallowing and incorporation within bodily tissues. Second, plastic flow into the sea should be addressed by focusing less on recycling and cleanup, and more on halting new plastic production, use, and environmental entry. Many small- and large-scale efforts are underway to ascertain the scope of the marine plastic pollution problem and develop effective strategies to mitigate it. However, as many scientists and environmentalists have pointed out, the best strategy is to prevent new plastics from reaching the sea via rivers and wastewater treatment centers, perhaps by using lightweight degradable “sponges” [103] or bioinspired filters based on whale baleen [67].
In what is surely one of history’s most heartbreaking ironies, prior to the twentieth century, the role of modern plastics was held by baleen [104]. Baleen’s exceptional tensile strength and pliant flexibility made it an ideal material for corset stays, buggy whips, skirt hoops, umbrella ribs, and mechanical or kitchen implements [105]. Baleen’s value during the era of industrial whaling peaked in 1853, with over 5.6 million pounds, mostly from North Atlantic right whales, sold in U.S. ports for almost $2,000,000 [64]. Centuries if not millennia earlier, native subsistence hunters fashioned baleen into baskets, armor, weapons, implements, and varied pieces of artwork [105]. Like later whalers, indigenous peoples appreciated baleen’s plastic-like properties, namely its tough pliability, resistance to degradation, and ease of shaping into various useful forms.
Plastics currently comprise 83% of ocean trash [106], most of it in the form of microplastics (beads/cosmetics, clothing fibers, nurdle resin pellets, and secondary fragments), macroplastics (mainly single-use food wrappers, bags, bottles and caps, utensils, straws and stirrers, and cigarette filters), and megaplastics (fishing lines, nets, floats, and traps). There is also dawning awareness of the immense scope of microplastic debris (in air and on land, but ultimately migrating to marine habitats) from regular use and frictional erosion of vehicle tires [107]. In the near future, society’s planned plastic production is estimated to outpace all planned mitigation efforts to reduce its flux in the environment. Therefore, marine plastic pollution will continue to worsen [108]. Recycling is insufficient to tackle this challenge; reducing and reusing plastics will have a far greater impact [109]. Although science and technology can alleviate the problem by fueling the development and use of photo- and biodegradable polymers or other new materials [110,111,112], these advances will not address the overwhelming amounts of plastic already in the environment, nor in the bodies of whales and other sea life. Scientists and activists have long speculated that the oral baleen filter, which served Mysticeti so favorably as a key innovation in their evolutionary radiation, could now present a major drawback by aggregating and ingesting anthropogenic pollutants, and thus serve as an evolutionary trap in the Anthropocene. To ensure whales’ survival, we must better understand precisely how their baleen functions as we simultaneously work to eliminate plastics from their environment.

Author Contributions

Project conceptualization, A.J.W., S.R.K.-R., J.P., J.A.G. and M.S.S.; flow experiments, A.J.W.; data collection and curation, A.J.W.; data analysis, A.J.W., S.R.K.-R., J.P. and M.S.S.; draft writing and figure preparation, A.J.W.; draft editing and supervision, A.J.W., S.R.K.-R., J.P., J.A.G. and M.S.S. All authors have read and agreed to the published version of the manuscript.

Funding

MSS received funding from the National Science Foundation (PRFB 1906332) and the National Geographic Society (EC-53352R-18).

Institutional Review Board Statement

Ethical review and approval were waived for this study due to the fact that no live animals were used. No animals were harmed for this study. All baleen specimens were obtained from adult animals that died naturally and were procured by certified stranding networks in accordance with MMPA and other applicable statutes.

Data Availability Statement

The data presented in this study are available upon request from the corresponding author. The data are not publicly available because they remain in use by the authors.

Acknowledgments

We are grateful to the many biologists and staff supervisors who facilitated the collection and transfer of the baleen tissues, and for approving associated permit requests. Irvin Robertson expertly constructed the flow tank, following a general design by Steve Vogel. We thank many scientists for the helpful discussions on whales, filtration, and plastic pollution, especially Dave Cade, Peter van de Graaf, Peter Madsen, Shemar Blakeney, Adrian Cothren, Didier Buston, Bertrand Denis, Olivier Adam, Coralie Barber, Katie Register, Joy Reidenberg, Todd Sformo, Michael Moore, and Craig George.

Conflicts of Interest

The authors declare no conflicts of interest.

References

  1. Gallo, F.; Fossi, C.; Weber, R.; Santillo, D.; Sousa, J.; Ingram, I.; Nadal, A.; Romano, D. Marine litter plastics and microplastics and their toxic chemicals components: The need for urgent preventive measures. Environ. Sci. Eur. 2018, 30, 13. [Google Scholar] [CrossRef]
  2. Brown, E.; MacDonald, A.; Allen, S.; Allen, D. The potential for a plastic recycling facility to release microplastic pollution and possible filtration remediation effectiveness. J. Hazard. Mater. Adv. 2023, 10, 100309. [Google Scholar] [CrossRef]
  3. GESAMP (IMO/FAO/UNESCO-IOC/UNIDO/WMO/IAEA/UN/UNEP/UNDP/ISA Joint Group of Experts on the Scientific Aspects of Marine Environmental Protection). Guidelines for the monitoring and assessment of plastic litter and microplastics in the ocean. In GESAMP Reports & Studies Series; Kershaw, P.J., Turra, A., Galgani, F., Eds.; GESAMP: London, UK, 2019; Volume 99, 130p, ISSN 1020-4873. [Google Scholar]
  4. Bucci, K.; Tulio, M.; Rochman, C.M. What is known and unknown about the effects of plastic pollution: A meta-analysis and systematic review. Ecol. Appl. 2020, 30, e02044. [Google Scholar] [CrossRef]
  5. Gregorietti, M.; Atzori, F.; Carosso, L.; Frau, F.; Pellegrino, G.; Sarà, G.; Arcangeli, A. Cetacean presence and distribution in the central Mediterranean Sea and potential risks deriving from plastic pollution. Mar. Pollut. Bull. 2021, 173, 112943. [Google Scholar] [CrossRef]
  6. Koelmans, A.A.; Redondo-Hasselerharm, P.E.; Nor, N.H.M.; de Ruijter, V.M.; Mintenig, S.M.; Kooi, M. Risk assessment of microplastic particles. Nat. Rev. Mater. 2022, 7, 138–152. [Google Scholar] [CrossRef]
  7. Law, K.L. Plastics in the marine environment. Annu. Rev. Mar. Sci. 2017, 9, 205–229. [Google Scholar] [CrossRef] [PubMed]
  8. MacLeod, M.; Arp, H.P.H.; Tekman, M.B.; Jahnke, A. The global threat from plastic pollution. Science 2021, 373, 61–65. [Google Scholar] [CrossRef]
  9. Panti, C.; Baini, M.; Lusher, A.; Hernandez-Milan, G.; Bravo Rebolledo, E.L.; Unger, B.; Syberg, K.; Simmonds, M.K.; Fossi, M.C. Marine litter: One of the major threats for marine mammals. Environ. Pollut. 2019, 247, 72–79. [Google Scholar] [CrossRef]
  10. Santos, R.G.; Machovsky-Capuska, G.E.; Andrades, R. Plastic ingestion as an evolutionary trap: Toward a holistic understanding. Science 2021, 373, 56–60. [Google Scholar] [CrossRef] [PubMed]
  11. Fossi, M.C.; Baini, M.; Simmonds, M.P. Cetaceans as ocean health indicators of marine litter impact at global scale. Front. Environ. Sci. 2020, 8, 586627. [Google Scholar] [CrossRef]
  12. Scacco, U.; Mancini, E.; Marcucci, F.; Tiralongo, F. Microplastics in the deep: Comparing dietary and plastic ingestion data between two Mediterranean bathyal opportunistic feeder species, Galeus melastomus, Rafinesque 1810 and Coelorinchus caelorhincus, Risso 1810, through stomach content analysis. J. Mar. Sci. Eng. 2022, 10, 624. [Google Scholar] [CrossRef]
  13. Jacob, H.; Besson, M.; Swarzenski, P.W.; Lecchini, D.; Metian, M. Effects of virgin micro- and nano-plastics on fish: Trends, meta-analysis and perspectives. Environ. Sci. Technol. 2020, 54, 4733–4745. [Google Scholar] [CrossRef] [PubMed]
  14. Bergmann, M.; Allen, S.; Krumpen, T.; Allen, D. High levels of microplastics in the Arctic sea ice alga Melosira arctica, a vector to ice-associated and benthic food webs. Environ. Sci. Technol. 2023, 57, 6799–6807. [Google Scholar] [CrossRef] [PubMed]
  15. Gopinath, P.M.; Twayana, K.S.; Ravanan, P.; Thomas, J.; Mukherjee, A.; Jenkins, D.F.; Chandrasekharan, N. Prospects on the nano-plastic particles internalization and induction of cellular response in human keratinocytes. Part. Fibre Toxicol. 2021, 18, 35. [Google Scholar] [CrossRef] [PubMed]
  16. Eriksen, M.; Cowger, W.; Erdle, L.M.; Coffin, S.; Villarrubia-Gómez, P.; Moore, C.J.; Carpenter, E.J.; Day, R.H.; Thiel, M.; Wilcox, C. A growing plastic smog, now estimated to be over 170 trillion plastic particles afloat in the world’s oceans—Urgent solutions required. PLoS ONE 2023, 18, e0281596. [Google Scholar] [CrossRef] [PubMed]
  17. Zettler, E.R.; Mincer, T.J.; Amaral-Zettler, L.A. Life in the “plastisphere: Microbial communities on plastic marine debris. Environ. Sci. Technol. 2013, 47, 7137–7146. [Google Scholar] [CrossRef] [PubMed]
  18. Kaandorp, M.L.A.; Lobelle, D.; Kehl, C.; Dijkstra, H.A.; van Sebille, E. Global mass of buoyant marine plastics dominated by large long-lived debris. Nat. Geosci. 2023, 16, 689–694. [Google Scholar] [CrossRef]
  19. Lu, Y.; Zhang, Y.; Deng, Y.; Jiang, W.; Zhao, Y.; Geng, J.; Ding, L.; Ren, H. Uptake and accumulation of polystyrene microplastics in zebrafish (Danio rerio) and toxic effects in liver. Environ. Sci. Technol. 2016, 50, 4054–4060. [Google Scholar] [CrossRef]
  20. Barboza, L.G.A.; Lopes, C.; Oliveira, P.; Bessa, F.; Otero, V.; Henriques, B.; Raimundo, J.; Caetano, M.; Vale, C.; Guilhermino, L. Microplastics in wild fish from North East Atlantic Ocean and its potential for causing neurotoxic effects, lipid oxidative damage, and human health risks associated with ingestion exposure. Sci. Total Environ. 2020, 717, 134625. [Google Scholar] [CrossRef]
  21. Ramsperger, A.F.R.M.; Narayana, V.K.B.; Gross, W.; Mohanraj, J.; Thalakkat, M.; Greiner, A.; Schmalz, H.; Kress, H.; Laforsch, C. Environmental exposure enhances the internalization of microplastic particles into cells. Sci. Adv. 2020, 6, eabd1211. [Google Scholar] [CrossRef]
  22. Lear, L.; Padfield, D.; Dowsett, T.; Jones, M.; Kay, S.; Hayward, A.; Vos, M. Bacterial colonisation dynamics of household plastics in a coastal environment. Sci. Total Environ. 2022, 838, 156199. [Google Scholar] [CrossRef]
  23. Focardi, A.; Moore, L.R.; Raina, J.B.; Seymour, J.R.; Paulsen, I.T.; Tetu, S.G. Plastic leachates impair picophytoplankton and dramatically reshape the marine microbiome. Microbiome 2022, 10, 179. [Google Scholar] [CrossRef]
  24. Fackelmann, G.; Pham, C.K.; Rodríguez, Y.; Mallory, M.L.; Provencher, J.F.; Baak, J.E.; Sommer, S. Current levels of microplastic pollution impact wild seabird gut microbiomes. Nat. Ecol. Evol. 2023, 7, 698–706. [Google Scholar] [CrossRef] [PubMed]
  25. Ryan, P.G. Ingestion of plastics by marine organisms. In Hazardous Chemicals Associated with Plastics in the Marine Environment, The Handbook of Environmental Chemistry; Takada, H., Karapanagioti, H., Eds.; Springer: Cham, Switzerland, 2016; Volume 78, pp. 235–266. [Google Scholar] [CrossRef]
  26. Gove, J.M.; Whitney, J.L.; McManus, M.A.; Williams, G.J. Prey-size plastics are invading larval fish nurseries. Proc. Natl. Acad. Sci. USA 2019, 116, 24143–24149. [Google Scholar] [CrossRef] [PubMed]
  27. Zantis, L.J.; Bosker, T.; Lawler, F.; Nelms, S.E.; O’Rorke, R.; Constantine, R.; Sewell, M.; Carroll, E.L. Assessing microplastic exposure of large marine filter feeders. Sci. Total Environ. 2022, 818, 121815. [Google Scholar] [CrossRef] [PubMed]
  28. Torres, L.G.; Brander, S.M.; Parker, J.I.; Bloom, E.M.; Norman, R.; Van Brocklin, J.E.; Lasdin, K.S.; Hildebrand, L. Zoop to poop: Assessment of microparticle loads in gray whale zooplankton prey and fecal matter reveal high daily consumption rates. Front. Mar. Sci. 2023, 10, 1201078. [Google Scholar] [CrossRef]
  29. Allen, A.S.; Seymour, A.C.; Rittschof, D. Chemoreception drives plastic consumption in a hard coral. Mar. Pollut. Bull. 2017, 124, 198–205. [Google Scholar] [CrossRef] [PubMed]
  30. Savoca, M.S.; Tyson, C.W.; McGill, M.; Slager, C.J. Odours from marine plastic debris induce food search behaviours in a forage fish. Proc. Roy. Soc. B 2017, 284, 20171000. [Google Scholar] [CrossRef] [PubMed]
  31. Germanov, E.S.; Marshall, A.D.; Bejder, L.; Fossi, M.C.; Lonergan, N.R. Microplastics: No small problem for filter-feeding megafauna. Trends Ecol. Evol. 2018, 33, 227–232. [Google Scholar] [CrossRef]
  32. Axworthy, J.B.; Padilla-Gamiño, J.L. Microplastics ingestion and heterotrophy in thermally stressed corals. Sci. Rep. 2019, 9, 18193. [Google Scholar] [CrossRef] [PubMed]
  33. Pfaller, J.B.; Goforth, K.M.; Gil, M.A.; Savoca, M.S.; Lohmann, K.J. Odors from marine plastic debris elicit foraging behavior in sea turtles. Curr. Biol. 2020, 30, R213–R214. [Google Scholar] [CrossRef] [PubMed]
  34. Procter, J.; Hopkins, F.E.; Fileman, E.S.; Lindeque, P.K. Smells good enough to eat: Dimethyl sulfide (DMS) enhances copepod ingestion of microplastics. Mar. Pollut. Bull. 2019, 138, 1–6. [Google Scholar] [CrossRef] [PubMed]
  35. Savoca, M.S.; Wihlfeil, M.E.; Ebeler, S.E.; Nevitt, G.A. Marine plastic debris emits a keystone info chemical for olfactory foraging seabirds. Sci. Adv. 2016, 2, e1600395. [Google Scholar] [CrossRef] [PubMed]
  36. Savoca, M.S.; Nevitt, G. Evidence that dimethyl sulfide facilitates a tritrophic mutualism between marine primary producers and top predators. Proc. Natl. Acad. Sci. USA 2014, 111, 4157–4161. [Google Scholar] [CrossRef] [PubMed]
  37. Bouchard, B.; Barnagaud, J.-Y.; Poupard, M.; Glotin, H.; Gauffier, P.; Torres Ortiz, S.; Lisney, T.J.; Campagna, S.; Rasmussen, M.; Célérier, A. Behavioural responses of humpback whales to food-related chemical stimuli. PLoS ONE 2019, 14, e0212515. [Google Scholar] [CrossRef]
  38. Burkhardt-Holm, P.; N’Guyen, A. Ingestion of microplastics by fish and other prey organisms of cetaceans, exemplified for two large baleen whale species. Mar. Pollut. Bull. 2019, 144, 224–234. [Google Scholar] [CrossRef] [PubMed]
  39. Alava, J.J. Modeling the bioaccumulation and biomagnification potential of microplastics in a cetacean foodweb of the Northeastern Pacific: A prospective tool to assess the risk exposure to plastic particles. Front. Mar. Sci. 2020, 7, 566101. [Google Scholar] [CrossRef]
  40. Kahane-Rapport, S.R.; Czapanskiy, M.F.; Fahlbusch, J.A.; Friedlaender, A.S.; Calambokidis, J.; Hazen, E.L.; Goldbogen, J.A.; Savoca, M.S. Field measurements reveal exposure risk to microplastic ingestion by filter-feeding megafauna. Nat. Commun. 2022, 13, 6327. [Google Scholar] [CrossRef]
  41. Zantis, L.J.; Carroll, E.L.; Nelms, S.E.; Bosker, T. Marine mammals and microplastics: A systematic review and call for standardization. Environ. Pollut. 2021, 269, 116142. [Google Scholar] [CrossRef]
  42. Eisfeld-Pierantonio, S.M.; Pierantonio, N.; Simmonds, M.P. The impact of marine debris on cetaceans with consideration of plastics generated by the COVID-19 pandemic. Environ. Pollut. 2022, 300, 118967. [Google Scholar] [CrossRef]
  43. Kruse, K.; Knickmeier, K.; Brennecke, D.; Unger, B.; Siebert, U. Plastic Debris and Its Impacts on Marine Mammals. In Marine Mammals; Brennecke, D., Knickmeier, K., Pawliczka, I., Siebert, U., Wahlberg, M., Eds.; Springer: Cham, Switzerland, 2023; pp. 49–62. [Google Scholar] [CrossRef]
  44. Merrill, G.B.; Hermabessiere, L.; Rochman, C.M.; Nowacek, D.P. Microplastics in marine mammal blubber, melon, & other tissues: Evidence of translocation. Environ. Pollut. 2023, 335, 122252. [Google Scholar] [CrossRef]
  45. Tarpley, R.J.; Marwitz, S. Plastic ingestion by cetaceans along the Texas coast: Two case reports. Aquat. Mamm. 1993, 19, 93–98. [Google Scholar]
  46. de Stephanis, R.; Giménez, J.; Carpinelli, E.; Gutierrez-Exposito, C.; Cañadas, A. As main meal for sperm whales: Plastics debris. Mar. Pollut. Bull. 2013, 69, 206–214. [Google Scholar] [CrossRef]
  47. Brentano, R.; Petry, M.V. Marine debris ingestion and human impacts on the pygmy sperm whale (Kogia breviceps) in southern Brazil. Mar. Pollut. Bull. 2020, 150, e110595. [Google Scholar] [CrossRef] [PubMed]
  48. Tonay, A.M.; Öztürk, A.A.; Salman, A.; Dede, A.; Danyer, I.A.; Danyer, E.; Öztürk, B. Stranding records of sperm whale (Physeter macrocephalus) on the Turkish coast in 2019-2020 with a note on the opportunistic sampling of stomach content. J. Black Sea/Mediterr. Environ. 2021, 27, 281–293. [Google Scholar]
  49. Moore, R.C.; Loseto, L.; Noel, M.; Etemadifar, A.; Brewster, J.D.; MacPhee, S.; Bendell, L.; Ross, P.S. Microplastics in beluga whales (Delphinapterus leucas) from the Eastern Beaufort Sea. Mar. Pollut. Bull. 2020, 150, 110723. [Google Scholar] [CrossRef] [PubMed]
  50. Secchi, E.R.; Zarzur, S. Plastic debris ingested by a Blainville’s beaked whale, Mesoplodon densirostris, washed ashore in Brazil. Aquat. Mamm. 1999, 25, 21–24. [Google Scholar]
  51. Lusher, A.L.; Hernandez-Milian, G.; O’Brien, J.; Berrow, S.; O’Connor, I.; Officer, R. Microplastic and microplastic ingestion by a deep diving, oceanic cetacean: The True’s beaked whale Mesoplodon mirus. Environ. Pollut. 2015, 199, 185–191. [Google Scholar] [CrossRef] [PubMed]
  52. Abreo, N.A.S.; Macusi, E.D.; Blatchley, D.D.; Cuenca-Ocay, G.C. First evidence of plastic ingestion by the rare Deraniyagala’s beaked whale. Int. J. Ecol. Cons. 2016, 19, 16–36. [Google Scholar]
  53. Kelly, N.E.; Feyre, L.; Gavel, H.; Trela, O.; Ledwell, W.; Breeze, H.; Marotte, E.C.; McConney, L.; Whitehead, H. Long term trends in floating plastic pollution within a marine protected area identifies threats for endangered northern bottlenose whales. Environ. Res. 2023, 227, 115686. [Google Scholar] [CrossRef]
  54. Alexiadou, P.; Foskolos, I.; Frantzis, A. Ingestion of macroplastics by odontocetes of the Greek Seas, Eastern Mediterranean: Often deadly! Mar. Pollut. Bull. 2019, 146, 67–75. [Google Scholar] [CrossRef] [PubMed]
  55. López-Martínez, S.; Giménez-Luque, E.; Molina-Pardo, J.L.; Manzano-Medina, S.; Arribas-Arias, H.; Gavara, R.; Morales-Caselles, C.; Rivas, M.L. Plastic ingestion by two cetacean groups: Ziphiidae and Delphinidae. Environ. Pollut. 2023, 333, 121932. [Google Scholar] [CrossRef]
  56. Sá, S.; Torres-Pereira, A.; Ferreira, M.; Monteiro, S.S.; Fradoca, R.; Sequeira, M.; Vingada, J.; Eira, C. Microplastics in Cetaceans Stranded on the Portuguese Coast. Animals 2023, 13, 3263. [Google Scholar] [CrossRef]
  57. Alzugaray, L.; Di Martino, M.; Beltramino, L.; Rowntree, V.J.; Sironi, M.; Uhart, M.M. Anthropogenic debris in the digestive tract of a southern right whale (Eubalaena australis) stranded in Golfo Nuevo, Argentina. Mar. Pollut. Bull. 2020, 161A, 111738. [Google Scholar] [CrossRef]
  58. Fossi, M.C.; Panti, C.; Guerranti, C.; Copola, D.; Gianetti, M.; Marsili, L.; Minutoli, R. Are baleen whales exposed to the threat of microplastics? A case study of the Mediterranean fin whale (Balaenoptera physalus). Mar. Pollut. Bull. 2012, 64, 2374–2379. [Google Scholar] [CrossRef] [PubMed]
  59. Fossi, M.C.; Marsili, L.; Baini, M.; Gianetti, M.; Coppola, D.; Guerranti, C.; Caliani, I.; Minutoli, R.; Lauriano, G.; Finoia, M.G.; et al. Fin whales and microplastics: The Mediterranean Sea and the Sea of Cortez scenarios. Environ. Pollut. 2016, 209, 68–78. [Google Scholar] [CrossRef] [PubMed]
  60. Fossi, M.C.; Baini, M.; Panti, C.; Baulch, S. Impacts of marine litter on cetaceans: A focus on plastic pollution. In Marine Mammal Ecotoxicology; Fossi, M.C., Panti, C., Eds.; Academic Press: San Diego, CA, USA, 2018; pp. 147–184. [Google Scholar] [CrossRef]
  61. Im, J.; Joo, S.; Lee, Y.; Kim, B.Y.; Kim, T. First record of plastic debris ingestion by a fin whale (Balaenoptera physalus) in the sea off East Asia. Mar. Pollut. Bull. 2020, 159, 111514. [Google Scholar] [CrossRef]
  62. Garcia-Garin, O.; Sahyoun, W.; Net, S.; Vighi, M.; Aguila, A.; Ouddane, B.; Vikingsoon, G.A.; Chosson, V.; Borrell, A. Intrapopulation and temporal differences of phthalate concentrations in North Atlantic fin whales (Balaenoptera physalus). Chemosphere 2022, 300, e134453. [Google Scholar] [CrossRef]
  63. Jauniaux, T.; Haelters, J.; Degraer, S.; Coignoul, F. Fatal plastic impaction in a minke whale (Balaenoptera acutorostrata). In Proceedings of the 28th Annual Conference of European Cetacean Society: Marine Mammals as Sentinels of Changing Environment, Liege, Belgique, 5–9 April 2014. poster 168. [Google Scholar]
  64. Besseling, E.; Foekema, E.M.; Van Franeker, J.A.; Leopold, M.F.; Kühn, S.; Bravo Rebolledo, E.L.; Heße, E.; Mielke, L.; Ijzer, J.; Kamminga, P.; et al. Microplastic in a macro filter feeder: Humpback whale Megaptera novaeangliae. Mar. Pollut. Bull. 2015, 95, 248–252. [Google Scholar] [CrossRef]
  65. Gibbs, S.E.; Kent, S.; Slat, B.; Morales, D.; Fouda, L.; Reisser, J. Cetacean sightings within the Great Pacific Garbage Patch. Mar. Biodivers. 2019, 49, 2021–2027. [Google Scholar] [CrossRef]
  66. Guerrini, F.; Lorenzo, M.; Renato, C. Modeling plastics exposure for the marine biota: Risk maps for fin whales in the Pelagos Sanctuary (North-Western Mediterranean). Front. Mar. Sci. 2019, 6, 299. Available online: https://www.frontiersin.org/articles/10.3389/fmars.2019.00299 (accessed on 24 May 2023). [CrossRef]
  67. Werth, A.J. Flow-dependent porosity of baleen from the bowhead whale (Balaena mysticetus). J. Exp. Biol. 2013, 216, 1152–1159. [Google Scholar] [CrossRef] [PubMed]
  68. Werth, A.J.; Blakeney, S.M.; Cothren, A.I. Oil adsorption does not structurally or functionally alter whale baleen. Roy. Soc. Open Sci. 2019, 6, e182194. [Google Scholar] [CrossRef] [PubMed]
  69. Charlton-Howard, H.S.; Bond, A.L.; Rivers-Auty, J.; Lavers, J.L. ‘Plasticosis’: Characterising macro- and microplastic-associated fibrosis in seabird tissues. J. Hazard. Mater. 2023, 450, 131090. [Google Scholar] [CrossRef] [PubMed]
  70. Rivers-Auty, J.; Bond, A.L.; Grant, M.L.; Lavers, J.L. The one-two punch of plastic exposure: Macro- and micro-plastics induce multi-organ damage in seabirds. J. Hazard. Mater. 2023, 442, 130117. [Google Scholar] [CrossRef] [PubMed]
  71. Yu, W.; Ye, T.; Zhang, Y.; Xu, R.; Lei, Y.; Chen, Z.; Yang, Z.; Zhang, Y.; Song, J.; Yue, X.; et al. Global estimates of daily ambient fine particulate matter concentrations and unequal spatiotemporal distribution of population exposure: A machine learning modelling study. Lancet Planet. Health 2023, 7, e209–e218. [Google Scholar] [CrossRef] [PubMed]
  72. Jerbi, H.; Pérez, W.; Tellechea, J.S. Ingestion of floating net debris in sperm whales and larynx strangulation with gillnet parts in bottlenose dolphins on the coast of Tunisia. Aquat. Mamm. 2021, 47, 239–244. [Google Scholar] [CrossRef]
  73. Mghili, B.; Keznine, M.; Analla, M.; Aksissou, M. The impacts of abandoned, discarded and lost fishing gear on marine biodiversity in Morocco. Ocean. Coast. Manag. 2023, 239, e106593. [Google Scholar] [CrossRef]
  74. Werth, A.J. Marine Mammals. In Feeding: Form, Function, and Evolution in Tetrapod Vertebrates; Schwenk, K., Ed.; Academic Press: New York, NY, USA, 2000; pp. 475–514. [Google Scholar]
  75. Williamson, G.R. Counting and measuring baleen and ventral grooves of whales. Sci. Rep. Whales Res. Inst. 1973, 24, 279–292. [Google Scholar]
  76. Carroll, G.M.; George, J.C.; Lowry, L.F.; Coyle, K.O. Bowhead whale (Balaena mysticetus) feeding near Point Barrow, Alaska, during the 1985 spring migrations. Arctic 1987, 40, 105–110. [Google Scholar] [CrossRef]
  77. Nowacek, D.P.; Johnson, M.; Tyack, P.; Shorter, K.A.; McLellan, W.A.; Pabst, D.A. Buoyant balaenids: The ups and downs of buoyancy in right whales. Proc. R. Soc. Lond. 2001, 268, 1811–1816. [Google Scholar] [CrossRef]
  78. Goldbogen, J.A.; Calambokidis, J.; Croll, D.A.; Harvey, J.T.; Newton, K.M.; Oleson, E.M.; Schorr, G.; Shadwick, R.E. Foraging behavior of humpback whales: Kinematic and respiratory patterns suggest a high cost for a lunge. J. Exp. Biol. 2008, 211, 3712–3719. [Google Scholar] [CrossRef]
  79. Simon, M.J.; Johnson, M.; Tyack, P.; Madsen, P.T. Behaviour and kinematics of continuous ram filtration in bowhead whales (Balaena mysticetus). Proc. R. Soc. B 2009, 276, 3819–3828. [Google Scholar] [CrossRef] [PubMed]
  80. Simon, M.; Johnson, M.; Madsen, P.T. Keeping momentum with a mouthful of water: Behavior and kinematics of humpback whale lunge feeding. J. Exp. Biol. 2012, 215, 3786–3798. [Google Scholar] [CrossRef] [PubMed]
  81. Werth, A.J.; Potvin, J. Baleen hydrodynamics and morphology of cross-flow filtration in balaenid whale suspension feeding. PLoS ONE 2016, 11, e0150106. [Google Scholar] [CrossRef]
  82. Zhu, Y.; Hu, D.; Yang, G. Theoretical analysis of the hydrodynamic filtering system in the balaenid whales suspension feeding. Bioinspiration Biomim. 2020, 16, e26006. [Google Scholar] [CrossRef]
  83. Vandenberg, M.L.; Cohen, K.E.; Rubin, R.D.; Goldbogen, J.A.; Summer, A.P.; Paig-tran, E.M.; Kahane-Rapport, S.R. Formation of a fringe: A look inside baleen morphology using a multimodal visual approach. J. Morphol. 2023, 284, e21574. [Google Scholar] [CrossRef]
  84. Andrady, A.L. Microplastics in the marine environment. Mar. Pollut. Bull. 2011, 62, 1596–1605. [Google Scholar] [CrossRef]
  85. Saido, K.; Kodera, Y.; Kimukai, H.; Sato, H.; Okabe, A.; Koizumi, K.; Takatama, K.; Kwon, B.G.; Chung, S.Y.; Nishimura, M.; et al. Waste polystyrene degradation in the world oceans: Newly identified sources of contamination. Res. Sq. 2020; preprint v3. [Google Scholar] [CrossRef]
  86. Sridhar, A.; Kanna, D.; Kapoor, A.; Prabhakar, S. Extraction and detection methods of microplastics in food and marine systems: A critical review. Chemosphere 2022, 286, e131653. [Google Scholar] [CrossRef]
  87. Werth, A.J.; Rita Espada, D.; Lysiak, N.S.; George, J.C.; Sformo, T.L. Baleen turnover and gut transit in mysticete whales and its environmental implications. Polar Biol. 2020, 43, 707–723. [Google Scholar] [CrossRef]
  88. Choy, C.A.; Robison, B.H.; Gagne, T.O.; Erwin, B.; Firl, E.; Halden, R.U.; Hamilton, J.A.; Katija, K.; Lisin, S.E.; Rolsky, C.; et al. The vertical distribution and biological transport of marine microplastics across the epipelagic and mesopelagic water column. Sci. Rep. 2019, 9, 7843. [Google Scholar] [CrossRef]
  89. Kashiwabara, L.M.; Kahane-Rapport, S.R.; King, C.; DeVogelaere, M.; Goldbogen, J.A.; Savoca, M.S. Microplastics and microfibers in surface waters of Monterey Bay National Marine Sanctuary, California. Mar. Pollut. Bull. 2021, 165, 112148. [Google Scholar] [CrossRef]
  90. Rochman, C.M.; Brookson, C.; Bikker, J.; Djuric, N.; Earn, A.; Bucci, K.; Athey, S.; Huntington, A.; McIlwraith, H.; Munno, K.; et al. Rethinking microplastics as a diverse contaminant suite. Environ. Toxicol. Chem. 2019, 38, 702–711. [Google Scholar] [CrossRef] [PubMed]
  91. Werth, A.J. Models of hydrodynamic flow in the bowhead whale filter feeding apparatus. J. Exp. Biol. 2004, 207, 3569–3580. [Google Scholar] [CrossRef]
  92. van der Hoop, J.M.; Nousek-McGregor, A.E.; Nowacek, D.P.; Parks, S.E.; Tyack, P.; Madsen, P.T. Foraging rates of ram-filtering North Atlantic right whales. Funct. Ecol. 2019, 33, 1290–1306. [Google Scholar] [CrossRef]
  93. Rodríguez, Y.; Silva, M.A.; Pham, C.K.; Duncan, E.M. Cetaceans playing with single-use plastics (SUPs): A widespread interaction with likely severe impacts. Mar. Pollut. Bull. 2023, 194, 115428. [Google Scholar] [CrossRef]
  94. Cózar, A.; Echevarria, F.; González-Gordillo, I.; Duarte, C.M. Plastic debris in the open ocean. Proc. Natl. Acad. Sci. USA 2014, 111, 10239–10244. [Google Scholar] [CrossRef]
  95. van Sebille, E.; Wilcox, C.; Lebreton, L.; Maximenko, N.; Hardesy, B.D.; van Franekere, J.A.; Eriksen, M.; Siegel, D.; Galgani, F.; Lavender Law, K. A global inventory of small floating plastic debris. Environ. Res. Lett. 2015, 10, 124006. [Google Scholar] [CrossRef]
  96. Cózar, A.; Sanz-Martin, M.; Marti, E.; González-Gordillo, I.; Ubeda, B.; Gálvez, J.A.; Irigoien, X.; Duarte, C.M. Plastic accumulation in the Mediterranean Sea. PLoS ONE 2015, 10, e121762. [Google Scholar] [CrossRef]
  97. Fossi, M.C.; Copploa, D.; Baini, M.; Giannetti, M.; Guerranti, C.; Marsli, L.; Panti, C.; de Sabata, E.; Clò, S. Large filter feeding marine organisms as indicators of microplastic in the pelagic environment: The case studies of the Mediterranean basking shark (Cetorhinus maximus) and fin whale (Balaenoptera physalus). Mar. Environ. Res. 2014, 100, 17–24. [Google Scholar] [CrossRef]
  98. Jambeck, J.R.; Geyer, R.; Wilcox, C.; Siegler, T.R.; Perryman, M.; Andrady, A.; Narayan, R.; Lavender, K. Plastic waste inputs from land into the ocean. Science 2015, 347, 768–771. [Google Scholar] [CrossRef]
  99. de Vos, A.; Brownell, R.L.; Tershy, B.; Croll, D. Anthropogenic threats and conservation needs of blue whales, Balaenoptera musculus indica, around Sri Lanka. J. Mar. Sci. 2016, 8420846, 8420846. [Google Scholar] [CrossRef]
  100. Connan, M.; Perold, V.; Dilley, B.J.; Barbraud, C.; Cherel, Y.; Ryan, P.G. The Indian Ocean ‘garbage patch’: Empirical evidence from floating macro-litter. Mar. Pollut. Bull. 2021, 169, 112559. [Google Scholar] [CrossRef]
  101. Pattiaratchi, C.; van der Mheen, M.; Schlundt, C.; Narayanaswamy, B.E.; Sura, A.; Hajbane, S.; White, R.; Kumar, N.; Fernandes, M.; Wijeratne, S. Plastics in the Indian Ocean: Sources, transport, distribution, and impacts. Ocean Sci. 2022, 18, 1–28. [Google Scholar] [CrossRef]
  102. Rosel, P.E.; Wilcox, L.A.; Yamada, T.K.; Mullin, K.D. A new species of baleen whale (Balaenoptera) from the Gulf of Mexico, with a review of its geographic distribution. Mar. Mammal Sci. 2021, 37, 577–610. [Google Scholar] [CrossRef]
  103. Fu, J.; Liu, N.; Peng, Y.; Wang, G.; Wang, X.; Wang, Q.; Lv, M.; Chen, L. An ultra-light sustainable sponge for elimination of microplastics and nanoplastics. J. Hazard. Mater. 2023, 456, 131685. [Google Scholar] [CrossRef]
  104. Dubner, S. The first great American industry. Freakonomics 2023, 549, 1–10. Available online: https://freakonomics.com/podcast/the-first-great-american-industry/ (accessed on 24 May 2023).
  105. Stevenson, C.H. Whalebone: Its Production and Utilization; US Government Printing Office: Washington, DC, USA, 1907; Volume 626, pp. 1–12.
  106. Virginia Marine Debris Reduction Plan, 2021–2025. U.S. NOAA Office of Response and Restoration Marine Debris Program. 2021. Available online: https://marinedebris.noaa.gov/report/virginia-marine-debris-reduction-plan (accessed on 12 June 2023).
  107. Tan, Z.; Berry, A.; Charalambides, M.; Mijic, A.; Pearse, W.; Porter, A.; Ryan, M.P.; Shorten, R.N.; Stettler, M.E.J.; Tetley, T.D.; et al. Tyre Wear Particles Are Toxic for Us and the Environment; Imperial College London Report; Imperial College London: London, UK, 2023. [Google Scholar] [CrossRef]
  108. Borrelle, S.B.; Ringma, J.; Law, K.L.; Monnahan, C.C.; Lebreton, L.; McGivern, A.; Murphy, E.; Jambeck, J.; Leonard, G.H.; Hilleary, M.A.; et al. Predicted growth in plastic waste exceeds efforts to mitigate plastic production. Science 2020, 369, 1515–1518. [Google Scholar] [CrossRef] [PubMed]
  109. Barnett, M.J.; Hancock, P.I.; Klotz, L.E.; Attari, S.Z. Recycling bias and reduction neglect. Nat. Sustain. 2023, 6, 1418–1425. [Google Scholar] [CrossRef]
  110. Fernández-d’Arlas, B. Tough and functional cross-linked bioplastics from sheep wool keratin. Sci. Rep. 2019, 9, 14810. [Google Scholar] [CrossRef] [PubMed]
  111. Tian, L.; van Putten, R.-J.; Gruter, G.J.M. Plastic pollution: The role of (bio)degradable plastics and other solutions. In Biodegradable Polymers in the Circular Plastics Economy; Dusselier, M., Lange, J.-P., Eds.; Wiley: Hoboken, NJ, USA, 2022; pp. 59–82. [Google Scholar]
  112. Perera, P.; Herath, H.; Paranagama, P.A.; Wijesinghe, P.; Attanayake, R.N. Wood decay fungi show enhanced biodeterioration of low density polyethylene in the absence of wood in culture media. PLoS ONE 2023, 18, e0288133. [Google Scholar] [CrossRef] [PubMed]
Figure 1. Plastic debris can enter a whale’s mouth directly (via primary/original or secondary/broken pieces) and indirectly via trophic transfer, with multiple feeding-related pathways and seven deleterious outcomes: (1) capture in the baleen filter, after which plastic can (2) remain in and clog the filter or fall out of the filter and move out of the mouth. Plastic caught and then dislodged from the filter can also be (3) swallowed, leading either to passage through the gut, (4) impaction of plastic within the gut, or (5) assimilation of absorbed plastic within whale tissues. Larger plastic pieces can also (6) entangle any part of the body, harming foraging and filtration, or (7) temporarily or permanently damage the filter by breaking or bending baleen plates, creating gaps in the filter.
Oceans 05 00004 g001
Figure 2. Schematic diagram of experimental setup (as described in text), which involved the cutting of 10 × 18 cm sections of keratinous baleen, combined to form eight-section “mini-racks” of baleen tissue. Mini-racks were then mounted in the test chamber of a flume through which water circulated and into which plastic debris was introduced. Flow trials, videorecorded via underwater camera, were analyzed to study plastic capture and other baleen–plastic interactions.
Oceans 05 00004 g002
Figure 3. Plastic debris of multiple sizes, shapes, and types were used in flow tank trials, including (A) tiny microbeads and (B) assorted microplastic fragments of varying shapes and polymer types. (C,D) Plastic microbeads and macrofragments, respectively, captured by humpback whale baleen (note: with >8 plates, as in mini-racks used in comparative trials). (E) Screenshot from a video of right whale baleen mini-rack capturing microbeads, with enlarged inset in dashed red box; (F) screenshot from a video of humpback whale baleen mini-rack capturing microplastic fragments.
Oceans 05 00004 g003
Figure 4. Capture rate results for bead and fragment shape trials (all flow speeds averaged) with baleen from four whale species. Right whale baleen captured more beads, whereas humpback baleen captured the most fragments. Error bars = standard deviation.
Oceans 05 00004 g004
Figure 5. Results from flow trials (only humpback baleen data for plastic macrofragments displayed here) show no statistically significant differences with varying flow, but larger plastic fragments were captured at all flow speeds.
Oceans 05 00004 g005
Figure 6. Results from flow trials (only humpback baleen data at 75 cm/s flow speed displayed here) showed differences among five shapes/types of plastic debris. Error bars = standard deviation.
Oceans 05 00004 g006
Figure 7. Results from flow trials (only humpback baleen data at 75 cm/s flow speed displayed here) showed differences in the six types of plastic polymers tested, arranged by universal recycling code numbers. Error bars = standard deviation.
Oceans 05 00004 g007
Figure 8. Plastic pieces were captured differently in tests using baleen sections from nine locations along a full baleen rack (all scale bars = 1 m): dorsal, medial, and ventral regions of anterior, central, and posterior plates (e.g., DA = dorsal anterior region). (A) Lateral side of a bowhead whale rack (similar to that of a right whale) and (B) medial side of a right whale rack; (C,D) lateral and medial sides of a fin whale rack. In (B), + signs indicate the relative degree of capture of plastic debris by both right and humpback whale baleen: lowest in the ventral regions, higher in mid-baleen, and highest in dorsal regions.
Oceans 05 00004 g008
Figure 9. Capture and adhesion of leached plastic residues on baleen did not vary by flow speed (or region within a full rack). Photos (AC) show sections of humpback baleen, with discolored (light and dark) adhering residues indicated by dotted ovals. Photo (D) shows a humpback whale baleen sample with normal wear but no chemical residues (e.g., control image). Error bars = standard deviation.
Oceans 05 00004 g009
Figure 10. Baleen whales are vulnerable to plastic pollution of all sizes. At the lower end of the scale, nano- and microplastics are more likely to be swallowed, possibly leading to incorporation within body tissue. Macro- and mesoplastics are more likely to clog the baleen filter or, once swallowed, lodge within the gut. Megaplastics are more likely to entangle a whale or body part, including a full baleen rack, leading to serious transient or permanent effects on filtration.
Oceans 05 00004 g010
Disclaimer/Publisher’s Note: The statements, opinions and data contained in all publications are solely those of the individual author(s) and contributor(s) and not of MDPI and/or the editor(s). MDPI and/or the editor(s) disclaim responsibility for any injury to people or property resulting from any ideas, methods, instructions or products referred to in the content.

