Abstract
Sponges are increasingly recognized as ecologically important on coral reefs as scleractinian corals decline. Most sponge species can be divided into two symbiotic phenotypes which are characterized as high microbial abundance (HMA) or low microbial abundance (LMA) sponges. Sponge species of HMA or LMA symbiotic phenotypes differ not just in their microbiomes, but in other characteristics, including that LMA sponges actively pump at higher rates than HMA sponges based on a standard normalization to size. This dichotomy has recently been questioned because the size range of LMA sponges used to quantify pumping rates during studies on their trophic ecology were exceedingly small, often less than an order of magnitude. Here, both HMA and LMA sponges, across two to three orders of magnitude in sponge volume (mL) or mass (g) were assessed for allometric relationships between sponge size and pumping rates (Q = mL s−1). The scaling analysis of all data sets combined reveals that HMA sponges scale their pumping rates isometrically with size, while LMA sponges scale their pumping rate allometrically. When HMA species are examined separately, however, tropical HMA sponges scaled isometrically, while temperate HMA sponges scaled allometrically. From an ecological perspective, to quantify differences between HMA and LMA sponges for rate functions of interest (e.g., feeding) it is important to remove the effects of size as a covariate, and adjust the Q values of sponges to a standard volume or mass. For multiple species and geographic locations, this analysis shows that LMA sponges always maintain higher Q values. On tropical coral reefs, the differences between HMA and LMA sponges are intrinsic and constrained by strong evolutionary selection resulting in fixed differences in Q, regardless of sponge size.
1. Introduction
Shallow (<30 m) tropical coral reefs are undergoing community phase shifts due to climate change-related coral bleaching and disease, as well as overfishing and coastal degradation, resulting in communities that are increasingly dominated by one, or more, alternative competitors, including macroalgae, anemones, corallimorphs, octocorals and sponges [1,2,3,4]. Sponges are currently viewed as an emerging, and dominant, taxon on many coral reefs [5,6], both in terms of biomass and biodiversity, and the changes from coral to sponge dominance have the potential to alter the functional ecology of many coral reefs [7]. These changes are occurring as important new discoveries about the function of coral reef food webs have been made [8]. Recent work has demonstrated that coral reef sponges play a significant role in the transformation of dissolved organic material (DOM) into a detrital pathway via the “sponge loop” [8,9], which describes sponges as important sinks for DOM on coral reefs. The sponge loop hypothesis postulates that sponges consume large amounts of DOM, which includes both dissolved organic carbon (DOC) and dissolved organic nitrogen (DON), which is used as a food resource and subsequently released as detritus in the form of choanocytes. This “sponge detritus” can then feed higher trophic levels, which could have significant, underappreciated, impacts on carbon fluxes and budgets on coral reefs [9]. The sponge loop has re-energized studies on benthic-pelagic coupling of particulate organic matter (POM), DOM, and nutrient cycling (i.e., both C and N) on coral reefs [8,9], while providing new insights into the food web structure of coral reefs. However, climate change-related modifications in the physical oceanography of tropical coral reefs could simultaneously lead to decreases in trophic resources for sponges with unknown effects on coral reef food webs [10].
One trait that may allow sponges to exploit new habitats is their symbiotic state, an emergent property of sponge host–microbial co-evolutionary histories that determines the functional ecology of sponges [11] and affects the ecological outcomes for sponges on coral reefs [11,12]. The symbiotic microbial communities (i.e., the microbiome) of coral reef sponges are complex and exhibit a range of metabolic capabilities [11,12,13,14]. One of the two primary symbiotic phenotypes in sponges is described as high microbial abundance (HMA), supporting large (~1010 cells g−1 sponge tissue), and highly diverse, microbial communities that are specialized to provide increased biochemical functional capacity including the production of defensive secondary metabolites [11]. In contrast, the microbial communities in low microbial abundance (LMA) sponges support lower concentrations of microbes (~10⁶ cells g−1 sponge tissue), that are distinct from HMA sponges, less diverse, and exhibit decreased biochemical functional capacity compared to HMA sponges for most biochemical pathways examined [11,15,16]. These differences in microbial abundance have implications for sponge biology and their trophic ecology [11,12]. But HMA and LMA sponges exhibit other important differences; HMA sponges exhibit increased mesohyl density, low choanocyte densities, and reduced mass specific pumping rates, whereas LMA sponges have decreased mesohyl density, higher choanocyte densities and greater mass-specific pumping rates [17,18]. These differences between symbiotic phenotypes are also associated with a general preference for the uptake of DOM in HMA sponges and POM in LMA sponges [18,19].
Given the insights into the importance of benthic-pelagic coupling and the sponge loop on coral reefs from an ecological perspective, understanding and quantifying the fluxes of DOM, POM and detritus through sponges is essential [9]. As with any study involving a rate function for an organism, one should consider the effects, if any, of size on the function of interest [20,21]. For sponges, the essential rate function is pumping (Q = mL s−1), where most studies normalize rates of pumping to volume, mass or osculum cross-sectional area [19,22,23] with the assumption of isometry, or geometric similarity. However, studies on the effects of size on Q in sponges have shown that the relationship is often allometric in nature [24]. Allometric relationships can significantly affect the measurement of fluxes in any organism depending on their complexity, and more importantly when, and where, isometry is not the general rule. Deviations from isometry can be described using the power function in the form Y = aMb, or its log transformed and linearized version log Y = log (a) + b log (M), where M = mass, and a = y-intercept of the fitted line known as the normalization constant used to describe differences in the rate function of interest between two, or more, sets of data, and b = slope of the fitted line, or size exponent, which describes the proportional change in the rate function of interest with size [20,21]. Both the slope and intercept have biological meaning, and both can be used to answer important ecological questions. These relationships have been used extensively in the study of metabolic rates (e.g., respiration measured as oxygen consumption), where a mass scaling exponent of M0.75 [25], the infamous “mouse to elephant” curve, has received the greatest acceptance [20,21].
Using the M0.75 scaling exponent for metabolism, West et al. [26] developed the Metabolic Theory of Ecology (MTE), to provide a comprehensive description of the metabolic performance of all life history stages of an organism under varying conditions, based principally on the scaling of metabolic rate [27]. The controversy has been which scaling exponent to use; are M0.75, or other quarter-power exponents, appropriate across all taxa? The MTE scaling coefficient of M0.75 for metabolism is based on the principal that animals maintain a specific fractal network to service organs, tissues, and cells as they increase in size and the subsequent demand for resources, which is a feature of higher, more complex, taxa such as vertebrates (i.e., symmorphosis) [28]. While there is continuing support for the MTE’s predictive capabilities for metabolism using the M0.75 scaling coefficient [29,30,31], there are detractors [32,33,34]. Many of these critics provide support for the use of M0.66 as the universal scaling coefficient for the relationship between size and metabolism [35]. Additionally, the universal use of M0.75 is inconsistent with what we know about scaling exponents for many rate functions measured on invertebrates [35,36,37].
For sponges, allometric effects of size on sponge pumping and feeding have been previously recognized [38,39]. In Lesser [38], the LMA sponge, Callyspongia vaginalis, was reported to show deviations from isometry in sponge feeding compared to HMA sponges, and Morganti et al. [24,40] analyzed the scaling of Q with sponge size and osculum cross-section of sponges and showed scaling differences in Q values for HMA and LMA sponges. Using ratio, scaling, and adjustment of Q values to a common sized sponge analysis, three questions are addressed here: (1) Is there a difference in the scaling of pumping rates between HMA and LMA sponges; (2) Are Q values between temperate and tropical HMA sponges different; (3) When size is removed as a confounding variable which symbiotic phenotype maintains higher rates of Q? These questions are especially important in the context of comparing ecologically meaningful physiological rates, feeding rates, and bioenergetic states as they might be affected by extrinsic factors such as environmental gradients, without the confounding effects of size [41].
2. Materials and Methods
2.1. Sponge Data
To evaluate the effects of size, both volume (ml) and mass (dry weight in g), on Q values of individual sponge samples (n = 323; n = 199 HMA, n = 124 LMA), data from several studies [17,19,22,24] encompassing the Florida Keys, Belize and the Mediterranean Sea were used. Four individual samples (n = 3 HMA, n = 1 LMA) from Weisz et al. [17] were eliminated because they exhibited zero Q values. The Weisz et al. [17] data set also included repeated measurements on several individuals on different days. An analysis (Lesser, unpublished) of these data with and without these replicates was conducted to ascertain whether temporal pseudoreplication may have had any significant effects on scaling coefficients and subsequently weighted values for the Weisz et al. [17] as well as the pooled data set. No significant differences were detected in the scaling coefficients for Q between the complete Weisz et al. [17] dataset and when the temporal replicates were removed, or on the weighted Q value analyses of the pooled data. All Q measurements from Weisz et al. [17] were considered as biologically relevant and independent, and remained in the analysis presented here. A final count of 21 sponge species (n = 12 HMA, n = 9 LMA) from these combined studies was analyzed, and there was an overlap of five species between the Florida Keys and Belize, resulting in n = 16 total species (Table 1).

Table 1.
Taxonomic groups of the sponge species analyzed from the Mediterranean Sea, Florida Keys and Belize.
The group of overlapping species includes Agelas conifera and A. tubulata, which are genetically indistinguishable, and are considered as morphotypes of a single species here [11]. For the samples from the Florida Keys and the Mediterranean Sea, both volume and mass were available (Table S1). For samples from Belize originally described in MacMurray et al. [19], only volume measurements were available (see Additional file 1 in Gantt et al. [22]). From these values of sponge volume, sponge dry mass (g) was calculated using the species-specific equations from Weisz et al. [17], given that volume and dry mass are proportional at a common tissue density (g mL−1), and with the assumption that the density of sponge tissue was equivalent for the same species from different geographic areas (Table S1). For the scaling analysis, both HMA and LMA sponges spanned two to three orders of magnitude in sponge volume (mL) or dry mass (g) for the assessment of the relationship between sponge size and Q, where a minimum size range of one order of magnitude is considered essential [42]. Extrinsic factors such as seasonal changes in seawater temperature were not sufficient to elicit significant changes in Q for sponges from the Mediterranean over an annual cycle (mean annual temperature 17.18 ± 0.81 °C (SD), range of 12–23 °C, [24]), and for samples from Florida and Belize the range of temperatures (27.1–29.6 °C) are not significantly different between locations [43]. Samples were collected from 5–10 m depth in the Mediterranean [24], and 15–30 m in Florida and the Caribbean [17,19]. Rates of sponge pumping, or Q, were measured using the dye speed approach with underwater videography [17], dye front speed technique [24] or by acoustic Doppler velocimeter [19]. A detailed description of the dye speed and dye front speed techniques is provided in Morganti et al. [40] and a comparison between these techniques showed no statistical differences in pumping rates [24]. In addition to the fact that the species examined share a common feeding mechanism and higher taxonomic affinities as intrinsic factors, the analytical approaches described below were not applied to address any other factor (e.g., morphology) besides the analysis of size effects, also called contextual allometry [44].
2.2. Analysis of Size Effects on Sponge Pumping
For each dataset described above, a standard normalization of Q values (i.e., ratio analysis) was conducted for both volume and mass without regard to the effects of size and its inherent issues [45,46]. This was followed by a two-tailed Student’s t-test with symbiotic state as the variable (i.e., HMA versus LMA) on log transformed values as ratios are a priori not normally distributed, and back transformed for presentation. Then, a three-tiered approach was conducted in the re-analysis of sponge Q values. First, an analysis of the scaling exponent between HMA and LMA sponges was undertaken. Despite ongoing discussions on the relative merits of logarithmic transformations in traditional allometric studies [47,48], many consider it an essential component of the allometric analysis [42,49]. Here, since both the X and Y variables a priori contain measurement error, a traditional scaling approach on log-transformed variables, using reduced major axis (RMA) regression, was applied to assess the relationship between Q and sponge size [42,50,51]. Additionally, to avoid the high probability of autocorrelation, scaling assessments of the form Y/Vol = a Volb or Y/Mass = a Massb were avoided [42,52,53]. Second, to assess for the effects of size on Q values between HMA and LMA sponges for each dataset described above (Table S1), an analysis of covariance (ANCOVA) was run on untransformed values with symbiotic state as the primary factor and sponge volume or mass as the covariate to assess any potential allometric effects of sponge size on Q. This also allows a direct assessment of the differences in a or the y-intercept between the fitted lines for HMA and LMA sponges given that the respective b, or slope values, are homogeneous as a requirement for ANCOVA [45]. Third, if the slopes from the ANCOVA are not homogeneous a direct assessment of Q values between HMA and LMA sponges is not possible using ANCOVA. In these cases, the slope values from the ordinary least squares regression for Q versus size for symbiont phenotype were used to adjust individual sponge Q values to a sponge of standard volume or mass for each data source and the pooled data [41,45,46,52]. The adjusted Q values were then analyzed using a two-tailed Student’s t-test with symbiotic state as the fixed factor on log transformed values, and back transformed for presentation. All analyses were conducted in JMP (v 16.1.0) on the individual, or combined, data for HMA and LMA sponges.
3. Results
3.1. Scaling Analyses
For the ratio analysis, a two-tailed Student’s t-test on the Weisz et al. [17] dataset showed that Q values normalized to volume were significantly different between HMA and LMA Sponges (t(92), t-ratio = 5.62, p < 0.0001), as were Q values normalized to sponge mass (t(92), t-ratio = 6.94, P < 0.0001), with LMA sponges having greater Q values than HMA sponges (Figure 1A). For the McMurray et al. [19] and Gantt et al. [22] datasets, Q values normalized to volume were significantly different between HMA and LMA (t(28), t-ratio = 3.24, p = 0.003), as were Q values normalized to sponge mass (t(28), t-ratio = 4.19, p = 0.0003), with LMA sponges having greater Q values than HMA sponges (Figure 1B). For the Morganti et al. [24] dataset, Q values normalized to volume were significantly different between HMA and LMA sponges (t(197), t-ratio = 15.39, p < 0.0001), as were Q values normalized to sponge mass (t(197), t-ratio = 25.19, p < 0.0001), with LMA sponges having greater Q values than HMA sponges (Figure 1C). In these datasets, the size normalized values of Q were always greater in LMA sponges. Finally, when the Q values for all datasets combined are normalized to volume, or mass, and using a two-tailed Student’s t-test minus 3 degrees of freedom for having used the three datasets a priori in other analyses, Q values normalized to sponge volume (t(319), t-ratio = 9.911, p < 0.0001) or sponge mass (t(319), t-ratio = 16.06, p < 0.0001) were significantly different between HMA and LMA sponges, with size normalized Q values greater in LMA sponges compared to HMA sponges (Figure 1D).
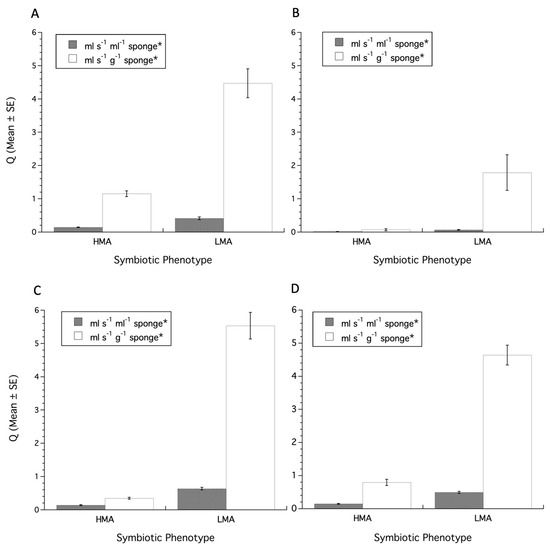
Figure 1.
Ratio analysis of sponge pumping (i.e., Q values). (A) Data from Weisz et al. [17], (B) data from McMurray et al. [19] and Gantt et al. [22], (C) data from Morganti et al. [24], (D) data pooled from all sources. HMA = High Microbial Abundance, LMA = Low Microbial Abundance. Asterisks in legend indicate significant (p < 0.05) differences for Q values for volume or mass based on two-tailed t-test.
For the scaling analysis of HMA and LMA sponges from all data sets pooled, a reduced major axis (RMA) regression was conducted on log-transformed variables of Q and sponge size. The analysis showed that HMA sponges have a slope, the size exponent b, of 0.967 (±0.028 SEM) when regressed against volume (Log Q = −2.321 + 0.967 × Log Volume, or Q = −2.321 × Vol0.967) and 1.172 (±0.038 SEM) when regressed against mass (Log Q = −1.722 + 1.172 × Log Mass, or Q = −1.722 × Mass1.172) (Figure 2A,B). The analysis of LMA sponges exhibited a slope of 0.727 (±0.021 SEM) when regressed against volume (Log Q = −0.329 + 0.727 × Log Volume, or Q = −0.329 × Vol0.727) and 0.787 (±0.046 SEM) when regressed against mass (Log Q = 1.297+ 0.727 × Log Mass, or Q = 1.297 × Mass0.787) (Figure 2C,D). When comparing the slopes of Q regressed against volume between HMA and LMA sponges using a two-tailed Student’s t-test, there is a statistically significant difference (t(323), t-ratio = 6.12, p < 0.0001), where the slopes of HMA sponges are significantly greater than those of LMA sponges (Figure 2A,C), and for Q regressed against mass the slopes of HMA sponges are also significantly greater than those of LMA sponges (t(323), t-ratio = 6.39, p < 0.0001) (Figure 2B,D).
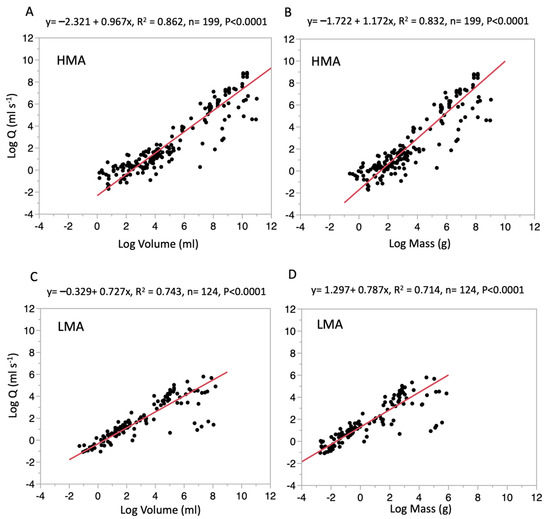
Figure 2.
Scaling analysis based on combined log-transformed values of Q and size regressed (red line) using a Reduced Major Axis regression model. (A) HMA data regressed against volume, (B) HMA data regressed against mass, (C) LMA data regressed against volume, (D) LMA data regressed against mass. HMA = High Microbial Abundance, LMA = Low Microbial Abundance.
Within the HMA sponges, a comparison of slopes for tropical and temperate species of sponges on log-transformed variables for Q and sponge size, using reduced major axis (RMA) regression, was conducted; HMA sponges from the tropics have a slope of 1.277 (±0.161 SEM) when regressed against volume (Log Q = −4.988 + 0.1277 × Log Volume, or Q = −4.988 × Vol1.277) and temperate HMA sponges have a slope of 0.765 (±0.067 SEM) when regressed against volume (Log Q = −1.689 + 0.765 × Log Volume, or Q = −1.689 × Vol0.765). The slope for tropical sponges is significantly greater than that of temperate sponges (t(197), t-ratio = 3.33, p = 0.001). Tropical HMA sponges have a slope of 1.334 (±0.193 SEM) when regressed against mass (Log Q = −2.743 + 0.1334 × Log Mass, or Q = −2.743 × Mass1.344) and temperate HMA sponges have a slope of 0.931 (±0.101 SEM) when regressed against mass (Log Q = −1.257 + 0.931 × Log Mass, or Q = −1.257 × Mass0.931). The slope for tropical HMA sponges is marginally, but significantly, greater than that of temperate HMA sponges (t(197), t-ratio = 2.02, p = 0.045). Lastly, using the slopes from the ANCOVA analysis (i.e., ordinary least squares regression), individual sponge Q values for tropical and temperate sponges were adjusted to a sponge of standard volume or mass and analyzed using a two-tailed Student’s t-test. Volume adjusted Q values for tropical (169.28 ± 223.91 (SEM)) versus temperate (132.81 ± 0.0153 (SEM)) sponges was not significant (t(197), t-ratio = 0.203, p < 0.05), with an effects size of 0.0002 (R2), while for mass adjusted Q values of tropical sponges (961.95 ± 174.19 (SEM)) versus temperate sponges (40.91 ± 0.157 (SEM)), there was a significant difference (t(197), t-ratio = 6.59, p < 0.0001), with tropical sponges exhibiting significantly greater Q values with an effects size of 0.181 (R2). However, both the volume and mass adjusted Q values had significantly unequal variances (Volume, Levene’s test, F1,197 = 57.66, p < 0.0001; Mass, Levene’s test, F1,197 = 99.86, p < 0.0001). Conducting a t-test assuming unequal variances (i.e., Welch’s Test) still showed a non-significant difference for volume adjusted Q values (F1,77 = 0.027, p = 0.871), and a significant difference for mass adjusted Q values (F1,77 = 27.96, p < 0.0001), with tropical HMA sponges exhibiting greater Q values than temperate HMA sponges (Figure 3).
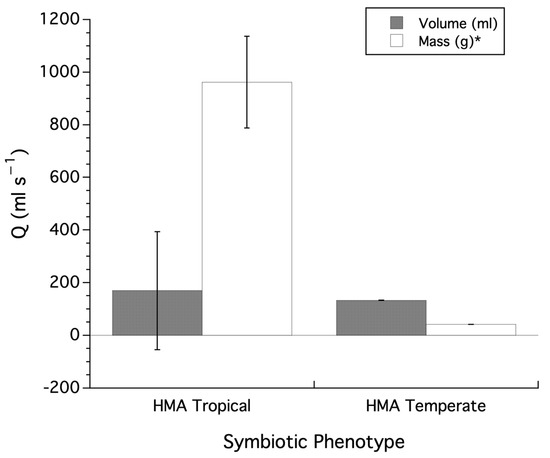
Figure 3.
Comparison of adjusted Q values between HMA sponges from tropical and temperate locations. HMA = High Microbial Abundance. Asterisks in legend indicate significant (p < 0.05) differences for Q values for volume or mass based on two-tailed t-test and presented as mean ± SEM.
3.2. Removing the Effects of Size on Rate Functions
For each individual dataset, a one-way ANCOVA was conducted to determine whether a statistically significant difference in Q values occurs between HMA and LMA sponges with size (i.e., volume or mass) as a covariate. For the data from Weisz et al. [17], the analysis of HMA sponges showed that there was a non-significant interaction between symbiotic phenotype and size for both volume (F1,93 = 0.0008, p > 0.05) and mass (F1,93 = 0.002, p > 0.05), indicating that the slopes were homogeneous, and that the main effects of the model (i.e., Q) were significantly different between HMA and LMA sponges when either volume (F3,92 = 72.68, p < 0.0001), or mass (F3,92 = 53.01, p < 0.0001), are accounted for; LMA sponges exhibited higher Q values. The slopes from the ANCOVA analysis were used to adjust individual sponge Q values of HMA and LMA sponges to a sponge of standard volume or mass, analyzed using a two-tailed Student’s t-test. Volume adjusted Q values for HMA (975.45 ± 145.45 (SEM)) versus LMA (1358.81 ± 6.51 (SEM)) sponges was not significant (t(92), t-ratio = 1.76, p = 0.083), but were also found to have significantly unequal variances (e.g., Levene’s test, F1,92 = 11.08, p = 0.0013). Conducting a t-test assuming unequal variances (i.e., Welch’s Test) showed a significant difference for Q values (F1,64 = 6.93, p = 0.011), with LMA sponges greater than HMA sponges (Figure 4A), and an effects size of 0.032 (R2). Mass adjusted Q values for HMA (987.22 ± 161.78 (SEM)) versus LMA (1791.99 ± 7.09 (SEM)) sponges were significantly different (t(92), t-ratio = 3.31, p = 0.0013), with LMA sponges greater than HMA sponges (Figure 4A), and an effects size of 0.107 (R2).
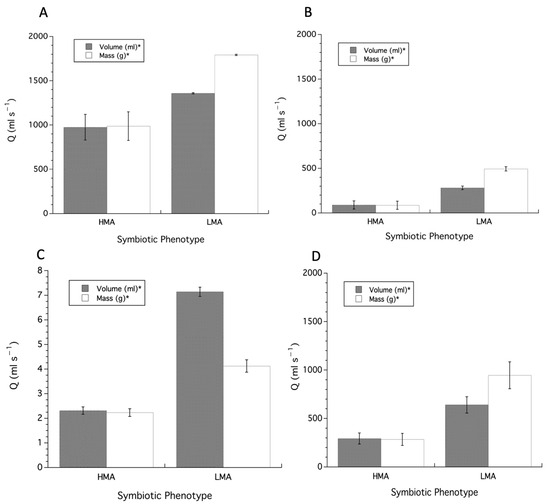
Figure 4.
Q values adjusted to a common size, volume or mass, using the slopes from an Ordinary Least Squares regression model. (A) Data from Weisz et al. [17], (B) data from McMurray et al. [19] and Gantt et al. [22], (C) data from Morganti et al. [24], (D) data combined from all sources. HMA = High Microbial Abundance, LMA = Low Microbial Abundance. Asterisks in legend indicate significant (p < 0.05) differences for Q values for volume or mass based on two-tailed t-test and presented as mean ± SEM.
For the data from McMurray et al. [19] and Gantt et al. [22] the analysis of HMA sponges showed that there was a non-significant interaction between symbiotic phenotype and size for both volume (F1,29 = 3.178, p > 0.05) and mass (F1,29 = 0.052, p > 0.05), indicating that the slopes were homogeneous, and that the main effects of the model (i.e., Q) were significantly different between HMA and LMA sponges when either volume (F3,29 = 4.11, p = 0.016) or mass (F3,29 = 3.28, p = 0.037) are accounted for; LMA sponges exhibited higher Q values. But the regression lines for Q versus mass are crossed, which indicates the regression lines are not isometric. While the slopes from the ANCOVA analysis for both volume and mass were used to adjust individual sponge Q values for HMA and LMA sponges to a sponge of standard volume or mass, the adjustment procedure was a requirement for the mass data, which was then analyzed using a two-tailed Student’s t-test. Volume adjusted Q values for HMA (86.13 ± 46.70 (SEM)) versus LMA (494.31 ± 24.07 (SEM)) sponges were significant (t(28), t-ratio = 8.49, p < 0.0001) with LMA sponges greater than HMA sponges (Figure 4B), and an effects size of 0.387 (R2). Mass adjusted Q values for HMA (88.99 ± 46.64 (SEM)) versus LMA (281.11 ± 20.97 (SEM)) sponges were also significantly different (t(28), t-ratio = 4.20, p = 0.0002) with LMA sponges greater than HMA sponges (Figure 4B), and an effects size of 0.721 (R2).
For the data from Morganti et al. [24] the analysis of HMA sponges showed that there was a significant interaction between symbiotic phenotype and size for both volume (F1,199 = 58.09, p < 0.0001) and mass (F1,199 = 46.41, p < 0.0001), indicating a lack of homogeneity of slopes, a requirement for the ANCOVA, and that the main effects of the model cannot be interpreted as planned a priori. The slopes from the ANCOVA analysis for both volume and mass were then used to adjust individual sponge Q values for HMA and LMA sponges to a sponge of standard volume or mass, analyzed using a two-tailed Student’s t-test. Volume adjusted Q values for HMA (2.31 ± 0.15 (SEM)) versus LMA (7.14 ± 0.19 (SEM)) sponges were significant (t(197), t-ratio = 19.91, p < 0.0001) with LMA sponges greater than HMA sponges (Figure 4C), and an effects size of 0.668 (R2). Mass adjusted Q values for HMA (2.23 ± 0.16 (SEM)) versus LMA (4.12 ± 0.25 (SEM)) sponges were also significantly different (t(197), t-ratio = 6.68, p < 0.0001) with LMA sponges greater than HMA sponges (Figure 4C), and an effects size of 0.185 (R2).
For the entire data set the analysis of sponges showed that there was no significant interaction between symbiotic phenotype and size for both volume (F1,323= 0.13, p = 0.719) and mass (F1,323 = 007, p = 0.934), indicating that the slopes were homogeneous, and that the main effects of the model (i.e., Q) were significantly different between HMA and LMA sponges when either volume (F3,323 = 77.96, p < 0.0001), or mass (F3,323 = 6.53, p = 0.0003), are accounted for. But the regression lines for Q versus mass are crossed, which indicates that the regression lines are not isometric. The slopes from the ANCOVA analysis for both volume and mass were used to adjust individual sponge Q values for HMA and LMA sponges to a sponge of standard volume or mass, analyzed using a two-tailed Student’s t-test. Volume adjusted Q values for HMA (293.38 ± 57.52 (SEM)) versus LMA (640.39 ± 84.04 (SEM)) sponges were significant (t(321), t-ratio = 3.52, p = 0.0005) with LMA sponges greater than HMA sponges (Figure 4D), and an effects size of 0.037 (R2). Mass adjusted Q values for HMA (283.97 ± 62.71 (SEM)) versus LMA (945.16 ± 138.69 (SEM)) sponges were also significantly different (t(321), t-ratio = 4.89, p < 0.0001) with LMA sponges greater than HMA sponges (Figure 4D), and an effects size of 0.069 (R2).
4. Discussion
Multiple traits of marine sponges have been shown to be evolutionarily linked to their symbiotic phenotype (i.e., HMA vs. LMA status; [11]). In particular, the trophic ecology of marine sponges and their relative consumption of DOM and POM is closely related to their HMA or LMA status, as is the abundance and metabolic capacity differences in their respective microbiomes [11,12,17,18,54]. Both HMA and LMA sponges consume DOM and POM, but LMA sponges have consistently been reported to exhibit higher pumping rates and greater consumption of POM, while HMA sponges typically have lower pumping rates and greater consumption of DOM [17,18,19,54,55]. It is likely that the early evolution of LMA sponges in the Neoproterozoic led to a filter feeding body plan to take advantage primarily of POM (i.e., picoplankton), followed by multiple evolutionary events where HMA sponges arose from the ancestral LMA state, feeding primarily on DOM derived from phytoplankton [11,56,57]. These differences are closely linked to functional differences in traits, such as differences in Q between HMA and LMA sponges [17,18,24].
The issues of how Q increases with size [53], whether LMA sponges pump at greater rates than HMA sponges [17,18], and if interspecies size differences between tropical HMA and LMA sponges may be driving this phenomenon in tropical, but not temperate, sponges are of increasing interest [24,40]. The reanalysis of the data [17,19,22,24] presented here, using the common ratio analysis of normalizing Q to size (i.e., volume or mass), confirmed that in all datasets LMA sponge Q values are significantly greater than HMA sponges. A scaling analysis of HMA and LMA sponges using RMA regression on log-transformed Q and size showed that, when the pooled data set is analyzed, HMA sponges scale Q isometrically based on either volume (Vol0.967) or mass (Mass1.172), while LMA sponges scale Q allometrically based on volume (Vol0.727) or mass (Mass0.787). Despite these scaling differences, Q adjusted for a standard size sponge consistently showed that LMA sponges pump at greater rates than HMA sponges, as in the ratio analysis. Morganti et al. [24] suggested, based on volume-specific pumping rates, that these differences between sponge phenotypes are likely to be caused by the inherent interspecies size differences between HMA and LMA sponges. Here, however, with volume or mass removed as a confounding factor, LMA sponges still maintain higher Q values than HMA sponges. Interestingly, when comparing HMA samples from tropical versus temperate habitats, HMA sponges from the tropics exhibit significantly greater scaling exponents for Q compared to temperate HMA sponges, and when scaling exponents are used to normalize Q values to a standard sized sponge, tropical HMA sponges also pump at greater rates than temperate HMA sponges. However, in their analysis, Morganti et al. [40] found that flow rate scaled isometrically with the individual osculum surface area in all temperate and tropical HMA sponges. An analysis of Spheciospongia vesparium, a tropical HMA sponge, based on the fact that it was the only tropical species with sufficient data points, also scaled isometrically (scaling coefficient =0.98; [40] their Figure S3) but, when removed from the scaling analysis of tropical HMA sponges, a scaling coefficient of 0.78 was observed, suggesting that S. vesparium is either an outlier, or that its large sample size influenced the analysis of scaling for tropical HMA sponges [40]. Here, when the S. vesparium data are analyzed separately using RMA regression on log transformed data, the scaling coefficient for Q as a function of volume is 1.101 ± 0.111 (SEM) and 1.155 ± 0.115 (SEM) for mass. Neither is significantly different from 1.0, indicating that S. vesparium scales isometrically for size, as found for osculum surface area by Morganti et al. [40]. If the slopes are then compared between all tropical sponges (b = 1.277 ± 0.161) and tropical samples minus S. vesparium (1.008 ± 0.261) based on volume, there is no significant difference (t(129), t-ratio = 0.925, p = 0.357). Similarly, there is no significant difference (t(129), t-ratio = 0.886, p = 0.377) based on mass (1.334 ± 0.193) for all tropical sponges compared to tropical sponges without the S. vesparium data included (1.025 ± 0.313). When tropical HMA sponges without the S. vesparium data (1.008 ± 0.261) are compared to temperate HMA sponges (0.765 ± 0.067), there is no significant difference based on volume (t(172), t-ratio = 1.21, p = 0.229), or mass (t(172), t-ratio = 0.365, p = 0.716). While isometry persists in tropical HMA sponges without the S. vesparium data, compared to allometry in the temperate HMA sponges, the loss of power by reducing the degrees of freedom resulted in no statistically significant differences. Given the lack of any biological reason to omit the S. vesparium data, this approach is not advocated for here. For the original analysis, one explanation for the observed differences might be that the HMA species from tropical environments experience less high-pressure resistance (see below) because, as temperature increases, the viscosity of the water decreases compared to temperate HMA species [58]. But Morganti et al. [24] reported minimal to no effect of temperature on pumping rates or kinematic viscosity for both HMA and LMA sponges.
The three-tiered analytical approach used here was conducted without regard to sponge species, general morphology, location, or whether a single osculum module or multi-oscula module were considered [53]. In addition, only the allometric equation of the form Y = aMb, and not Y/M = aMb, was used for the scaling analyses because Y/M is independent (i.e., no autocorrelation) of M only when Y scales isometrically [42,52]. To assess differences in Q, and therefore the feeding ecology of sponges [41], the slopes from the ANCOVA regressions (i.e., ordinary least squares) were used to adjust Q to a sponge of standard volume or size [45,46]. The ordinary least squares regression model is appropriate here given that the purpose of the regression is to predict Y from M, where M is believed to be affecting Y, and not the reverse [52]. Only the symbiotic phenotype of the sponges was considered as a variable, and HMA sponges consistently had greater scaling exponents and lower pumping rates compared to LMA sponges when size was removed as a confounding factor, a result surprisingly similar to the ratio analysis. It should be a matter of practice for quantifying rate functions in sponges, and most other taxa, not to assume that these processes scale isometrically with size, and that size should be removed from these measurements to obtain ecologically meaningful insights. Additionally, while understanding the scaling of Q in sponges is of inherent evolutionary interest, the ability to compare Q values in an ecological context, without the confounding effects of size, was the objective here. Removing the effects of size reveals that LMA sponges consistently have greater Q values than HMA sponges, and this has significant implications for assessing and understanding the trophic ecology of sponges.
But why was the ratio analysis of Q in HMA compared to LMA sponges no different than sponge Q values adjusted to a sponge of standard size? Q values for HMA sponges are isometric, so similarity between the two approaches would be expected, but what about the LMA Q values? The implication is that size per se is not the major influence on Q in LMA sponges. So, what other factors could be determinative for these consistent differences in Q values between HMA and LMA sponges? It was noted above that extrinsic, environmental factors were not likely to be confounding these results, and initially, because the species examined share a common feeding mechanism and higher taxonomic affinities as intrinsic factors, no other factors were considered in the analysis [44]. But differences in Q are linked to differences in the functional morphology of the sponge phenotypes [53,55,59,60]. Sponges of the HMA phenotype have increased mesohyl density, lower choanocyte chamber densities, and narrower aquiferous canals. These factors, for a given amount of energy devoted to pumping, result in lower pumping rates, whereas LMA sponges have decreased mesohyl density, higher choanocyte chamber densities, and wider aquiferous canals, resulting in greater pumping rates [17,60]. Rates of pumping in HMA sponges scale isometrically with size and, assuming choanocyte chamber densities in sponges also scale isometrically with size, then choanocyte density will remain constant as sponge size increases. Combined with narrower aquiferous canals, HMA sponges will always be constrained to lower Q values because of high-pressure resistance in the aquiferous system [59,61]. But Q values in LMA sponges scale allometrically with size and, even if choanocyte chamber densities decrease with increasing size, lower mesohyl density and wider aquiferous canals result in less high-pressure resistance and higher Q values in LMA sponges [59,61]. Finally, what role might symbiont densities have in the different Q values for HMA and LMA sponges? Does the proportional difference in the contribution of symbiont biomass to holobiont biomass in these symbiotic phenotypes contribute to differences in size adjusted Q values? The microbial symbionts of HMA sponges can make up to ~98.7% of the holobiont, while for LMA sponges this is ~39.5% [18]. Given that most of the symbiotic bacteria reside in the mesohyl, they should contribute significantly to mesohyl density [62], and greater high-pressure resistance in HMA sponges compared to LMA sponges [59,61]. These differences between HMA and LMA sponges are intrinsic functional outcomes constrained by strong evolutionary selection for variations on a body plan based on the availability of different trophic resources, and the increased importance of highly specialized, coevolved, communities of symbiotic bacteria in HMA compared to LMA sponges [11,56,57]. Taken together, these results appear to show that a feature of these symbiotic phenotypes is difference in Q, regardless of sponge size. Nonetheless, an improved understanding of which factors contribute to differences in Q will require additional studies of multiple sponge species over their entire size range (i.e., volume, mass and osculum surface area) and where different morphologies, environments and symbiotic phenotypes are taken into account.
Ecologically, sponges represent a dominant functional group on coral reefs worldwide, and there is evidence that sponge abundance and biomass are increasing on shallow reefs as coral cover declines due to anthropogenic disturbances [5]. All sponges consume varying amounts of DOM and POM, and the differences in Q values described here for HMA and LMA sponges may also have important ecological ramifications for the distribution of HMA and LMA sponges. This includes sufficient trophic niche separation within complex sponge communities to increase local sponge biodiversity and coexistence [63], as important space occupiers such as scleractinian corals continue to decline on coral reefs. Climate change, community phase shifts to algal dominated coral reefs and increased DOM production have the potential to influence these ecological dynamics [9,10], making accurate assessments of the trophic biology of multiple taxa, by accounting for the effects of body size for physiological comparisons under a broad range of conditions, essential.
Supplementary Materials
The following supporting information can be downloaded at: https://www.mdpi.com/article/10.3390/oceans4040027/s1, Table S1: Primary Data Sources.xlsx.
Funding
Support for this research was provided by National Science Foundation, Biological Oceanography program (OCE-1632348).
Institutional Review Board Statement
Ethical review and approval were waived for this study due to the fact that no animals were used in the reanalysis of published data.
Informed Consent Statement
Not applicable.
Data Availability Statement
All data used in this study are available publicly (BCO-DMO) from their primary authors and are also provided in Table S1.
Acknowledgments
Data for this paper were provided by Jeremey Weisz and Teresa M. Morganti. Additional data were obtained from BCO-DMO with the assistance of Steve McMurray. Thank you to Marc Slattery, and two anonymous reviewers, for constructive comments on the manuscript.
Conflicts of Interest
The author declares no conflict of interest. The funders had no role in the design of the study; in the collection, analyses, or interpretation of data; in the writing of the manuscript; or in the decision to publish the results.
References
- Done, T.J. Phase shifts in coral reef communities and their ecological significance. Hydrobiologia 1992, 247, 121–132. [Google Scholar] [CrossRef]
- Hughes, T.P.; Rodrigues, M.J.; Bellwood, D.R.; Ceccarelli, D.; Hoegh-Guldberg, O.; McCook, L.; Moltschaniwskyj, N.; Prachett, M.S.; Steneck, R.S.; Willis, B. Phase shifts, herbivory, and the resilience of coral reefs to climate change. Curr. Biol. 2017, 17, 360–365. [Google Scholar] [CrossRef] [PubMed]
- Norström, A.V.; Nyström, M.; Lokrantz, J.; Folke, C. Alternative states on coral reefs: Beyond coral–macroalgal phase shifts. Mar. Ecol. Prog. Ser. 2009, 376, 295–306. [Google Scholar] [CrossRef]
- Dudgeon, S.R.; Aronson, R.B.; Bruno, J.F.; Precht, W.F. Phase shifts and stable states on coral reefs. Mar. Ecol. Prog. Ser. 2010, 413, 201–216. [Google Scholar] [CrossRef]
- Bell, J.J.; Davy, S.K.; Jones, T.; Taylor, M.W.; Webster, N.S. Could some coral reefs become sponge reefs as our climate changes? Glob. Clim. Change 2013, 19, 2613–2624. [Google Scholar] [CrossRef] [PubMed]
- Bell, J.J.; Bennett, H.M.; Rovellini, A.; Webster, N.S. Sponges to be winners under near-future climate scenarios. BioScience 2018, 68, 955–968. [Google Scholar] [CrossRef]
- Bell, J.J.; Rovellini, A.; Davy, S.K.; Taylor, M.W.; Fulton, E.A.; Dunn, M.R.; Bennett, H.M.; Kandler, N.M.; Luter, H.M.; Webster, N.S. Climate change alterations to ecosystem dominance: How might sponge-dominated reefs function? Ecology 2018, 99, 1920–1931. [Google Scholar] [CrossRef]
- De Goeij, J.M.; Van Oevelen, D.; Vermeij, M.J.; Osinga, R.; Middelburg, J.J.; de Goeij, A.F.; Admiraal, W. Surviving in a marine desert: The sponge loop retains resources within coral reefs. Science 2013, 342, 108–110. [Google Scholar] [CrossRef]
- De Goeij, J.M.; Lesser, M.P.; Pawlik, J.R. Nutrient Fluxes and Ecological Functions of Coral Reef Sponges in a Changing Ocean. In Climate Change, Ocean Acidification and Sponges; Carballo, J.L., Bell, J.J., Eds.; Springer International: Berlin/Heidelberg, Germany, 2017; pp. 373–410. [Google Scholar]
- Lesser, M.P.; Slattery, M. Will coral reef sponges be winners in the Anthropocene? Glob. Change Biol. 2020, 26, 3202–3211. [Google Scholar] [CrossRef]
- Pankey, M.S.; Plachetzki, D.C.; Macartney, K.J.; Gastaldi, M.; Slattery, M.; Gochfeld, D.J.; Lesser, M.P. Cophylogeny and convergence shape holobiont evolution in sponge-microbe symbioses. Nat. Ecol. Evol. 2022, 6, 750–762. [Google Scholar] [CrossRef]
- Lesser, M.P.; Pankey, M.S.; Slattery, M.; Macartney, K.J.; Gochfeld, D.J. Sponge microbiome diversity and metabolic capacity determines the trophic ecology of the holobiont in Caribbean sponges. ISME Commun. 2022, 2, 112. [Google Scholar] [CrossRef] [PubMed]
- Taylor, M.W.; Radax, R.; Steger, D.; Wagner, M. Sponge-associated microorganisms: Evolution, ecology, and biotechnological potential. Microbiol. Biol. Rev. 2007, 71, 295–347. [Google Scholar] [CrossRef]
- Thacker, R.W.; Freeman, C.J. Sponge-microbe symbioses: Recent advances and new directions. Adv. Mar. Biol. 2012, 62, 57–112. [Google Scholar] [PubMed]
- Hentschel, U.; Fieseler, L.; Wehrl, M.; Gernert, C.; Steinert, M.; Hacker, J.; Horn, M. Microbial diversity of marine sponges. Prog. Mol. Subcell. Biol. 2003, 37, 59–88. [Google Scholar] [PubMed]
- Moitinho-Silva, L.; Steinert, G.; Nielsen, S.; Hardoim, C.C.P.; Wu, Y.-C.; McCormack, G.P. Predicting the HMA-LMA status in marine sponges by machine learning. Front. Microbiol. 2017, 8, 752. [Google Scholar] [CrossRef] [PubMed]
- Weisz, J.B.; Lindquist, N.; Martens, C.S. Do associated microbial abundances impact marine demosponge pumping rates and tissue densities. Oecologia 2008, 155, 367–376. [Google Scholar] [CrossRef]
- Rix, L.; Ribes, M.; Coma, R.; Jahn, M.T.; de Goeij, J.M.; van Oevelen, D.; Escrig, S.; Meibom, A.; Hentschel, U. Heterotrophy in the earliest gut: A single-cell view of heterotrophic carbon and nitrogen assimilation in sponge-microbe symbioses. ISME J. 2020, 14, 2554–2567. [Google Scholar] [CrossRef]
- McMurray, S.E.; Stubler, A.D.; Erwin, P.M.; Finelli, C.M.; Pawlik, J.R. A test of the sponge-loop hypothesis for emergent Caribbean reef sponges. Mar. Ecol. Prog. Ser. 2018, 588, 1–14. [Google Scholar] [CrossRef]
- Peters, R.H. The Ecological Implications of Body Size; Cambridge University Press: Cambridge, UK, 1983; pp. 1–329. [Google Scholar]
- Schmidt-Nielson, K. Scaling: Why is Animal Size So Important? Cambridge University Press: Cambridge, UK, 1984; pp. 1–256. [Google Scholar]
- Gantt, S.E.; McMurray, S.E.; Stubler, A.D.; Finelli, C.M.; Pawlik, J.R.; Erwin, P.M. Testing the relationship between microbiome composition and flux of carbon and nutrients in Caribbean coral reef sponges. Microbiome 2019, 7, 124. [Google Scholar] [CrossRef]
- Reiswig, H.M. Particle feeding in natural populations of three marine demosponges. Biol. Bullet. 1971, 141, 568–591. [Google Scholar] [CrossRef]
- Morganti, T.M.; Ribes, M.; Yahel, G.; Coma, R. Size is the major determinant of pumping rates in marine sponges. Front. Physiol. 2019, 10, 1474. [Google Scholar] [CrossRef] [PubMed]
- Kleiber, M. Body size and metabolism. Hilgardia 1932, 6, 315–353. [Google Scholar] [CrossRef]
- West, G.B.; Brown, J.H.; Enquist, B.J. A general model for the origin of allometric scaling laws in biology. Science 1997, 276, 122–126. [Google Scholar] [CrossRef] [PubMed]
- Van der Meer, J. Metabolic theories in ecology. Trends Ecol. Evol. 2006, 21, 136–140. [Google Scholar] [CrossRef] [PubMed]
- Weibel, E.R.; Taylor, C.R.; Hoppeler, H. The concept of symmorphosis: A testable hypothesis of structure-function relationship. Proc. Natl. Acad. Sci. USA 1991, 88, 10357–10361. [Google Scholar] [CrossRef] [PubMed]
- Brown, J.H.; Gillooly, J.F.; Allen, A.P.; Savage, V.M.; West, G.B. Toward a metabolic theory of ecology. Ecology 2004, 85, 1771–1789. [Google Scholar] [CrossRef]
- West, G.B.; Brown, J.H. The origin of allometric scaling laws in biology from genomes to ecosystems: Towards a quantitative unifying theory of biological structure and organization. J. Exp. Biol. 2005, 208, 1575–1592. [Google Scholar] [CrossRef]
- Gillooly, J.F.; Brown, J.H.; West, G.B.; Savage, G.M.; Charnov, E.L. Effects of size and temperature on metabolic rate. Science 2001, 293, 2248–2251. [Google Scholar] [CrossRef]
- Glazier, D.S. The ¾-power law is not universal: Evolution of isometric, ontogenetic metabolic scaling in pelagic animals. BioScience 2006, 56, 325–332. [Google Scholar] [CrossRef]
- White, C.R.; Cassey, P.; Blackburn, T.M. Allometric exponents do not support a universal metabolic allometry. Ecology 2007, 88, 315–323. [Google Scholar] [CrossRef]
- Apol, M.E.F.; Etienne, R.S.; Olff, H. Revisiting the evolutionary origin of allometric metabolic scaling in biology. Funct. Ecol. 2008, 22, 1070–1080. [Google Scholar] [CrossRef]
- Agutter, P.A.; Wheatley, D.N. Metabolic scaling: Consensus or controversy? Theoret. Biol. Med. Model. 2004, 1, 13. [Google Scholar] [CrossRef] [PubMed]
- Patterson, M.R. A mass transfer explanation of metabolic scaling relations in some aquatic invertebrates and algae. Science 1992, 255, 1421–1423. [Google Scholar] [CrossRef]
- Shick, J.M. A Functional Biology of Sea Anemones; Chapman and Hall: London, UK, 1991; pp. 1–395. [Google Scholar]
- Lesser, M.P. Benthic–pelagic coupling on coral reefs: Feeding and growth of Caribbean sponges. J. Exp. Mar. Biol. Ecol. 2006, 328, 277–288. [Google Scholar] [CrossRef]
- Trussell, G.C.; Lesser, M.P.; Patterson, M.R.; Genovese, S.J. Depth-specific differences in growth of the reef sponge Calyspongia vaginalis: Role of bottom-up effects. Mar. Ecol. Prog. Ser. 2006, 323, 149–158. [Google Scholar] [CrossRef][Green Version]
- Morganti, T.M.; Ribes, M.; Maskovich, R.; Weisz, J.B.; Yahel, G.; Coma, R. In Situ pumping rate of 20 marine demosponges is a function of osculum area. Front. Mar. Sci. 2021, 8, 583188. [Google Scholar] [CrossRef]
- Macartney, K.J.; Clayshute-Abraham, A.; Slattery, M.; Lesser, M.P. Growth and feeding in the Sponge, Agelas tubulata, from shallow to mesophotic depths on Grand Cayman Island. Ecosphere 2021, 12, e03764. [Google Scholar] [CrossRef]
- LaBarbera, M. Analyzing body size as a factor in ecology and evolution. Ann. Rev. Ecol. Syst. 1989, 20, 97–117. [Google Scholar] [CrossRef]
- Abraham, A.C.; Gochfeld, D.G.; Macartney, K.; Mellor, A.; Lesser, M.P.; Slattery, M. Biochemical variability in sponges across the Caribbean basin. Invert. Biol. 2021, 140, e12341. [Google Scholar]
- Glazier, D.S. Complications with body-size correction in comparative biology: Possible solutions and an appeal for new approaches. J. Exp. Biol. 2022, 225, jeb243313. [Google Scholar] [CrossRef]
- Packard, G.C.; Boardman, T.J. The misuse of ratios, indices, and percentages in ecophysiological research. Physiol. Zool. 1988, 61, 1–9. [Google Scholar] [CrossRef]
- Packard, G.C.; Boardman, T.J. The use of percentages and size-specific indices to normalize physiological data for variation in body size: Wasted time, wasted effort? Comp. Biochem. Phys. 1999, 122, 37–44. [Google Scholar] [CrossRef]
- Packard, G.C. On the use of logarithmic transformations in allometric analyses. J. Theor. Biol. 2009, 257, 515–518. [Google Scholar] [CrossRef]
- Packard, G.C. Misconceptions about logarithmic transformation and the traditional allometric method. Zoology 2017, 123, 115–120. [Google Scholar] [CrossRef] [PubMed]
- Kerkhoff, A.J.; Enquist, B.J. Multiplicative by nature: Why logarithmic transformation is necessary in allometry. J. Theor. Biol. 2009, 257, 519–521. [Google Scholar] [CrossRef]
- McArdle, B.H. The structural relationship: Regression in biology. Can. J. Zool. 1988, 66, 2329–2339. [Google Scholar] [CrossRef]
- Warton, D.I.; Wright, I.J.; Falster, D.S.; Westoby, M. Bivariate line-fitting methods for allometry. Biol. Rev. 2006, 81, 259–291. [Google Scholar] [CrossRef]
- White, C.R.; Kearney, M.R. Metabolic scaling in animals: Methods, empirical results, and theoretical explanations. Compr. Physiol. 2014, 4, 231–256. [Google Scholar]
- Riisgård, H.U.; Larsen, P.S. Filtration rates and scaling in demosponges. J. Mar. Sci. Eng. 2022, 10, 643. [Google Scholar] [CrossRef]
- Maldonado, M.; Ribes, M.; van Duyl, F.C. Nutrient fluxes through sponges: Biology, budgets, and ecological implications. Adv. Mar. Biol. 2012, 62, 113–182. [Google Scholar]
- Poppell, E.; Weisz, J.; Spicer, L.; Massaro, A.; Hill, A.; Hill, M. Sponge heterotrophic capacity and bacterial community structure in high- and low-microbial abundance sponges. Mar. Ecol. 2014, 35, 414–424. [Google Scholar] [CrossRef]
- Mills, D.B.; Canfield, D.E. A trophic framework for animal origins. Geobiology 2016, 15, 197–210. [Google Scholar] [CrossRef] [PubMed]
- Sperling, E.A.; Stockey, R.G. The temporal and environmental context of early animal evolution: Considering all the ingredients of an “explosion”. Integr. Comp. Biol. 2018, 58, 605–622. [Google Scholar] [CrossRef]
- Larsen, P.S.; Riisgård, H.U. Viscosity and not biological mechanisms often controls the effects of temperature on ciliary activity and swimming velocity of small aquatic organisms. J. Exp. Mar. Biol. Ecol. 2009, 381, 67–73. [Google Scholar] [CrossRef]
- Asadzadeh, S.S.; Kiørboe, T.; Larsen, P.S.; Leys, S.P.; Yahel, G.; Walther, J.H. Hydrodynamics of sponge pumps and evolution of the sponge body plan. eLife 2020, 9, e61012. [Google Scholar] [CrossRef] [PubMed]
- Dahihande, A.S.; Thakur, N.L. Differences in the structural components influence the pumping capacity of marine sponges. Front. Mar. Sci. 2021, 8, 671362. [Google Scholar] [CrossRef]
- Asadzadeh, S.S.; Larsen, P.S.; Riisgård, H.U.; Walther, J.H. Hydrodynamics of the leucon sponge pump. J. R. Soc. Interface 2019, 16, 20180603. [Google Scholar] [CrossRef]
- Wilkinson, C.R. Significance of microbial symbionts in sponge evolution and ecology. Symbiosis 1987, 4, 135–146. [Google Scholar]
- Morganti, T.; Coma, R.; Yahel, G.; Ribes, M. Trophic niche separation that facilitates co-existence of high and low microbial abundance sponges is revealed by in situ study of carbon and nitrogen fluxes. Limnol. Oceanogr. 2017, 62, 1963–1983. [Google Scholar] [CrossRef]
Disclaimer/Publisher’s Note: The statements, opinions and data contained in all publications are solely those of the individual author(s) and contributor(s) and not of MDPI and/or the editor(s). MDPI and/or the editor(s) disclaim responsibility for any injury to people or property resulting from any ideas, methods, instructions or products referred to in the content. |
© 2023 by the author. Licensee MDPI, Basel, Switzerland. This article is an open access article distributed under the terms and conditions of the Creative Commons Attribution (CC BY) license (https://creativecommons.org/licenses/by/4.0/).