Article

Stability of the Macrocyclic Gd-DOTA Contrast Agent (DOTAREM) under Different Estuarine Environmental Conditions

1
Faculdade de Ciências, Universidade de Lisboa, Campo Grande, 1749-016 Lisboa, Portugal
2
IPMA, Instituto Português do Mar e da Atmosfera, Rua Dr. Alfredo Magalhães Ramalho, 6, 1495-006 Lisboa, Portugal
*
Author to whom correspondence should be addressed.
Oceans 2023, 4(4), 381-393; https://doi.org/10.3390/oceans4040026
Submission received: 30 July 2023 / Revised: 11 October 2023 / Accepted: 23 November 2023 / Published: 28 November 2023

Abstract

:
Gadolinium-based contrast agents (GBCA) are complexes, highly stable in vivo, used in magnetic resonance imaging (MRI), administered in patients and then eliminated via the renal system, passing through wastewater treatment plants (WWTP) before being discarded in the receiving medium, without apparent removal. In this study, it was examined whether different exposure periods to several environmental parameters (solar radiation, different salinities, temperatures and pH) will influence the stability of these complexes, namely, the Gd-DOTA. Gd-DOTA solutions were processed in a seaFAST-pico saline matrix pre-concentration and elimination system, and Gd concentrations were determined using ICP-MS. The results showed that the complex remained stable in fresh, brackish and saline water environments, even when exposed to extreme temperatures (40 °C) or slightly acidic to basic conditions (6–10), for an exposure period of 96 h. A small increase in the free Gd concentration was observed after 18 days when exposed to pH < 4, in all tested salinities (0, 18 and 36 PSU), with a degradation increase of up to 29%, after 5 weeks of exposure in freshwater. When exposed to direct solar radiation, a low Gd-DOTA degradation (4%) was observed after 24 h at salinity 18 PSU and remained constant until the end of the exposure period (96 h), while the remaining salinities showed negligible values.

1. Introduction

Gadolinium (Gd) is a metal belonging to the group of rare-earth elements (REE), which includes the elements from the Lanthanide series in the Periodic Table, from lanthanum (La) to lutecium (Lu), along with scandium (Sc) and yttrium (Y). In its free ionic state (Gd3+), gadolinium is highly toxic to human beings, being able to precipitate in bones, the liver and the brain, and obstruct the flux of some fundamental ions such as calcium and zinc [1,2,3,4]. However, when complexed with a highly stable organic compound, it can be administered safely, with no risks of toxicity, and easily excreted from the organism. For this reason and due to gadolinium’s paramagnetic qualities, complexed Gd can be used in medicine to enhance the quality of magnetic resonance images (MRI) [1,5]. These Gd complexes are known as gadolinium-based contrast agents (GBCAs).
GBCAs are polyaminocarboxylates linked to a Gd ion. Contrast agents with macrocyclic structure and ionic bonds between the metallic ion and the organic component are the most stable and less likely to degrade in vivo conditions [6]. The dissociation rate of GBCAs is low in the physiological pH (7.4). However, when exposed to more acidic matrices, this dissociation rate increases considerably [7]. Port et al. (2008) determined the half-life time of some GBCAs, both macrocyclic and linear, at pH 1 (25 °C and 37 °C) and at 1.2 (37 °C) [8]. In that study, the authors determined that the half-life times were smaller in lower pH and higher temperatures, and that the complexes with a linear structure dissociated much more quickly than those with macrocyclic structures. The stability of GBCAs is due to the electrostatic interaction between the Gd3+ and the donor groups of the organic ligand [4]. This is influenced by the basicity of the organic ligand, the number of five-membered rings between the ion and the donor atoms of the ligand (N-Gd-N and N-Gd-O), and the macrocyclic effect [4]. Non-ionic donor atoms are less basic than ionic ones, forming weaker bonds with the gadolinium ion. The macrocyclic effect is related to the size of the cavity in the center of the complex and to the pre-organization, rigidity and conformation of the ligand [4]. Macrocyclic ligands can form very stable complexes with gadolinium because the cavity of the ring allows them to “envelope” the ion. Additionally, they benefit from a higher number of five-membered rings (eight) compared to those linear ligands (six) [4]. Nowadays, most of the administered GBCAs are of macrocyclic structure [9].
GBCAs started to be commercialized in the 1980s [4], followed shortly afterwards by the appearance of positive anomalies (enrichments) of Gd in water bodies near highly populated zones in the 1990s [10]. Of all the non-specific contrast agents in use, GBCAs are the most common in MRI due to their high stability in vivo [1], being administered to patients in 33–50% of all MRI exams globally [5,11]. For clinical purposes, GBCAs are administered to patients in concentrations of 0.1 mmol/Kg. The GBCA is administered intravenously or intra-arterially and excreted in its near entirety within the first 24 h. The complex travels through the urban wastewater systems into a wastewater treatment plant (WWTP), from where it is released into the receptor matrix without apparent retainment or elimination [12]. Because of these discharges of WWTP effluents, positive anomalies (enrichments) of Gd have been observed in water bodies near highly populated zones with advanced healthcare systems around the globe [10,13,14,15,16,17,18,19]. Pereto et al. (2023), using a model of annual flux for anthropogenic Gd (Gdanthr) consumption in European countries, determined that the estimated Gdanthr flux in Europe increased between 2014 and 2019, with an estimated 12.2 ton/year in 2015 [20]. Furthermore, a decrease in the flux of Gdanthr was observed between 2019 and 2020 due to the impact of the COVID-19 pandemic on health and care systems [20].
There are studies about GBCAs that focus on the impact that the presence of anthropogenic Gd has on some aquatic fauna [21,22,23,24]. These studies conclude that anthropogenic Gd can be accumulated by fresh-water and salt-water bivalves and that this accumulation sometimes leads to a decrease in the individual’s metabolism. On the other hand, there have not been any known studies on GBCAs’ stability in environmental conditions.
In this study, we evaluated the stability of the Gd-DOTA (DOTAREM®, Guerbet, Villepinte, France) contrast agent under different estuarine environmental conditions. This complex consists of a ligand (gadoterate) of macrocyclic structure, with four nitrogen atoms and four acetate groups (CH3COO) which form eight bonds (N-Gd-N and N-Gd-O) with the Gd3+ ion. Gd-DOTA has been reported as one of the most stable GBCAs currently in use in MRI, with determined thermodynamic stability constants in the range log Ktherm = 25.2–25.8 [4,7,25] and conditional stability constants in the range K′ = 18.8–28.0 (25 °C) [4,25,26].

2. Materials and Methods

The Type I water (18.2 MΩ) was obtained through a Sartorius purifying system, (Sartorius, Gottingen, Germany), while HNO3 (65%) and HCl (37%) were acquired from Panreac (Panreac Quimica, Castellar del Vallès, Spain). The nitric acid was distilled before use. Pellets of NaOH were obtained from Merck (Merck KGaA, Darmstadt, Germany). Ammonium acetate (4 M) was obtained from Elemental Scientific Instruments (ESI, Omaha, NE, USA). Solid Gd-DOTA was obtained from US Pharmacopeia USP, Washington, DC, USA). Certified Gd standard commercial solution with a concentration of 1000 mg/L and certified indium (In115) standard commercial solution with a concentration of 1000 μg/mL were obtained from Alfa Aesar (Alfa Aesar, Haverhill, MA, USA). Certified reference material SLRS-6 was acquired from Canada National Research Council (NRC, Ottawa, ON, Canada). Saltwater was collected from Comporta beach (Comporta, Portugal, SW Europe) on 19 November 2021.

2.1. Test Solution Preparation

Each test solution consisted of 30 mL of water fortified with 0.3 mL of Gd-DOTA solution with a concentration of 0.1 mg of Gd/L. Similarly, each test solution had a starting concentration of 1 μg Gd/L. In total, there were three types of test solutions, differing only by the salinity of the matrix. Test solutions with ultra-pure water as a matrix simulated a salinity of 0 PSU (S0), which could be obtained from freshwater bodies. Those with water from Comporta beach simulated a salinity of 36 PSU (S36), which could be obtained from the open sea, coastlines and estuaries. Finally, those with an equal mixture of the two salinities (S18) simulated transition zones, such as WWTP discharge points. These comparisons were made only in terms of salinity/ionic strength. Each test solution was prepared in triplicate.

2.2. Exposure to Temperatures

The test solutions were exposed to temperatures of 15 °C and 40 °C during periods ranging from 1 to 4 days. These temperatures were obtained by emerging the tubes containing the test solutions in thermic baths (Grant Instruments, Cambridge, MA, USA). The temperature of 15 °C represented an average of what can be found in rivers, lakes or seawater. The temperature of 40 °C represented more extreme cases that can be found, for example, in small ponds during low tide periods and after long hours of exposure to sunlight.

2.3. Exposure to pH 2, 4, 6, 8 and 10

The test solutions’ pH was monitored with a digital pH meter 913 Metrohm (Herisau, Switzerland), with a platinum electrode calibrated with reference solutions 4 and 7. Aqueous solutions of NaOH (1 mol/L and 0.1 mol/L) and HCl (1 mol/L and 0.1 mol/L) were used to alter the pH of the test solutions to the intended values. The test solutions with pH 2 were analyzed after 1 to 4 days, 18 and 36 days of exposure. The test solutions with pH 10 were analyzed after 1 to 4 days and after 36 days of exposure. The remaining test solutions with pH 4, 6 and 8 were left for 36 days before being analyzed.

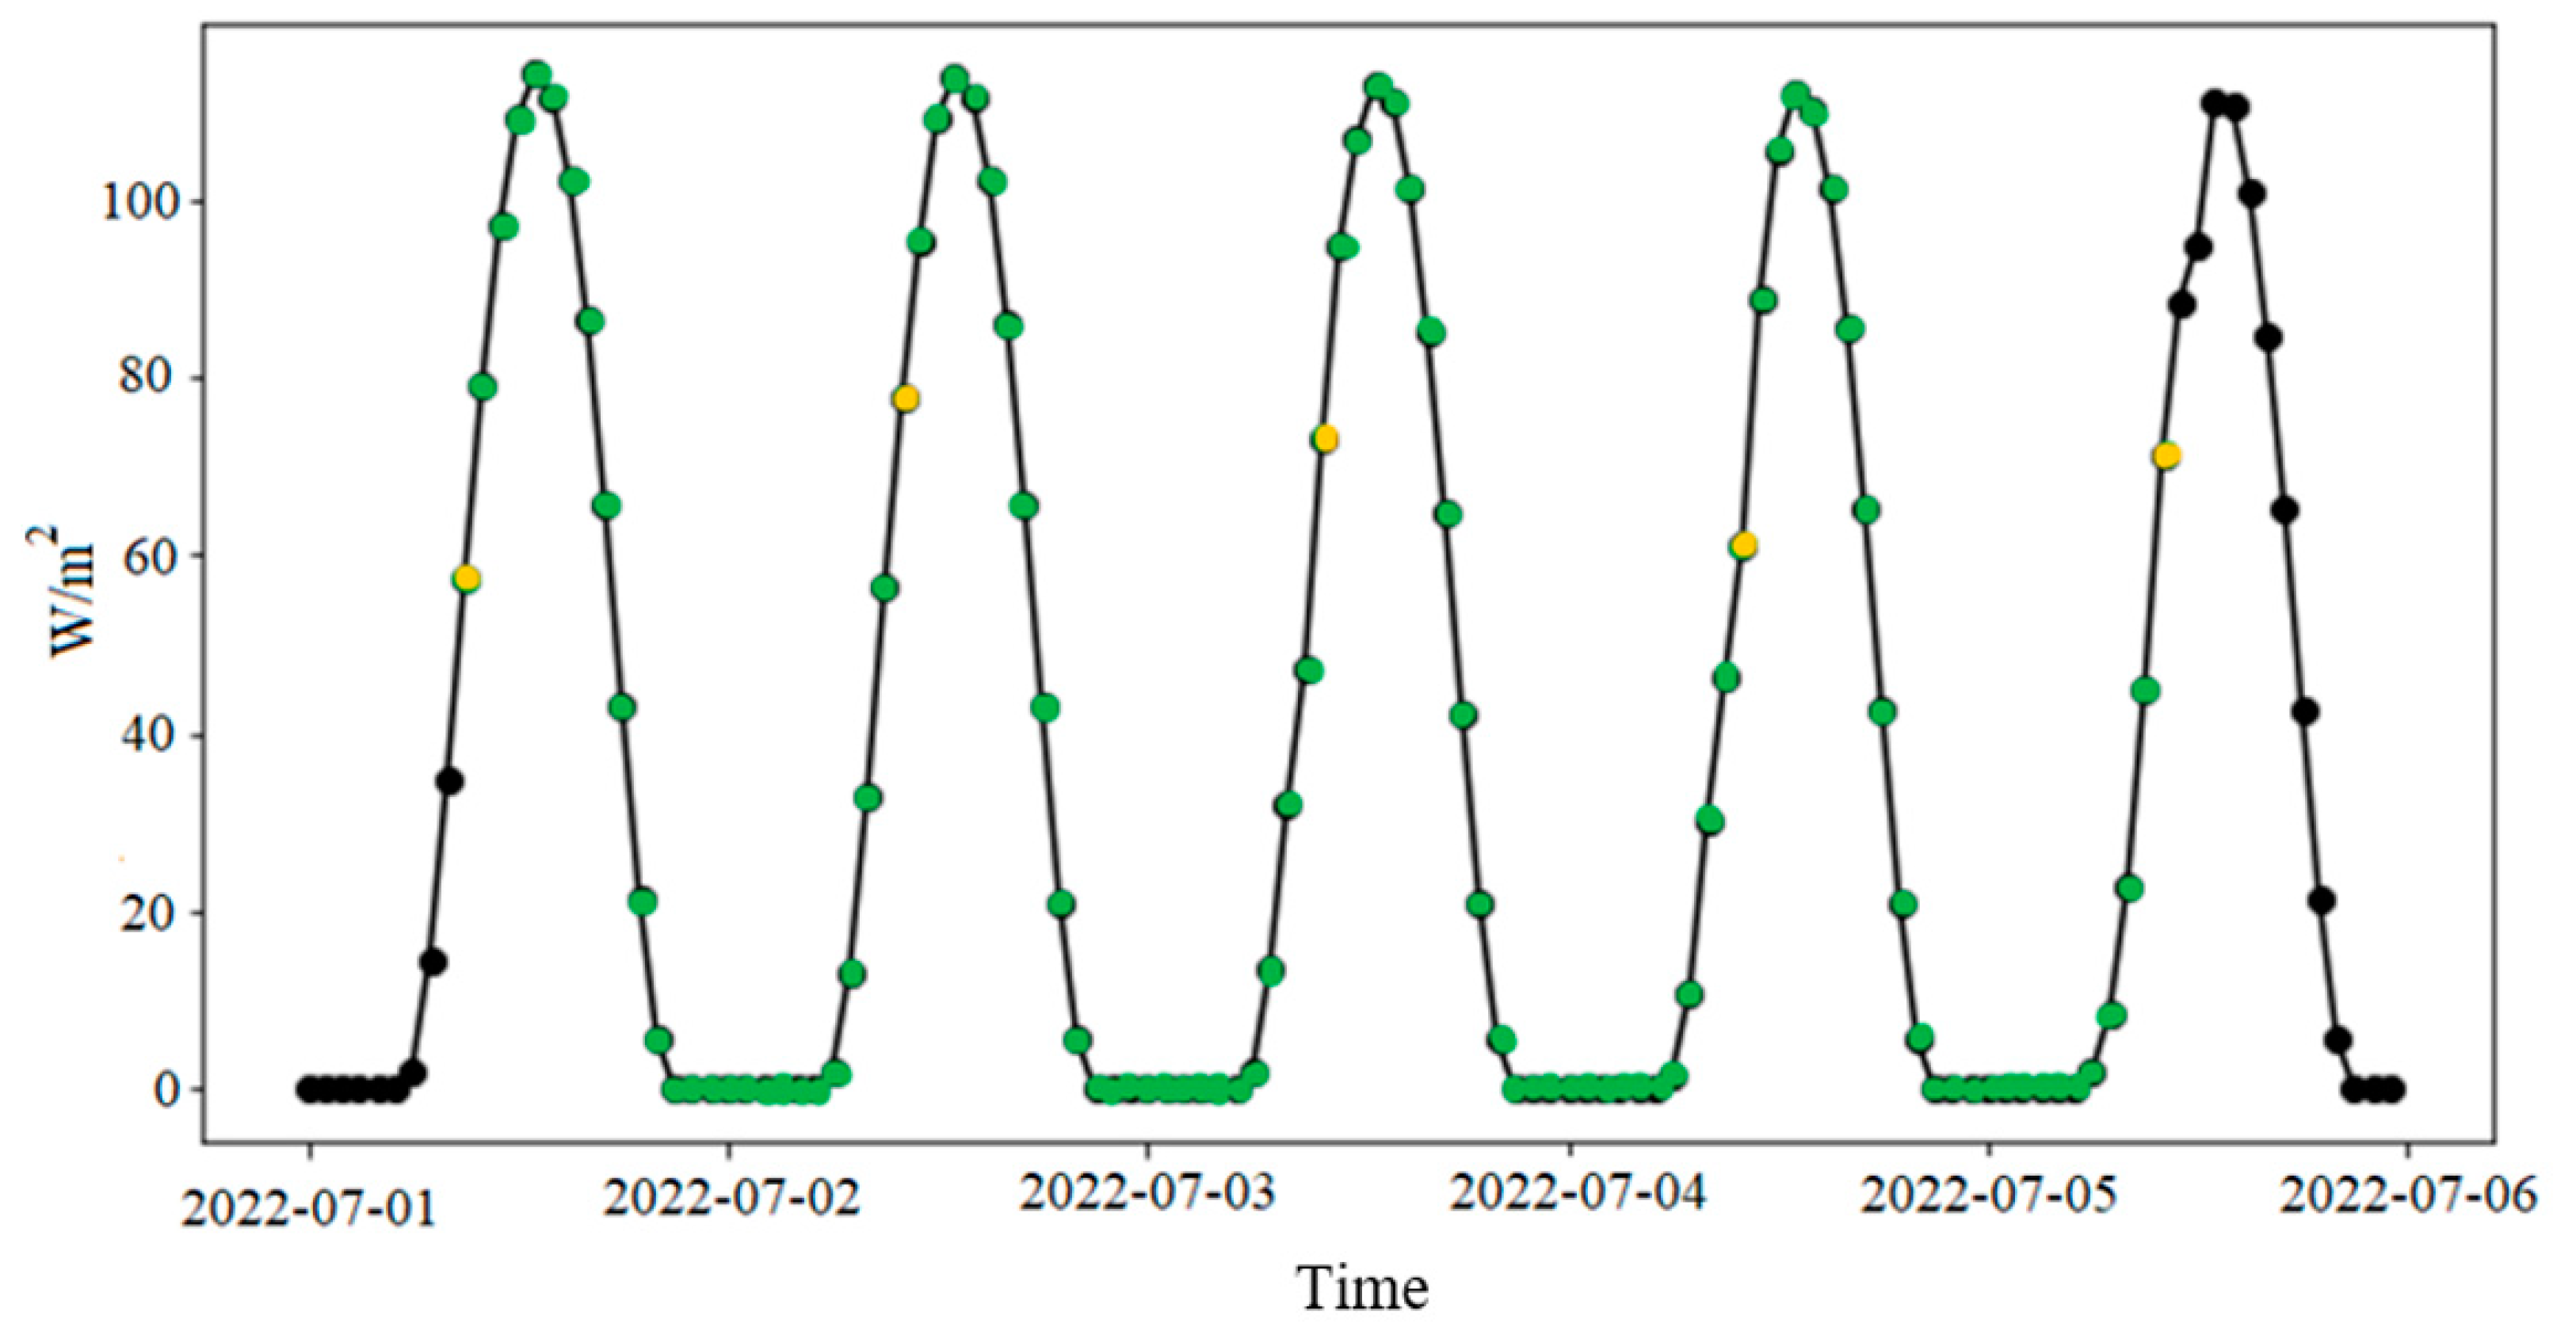
2.4. Exposure to Sunlight

For the Exposure to sunlight, 10 L of fortified water was left in plastic tanks (47 × 37 × 7 cm), with approximately 1.739 cm2 of exposed area, outdoors (on the building’s roof). Three of the tanks contained one of the three salinities each and were left exposed; the fourth one contained fortified pure water, which would be left covered and would serve as the control for salinity 0. Six test solutions were collected from each tank before the start of the experiment, and again after 1, 2, 3 and 4 days of exposure. At the time of the sampling, 30 mL of water was collected and filtered (0.45 μm, MF-MiliporeTM, Merck KGaA, Darmstadt, Germany) into plastic 50 mL tubes to remove any dust.
The data obtained of the UV hourly mean global irradiance at Algés (Lisbon, Portugal) (W/m2), measured during the days of the experiment and presented in Figure 1, were provided by the services of the Department of Meteorology and Geophysics of the Instituto Português do Mar e da Atmosfera (IPMA). Table 1 presents the UV daily mean irradiance (W/m2) calculated with the data presented in Figure 1.

2.5. Matrix Elimination and Pre-Concentration in seaFAST

After the test solutions’ exposure to the different parameters, the saline matrix was eliminated and the free Gd was concentrated through a seaFAST-pico system (ESI, Omaha, USA). During this process, 10 mL of test solution was injected into the system, passing through a chelating column in which the free Gd would be retained and then eluted in 200 μL of eluent into a polypropylene tube, thus obtaining a concentration factor of 50. This eluate was then diluted with 1.8 mL of pure water, reducing the concentration factor down to 5.
A solution of 10% HNO3 (v/v) was used as eluent and a solution of 5% HNO3 (v/v) as wash water, both prepared from distilled HNO3 65%. A solution of ammonium acetate, 4 M, was used as a buffer solution. Two replicas of the eluent were processed in the seaFAST-pico system along with the test solutions, one at the beginning and one at the end of each lot, to verify any eventual contaminations of Gd throughout the process of elimination and pre-concentration.

2.6. Gd Quantification

The test solutions were analyzed in an ICP-MS NexION 2000C (Perkin-Elmer, Waltham, MA, USA), equipped with a concentric pneumatic nebulizer, a cyclonic nebulization chamber, a quadrupole and a double detector. The isotope used for quantification was Gd158 since it is the most abundant one in nature.
A solution of Gd with a concentration of 1 mg/L was prepared from the dilution of a Gd standard commercial solution (1000 mg/L) with pure water acidified to 2% with HNO3. Six standard solutions, with concentrations ranging from 0.010 to 2.5 μg/L, were prepared from this solution. Along with a blank solution (2% HNO3), the six standard solutions were used to draw the calibration lines in the ICP-MS. All calibration lines had correlation coefficients ≥ 0.999, except for two (0.9974 and 0.9982). An indium (In) solution with a concentration of 10 μg/L, prepared from a certified in standard commercial solution (1000 μg/mL), was used as the internal standard.
For quality control, a freshwater Certified Reference Material (CRM) SLRS-6 was analyzed along with the test solutions, and the results were compared to the certified value using the performance factor Z-score, which can be calculated with Equation 1 [27]:
Z-score = (obtained value − verified value)/U
where U is the uncertainty associated with the Gd concentration in the CRM.
The method’s performance was satisfactory (|Z| < 2) throughout every analysis, except for one where it was questionable (2 < |Z| < 3). Additionally, the analysis of the seaFAST eluent (10% HNO3) was also carried out, which can be considered as a blank in the process and allowed the identification of possible Gd contaminations. Furthermore, all test solutions were analyzed in triplicate, which allowed the measurement of the precision of the analytical test.

2.7. Limit of Detection and Limit of Quantification

Instrumental analytical thresholds were calculated using the average and standard deviation obtained from the analysis of several blanks, as suggested by IUPAC 55. The instrumental limit of detection (LOD) and limit of quantification (LOQ) were calculated with the values obtained for all blanks (N = 28) analyzed throughout the study, obtaining values of 0.007 μg/L and 0.030 μg/L, respectively. Considering that in the analytical process, the test solutions were analyzed with a final concentration factor of 5, the estimated method detection limits (LODm) and method quantification limits (LOQm) were 0.0014 µg/L and 0.006 µg/L, respectively.

3. Results

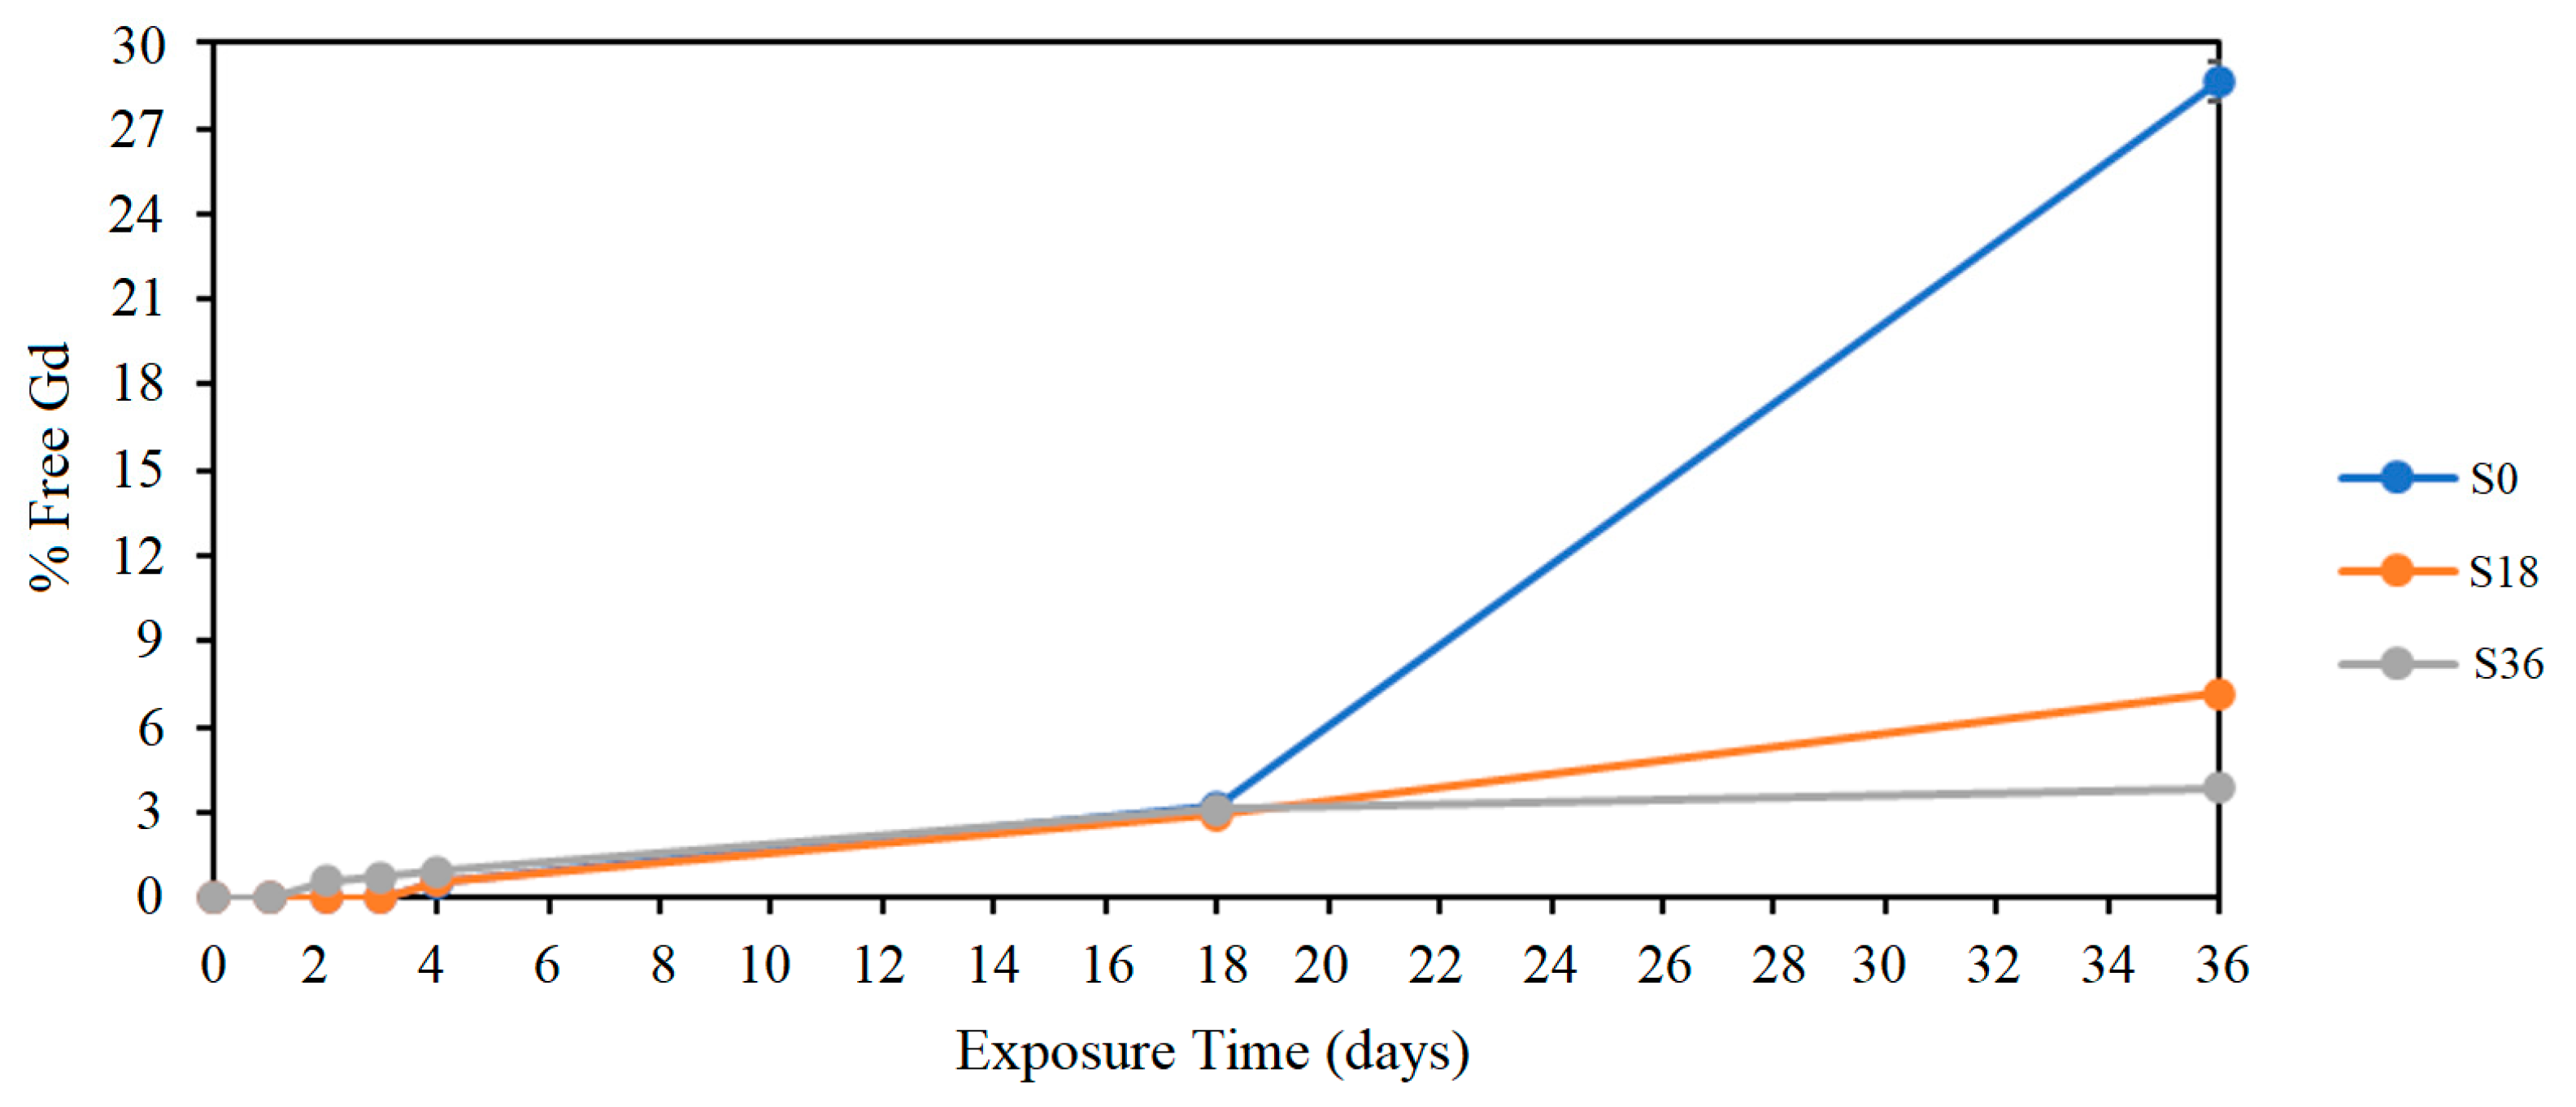
3.1. Effects of Temperature

The average concentrations of free Gd obtained in the analysis of test solutions exposed for 96 h to the temperatures of 15 and 40 °C are tabulated in Table 2. All test solutions had Gd concentrations lower than the LODm, and no variations were observed over time, which means that, even if some degradation of the complex occurred, this did not occur at sufficient levels for Gd to be detected. Thus, it can be considered that the complex remained stable after 96 h of exposure to both temperatures in all salinities.

3.2. Effect of pH

3.2.1. Exposure to pH 4, 6, 8, 10

The average free and total Gd concentrations of test solutions exposed for 36 days at pH 4, 6 and 8 are shown in Table 3. Table 4 shows the average concentrations of free and total Gd in the test solutions after the various exposure times at pH 10. As can be seen, at pH 6, 8 and 10, free Gd was not detected in the test solutions either at the exposure time 0 or after 36 days. In the test solutions exposed to pH 4, free Gd was detected in all salinities after 36 days of exposure, but not in sufficient quantity to be quantified. Thus, Gd-DOTA showed high stability at all these pH values for the three tested salinities.

3.2.2. Exposure to pH 2

Table 5 shows the average concentrations of free and total Gd obtained from the test solutions after different exposure times to pH 2. Figure 2 shows the percentages of free Gd obtained from the test solutions exposed to pH 2 over time. A continuous degradation of the complex and consequent release of Gd3+ over time was observed for all three tested salinities. Free Gd concentration became quantifiable (>0.006 μg/L) after 4 days of exposure to pH 2 for salinities 0 PSU and 18 PSU and after 2 days for salinity 36 PSU. In Figure 2, it is possible to observe that the percentage of free Gd in the test solutions is quite similar for all salinities in the first 18 days of exposure. After 4 days of exposure, there was a percentage of free Gd of 0.57 ± 0.03% at S0, 0.61 ± 0.01% at S18 and 0.95 ± 0.01% at S36. After 18 days, the percentage of free Gd was higher, at 3.20 ± 0.11% (0 PSU), 2.94 ± 0.05% (18 PSU) and 3.11 ± 0.13% (36 PSU). At the end of the 36 days of exposure, however, a significantly higher percentage of free Gd was observed at salinity 0 PSU, with a value of 28.65 ± 0.67%, when compared to the remaining salinities, 7.16 ± 0.15% (18 PSU) and 3.88 ± 0.04% (36 PSU). The degradation rates of the Gd-DOTA complex at the three salinities after 36 days of exposure to pH 2 can then be compared as follows: 0 PSU > 18 PSU > 36 PSU.

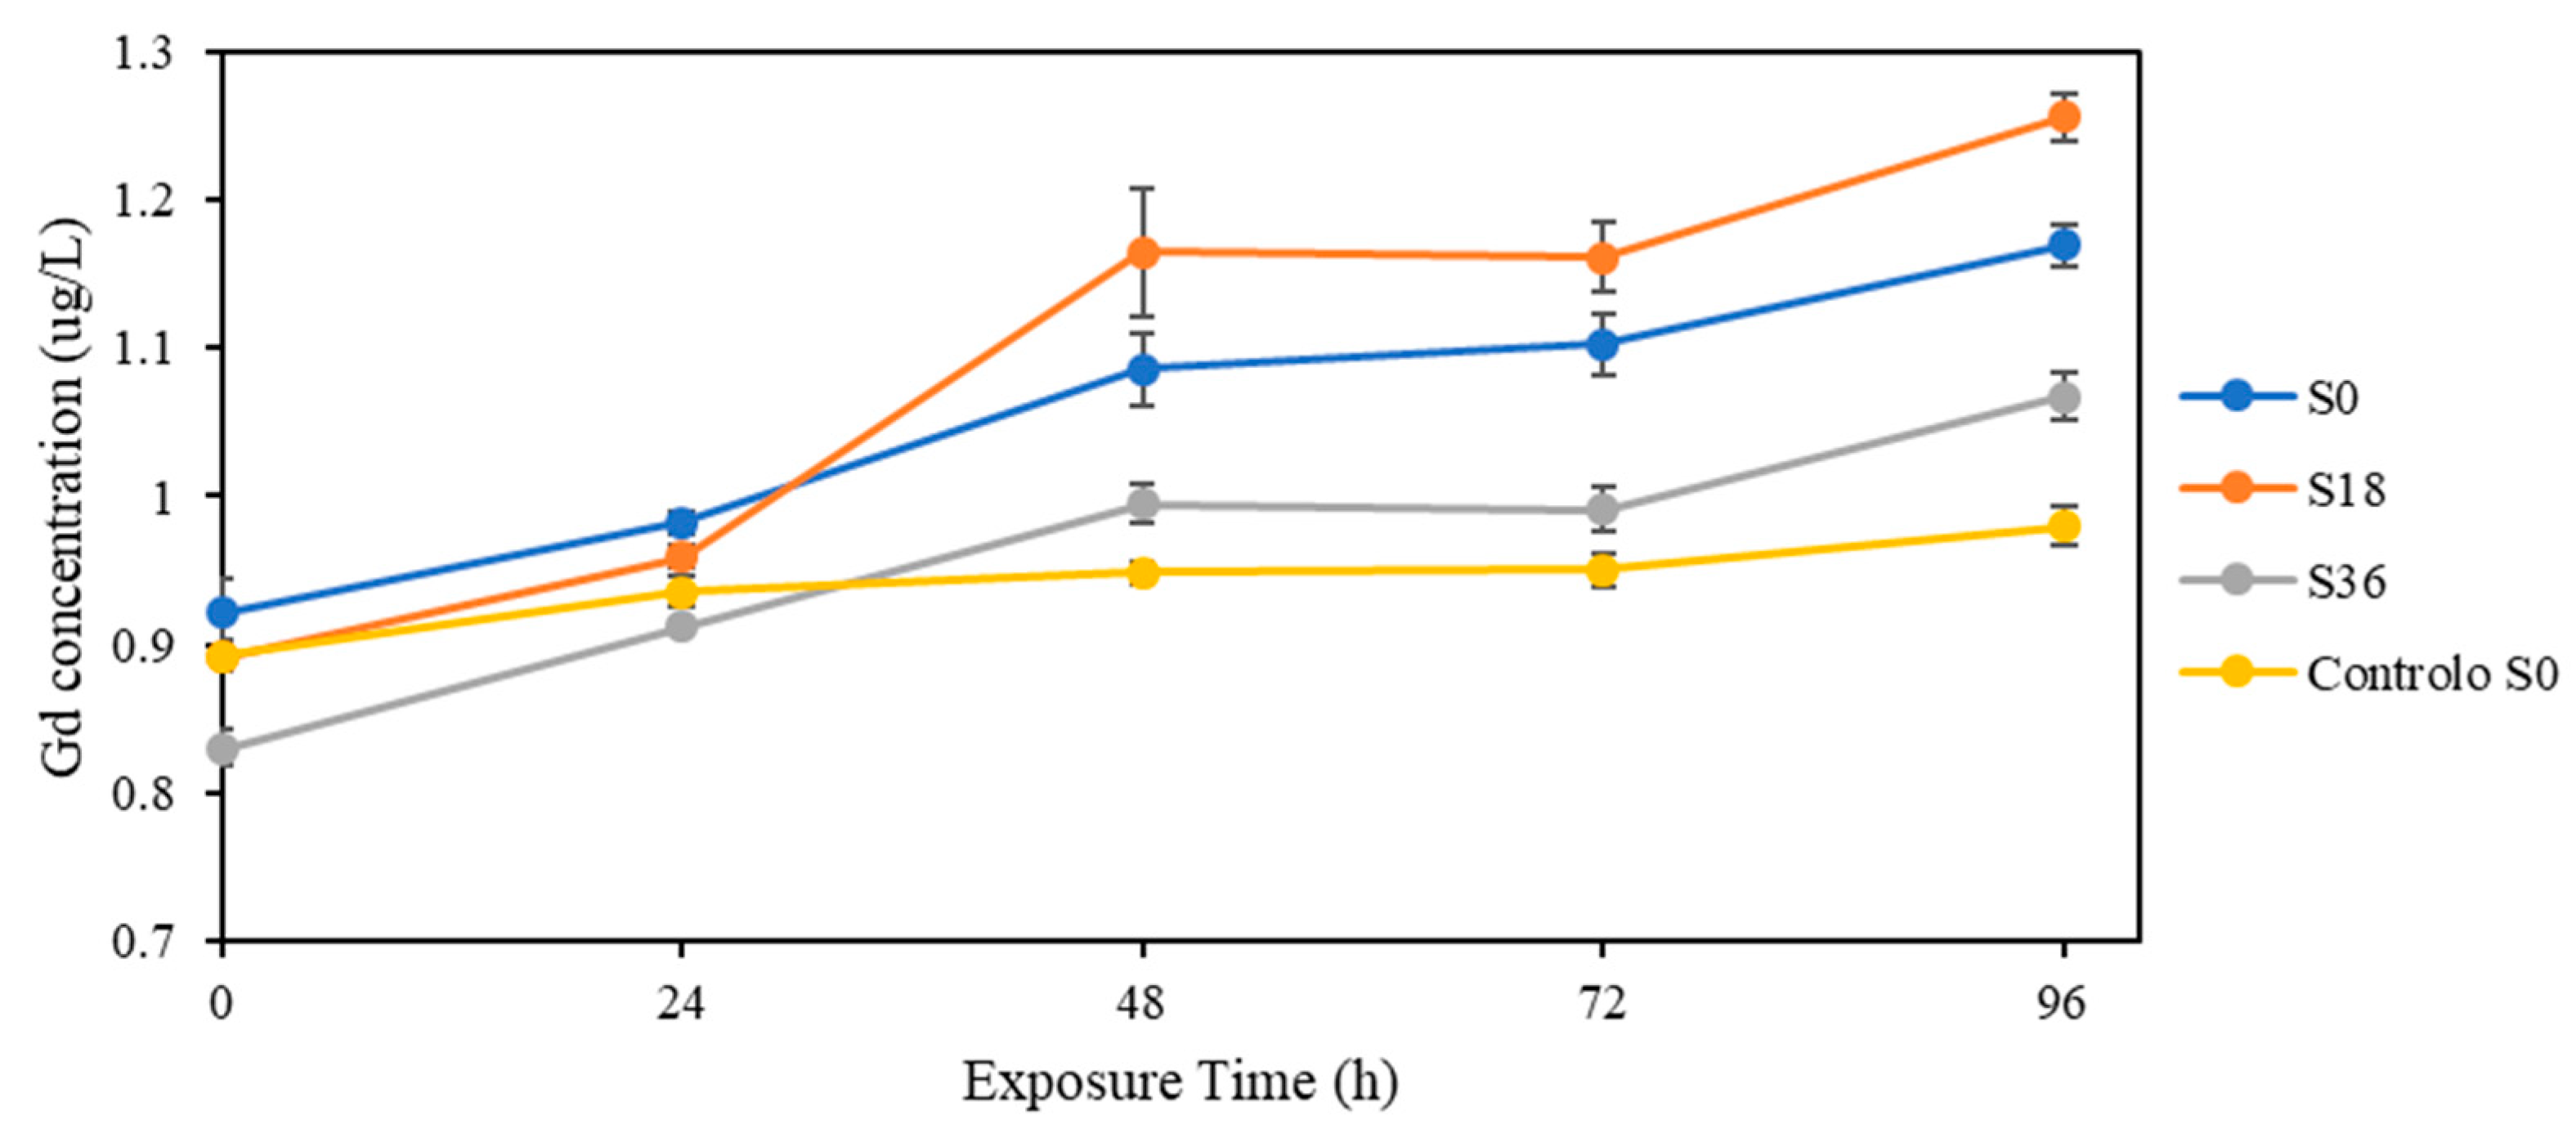
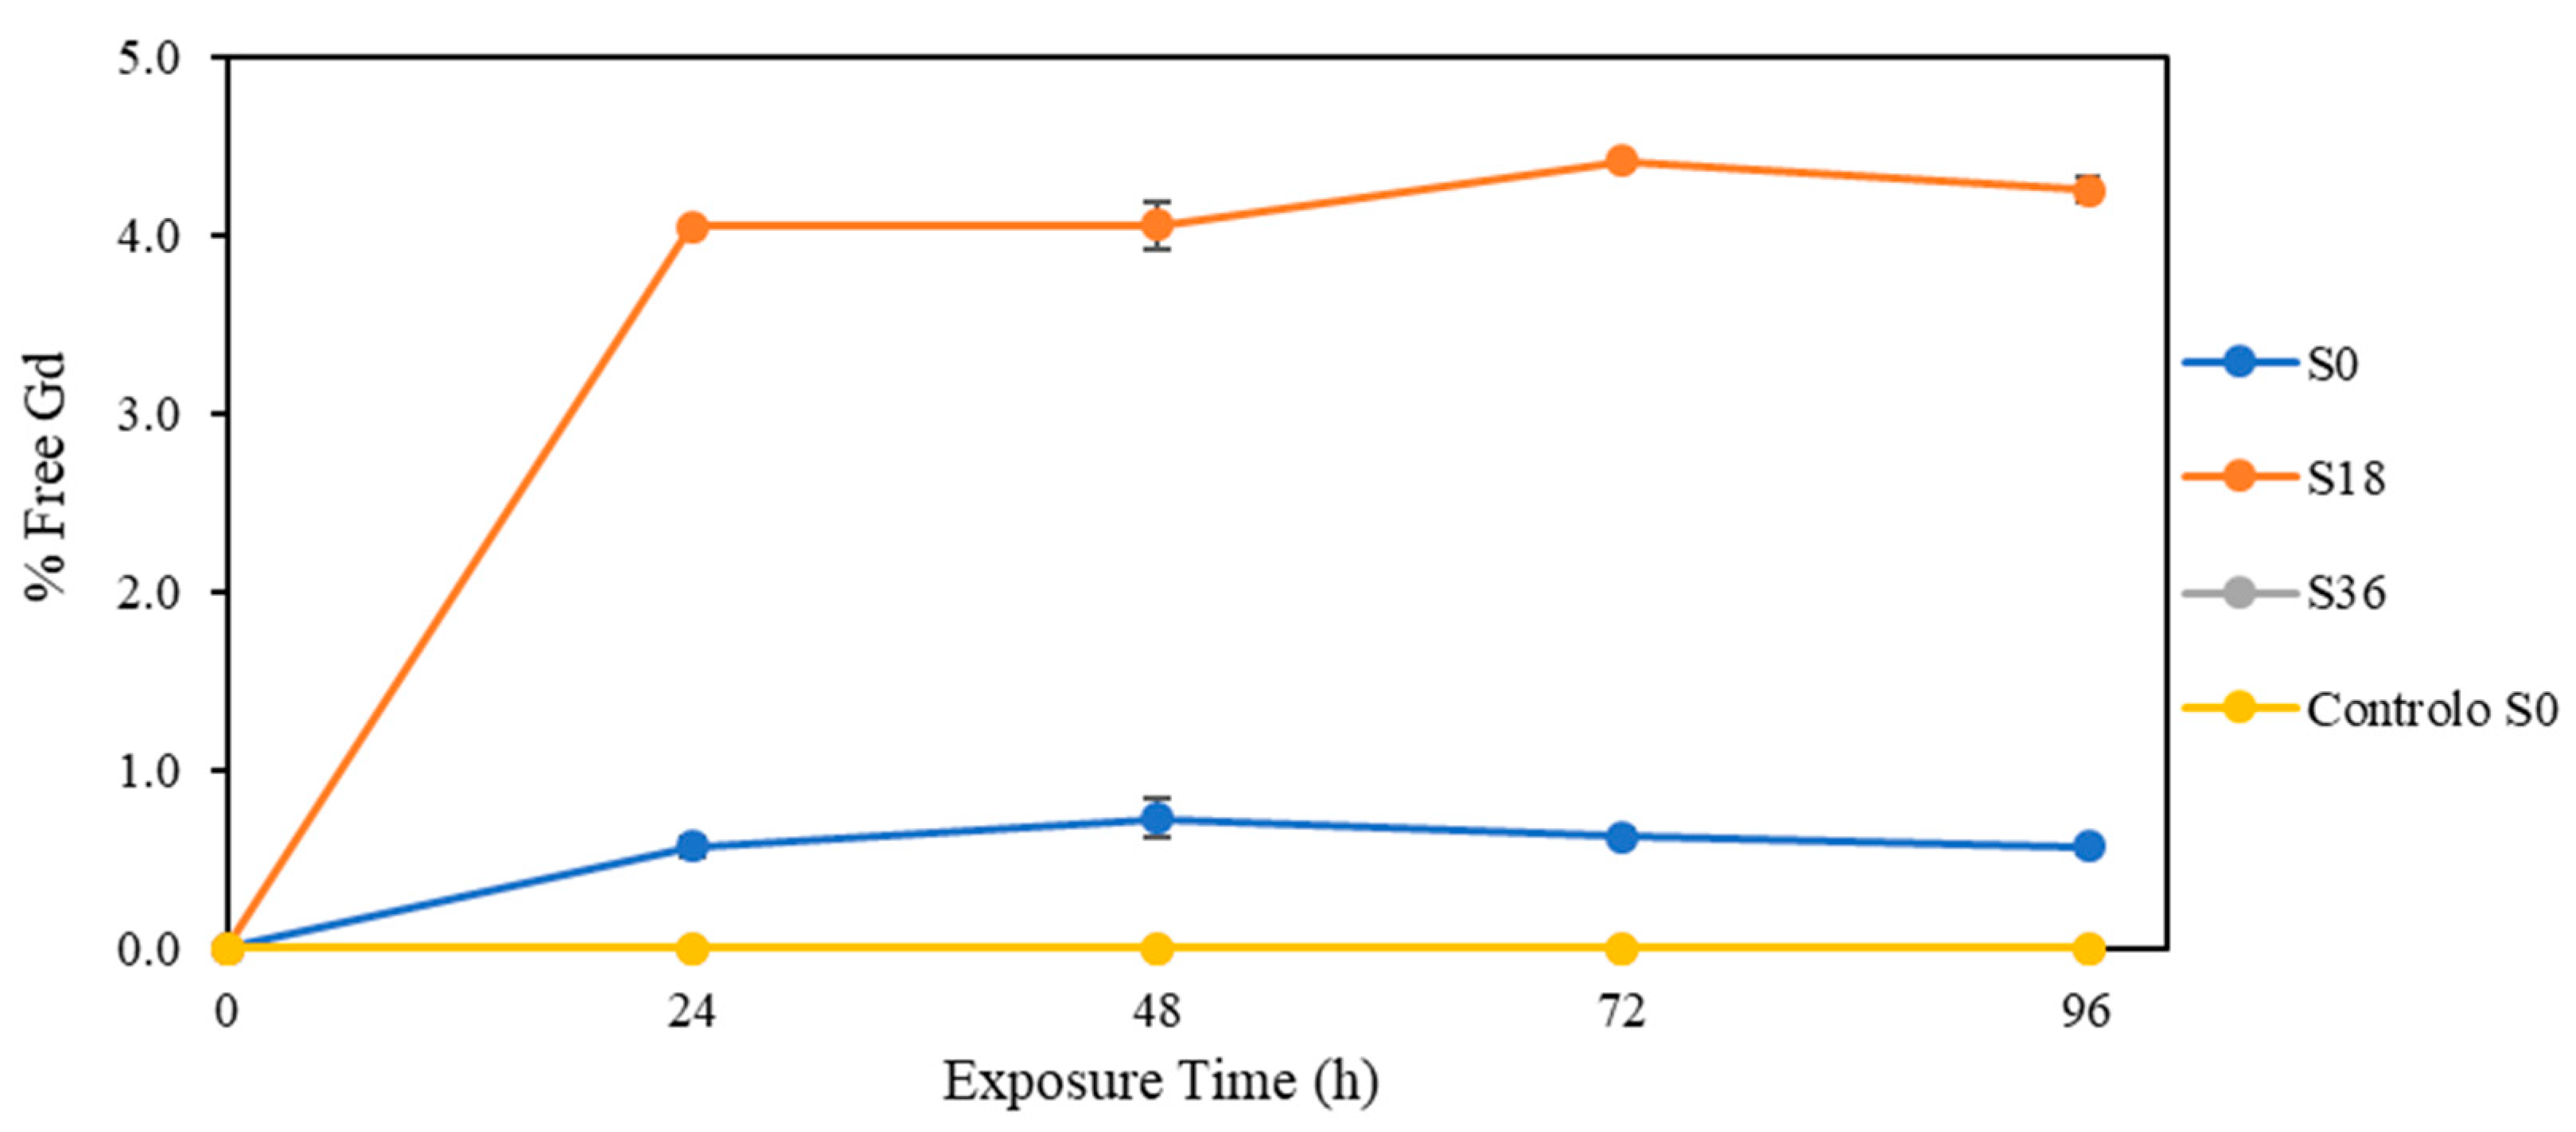
3.3. Effect of Solar Radiation

Figure 3 shows the variations in total Gd concentrations in test solutions exposed to solar radiation over time. There is an increase in total Gd concentrations in the test solutions over time, which could be associated with the eventual evaporation of water. In the 0 PSU test solution, the total Gd concentration increased from 0.940 ± 0.022 μg/L at the beginning of the experiment to 1.19 ± 0.01 μg/L after 96 h of exposure. In the test solution of 18 PSU, there was an increase from 0.910 ± 0.010 μg/L to 1.28 ± 0.02 μg/L. In the test solution of 36 PSU, there was an increase from 0.850 ± 0.014 μg/L to 1.09 ± 0.02 μg/L. As the control solution was covered during the experiment, this was the one that suffered less evaporation and, consequently, a smaller increase in the total Gd concentration (from 0.91 ± 0.01 μg/L to 1.00 ± 0.01 μg/L).
Table 6 and Figure 4 show the average concentrations of free Gd observed in the test solutions exposed to solar radiation. At the beginning of the experiment (t = 0), all the results obtained were below the LODm, that is, none of the test solutions contained enough free Gd to be detected using ICP-MS. After 96 h of exposure, the same behavior continued to be observed for the 36 PSU salinity test solutions and the 0 PSU control solution. The 0 PSU and 18 PSU test solutions showed an increase in free Gd concentrations after the first 24 h of exposure, which remained more or less constant throughout the rest of the experiment. After 24 h of exposure, in the 0 PSU salinity test solution, an average free Gd concentration of 0.006 ± 0.001 μg/L was observed, corresponding to 0.57 ± 0.06% of the total Gd. In the 18 PSU salinity test solution, the average concentration of free Gd was 0.040 ± 0.001 μg/L, corresponding to 4.05 ± 0.03% of total Gd, and after 72 h there was a concentration of free Gd of 0.052 ± 0.001 μg/L or 4.42 ± 0.04% of total Gd. Thus, after 96 h of exposure to solar radiation, it was observed that the complex remained stable at 36 PSU salinity, with a slight degradation at 0 PSU salinity and greater degradation at 18 PSU salinity.

4. Discussion

AC-Gd, as they are widely used in MRI, must be thermodynamically stable and kinetically inert in order not to undergo degradation or transmetallation, leading to the release of Gd3+ ions in the human body. However, this high stability poses a problem regarding the removal of these complexes from wastewater while passing through the WWTP. Although WWTPs have multiple levels of water treatment to remove contaminants, including membrane filtration, activated carbon adsorption, degradation by UV radiation and advanced oxidation processes [28], these are shown to be ineffective in removing AC-Gd, as is evidenced by the existence of positive Gd anomalies in water systems close to densely populated areas with very developed health care systems. Recent studies show that anthropogenic Gd has been infiltrating aquifers and tap water in various European regions [12,29,30,31]. Although the concentrations of anthropogenic Gd in tap water remain considerably low (ng/L), if the WWTP keep being ineffective in the removal of GBCA, this may prove to be a serious hazard not only to aquatic life in rivers and estuaries, but also to human health in the future [29].
Despite the relevance of these anomalies in aquatic ecosystems, few studies are known about the stability of AC-Gd after its release into the environment. Thus, this work aimed to study the degradation of the complex Gd-DOTA when exposed to various environmental parameters in a controlled environment.

4.1. Temperature

The matrix’s temperature was one of the environmental parameters studied in this work. Regarding this parameter, the results obtained demonstrate that the complex Gd-DOTA remained stable at temperatures of 15 °C and 40 °C. This high stability of Gd-DOTA at these temperatures can be attributed to the macrocyclic effect provided by the ligand, the number of donor atoms (8) in the ligand and the ionic nature of the bonds between the metal ion and the donor atoms. Thus, according to the results obtained, it is expected that the Gd-DOTA compound will remain stable given the increase in the average water temperature that may occur over the next 100 years [32]. The results are also in agreement with those of other studies, although they focus on conditions closer to those found in the human body [4]. In that study, the authors observed that Gd-DOTA remains stable at a temperature of 37 °C (pH 7.4), a temperature close to the one studied in the present work (40 °C).

4.2. pH

The pH of the matrix was another environmental parameter studied in this work. The results obtained demonstrate that the complex Gd-DOTA remained stable at pH 6, 8 and 10 (T = 20 °C). Since the pH of water (seas, rivers, oceans, etc.) is usually within this pH range (between 6 and 10), it is expected that the Gd-DOTA compound will remain stable against the acidification of sea and ocean waters that may occur over the next 100 years [32]. Once again, the results obtained for these pH values agree with those of other studies, even if these have focused on conditions closer to those found in the human body [4]. In that study, the authors observed that degradation of Gd-DOTA does not occur at pH 7.4, a value that is found between two of the pH values studied in the present work (pH 6 and 8).
In addition to the ‘slight’ change in the pH of the water caused by the dissolution of CO2 [33], acid mine drainage (AMD), resulting from mining, leads to the production of acidic, metal-rich water that is then discharged into receiving rivers [34,35]. Due to these discharges, the waters downstream of these mines can reach pH values lower than 3 [35]. However, as we move away from the AMD zone, the pH gradually increases due to the phenomenon of dilution, until it finally reaches normal values. In the present work, it was observed that, after 36 days at pH 2 (T = 20 °C, salinity = 0 PSU), 28.65 ± 0.67% of the complex had degraded, but it remained stable at pH 4 in the same period. The decrease of the complex’s stability in more acidic matrices may be associated with the protonation of the ligand. By acidifying a solution, the number of protons in the solution increases. When a certain pH value is reached, non-protonated organic species (bases) with a pKa higher than the new pH begin to ‘gain electrons’ until a new thermodynamic equilibrium is reached. In solution, at pH ≥ 6, the organic ligand of Gd-DOTA is in its non-protonated phase, with a −3 charge, which is neutralized by the +3 charge of the gadolinium ion. Decreasing the pH of the matrix leads to the protonation of the ligand’s carbonate groups, weakening the bond with the metal ion and destabilizing the complex. Thus, the lower the pH of the matrix, the greater the number of protons in the solution that will join the carbonate groups of Gd-DOTA and the greater the rate of degradation of the complex (the lower its kinetic stability is). The results obtained agree with the results of other studies [4,36] which report that Gd-DOTA is much less stable at more acidic pH, attributing half-life times (at T = 25 °C) of 338 h at pH 1 and 85 days at pH 2.

4.3. Salinity

The matrix’s salinity was also one of the factors considered for studying the stability of Gd-DOTA. As such, the variation of this parameter was present in all tests carried out throughout this study. According to the results obtained, the matrix’s salinity does not seem to have influenced the stability of the complex at temperatures of 15 °C and 40 °C or different conditions of pH ≥ 6. This fact appears as a consequence of the high stability of Gd-DOTA in this pH range, provided by the geometry and strength of the bonds between the metallic ion and the donor atoms. On the other hand, the results also demonstrated that, at pH ≤ 4, when the complex becomes less stable due to the protonation of the acetate groups of the ligand, the degradation rate is more pronounced in matrices of lower salinity. This is due to the ‘ionic strength’ of the matrix, which is proportional to the concentration of salts and has an effect on the activity of the species in solution. When a solution has a concentration of species equal to or very close to zero (0 PSU), it tends to behave like an ideal solution, and the activity coefficient of the species, in this case of Gd-DOTA, is equal to 1 and its activity is equal to its concentration. In other words, at 0 PSU, there are no barriers between the complex and the protons, and protonation takes place more easily and quickly. On the other hand, in a solution with higher salinity (18 and 36 PSU), the activity of the complex is lower because the large amount of ions in the solution causes them to form a ‘barrier’ around the complex that will hinder the protons’ access. Consequently, the protonation of the complex occurs more slowly, as verified in the results obtained.

4.4. Solar Radiation

Regarding the stability of the Gd complex when exposed to solar radiation, there are still few studies that have focused on this topic. Birka et al. (2016) conducted a study on the stability of some gadolinium contrast agents, including Gd-DOTA, when exposed to UV radiation [37]. In that study, Gd-DOTA, along with three other AC-Gd, were exposed to UV radiation of wavelengths in the range of 220–500 nm, for 90 min. The results showed that Gd-DOTA remains stable when exposed to UV radiation in this short time. Additionally, the Gd-BOPTA complex was the only one of the AC-Gd studied that underwent degradation, due to the aromatic ring in its structure that absorbs radiation in the wavelength range used. In the present work, Gd-DOTA was exposed not only to UV radiation but to total solar radiation (UV, IR, visible, X-rays and gamma rays) and for a longer period (96 h).
At 0 PSU salinity, a degradation of only 0.60 ± 0.06% of Gd-DOTA was observed after 24 h of exposure, a value that remained more or less constant, with no significant differences observed throughout the rest of the 96 exposure hours. At the salinity of 36 PSU, no degradation of the complex was observed, contrary to what occurred at the salinity of 18 PSU, where degradation of about 4.4 ± 0.04% of the complex was observed. In the study by Birka et al. (2016), the authors did not observe any degradation from Gd-DOTA in any of the four matrices used (ultra-pure water, surface water, filtered surface water and drinking water). They did, however, observe degradation from one other GBCA in ultra-pure water [37]. The explanation given by the authors of that study was that there was the possibility of organic compounds existing in other waters (surface water, filtered surface water and drinking water) that could absorb radiation. By this logic, since the organic composition of the water collected from Praia da Comporta is unknown, it would be possible that it contained compounds that adsorbed part of the solar radiation. Since the salinity of 18 PSU is an intermediate level between the salinities 0 and 36 PSU, it was expected that the results obtained for this salinity would also be an intermediate value of the values obtained for the other two salinities, as observed during the study of the pH. However, this was not the case, and this fact may be a consequence of the conditions to which the test solutions were exposed during this phase and over which there was no control, namely, the possible deposition of atmospheric dust at the bottom of the tanks and insects small enough to fit through the holes in the net that were found floating on the surface in the water. Thus, the best course of action would be to repeat the experiment under more controlled conditions, avoiding contamination of the test solutions by external agents, which could alter the obtained results.

5. Conclusions

This work was carried out to study the stability of the complex Gd-DOTA when exposed to different environmental conditions. Matrix elimination and pre-concentration in a seaFAST system followed by analysis in a ICP-MS system proved to be an efficient method to differentiate free Gd3+ from complexed Gd. From the obtained results, it can be concluded that the Gd-DOTA complex remains stable at temperatures and pH values usually found in estuarine environments, namely, from 15 °C to 40 °C and pH ≥ 6 (T = 20 °C). However, it is unconclusive whether the complex maintains its stability when it is released into the environment and is exposed to solar radiation, since a considerable amount of free Gd3+ was detected in the S18 samples after 24 h of exposure but not in either of the other salinities. For this reason, in order to reach a decisive conclusion about whether or not Gd-DOTA remains stable after being discarded into nature, it will be necessary to carry out the radiation experiment in a more controlled environment in the future.
Although some of the results obtained during the radiation experiment do not allow us to determine whether Gd-DOTA remains 100% stable in estuarine environments, this work can still be seen as a starting point to gain knowledge on this matter.

Author Contributions

Conceptualization, P.B.; Methodology, A.G. and P.B.; Validation, A.G. and P.B.; Formal analysis, A.G.; Investigation, A.G.; Resources, P.B.; Writing—original draft, A.G.; Writing—review & editing, P.B.; Visualization, A.G.; Supervision, P.B. All authors have read and agreed to the published version of the manuscript.

Funding

This research received no external funding.

Data Availability Statement

The data presented in this study are openly available in Repositório da Universidade de Lisboa at http://hdl.handle.net/10451/56635 (accessed on 20 November 2023).

Conflicts of Interest

The authors declare no conflict of interest.

References

  1. Bellin, M.F. MR contrast agents, the old and the new. Eur. J. Radiol. 2006, 60, 314–323. [Google Scholar] [CrossRef]
  2. Shellock, F.G.; Kanal, E. Safety of magnetic resonance imaging contrast agents. J. Magn. Reson. Imag. 1999, 10, 477–484. [Google Scholar] [CrossRef]
  3. Tweedle, M.F.; Wedeking, P.; Kumar, K. Biodistribution of Radiolabeled, Formulated Gadopentetate, Gadoteridol, Gadoterate, and Gadodiamide in Mice and Rats. Investig. Radiol. 1995, 30, 372–380. [Google Scholar] [CrossRef]
  4. Idée, J.M.; Port, M.; Robic, C.; Medina, C.; Sabatou, M.; Corot, C. Role of thermodynamic and kinetic parameters in gadolinium chelate stability. J. Magn. Reson. Imaging 2009, 30, 1249–1258. [Google Scholar] [CrossRef]
  5. Idée, J.M.; Port, M.; Raynal, I.; Schaefer, M.; Le Greneur, S.; Corot, C. Clinical and biological consequences of transmetallation induced by contrast agents for magnetic resonance imaging: A review. Fundam. Clin. Pharmacol. 2006, 20, 563–576. [Google Scholar] [CrossRef]
  6. Kanal, E. Gadolinium based contrast agents (GBCA): Safety overview after 3 decades of clinical experience. Magn. Reson. Imaging 2016, 34, 1341–1345. [Google Scholar] [CrossRef] [PubMed]
  7. Brücher, E. Kinetic Stabilities of Gadolinium(III) Chelates Used as MRI Contrast Agents. In Top Current Chemestry; Werner, K., Ed.; Springer: Berlin, Germany, 2002; pp. 103–122. [Google Scholar]
  8. Port, M.; Idée, J.-M.; Medina, C.; Robic, C.; Sabatou, M.; Corot, C. Efficiency, thermodynamic and kinetic stability of marketed gadolinium chelates and their possible clinical consequences: A critical review. BioMetals 2008, 21, 469–490. [Google Scholar] [CrossRef] [PubMed]
  9. European Medicines Agency. EMAs-Final-Opinion-Confirms-Restrictions-Use-Linear-Gadolinium-Agents; European Medicines Agency: Amsterdam, The Netherlands, 2017.
  10. Bau, M.; Dulski, E.P.S.L. Anthropogenic origin of positive gadolinium anomalies in river waters. Earth Planet. Sci. Lett. 1996, 143, 245–255. [Google Scholar] [CrossRef]
  11. Thomsen, H.S. Are the increasing amounts of gadolinium in surface and tap water dangerous? Acta Radiol. 2017, 58, 259–263. [Google Scholar] [CrossRef] [PubMed]
  12. Brünjes, R.; Hofmann, T. Anthropogenic gadolinium in freshwater and drinking water systems. Water Res. 2020, 182, 115966. [Google Scholar] [CrossRef] [PubMed]
  13. Elbaz-Poulichet, C.; Seidel, J.-L.; Othoniel, C. Occurrence of an anthropogenic gadolinium anomaly in river and coastal waters of Southern France. Water Res. 2002, 36, 1102–1105. [Google Scholar] [CrossRef]
  14. Rabiet, M.; Brissaud, F.; Seidel, J.L.; Pistre, S.; Elbaz-Poulichet, F. Positive gadolinium anomalies in wastewater treatment plant effluents and aquatic environment in the Hérault watershed (South France). Chemosphere 2009, 75, 1057–1064. [Google Scholar] [CrossRef] [PubMed]
  15. Klaver, G.; Verheul, M.; Bakker, I.; Petelet-Giraud, E. Négrel Anthropogenic Rare Earth Element in rivers: Gadolinium and lanthanum. Partitioning between the dissolved and particulate phases in the Rhine River and spatial propagation through the Rhine-Meuse Delta (the Netherlands). Appl. Geochem. 2014, 47, 186–197. [Google Scholar] [CrossRef]
  16. Bau, M.; Knappe, A. Dulski Anthropogenic gadolinium as a micropollutant in river waters in Pennsylvania and in Lake Erie, northeastern United States. Chem. Der Erde. 2006, 66, 143–152. [Google Scholar] [CrossRef]
  17. Knappe, A.; Möller, P.; Dulski, P.; Pekdeger, A. Positive gadolinium anomaly in surface water and ground water of the urban area Berlin, Germany. Chem. Der Erde. 2005, 65, 167–189. [Google Scholar] [CrossRef]
  18. Da Costa, A.R.B.; Rousseau, T.C.C.; Maia, P.D.; Amorim, A.M.; Sodré, F.F.; Teixeira, C.E. Anthropogenic gadolinium in estuaries and tropical Atlantic coastal waters from Fortaleza, Northeast Brazil. Appl. Geochem. 2021, 127, 104908. [Google Scholar] [CrossRef]
  19. Nozaki, Y.; Lerche, D.; Alibo, D.S.; Tsutsumi, M. Dissolved indium and rare earth elements in three Japanese rivers and Tokyo Bay: Evidence for anthropogenic Gd and In. Geochim. Cosmochim. Acta 2000, 64, 3975–3982. [Google Scholar] [CrossRef]
  20. Pereto, C.; Lerat-Hardy, A.; Baudrimont, M.; Coynel, A. European fluxes of medical gadolinium to the ocean: A model based on healthcare databases. Environ. Int. Internet 2023, 173, 107868. [Google Scholar] [CrossRef]
  21. Braun, M.; Zavanyi, G.; Laczovics, A.; Berényi, E.; Szabó, S. Can aquatic macrophytes be biofilters for gadolinium based contrasting agents? Water Res. 2018, 135, 104–111. [Google Scholar] [CrossRef]
  22. Henriques, B.; Coppola, F.; Monteiro, R.; Pinto, J.; Viana, T.; Pretti, C.; Soares, A.; Freitas, R.; Pereira, E. Toxicological assessment of anthropogenic Gadolinium in seawater: Biochemical effects in mussels Mytilus galloprovincialis. Sci. Total Environ. 2019, 664, 626–634. [Google Scholar] [CrossRef]
  23. Perrat, E.; Parant, M.; Py, J.-S.; Rosin, C.; Cossu-Leguille, C. Bioaccumulation of gadolinium in freshwater bivalves. Environ. Sci. Pollut. Res. 2017, 24, 12405–12415. [Google Scholar] [CrossRef] [PubMed]
  24. Pereto, C.; Coynel, A.; Lerat-Hardy, A.; Gourves, P.-Y.; Schäfer, J.; Baudrimont, M. Corbicula fluminea: A sentinel species for urban Rare Earth Element origin. Sci. Total Environ. 2020, 732, 138552. [Google Scholar] [CrossRef] [PubMed]
  25. Haneder, S.; Kucharczyk, W.; Schoenberg, S.O.; Michaely, H.J. Safety of Magnetic Resonance Contrast Media: A Review With Special Focus on Nephrogenic Systemic Fibrosis. Top. Magn. Reson. Imaging 2015, 24, 57–65. [Google Scholar] [CrossRef] [PubMed]
  26. Bianchi, A.; Calabi, L.; Corana, F.; Fontana, S.; Losi, P.; Maiocchi, A.; Paleari, M.; Valtancoli, B. Thermodynamic and structural properties of Gd(III) complexes with polyamino-polycarboxylic ligands: Basic compounds for the development of MRI contrast agents [Internet]. Coord. Chem. Rev. 2000, 204, 292–309. [Google Scholar] [CrossRef]
  27. Brookman, B.; Mann, I. Eurachem Guide: Selection, Use and Interpretation of Proficiency Testing (PT) Schemes, 3rd ed.; Laboratory of the Government Chemis: Middlesex, UK, 2021. [Google Scholar]
  28. Ribeiro, A.R.; Pedrosa, M.; Moreira, N.F.F.; Pereira, M.F.R.; Silva, A.M.T. Environmental friendly method for urban wastewater monitoring of micropollutants defined in the Directive 2013/39/EU and Decision 2015/495/EU. J. Chromatogr. A 2015, 1418, 140–149. [Google Scholar] [CrossRef]
  29. Wysocka, I.A.; Rogowska, A.M.; Kostrz-Sikora, A. Investigation of anthropogenic gadolinium in tap water of polish cities: Gdańsk, Kraków, Warszawa, and Wrocław. Environ. Pollut. 2023, 323, 121289. [Google Scholar] [CrossRef]
  30. Bichler, A.; Muellegger, C.; Brünjes, R.; Hofmann, T. Quantification of river water infiltration in shallow aquifers using acesulfame and anthropogenic gadolinium. Hydrol. Process. 2016, 30, 1742–1756. [Google Scholar] [CrossRef]
  31. Birka, M.; Wehe, C.A.; Hachmöller, O.; Sperling, M.; Karst, U. Tracing gadolinium-based contrast agents from surface water to drinking water by means of speciation analysis. J. Chromatogr. A 2016, 1440, 105–111. [Google Scholar] [CrossRef]
  32. Masson-Delmotte, V.; Zhai, P.; Pirani, A.; Connors, S.L.; Péan, C.; Chen, Y.; Goldfarb, L.; Gomis, M.I.; Matthews, J.B.R.; Berger, S.; et al. (Eds.) Working Group I Contribution to the Sixth Assessment Report of the Intergovernmental Panel on Climate Change; Cambridge University Press: Cambridge, UK; New York, NY, USA, 2021. [Google Scholar]
  33. Appelo, C.A.J.; Postma, D. Geochemistry, Groundwater and Pollution; Routledge: Oxford, UK, 2005. [Google Scholar]
  34. Candeias, C.; Ávila, P.F.; Da Silva, E.F.; Ferreira, A.; Salgueiro, A.R.; Teixeira, J. Acid mine drainage from the Panasqueira mine and its influence on Zêzere river (Central Portugal). J. Afr. Earth Sci. 2014, 99, 705–712. [Google Scholar] [CrossRef]
  35. Olías, M.; Cánovas, C.R.; Basallote, M.D.; Lozano, A. Geochemical behaviour of rare earth elements (REE) along a river reach receiving inputs of acid mine drainage. Chem. Geol. 2018, 493, 468–477. [Google Scholar] [CrossRef]
  36. Wang, X.; Jin, T.; Comblin, V.; Lopez-Mut, A.; Merciny, E.; Desreux, J.F. A kinetic investigation of the lanthanide DOTA chelates. Stability and rates of formation and of dissociation of a macrocyclic gadolinium (III) polyaza polycarboxylic MRI contrast agent. Inorg. Chem. Internet 1992, 31, 1095–1099. [Google Scholar] [CrossRef]
  37. Birka, M.; Roscher, J.; Holtkamp, M.; Sperling, M.; Karst, U. Investigating the stability of gadolinium-based contrast agents towards UV radiation. Water Res. 2016, 91, 244–250. [Google Scholar] [CrossRef] [PubMed]
Figure 1. Graphical representation of the UV hourly mean global irradiance (W/m2) on the days of the experiment (from 1 July 2022 to 5 July 2022) at Algés. Data provided by IPMA. Green—period of exposure; yellow—sampling times; black—values measured outside the exposure trial.
Oceans 04 00026 g001
Figure 2. Percentage of free Gd in the test solutions exposed to pH 2, in the three salinities.
Oceans 04 00026 g002
Figure 3. Concentrations of total Gd (µg/L) in the test solutions over exposure time to direct sunlight.
Oceans 04 00026 g003
Figure 4. Percentage of free Gd in the test solutions exposed to direct sunlight, in the three salinities, plus control test solution (S36 results are overlapped by the Control S0 results).
Oceans 04 00026 g004
Table 1. UV daily mean irradiance (W/m2) during the radiation experiment.
Exposure DaysUV Daily Mean Irradiance (W/m2)
1st day39.2
2nd day38.5
3rd day37.8
4th day36.5
Table 2. Average concentrations of free and total Gd after exposure to the temperatures of 15 and 40 °C.
Temperature 15 °CTemperature 40 °C
Salinity (PSU)Exposure Time (Days)[Gd]free (μg/L)[Gd]total (μg/L)Salinity (PSU)Exposure Time (Days)[Gd]free (μg/L)[Gd]total (μg/L)
00<LODm1.14 ± 0.0200<LODm1.19 ± 0.02
11
22
33
44
180<LODm1.02 ± 0.02180<LODm1.04 ± 0.03
11
22
33
44
360<LODm0.92 ± 0.07360<LODm1.05 ± 0.05
11
22
33
44
Table 3. Average concentrations of free and total Gd after exposure to pH 4, 6 and 8 (T = 20 °C).
Salinity
(PSU)
pHExposure
Time
(Days)
[Gd]free
(μg/L)
[Gd]total
(μg/L)
040<LODm
<LOQm
1.12 ± 0.02
36
60<LODm
36
80
36
1840<LODm
<LOQm
1.04 ± 0.03
36
60<LODm
36
80
36
3640<LODm
<LOQm
1.00 ± 0.04
36
60<LODm
36
80
36
Table 4. Average concentrations of free and total Gd after exposure to pH 10 (T = 20 °C).
Salinity
(PSU)
Exposure
Times (Days)
[Gd]free
(μg/L)
[Gd]total
(μg/L)
00<LODm1.09 ± 0.02
1
2
3
4
36
180<LODm1.00 ± 0.05
1
2
3
4
36
360<LODm0.95 ± 0.03
1
2
3
4
36
Table 5. Average concentrations of free and total Gd after exposure to pH 2 (T = 20 °C).
Salinity
(PSU)
Exposure
Time (Days)
[Gd]average
(μg/L)
[Gd]total
(μg/L)
00<LOQm1.12 ± 0.02
360.31 ± 0.01
1<LOQm1.15 ± 0.02
2<LOQm
3<LOQm
40.007 ± 3 × 10⁻⁴
180.037 ± 0.001
180<LOQm1.04 ± 0.03
360.074 ± 0.001
1<LOQm1.04 ± 0.02
2<LOQm
3<LOQm
40.006 ± 1 × 10⁻⁴
180.030 ± 0.001
360<LOQm1.00 ± 0.04
360.039 ± 4 × 10⁻⁴
1<LOQm1.01 ± 0.05
20.006 ± 3 × 10⁻⁵
30.008 ± 0.003
40.010 ± 8 × 10⁻⁵
180.031 ± 0.001
Table 6. Average concentrations of free and total Gd after exposure to direct sunlight.
SalinityExposure
Time (Days)
[Gd]free
(μg/L)
[Gd]total
(μg/L)
00<LODm0.94 ± 0.02
240.006 ± 0.0011.00 ± 0.01
480.008 ± 0.0011.11 ± 0.03
720.007 ± 0.0011.13 ± 0.02
960.007 ± 0.0041.19 ± 0.01
180<LODm0.91 ± 0.01
240.040 ± 0.00030.98 ± 0.01
480.048 ± 0.0021.19 ± 0.04
720.052 ± 0.0011.19 ± 0.02
960.054 ± 0.0011.28 ± 0.02
360<LODm
<LODm
0.85 ± 0.01
240.93 ± 0.00
48<LOQm1.02 ± 0.01
721.01 ± 0.02
961.09 ± 0.02
Control (S0)0<LODm
0.91 ± 0.01
240.96 ± 0.01
480.97 ± 0.01
720.97 ± 0.01
961.00 ± 0.01
Disclaimer/Publisher’s Note: The statements, opinions and data contained in all publications are solely those of the individual author(s) and contributor(s) and not of MDPI and/or the editor(s). MDPI and/or the editor(s) disclaim responsibility for any injury to people or property resulting from any ideas, methods, instructions or products referred to in the content.

