Influence of Seawater Ageing on Fracture of Carbon Fiber Reinforced Epoxy Composites for Ocean Engineering


Abstract

1. Introduction
2. Materials
3. Experimental Methods and Data Analysis
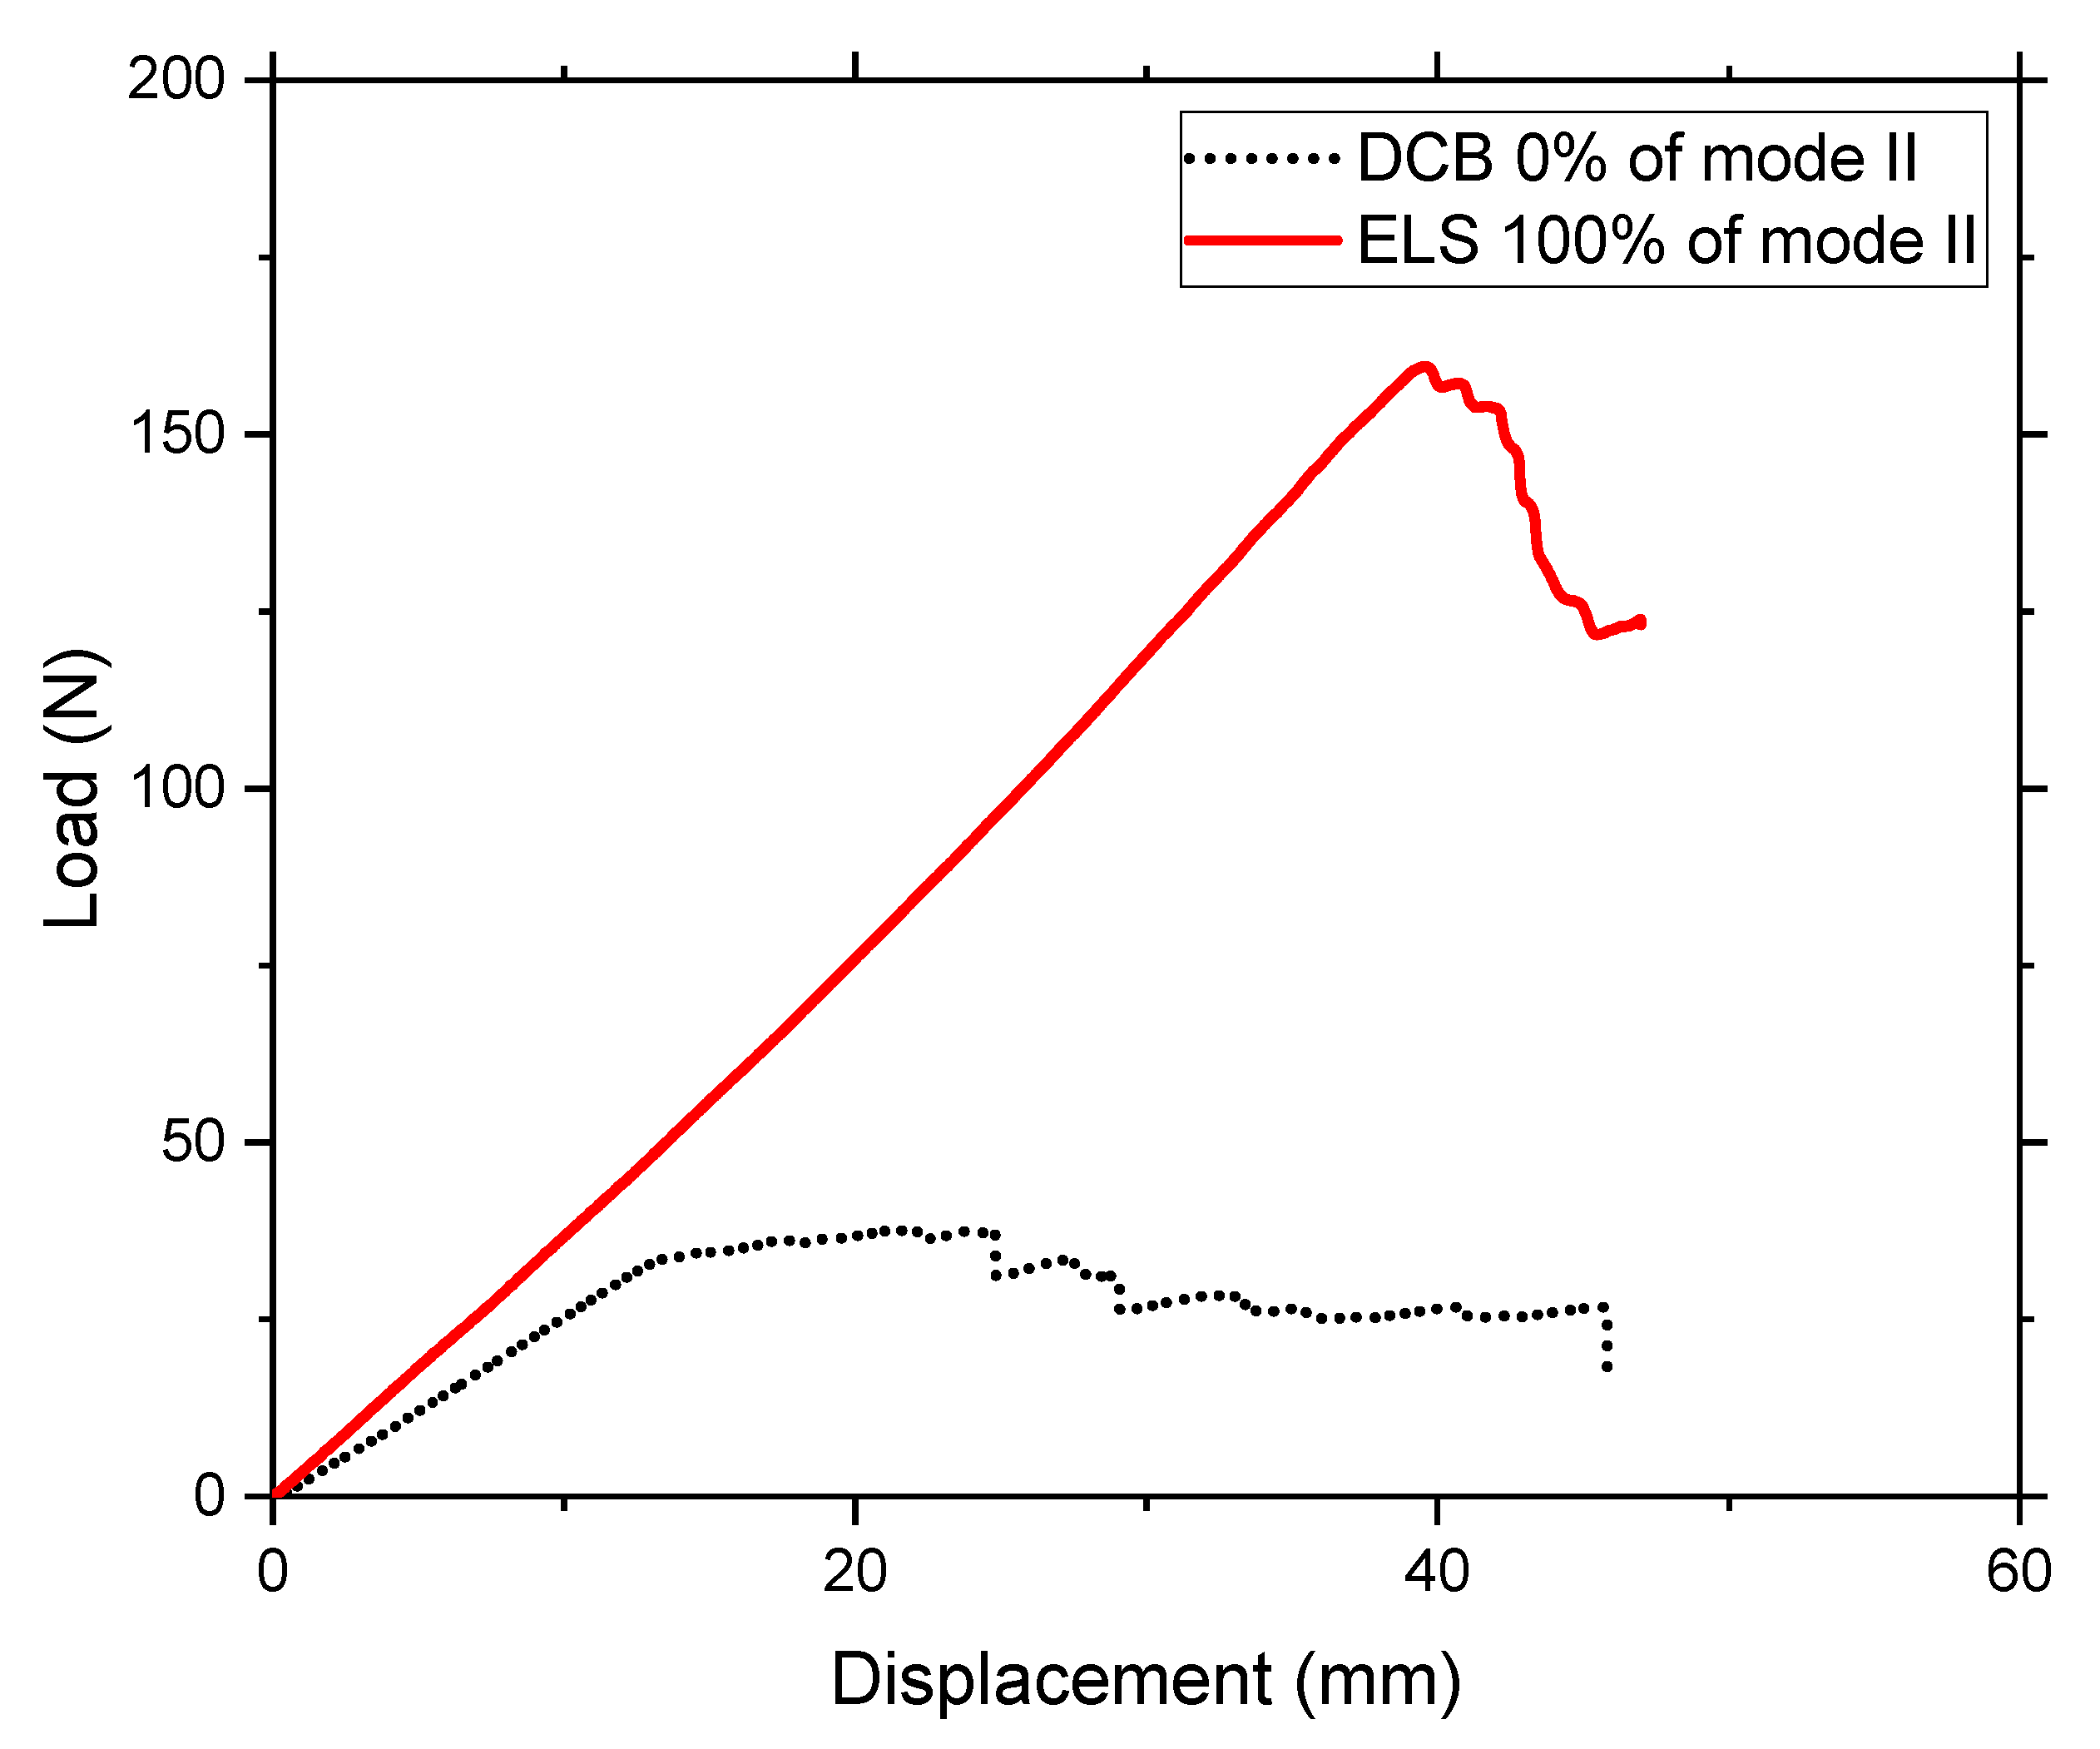
3.1. Mode I Delamination: Double Cantilever Beam (DCB)
3.2. Mode II Delamination: Calibrated Edge Loaded Split (C-ELS)
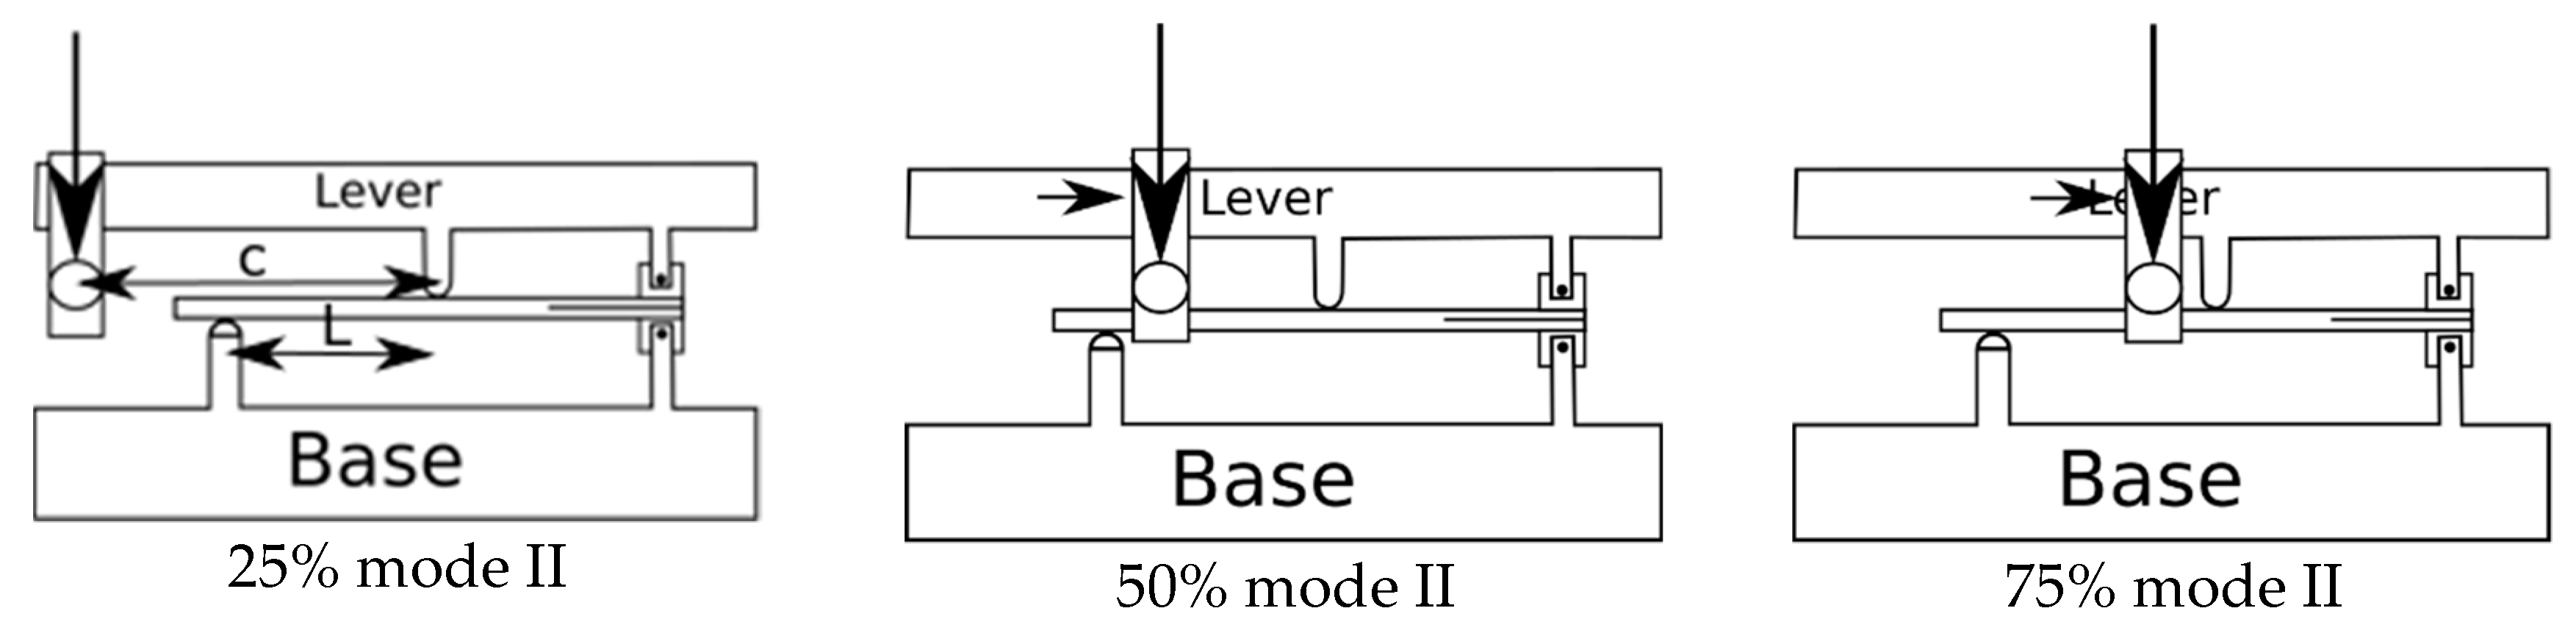
3.3. Mode I/II Delamination: Mixed Mode Bending (MMB)
4. Results
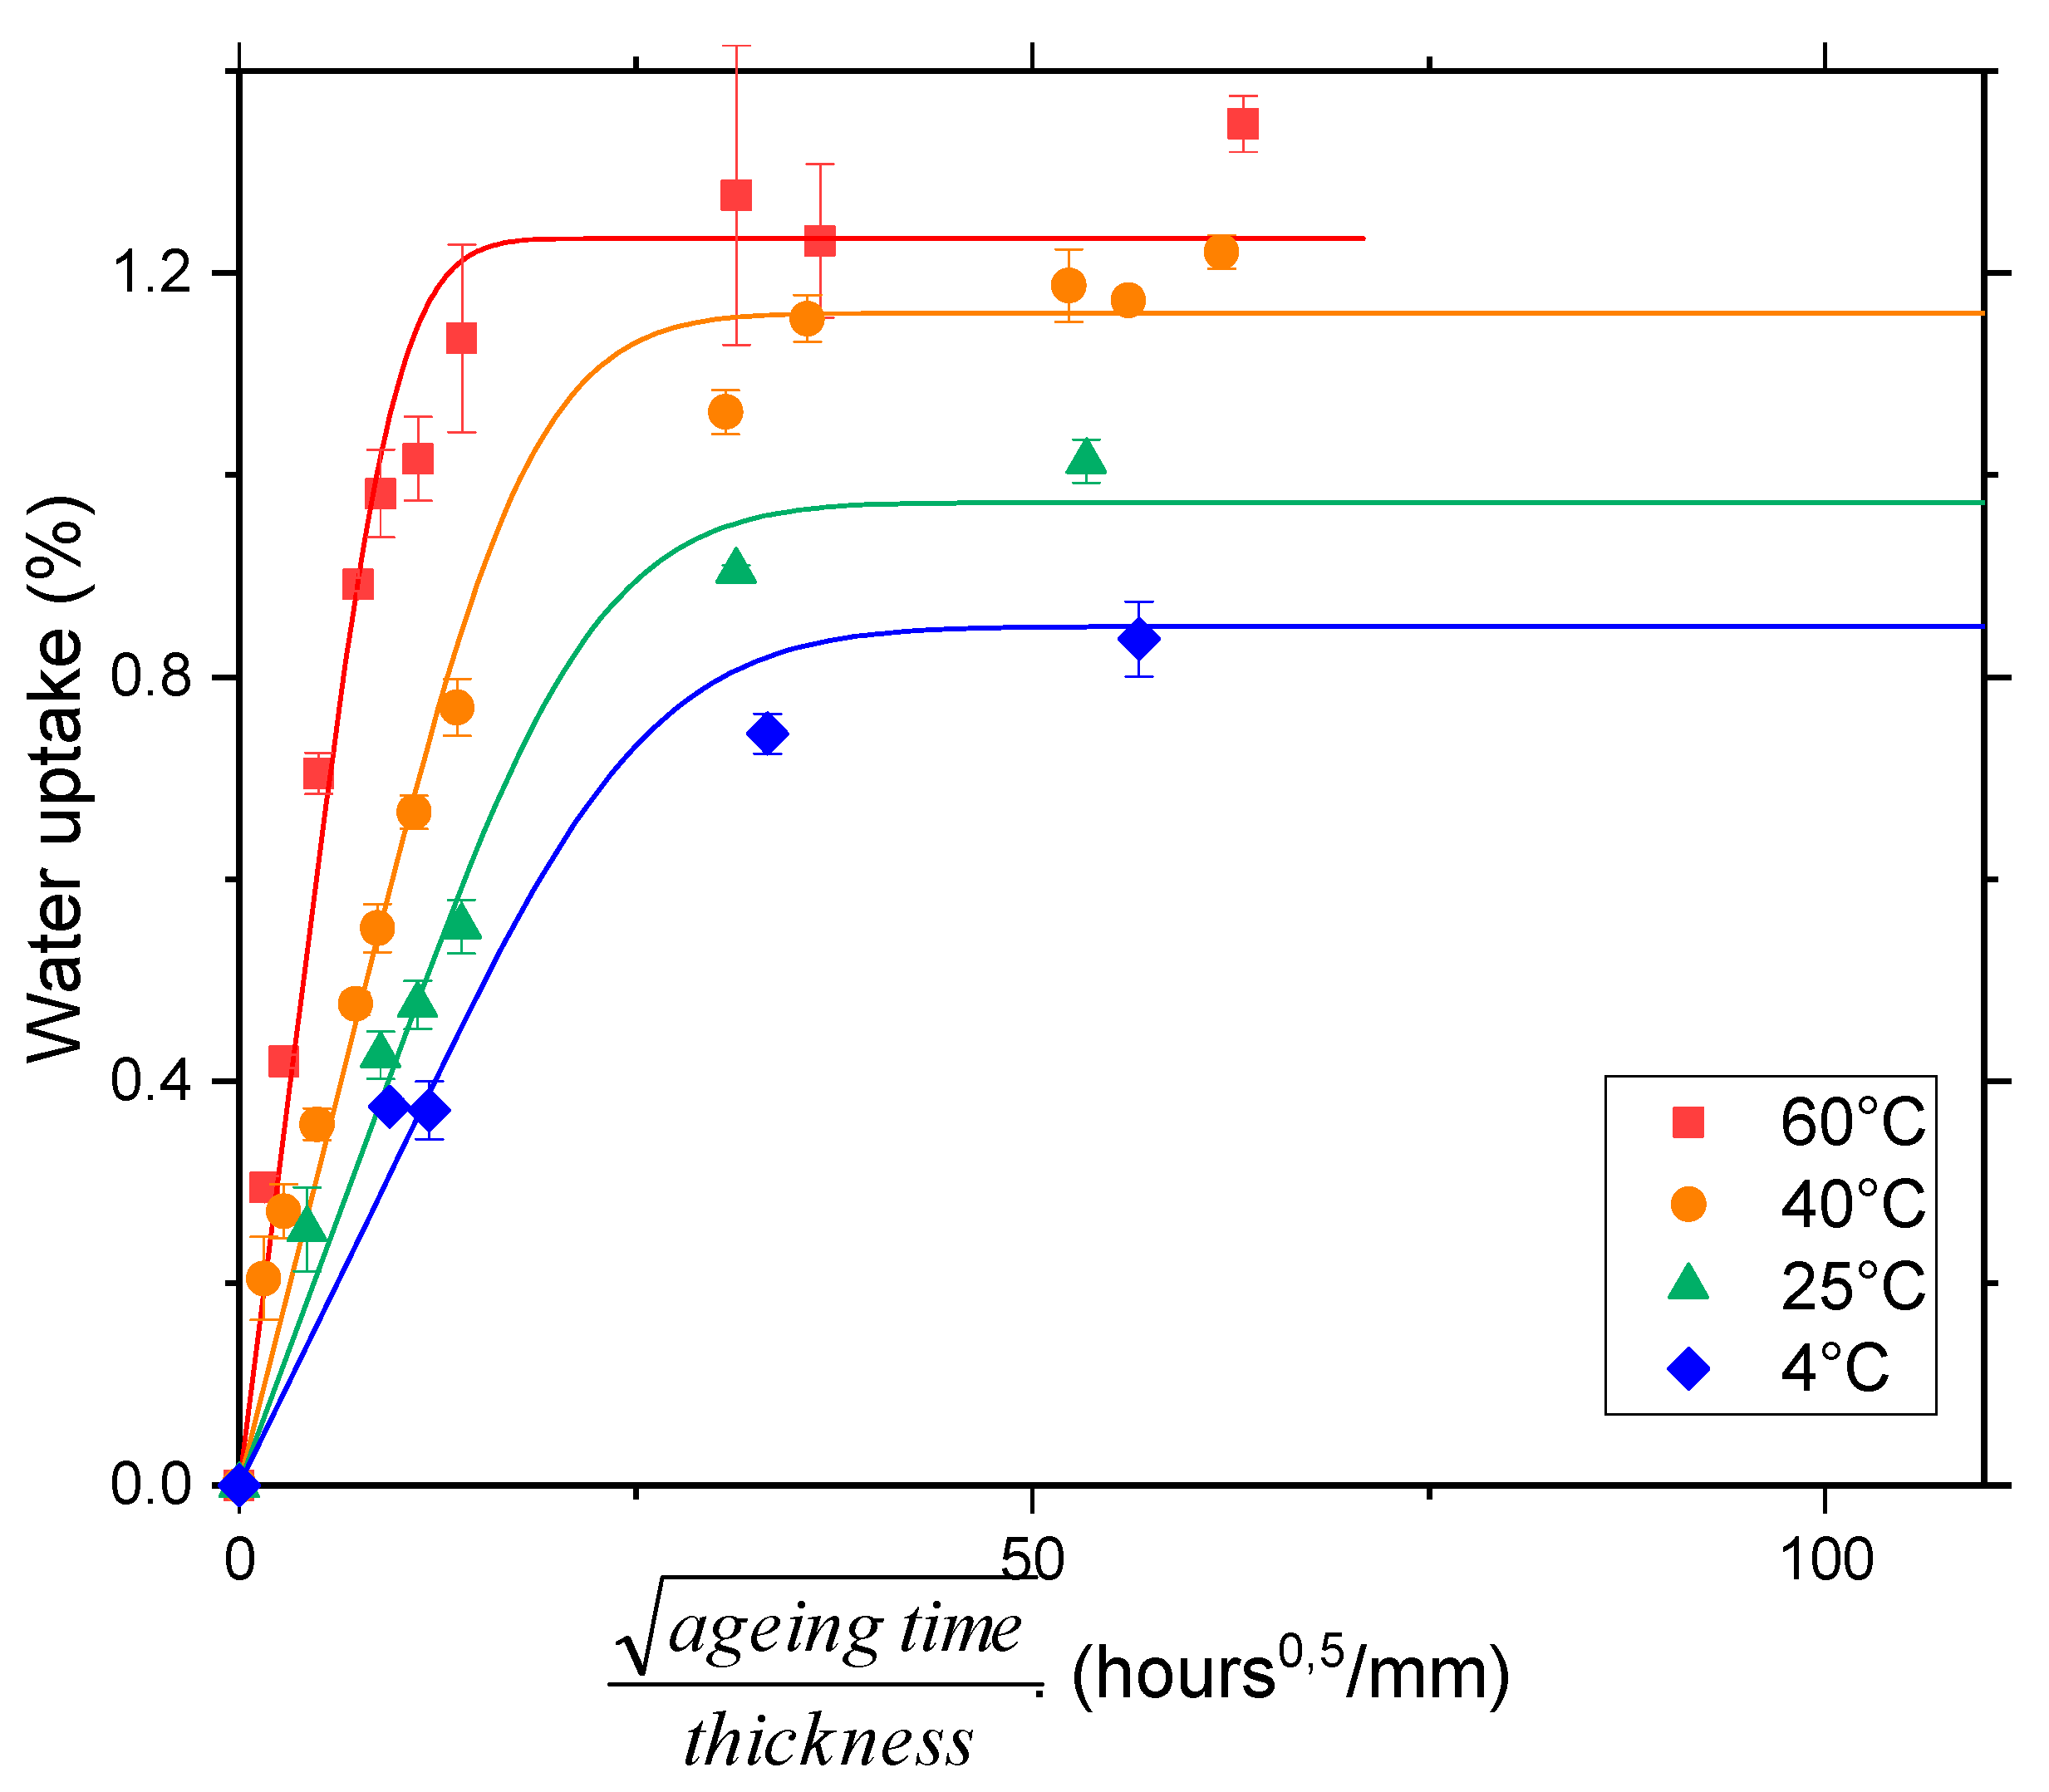
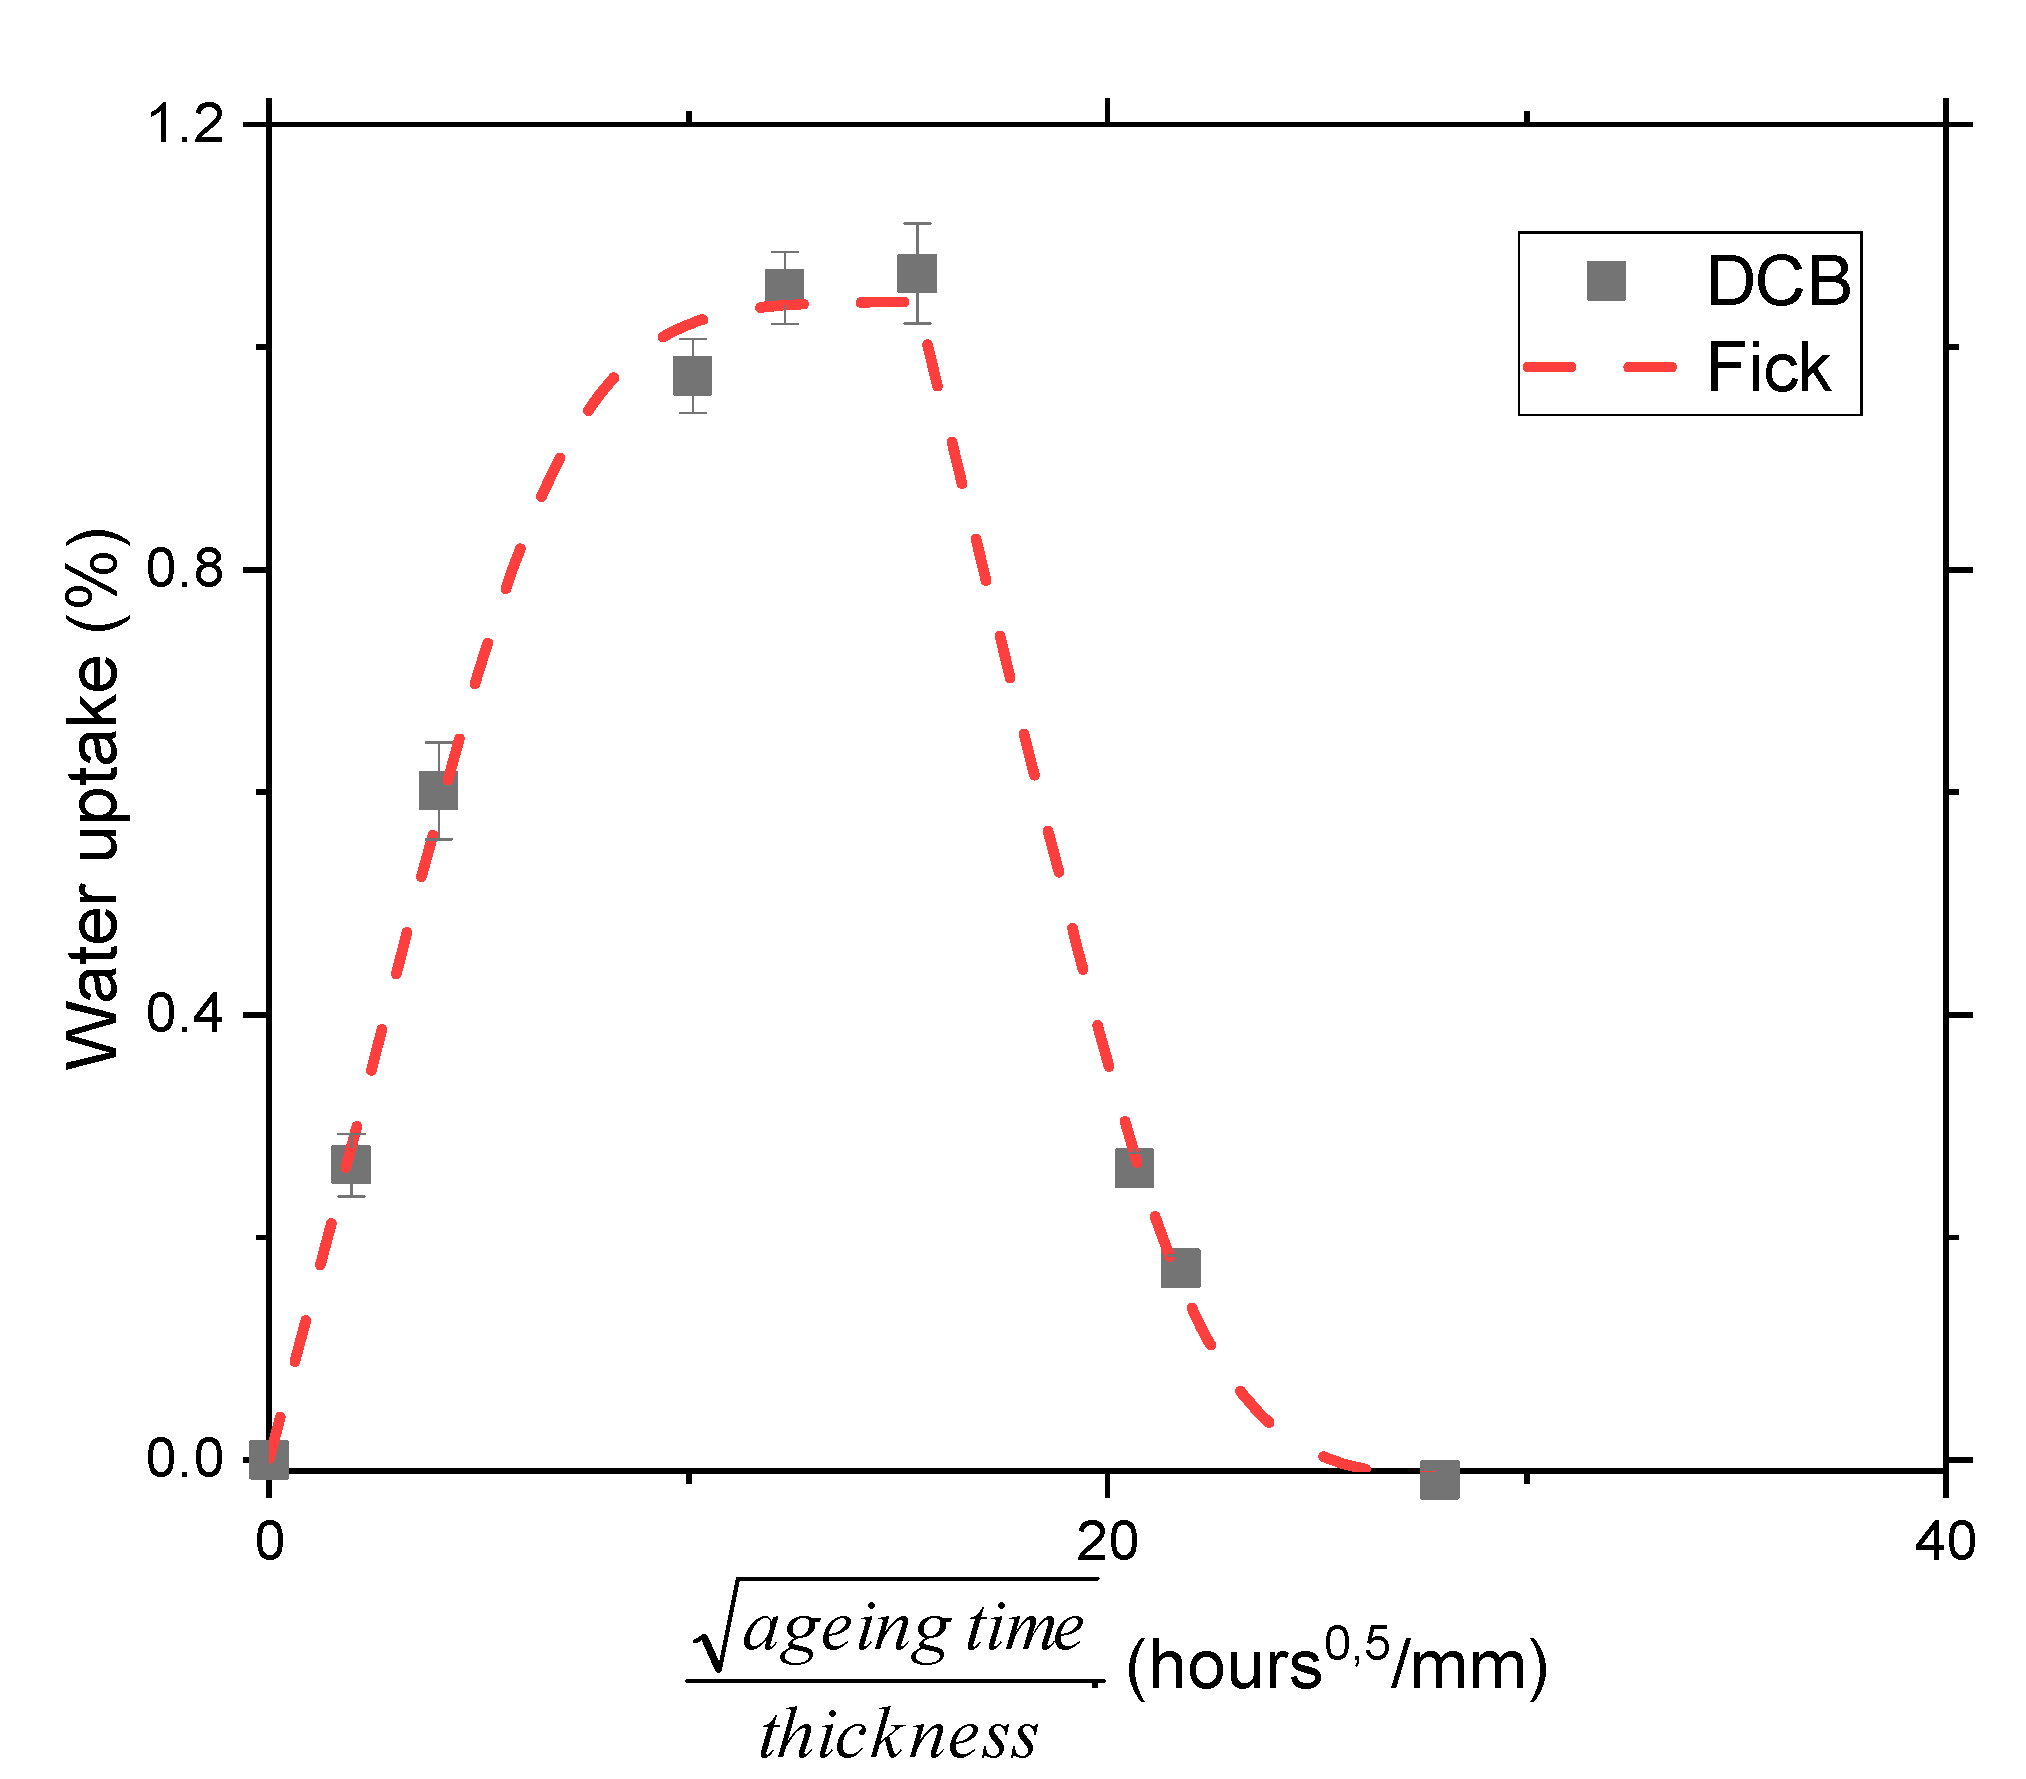
4.1. Water Uptake
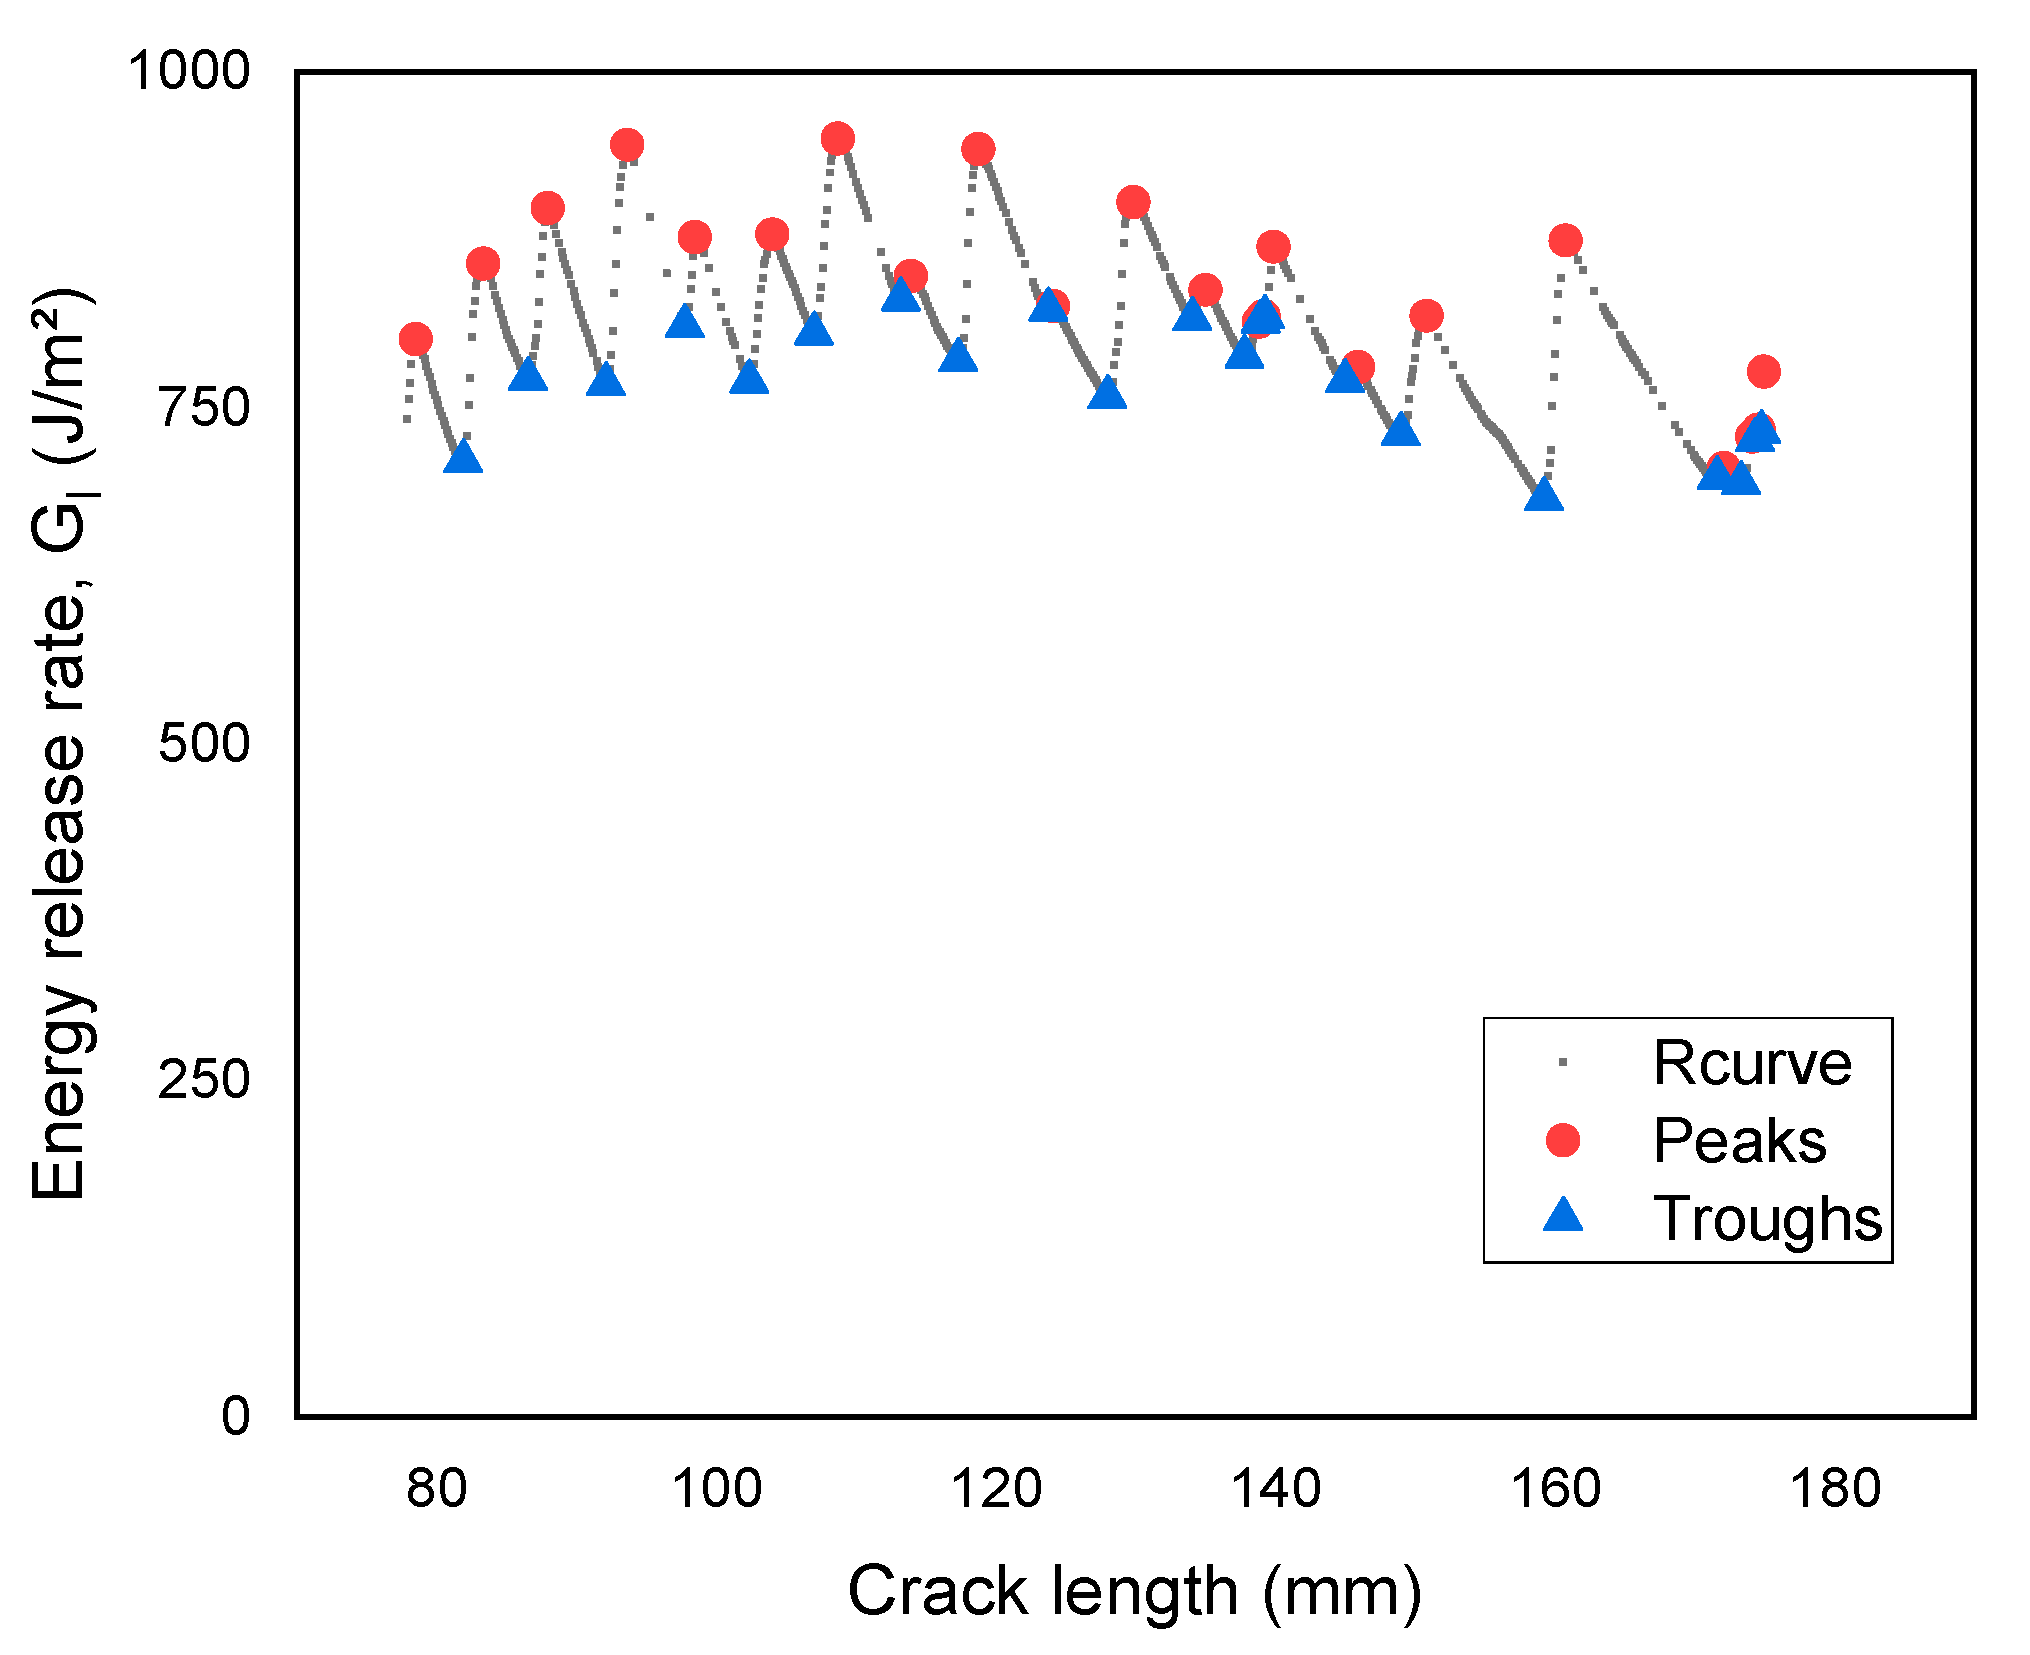
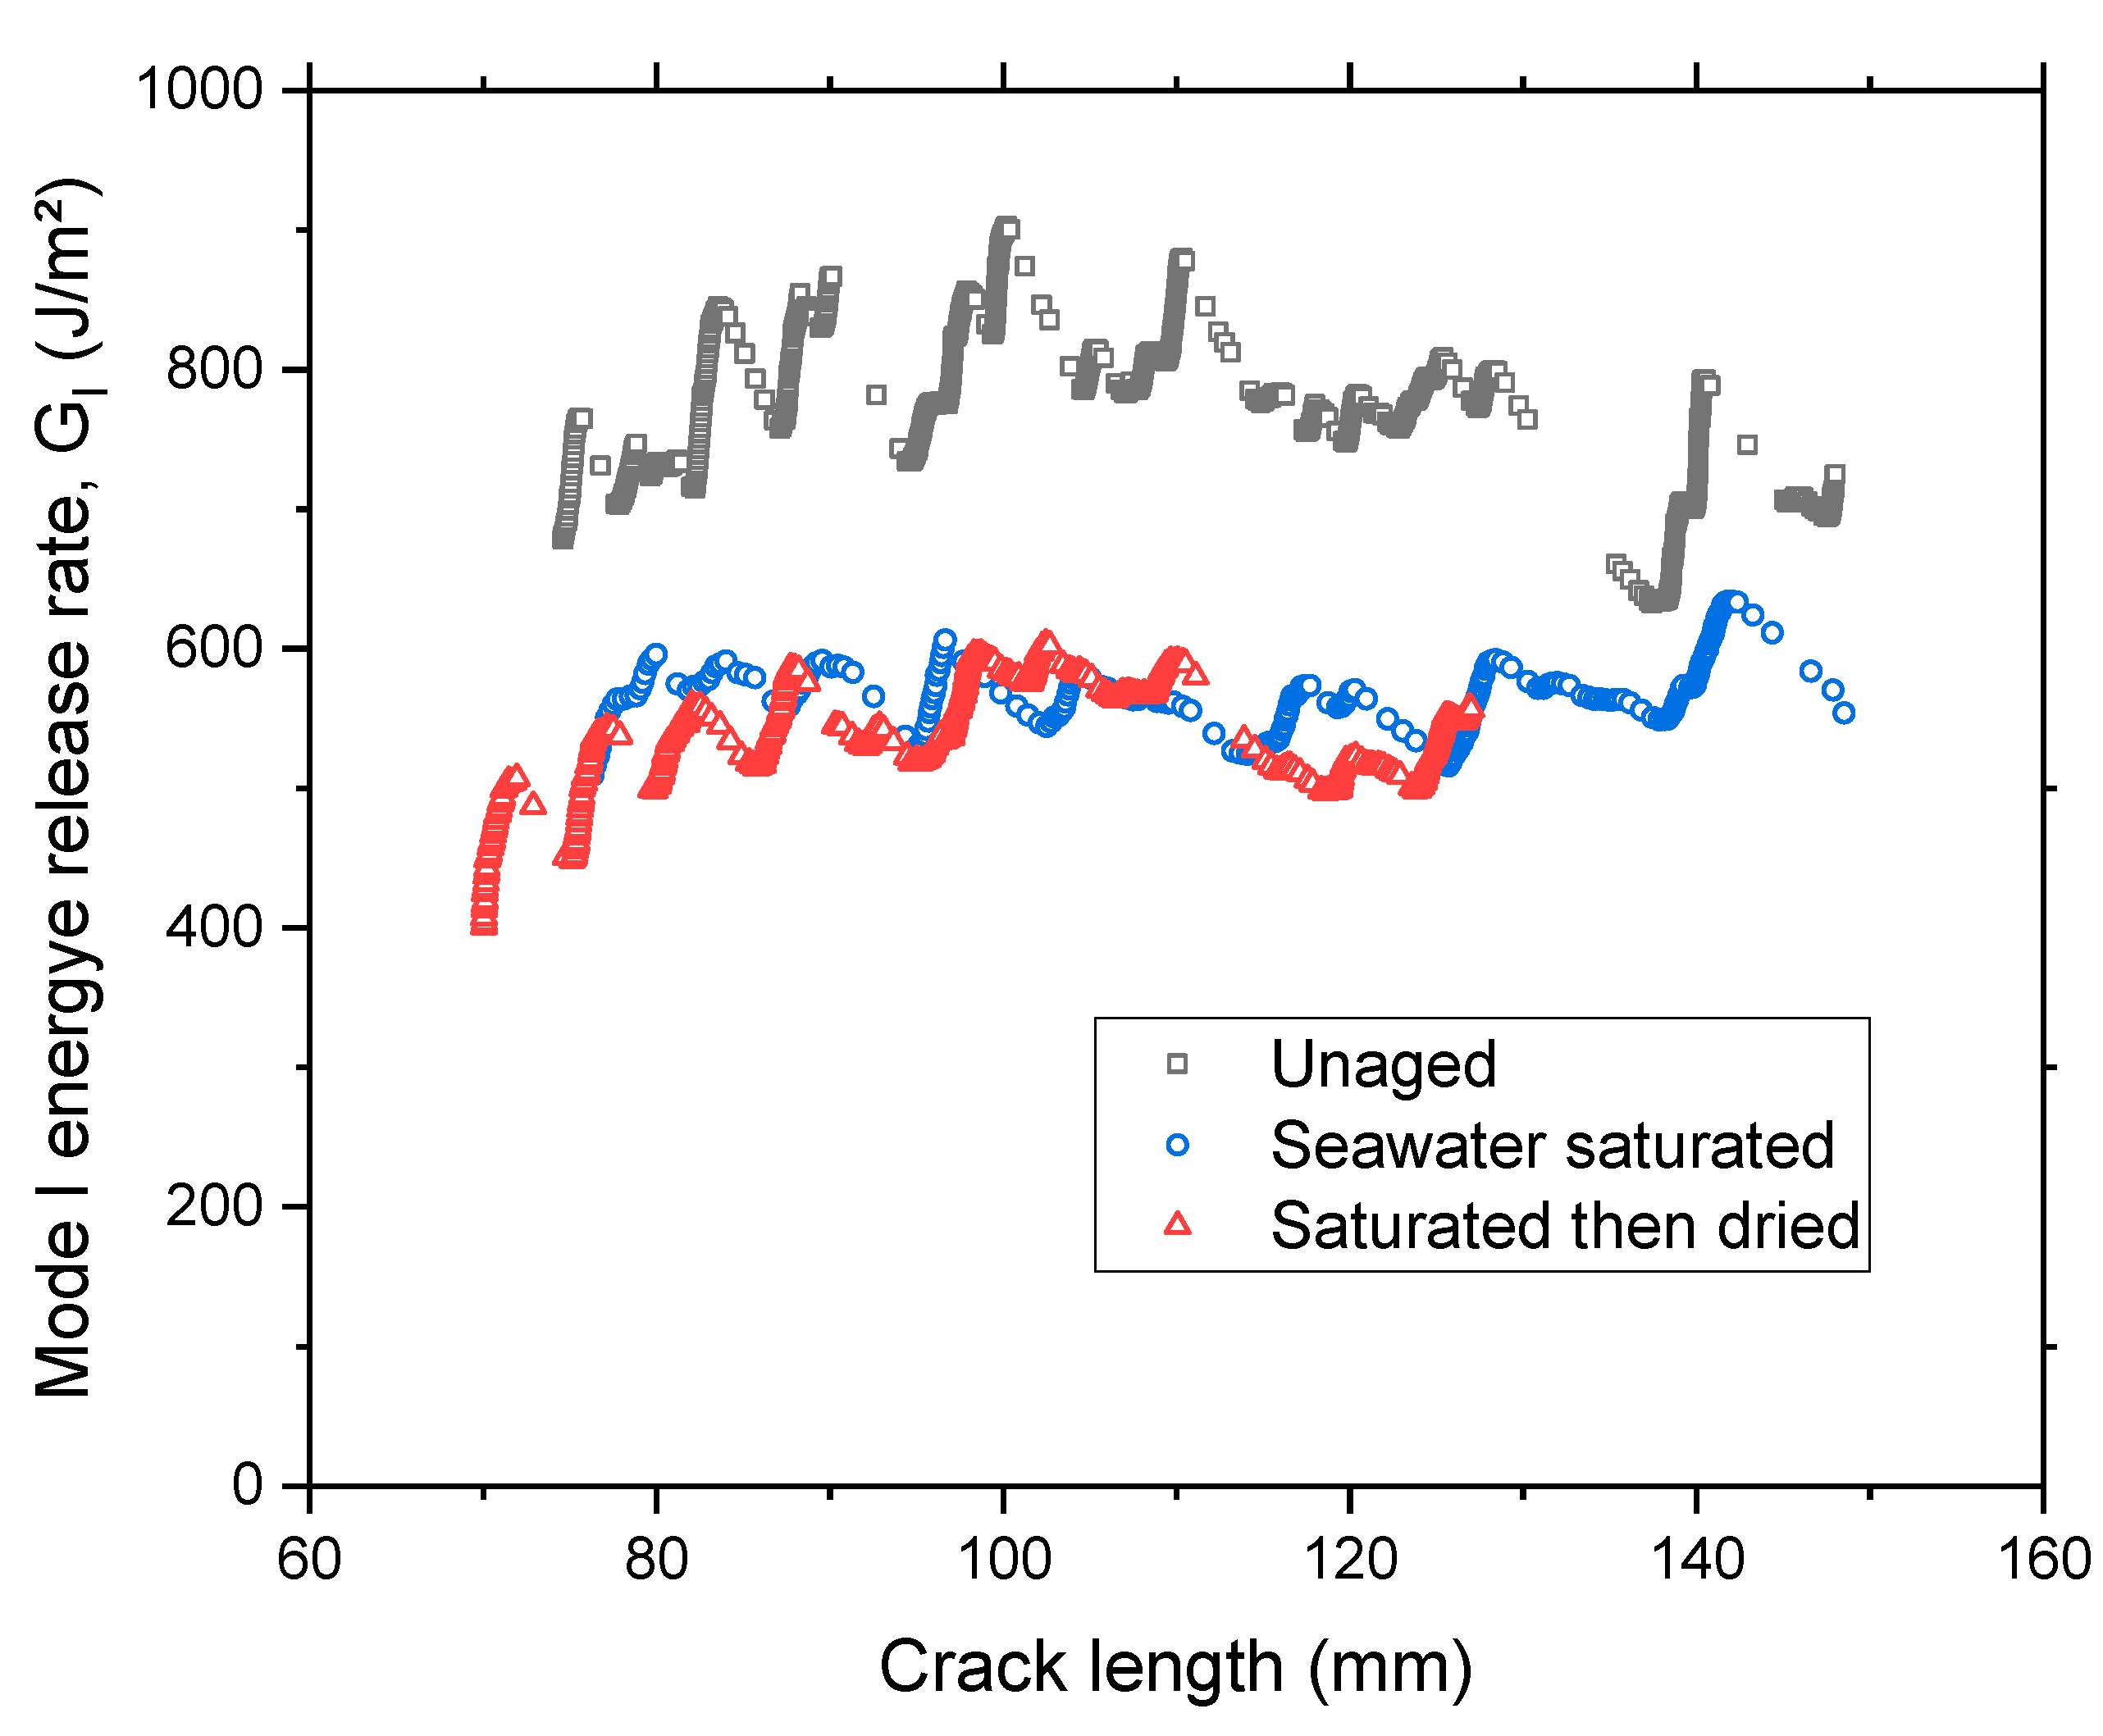
4.2. Mode I Fracture
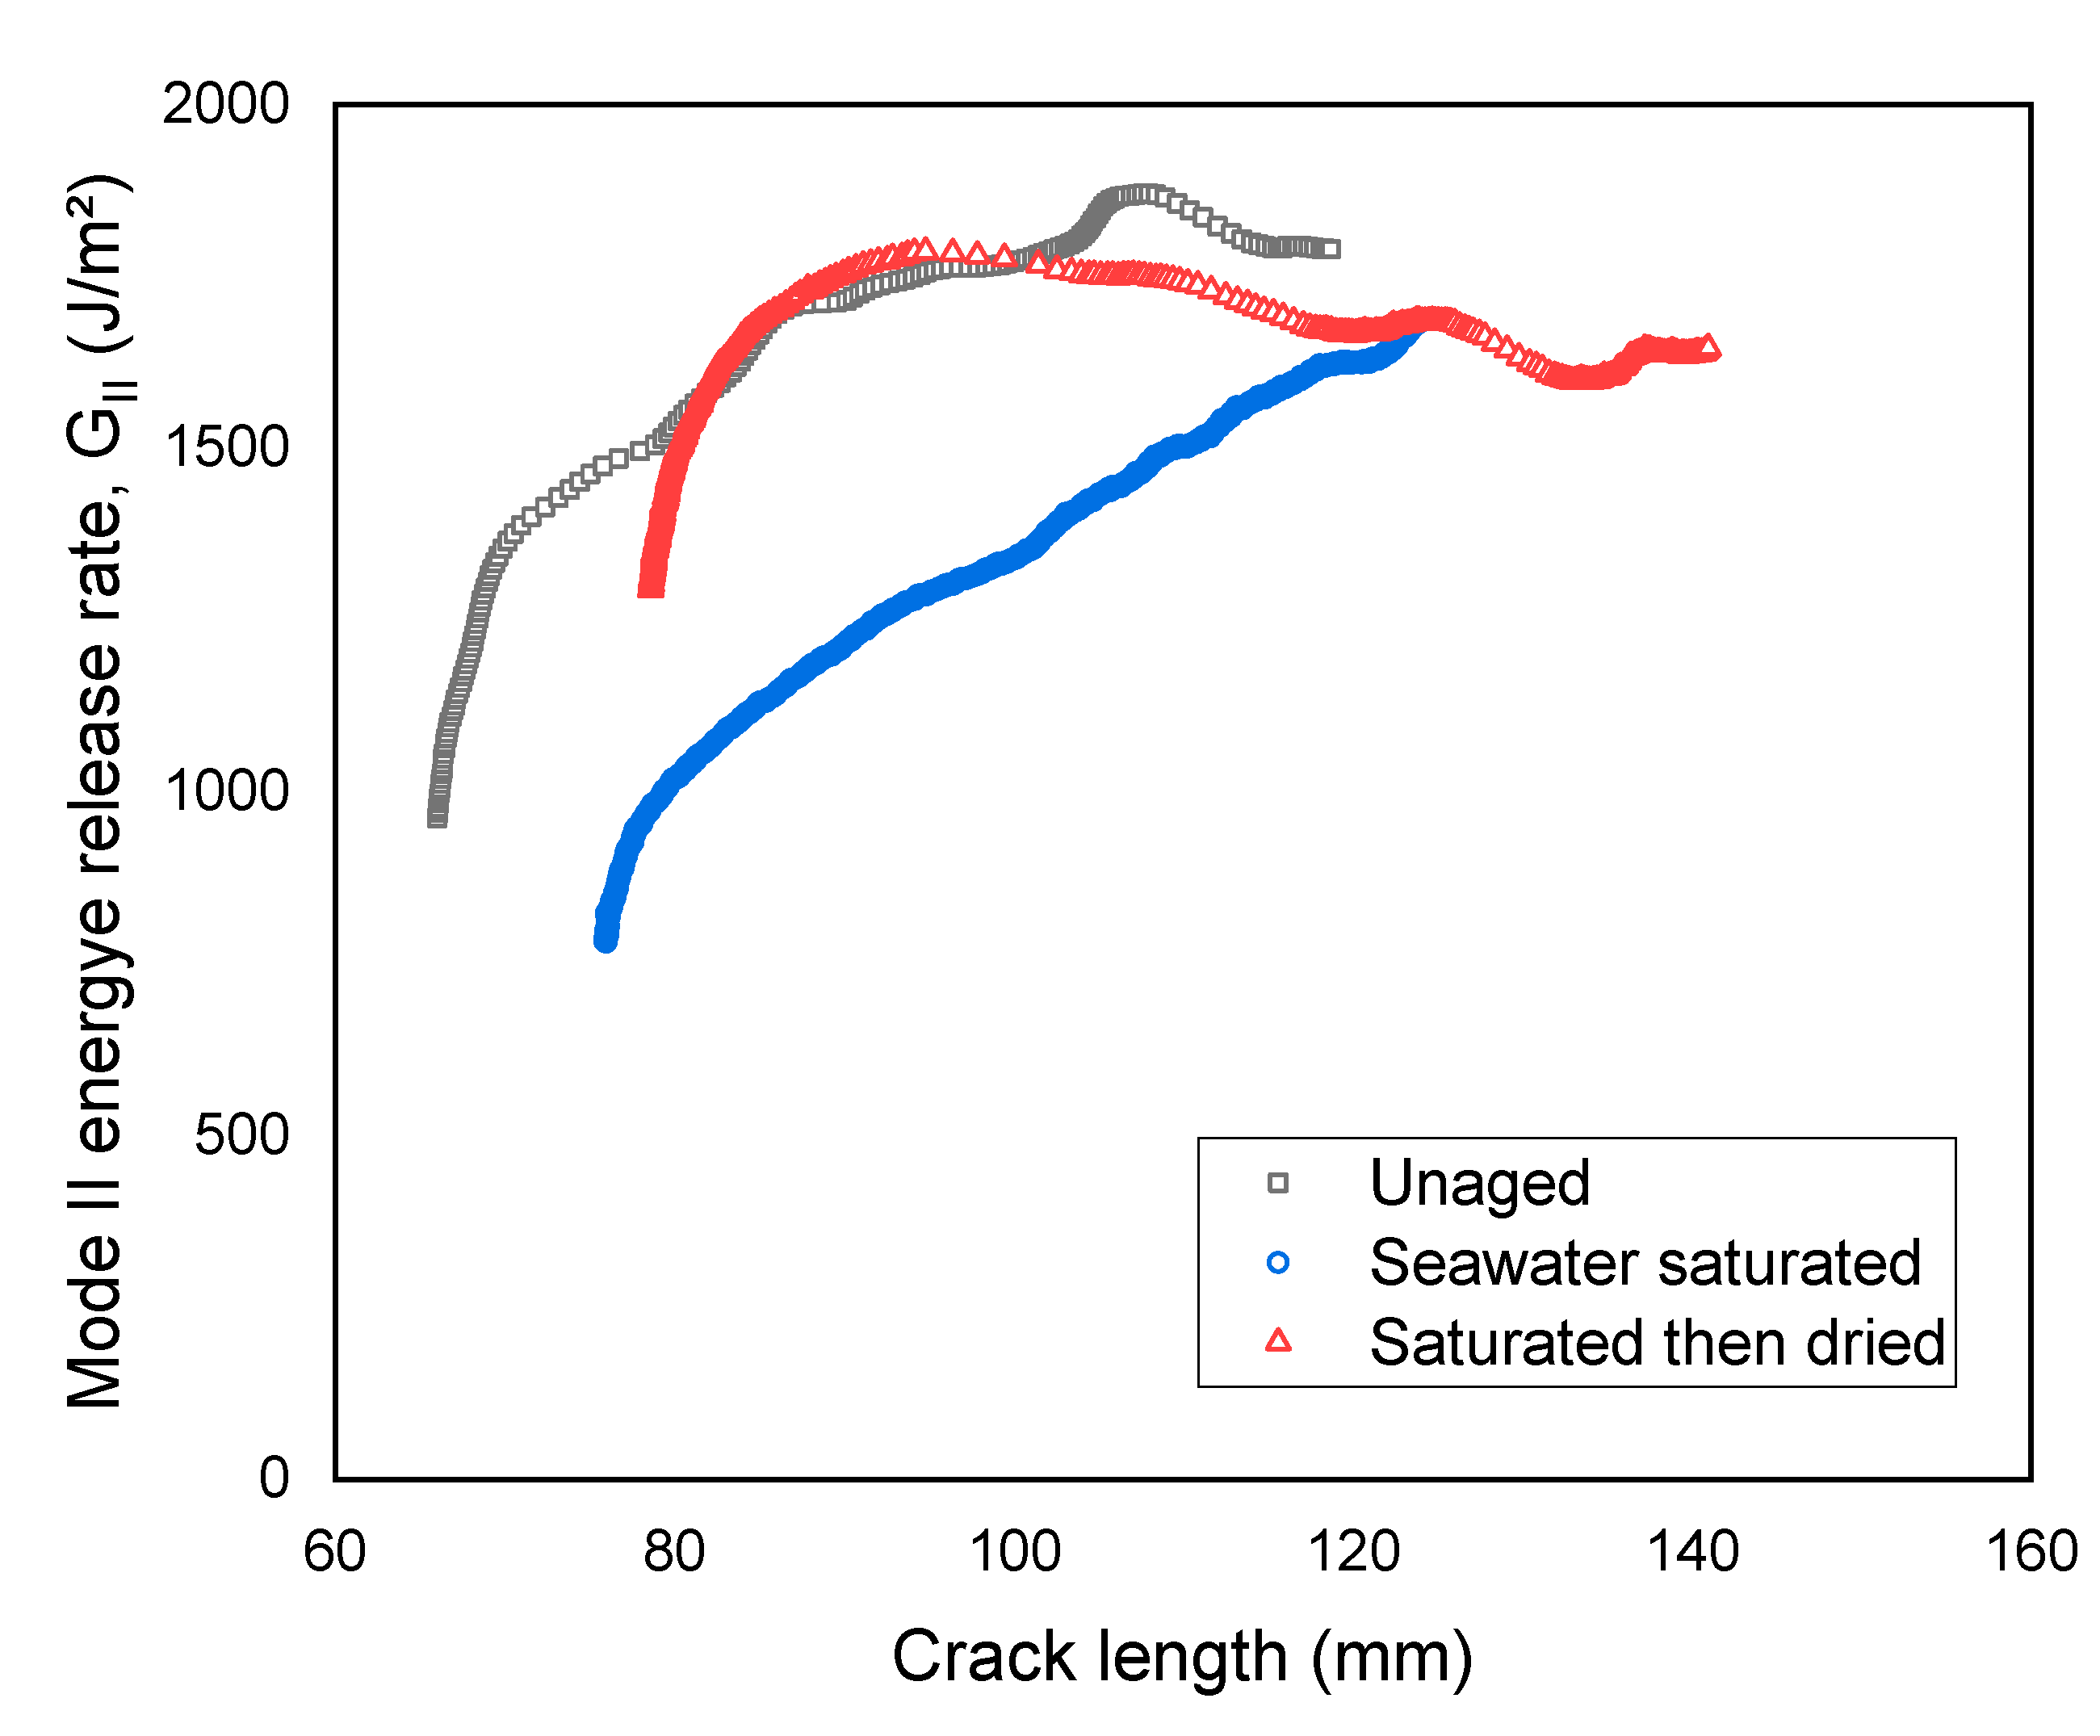
4.3. Mode II Fracture
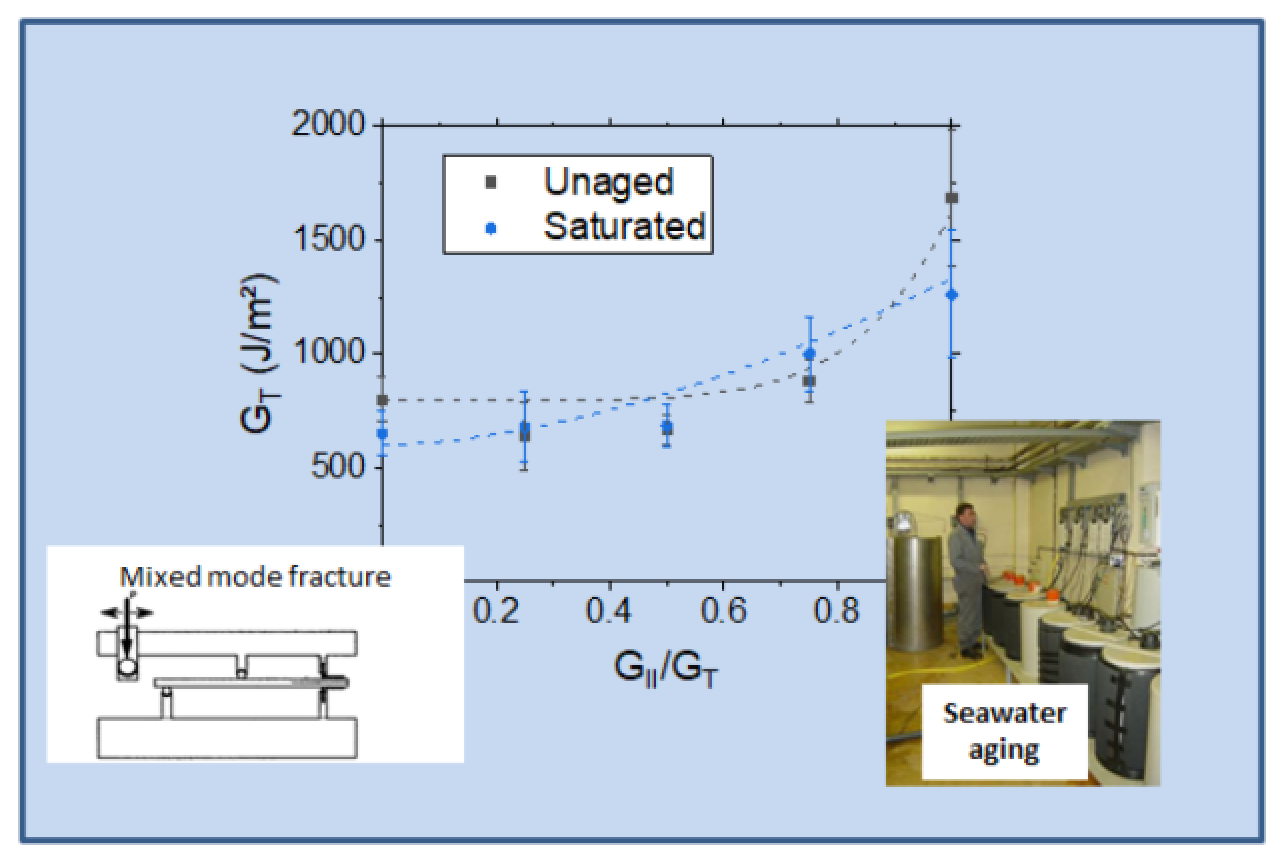
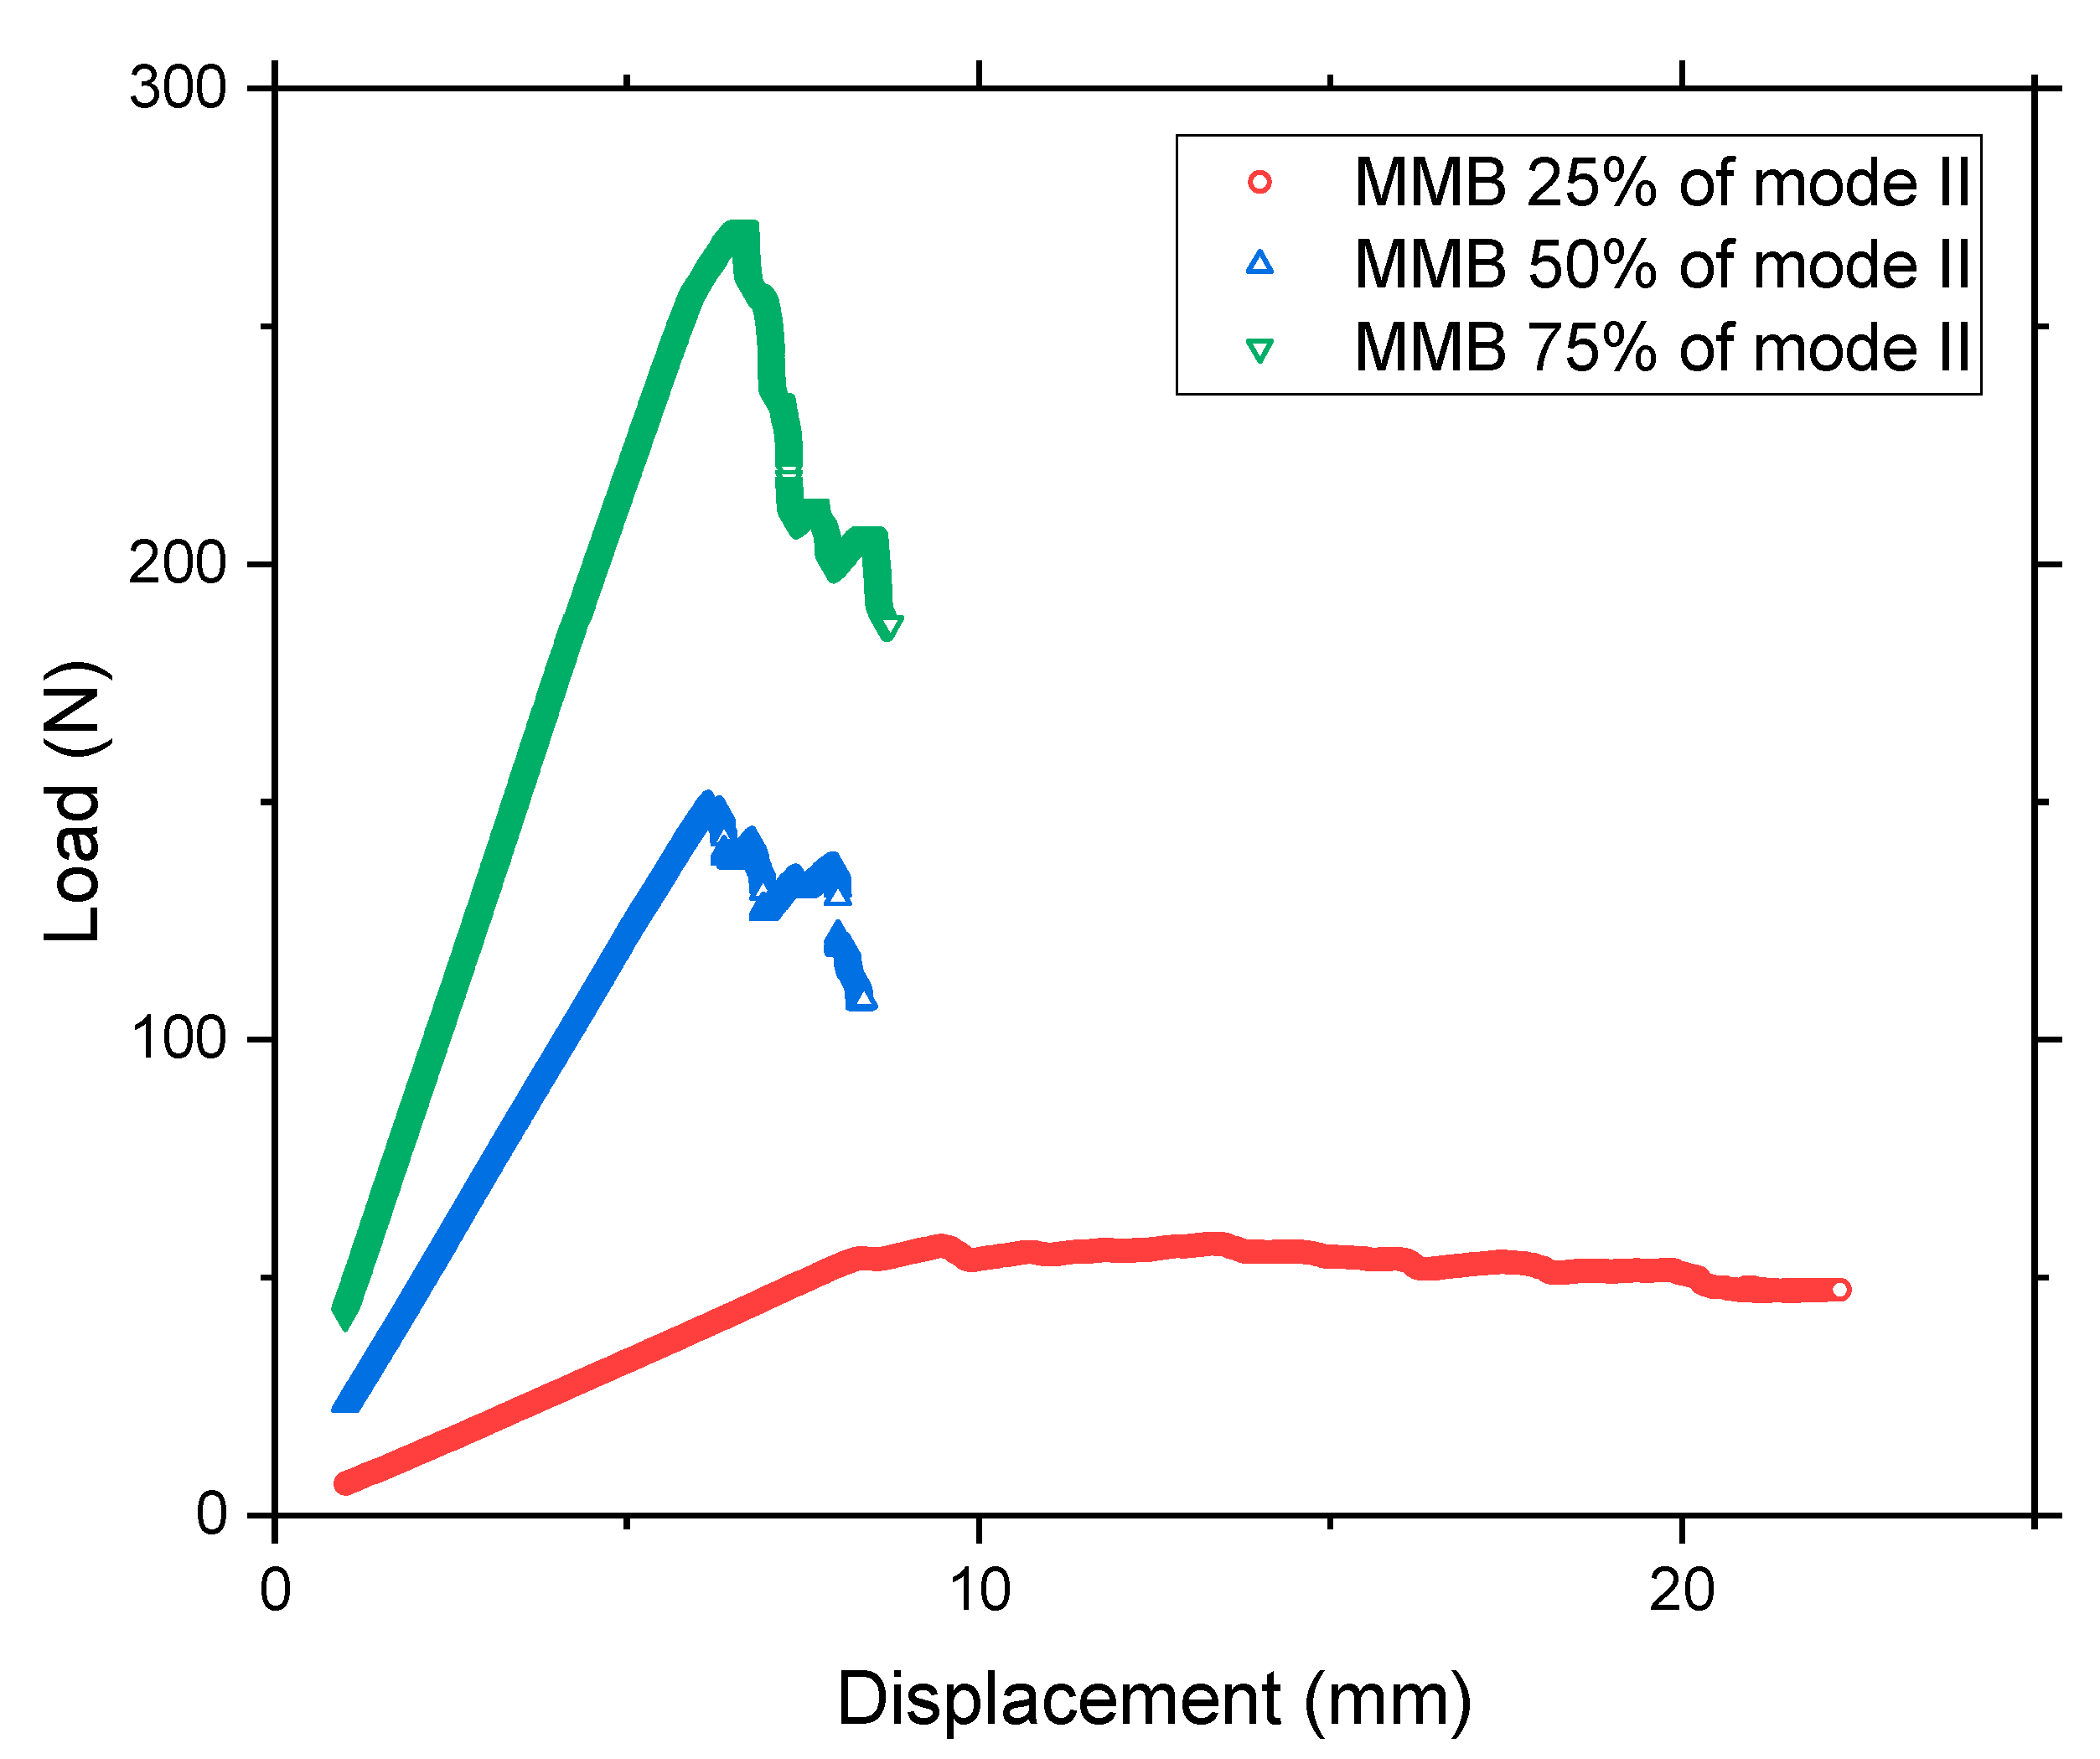
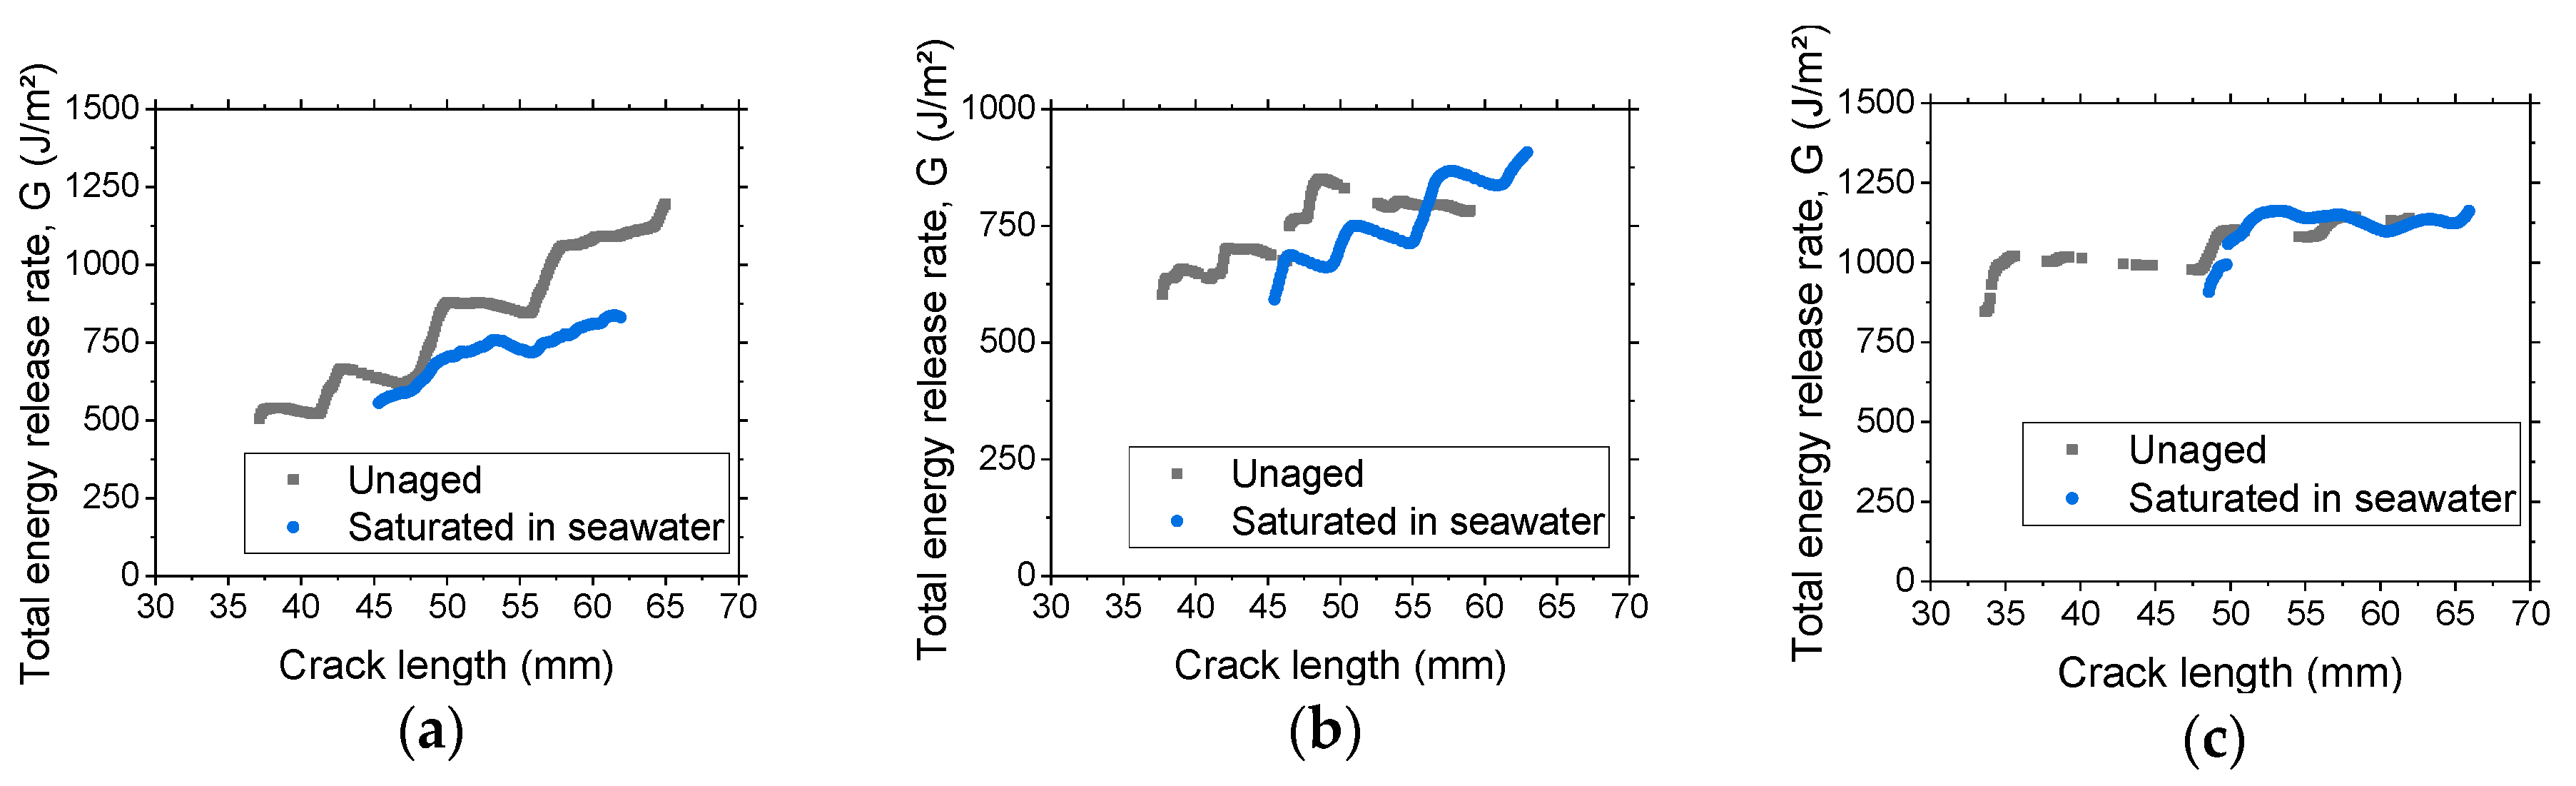
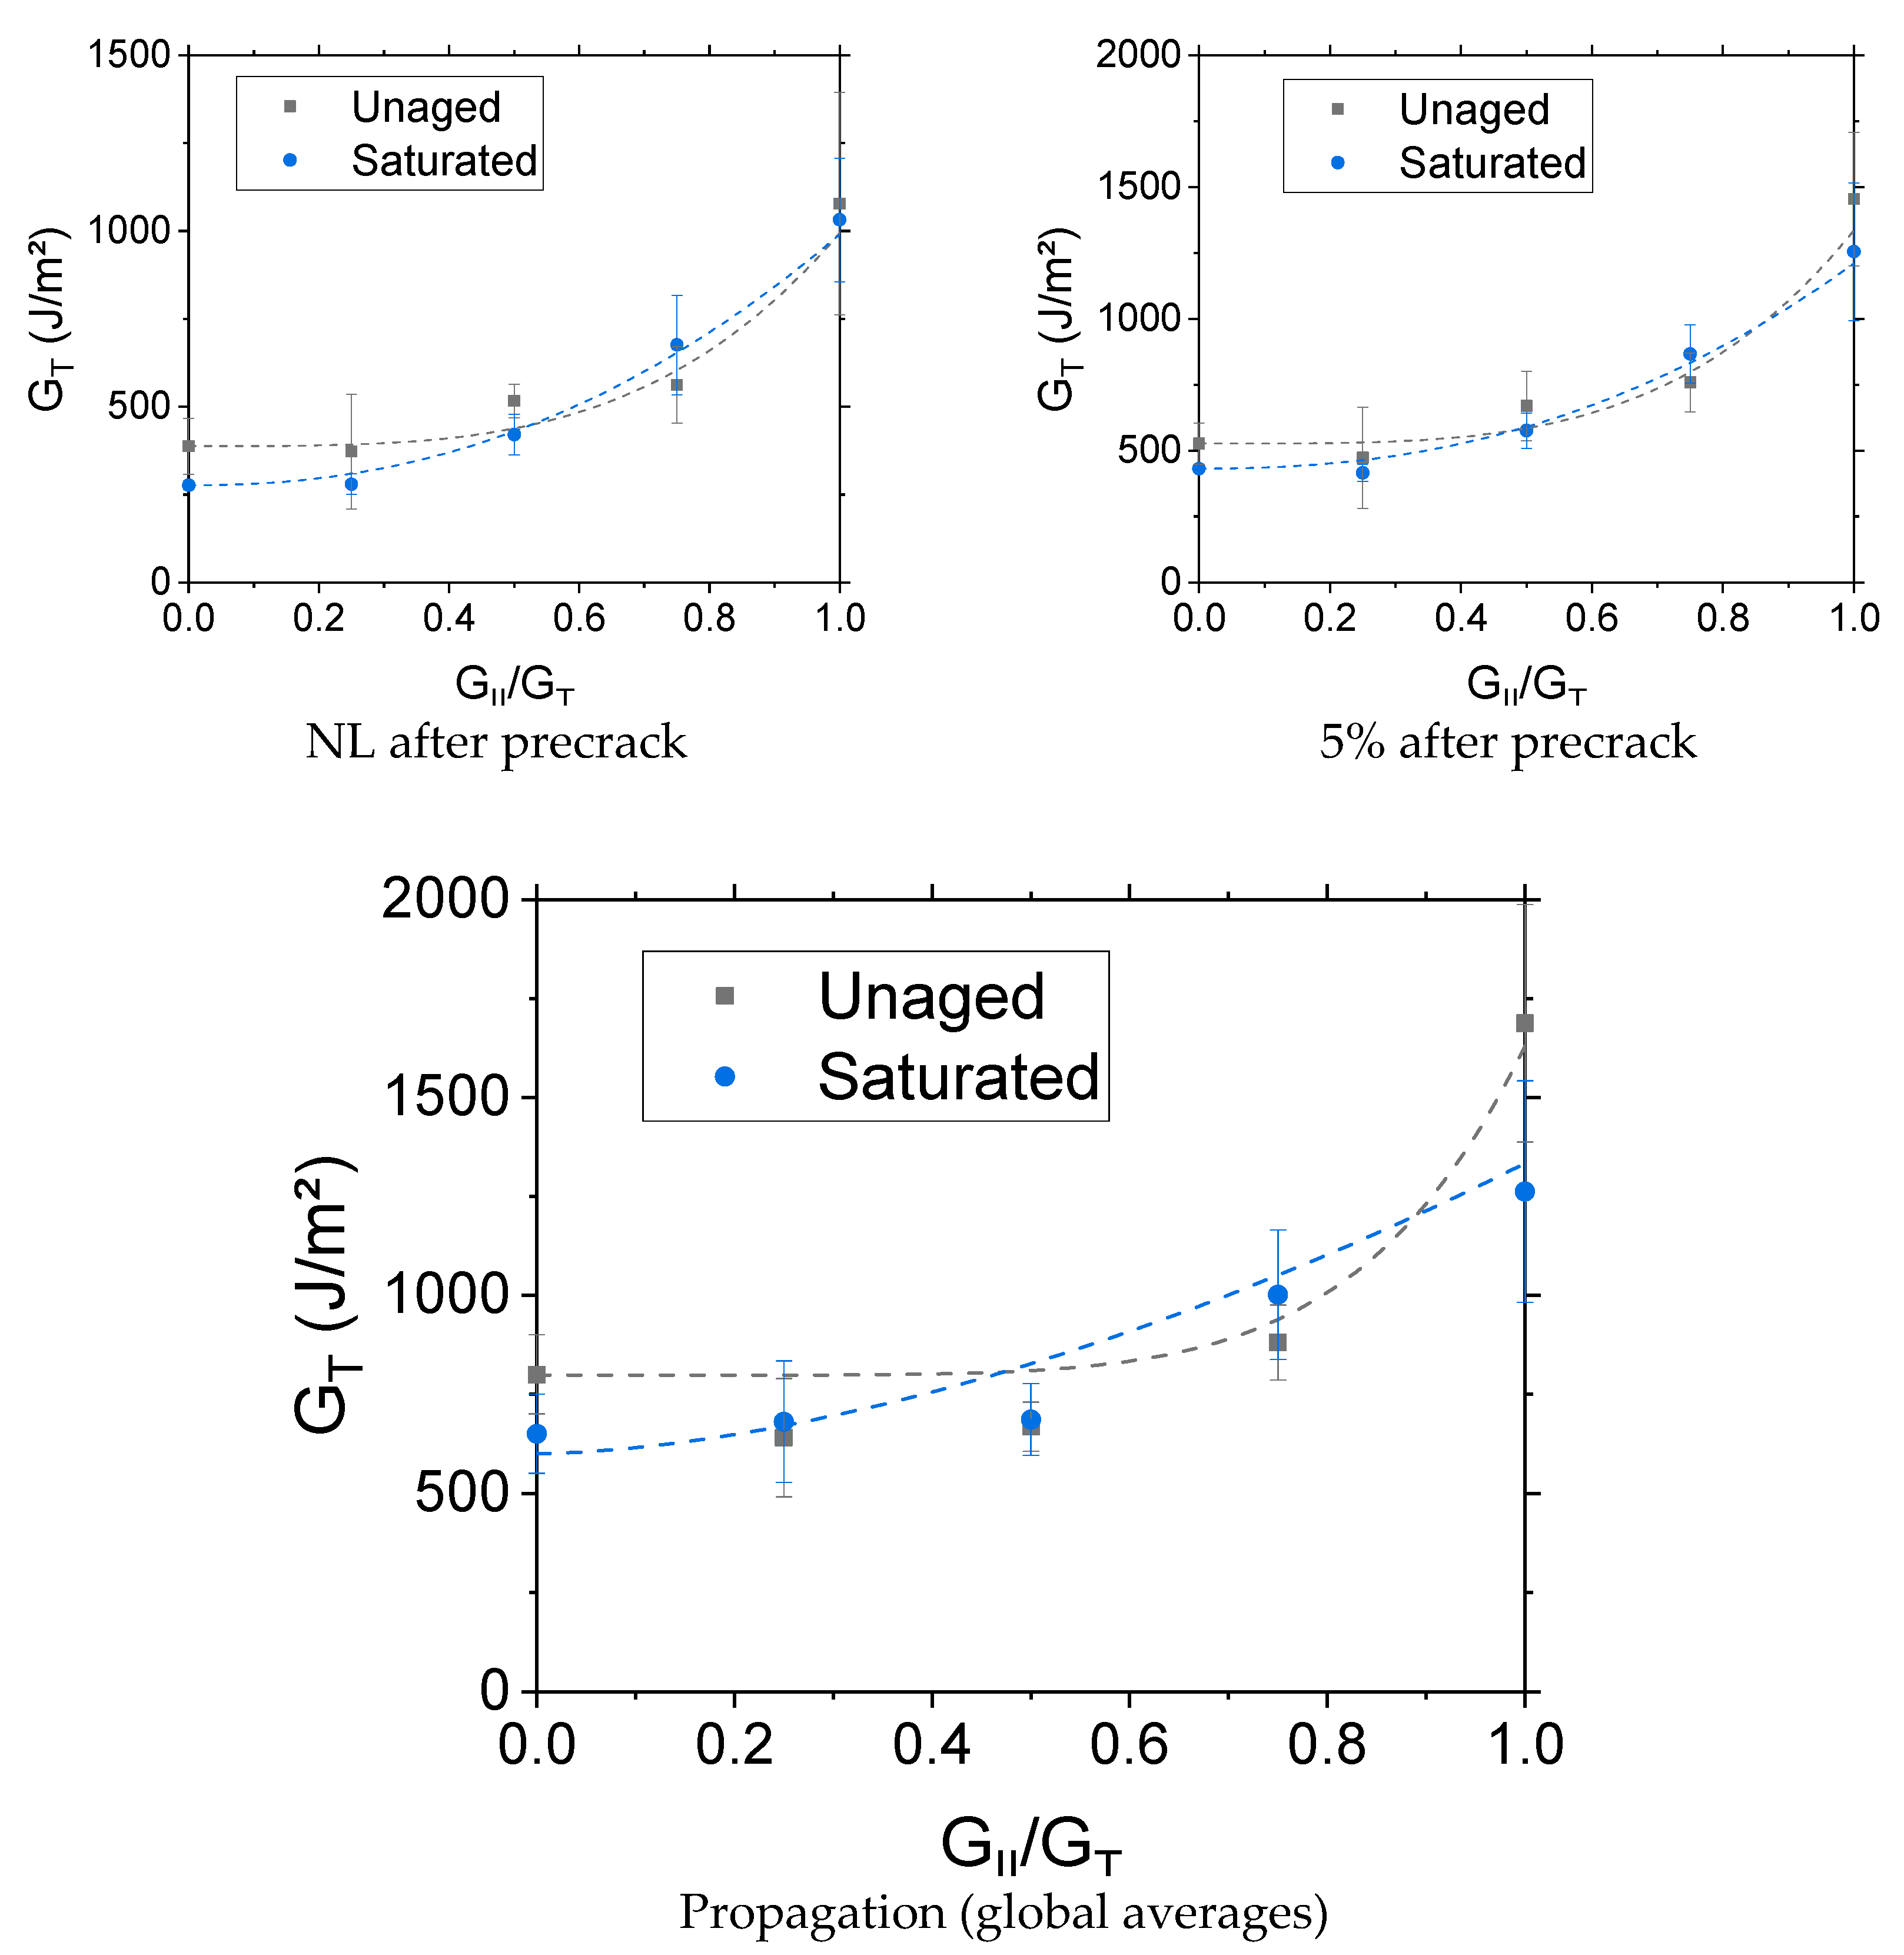
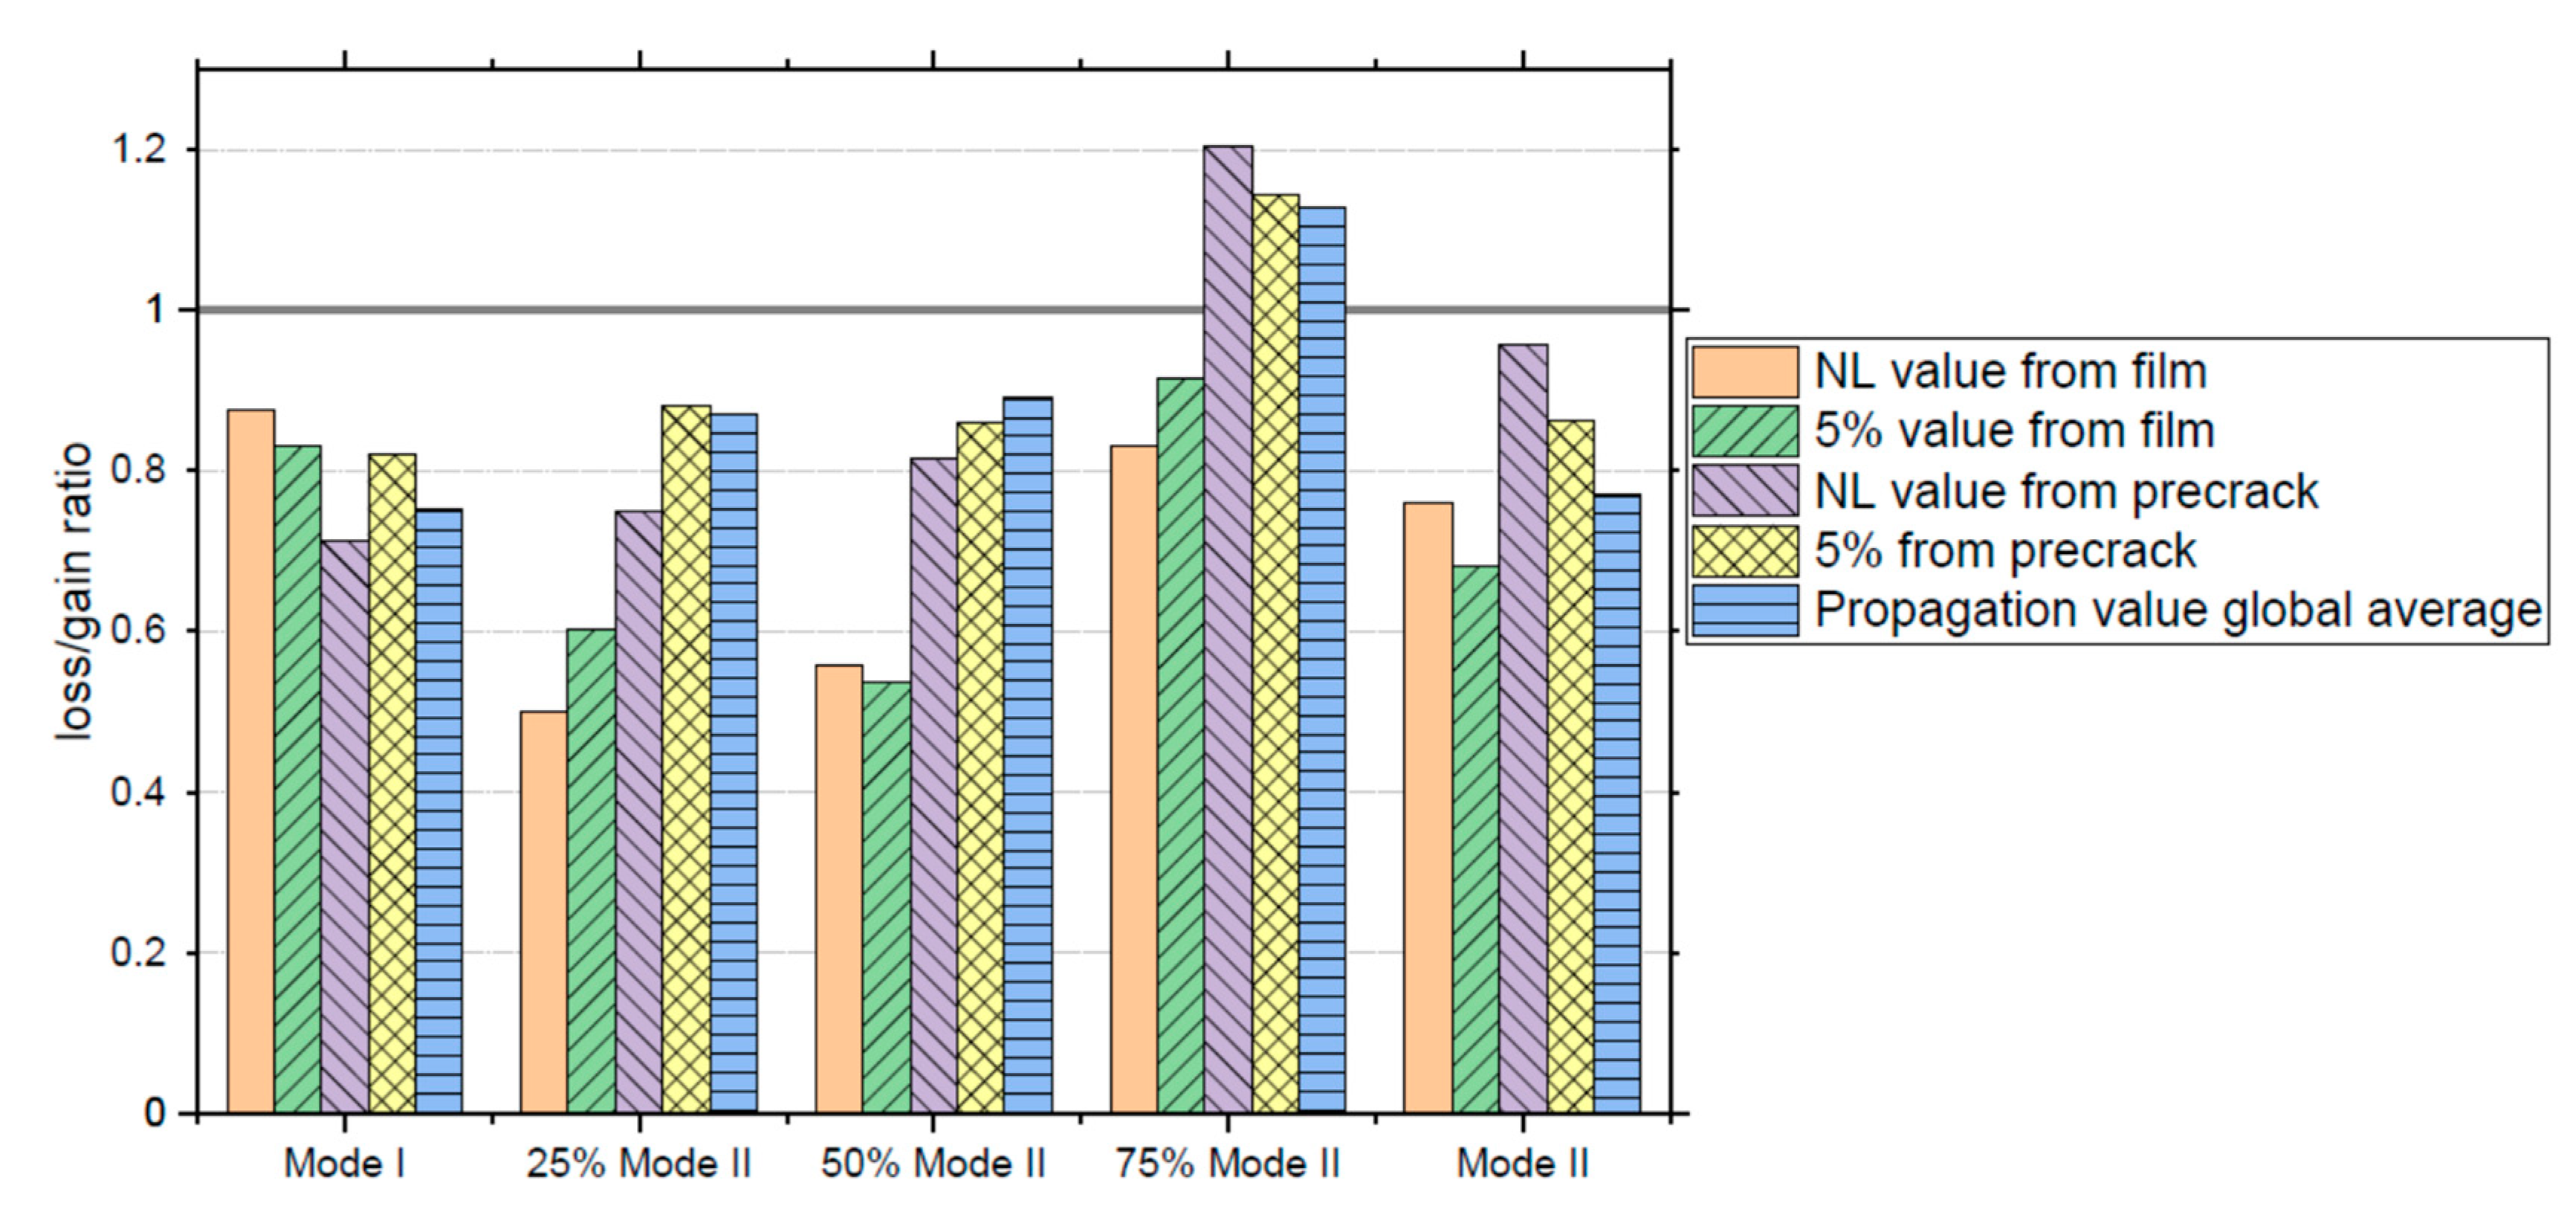
4.4. Mixed Mode Fracture
5. Discussion
- -
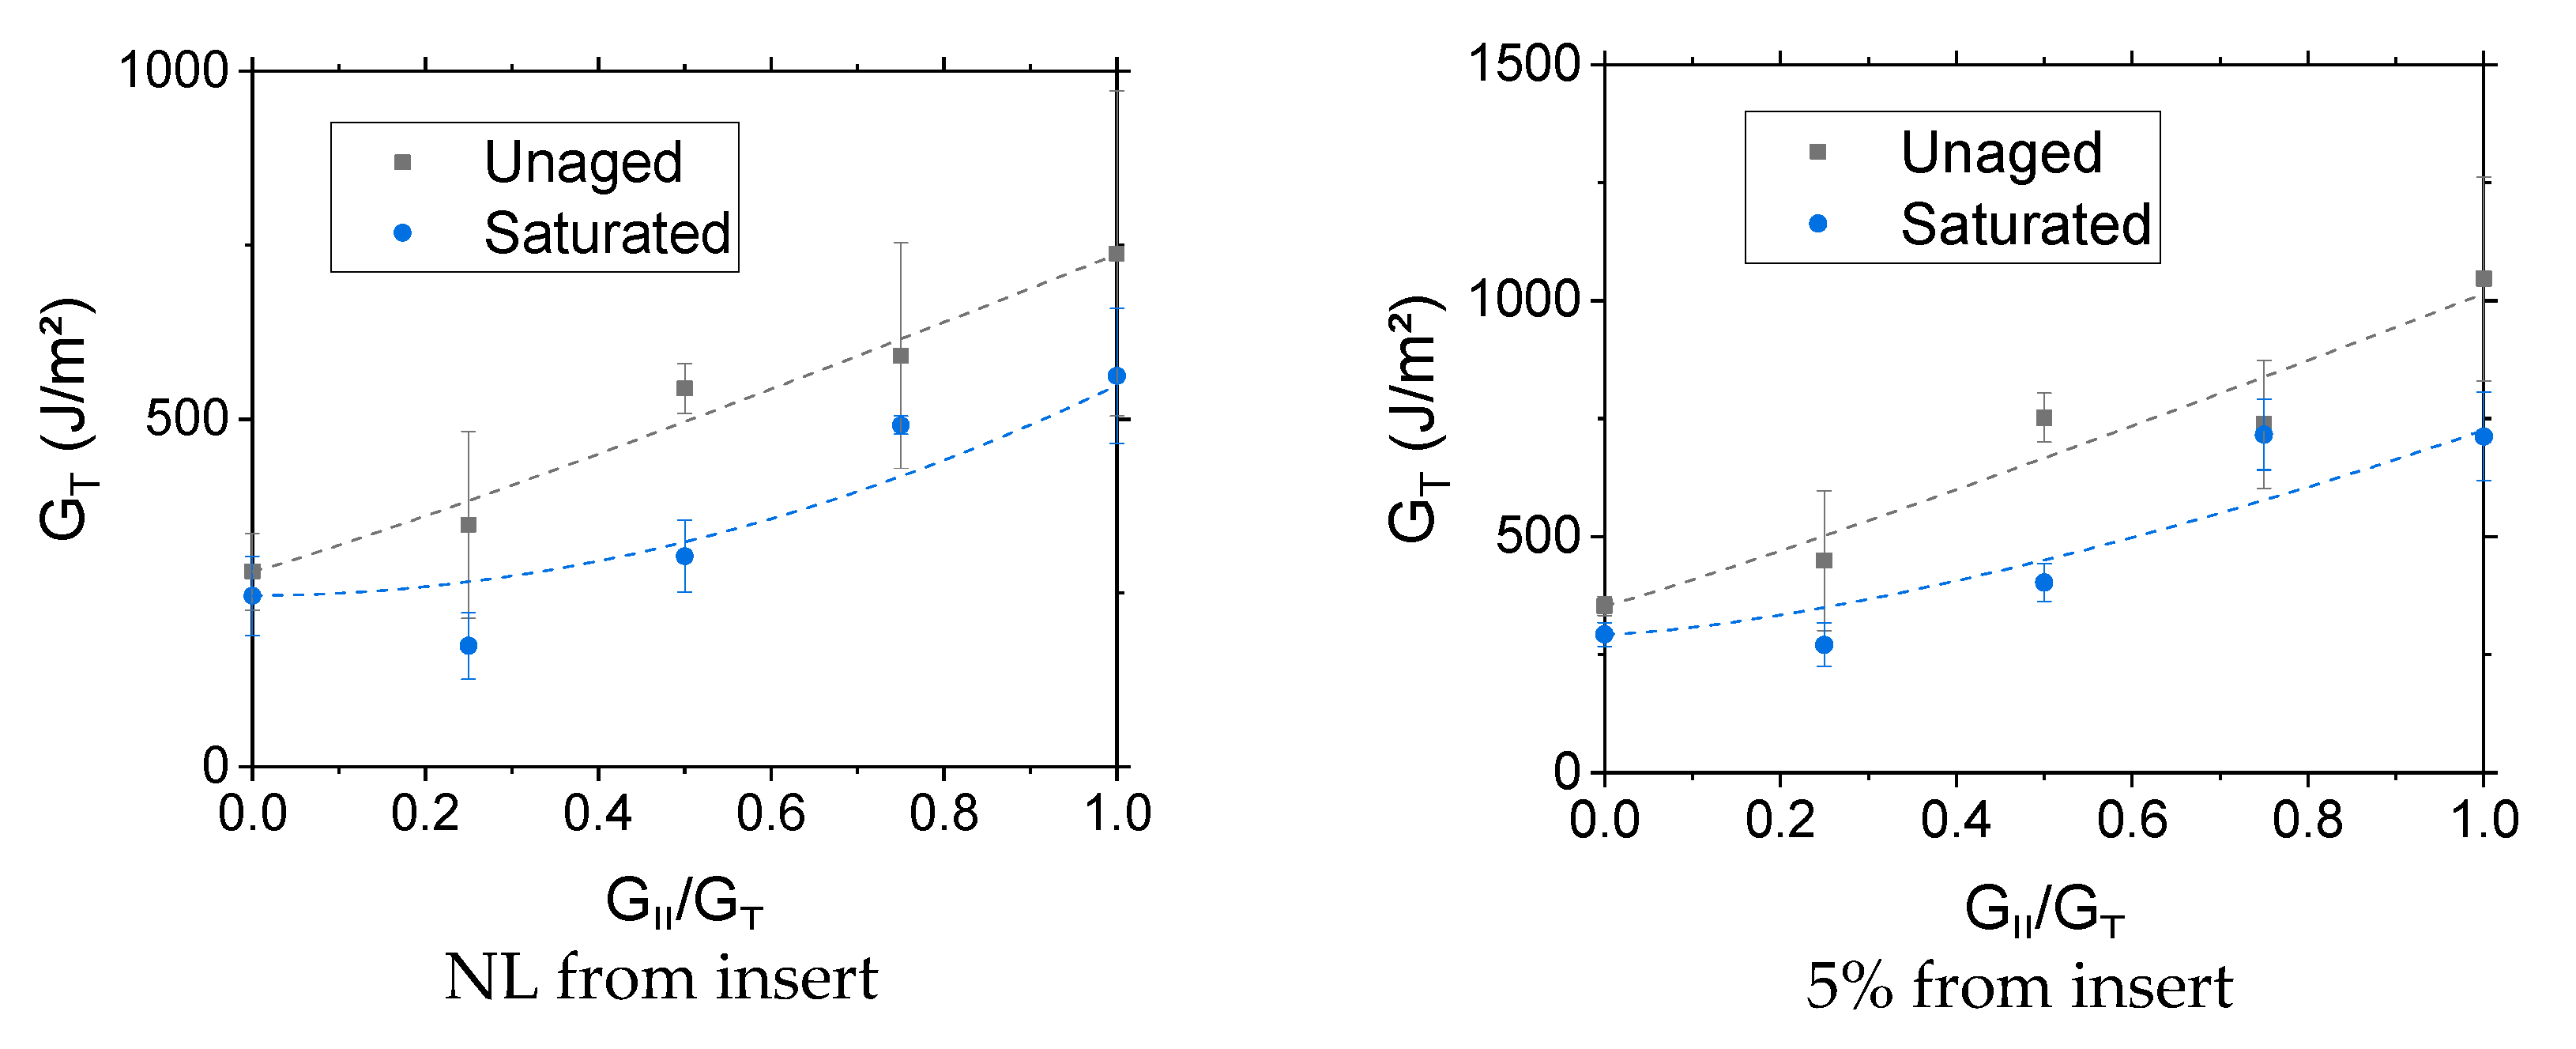
- Influence of an accelerated wet ageing protocol on mixed mode failure criteria
- -
- Influence of physical ageing
- -
- Applicability of test results
6. Conclusions
Author Contributions
Funding
Acknowledgments
Conflicts of Interest
References
- Smith, C.S. Design of Marine Structures in Composite Materials; Elsevier Applied Science: London, UK, 1990. [Google Scholar]
- Graham-Jones, J.; Summerscales, J. (Eds.) Marine Applications of Advanced Fibre-reinforced Composites; Woodhead Publishing: Cambridge, UK, 2016. [Google Scholar]
- Marsh, G. Fifty years of reinforced plastic boats. Reinf. Plast. 2006, 50, 16–19. [Google Scholar] [CrossRef]
- Ochoa, O.; Salama, M.M. Offshore composites: Transition barriers to an enabling technology. Compos. Sci. Technol. 2005, 65, 2588–2596. [Google Scholar] [CrossRef]
- Melot, D. Present and Future Composites Requirements for the Offshore Oil and Gas Industry. In Durability of Composites in a Marine Environment 2; Davies, P., Rajapakse, Y.D.S., Eds.; Springer: Dordrecht, The Netherlands, 2017; pp. 151–172. [Google Scholar]
- Bir, G.S.; Lawson, M.; Li, Y. Structural Design of a Horizontal-Axis Tidal Current Turbine Composite Blade. In Proceedings of the ASME 30th International Conference on Ocean, Offshore, and Arctic Engineering, Rotterdam, The Netherlands, 19–24 June 2011. [Google Scholar]
- Ennis, B.L.; Kelley, C.L.; Naughton, B.T.; Norris, R.E.; Das, S.; Lee, D.; Miller, D.A. Optimized Carbon Fiber Composites in Wind Turbine Blade Design; SANDIA Report SAND2019-14173; Sandia Labs: Albuquerque, NM, USA, November 2019. [Google Scholar]
- Friedrich, K. (Ed.) Application of Fracture Mechanics to Composite Materials; Elsevier: Amsterdam, The Netherlands, 1989. [Google Scholar]
- Moore, D.R.; Williams, J.G.; Pavan, A. Fracture Mechanics Testing Methods for Polymers, Adhesives and Composites; Elsevier: Amsterdam, The Netherlands, 2001. [Google Scholar]
- ISO 15024:2001. Fibre-Reinforced Plastic Composites—Determination of Mode I Interlaminar Fracture Toughness, GIC, for Unidirectionally Reinforced Materials; ISO: Geneva, Switzerland, 2001. [Google Scholar]
- Davies, P.; Sims, G.D.; Blackman, B.R.K.; Brunner, A.J.; Kageyama, K.; Hojo, M.; Tanaka, K.; Murri, G.; Rousseau, C.; Gieseke, B.; et al. Comparison of test configurations for the determination of GIIc: Results from an international round robin. Plast. Rubber Compos. 1999, 28, 432–437. [Google Scholar] [CrossRef]
- Davidson, B.D.; Sun, X. Effects of Friction, Geometry, and Fixture Compliance on the Perceived Toughness from Three-and Four-Point Bend End-Notched Flexure Tests. J. Reinf. Plast. Compos. 2005, 24, 1611–1628. [Google Scholar] [CrossRef]
- ISO 15114:2014. Fibre-Reinforced Plastic Composites—Determination of the Mode II Fracture Resistance for Unidirectionally Reinforced Materials Using the Calibrated End-Loaded Split (C-ELS) Test and an Effective Crack Length Approach; ISO: Geneva, Switzerland, 2014. [Google Scholar]
- Reeder, J.; Crews, J.J. The mixed-mode bending method for delamination testing. AIAA J. 1989, 28, 1270–1276. [Google Scholar] [CrossRef]
- ASTM D6671. Standard Test Method for Mixed Mode I-Mode II Interlaminar Fracture Toughness of Unidirectional Fiber Reinforced Polymer Matrix Composites; ASTM: Philadelphia, PA, USA, 2001. [Google Scholar]
- Alfano, G.; Crisfield, M.A. Finite element interface models for the delamination analysis of laminated composites: Mechanical and computational issues. Int. J. Numer. Methods Eng. 2001, 50, 1701–1736. [Google Scholar] [CrossRef]
- Blackman, B.R.K.; Hadavinia, H.; Kinloch, A.J.; Williams, J.G. The use of a cohesive zone model to study the fracture of fibre composites and adhesively-bonded joints. Int. J. Fract. 2003, 119, 25–46. [Google Scholar] [CrossRef]
- Marom, G. Environmental Effects on Fracture Mechanical Properties of Polymer Composites. In Application of Fracture Mechanics to Composite Materials; Friedrich, K., Ed.; Elsevier: Amsterdam, The Netherlands, 1989; pp. 397–424. [Google Scholar]
- Thomson, K.W.; Broutman, L.J. The effect of water on the fracture surface energy of fiber-reinforced composite materials. Polym. Compos. 1982, 3, 113–117. [Google Scholar] [CrossRef]
- Russell, A.; Street, K. Moisture and Temperature Effects on the Mixed-Mode Delamination Fracture of Unidirectional Graphite/Epoxy. In Delamination and Debonding of Materials; ASTM STP 876; Johnson, W., Ed.; ASTM International: Philadelphia, PA, USA, 1985; pp. 349–370. [Google Scholar]
- Garg, A.; Ishai, O. Hygrothermal influence on delamination behavior of graphite/epoxy laminates. Eng. Fract. Mech. 1985, 22, 413–427. [Google Scholar] [CrossRef]
- Selzer, R.; Friedrich, K. Influence of water up-take on interlaminar fracture properties of carbon fibre-reinforced polymer composites. J. Mater. Sci. 1995, 30, 334–338. [Google Scholar] [CrossRef]
- Zhao, S.; Gaedke, M. Moisture effects on Mode II delamination behavior of carbon/epoxy composites. Adv. Compos. Mater. 1996, 5, 291–307. [Google Scholar] [CrossRef]
- Chou, I. Effect of fiber orientation and moisture absorption on the interlaminar fracture toughness of CFRP laminates. Adv. Compos. Mater. 1998, 7, 377–394. [Google Scholar] [CrossRef]
- Asp, L.E. The effects of moisture and temperature on the interlaminar delamination toughness of a carbon/epoxy composite. Compos. Sci. Technol. 1998, 58, 967–977. [Google Scholar] [CrossRef]
- Landry, B.; La Plante, G.; Le blanc, L.R. Environmental effects on mode II fatigue delamination growth in an aerospace grade carbon/epoxy composite. Compos. Part A Appl. Sci. Manuf. 2012, 43, 475–485. [Google Scholar] [CrossRef]
- Couture, A.; Laliberte, J.; Li, C. Mode I Fracture Toughness of Aerospace Polymer Composites Exposed to Fresh and Salt Water. Chem. Mater. Eng. 2013, 1, 8–17. [Google Scholar]
- Le Blanc, L.; La Plante, G.; Li, C. Moisture effects on mixed-mode delamination of carbon/epoxy composites, in Design, Manufacturing and Applications of Composites. In Proceedings of the Tenth Joint Canada-Japan Workshop on Composites, Vancouver, BC, Canada, 19–21 August 2014; DEStech Publications, Inc.: Lancaster, PA, USA, 2015; p. 115. [Google Scholar]
- Benzeggagh, M.; Kenane, M. Measurement of mixed-mode delamination fracture toughness of unidirectional glass/epoxy composites with mixed-mode bending apparatus. Compos. Sci. Technol. 1996, 56, 439–449. [Google Scholar] [CrossRef]
- Kinloch, A.J.; Williams, J.G. Crack blunting mechanisms in polymers. J. Mater. Sci. 1980, 15, 987–996. [Google Scholar] [CrossRef]
- Baral, N.; Davies, P.; Baley, C.; Bigourdan, B. Delamination behaviour of very high modulus carbon/epoxy marine composites. Compos. Sci. Technol. 2008, 68, 995–1007. [Google Scholar] [CrossRef]
- Reeder, J.R. An Examination of Mixed Mode Delamination Failure Criteria; NASA Technical Memo 104210: Hampton, VA, USA, 1992.
- Struik, L.C.E. Physical Aging in Amorphous Polymers and Other Materials; Elsevier: Amsterdam, The Netherlands, 1978. [Google Scholar]
- Odegard, G.M.; Bandyopadhyay, A. Physical aging of epoxy polymers and their composites. J. Polym. Sci. Part B Polym. Phys. 2011, 49, 1695–1716. [Google Scholar] [CrossRef]
- Le Guen-Geffroy, A.; Le Gac, P.-Y.; Habert, B.; Davies, P. Physical ageing of epoxy in a wet environment: Coupling between plasticization and physical ageing. Polym. Degrad. Stab. 2019, 168, 108947. [Google Scholar] [CrossRef]
- El Yagoubi, J.; Lubineau, G.; Saghir, S.; Verdu, J.; Askari, A. Thermomechanical and hygroelastic properties of an epoxy system under humid and cold-warm cycling conditions. Polym. Degrad. Stab. 2014, 99, 146–155. [Google Scholar] [CrossRef]
- Morgan, R.J.; O’Neal, J.E. The Durability of Epoxies. Polym. Technol. Eng. 1978, 10, 49–116. [Google Scholar] [CrossRef]
- Nogueira, P.; Torres, A.; Abad, M.-J.; Cano, J.; Barral-Losada, L.F.; Ramírez, C.; López, J.; López-Bueno, I. Effect of water sorption on the structure and mechanical properties of an epoxy resin system. J. Appl. Polym. Sci. 2001, 80, 71–80. [Google Scholar] [CrossRef]
- Barrett, J.; Foschi, R. Mode II stress-intensity factors for cracked wood beams. Eng. Fract. Mech. 1977, 9, 371–378. [Google Scholar] [CrossRef]
- Carlsson, L.; Gillespie, J.; Pipes, R. On the Analysis and Design of the End Notched Flexure (ENF) Specimen for Mode II Testing. J. Compos. Mater. 1986, 20, 594–604. [Google Scholar] [CrossRef]
- Martin, R.H.; Davidson, B. Mode II fracture toughness evaluation using a four point bend end notched flexure test. In Proceedings of the 4th International Deformation and Fracture of Composites Conference (DFC4), London, UK, 24–26 March 1997; Institute of Materials: London, UK, 1997; pp. 243–252. [Google Scholar]
- O’Brien, T.K.; O’Brien, T. Composite Interlaminar Shear Fracture Toughness, GIIc: Shear Measurement or Sheer Myth? In Composite Materials: Fatigue and Fracture; Volume 7th, Bucinell, R., Ed.; ASTM STP 1330; ASTM International: West Conshohocken, PA, USA, 1998; pp. 3–18. [Google Scholar]
- Vanderkley, P.S. Mode I-Mode II Delamination Fracture Toughness of a Unidirectional Graphite/Epoxy Composite. Master’s Thesis, Texas A & M University, College Station, TX, USA, 1981. [Google Scholar]


| Loading Mode | Material | Ageing Condition. Starter Crack Type | Influence of Water on Fracture Toughness | Reference |
|---|---|---|---|---|
| I (Double Torsion) | Carbon/Epoxy | Water 70 °C. Saw cut + razor | No effect | Thomson and Broutman, 1982 [19] |
| I/II | Carbon/Epoxy | 50% RH, Wet. PTFE film | Gc↑ for mode I dominated No effect on Gc for shear dominated tests | Russell and Street, 1985 [20] |
| I, II | Carbon/Epoxy | 50% RH, Wet. Mode I precrack | GIc↑, GIIc↓ for wet | Garg and Ishai, 1985 [21] |
| I, II | Carbon/Epoxy, Carbon/PEEK | Water 22, 77, 100 °C Unaged, half-saturated, fully saturated. Foil film starter | Epoxy: GIc↑, GIIc↓ PEEK: GIc no effect, GIIc↓ | Selzer and Friedrich, 1995 [22] |
| II | Carbon/Epoxy | Various RH conditions. Film | GIIc ↓ | Zhao, Gaedke, 1996 [23] |
| Carbon/Epoxy | Dry, 50% RH, Wet Precrack | GIc initiation no effect, GIc propagation ↓ for wet GIIc ↓ for wet | Chou I, 1998 [24] | |
| I, II, I/II | Carbon/Epoxy | Moisture saturated. Polyimide film | GIc no effect, Gc mixed and mode II ↓ for wet | Asp, 1998 [25] |
| II | Carbon/Epoxy | Saturated distilled water. Film and precrack | GIIc ↓ for wet | Landry et al., 2012 [26] |
| I | Carbon/Toughened epoxy adhesively bonded | Fresh and sea water, 70, 82 °C. Precrack | GIc↓ | Couture, 2013 [27] |
| I/II | Carbon/Epoxy | Saturated distilled water 70 °C. Precrack | GIc ↑ GI/IIc ↓ for wet | LeBlanc et al., 2015 [28] |
| Initiation from Film | Initiation from Precrack | Propagation | |||||
|---|---|---|---|---|---|---|---|
| Criterion | NL | 5%/Max. | NL | 5%/Max | Mean Entire R-Curve | Peak | Valley |
| Unaged, Dry | 281 (55) | 353 (19) | 388 (80) | 527 (79) | 799 (89) | 835 (93) | 722 (77) |
| Saturated | ↘246 (67) | ↘293 (25) | ↘277 (13) | ↘432 (11) | ↘600 (105) | ↘616 (96) | ↘597 (102) |
| Re-dried after saturation | ↘219 (13) | ↘272 (48) | ↗355 (60) | ↗468 (42) | ↘564 (57) | ↘570 (55) | ↘559 (55) |
| Initiation from Film | Initiation from Precrack | Propagation | |||
|---|---|---|---|---|---|
| Criterion | NL | 5%/Max. | NL | 5%/Max | Mean Entire R-Curve |
| Unaged, Dry | 738 (234) | 1046 (216) | 1078 (316) | 1455 (253) | 1790 (410) |
| Saturated | ↘562 (97) | ↘713 (93) | ↘1032 (176) | ↘1255 (261) | ↘1378 (388) |
| Re-dried after saturation | ↗728 (124) | ↗958 (80) | ↘993 (163) | ↗1374 (236) | ↗1475 (255) |
| 25% Mode II | Initiation from Film | Initiation from Precrack | Propagation | ||||
| Criterion | NL | 5%/Max. | NL | 5%/Max | Global mean | Peak | Valley |
| Unaged, Dry | 348 (134) | 449 (148) | 373 (163) | 473 (192) | 818 (315) | 913 (339) | 859 (333) |
| Saturated | ↘174 (48) | ↘271 (46) | ↘280 (29) | ↘416 (33) | ↘712 (183) | ↘764 (175) | ↘728 (168) |
| 50% Mode II | Initiation from Film | Initiation from Precrack | Propagation | ||||
| Criterion | NL | 5%/Max. | NL | 5%/Max | Global mean | Peak | Valley |
| Unaged, Dry | 544 (36) | 752 (52) | 517 (48) | 670 (132) | 795 (134) | 813 (148) | 780 (148) |
| Saturated | ↘303 (52) | ↘403 (40) | ↘421 (58) | ↘576 (66) | ↘708 (134) | ↘748 (139) | ↘706 (143) |
| 75% Mode II | Initiation from Film | Initiation from Precrack | Propagation | ||||
| Criterion | NL | 5%/Max. | NL | 5%/Max | Global mean | Peak | Valley |
| Unaged, Dry | 591 (162) | 783 (135) | 562 (109) | 759 (111) | 942 (113) | 1020 (112) | 935 (97) |
| Saturated | ↘491 (13) | ↘716 (75) | ↗676 (141) | ↗867 (110) | ↗1063 (144) | ↗1134 (111) | ↗1093 (88) |
| n | Unaged | Seawater Saturated |
|---|---|---|
| NL film | 1.085 | ↗1.972 |
| 5% film | 1.079 | ↗1.458 |
| NL precrack | 3.588 | ↘2.215 |
| 5% precrack | 3.793 | ↘2.300 |
| Propagation | 6.189 | ↘1.693 |
| Glass/epoxy [29] | 2.6 | - |
| Carbon/PEEK [31] | 2.284 | - |
| Initiation from Film | Initiation from Precrack | Propagation | |||||
|---|---|---|---|---|---|---|---|
| Criterion | NL | 5%/Max. | NL | 5%/Max | Mean Entire R-Curve | Peak | Valley |
| Rejuvenated | 190 (57) | 359 (120) | 497 (21) | 816 (14) | 800 (103) | 832 (98) | 744 (76) |
| Physically aged in air | ↔189 (57) | ↘295 (80) | ↘386 (77) | ↘632 (95) | ↘621 (57) | ↘645 (57) | ↘603 (53) |
| Initiation from Film | Initiation from Precrack | Propagation | |||
|---|---|---|---|---|---|
| Criterion | NL | 5%/Max. | NL | 5%/Max | Mean Entire R-Curve |
| Rejuvenated | 546 (90) | 720 (95) | 683 (131) | 971 (116) | 1275 (121) |
| Physically aged in air | ↗584 (51) | ↗768 (24) | ↘596 (20) | ↘912 (23) | ↘1119 (98) |
© 2020 by the authors. Licensee MDPI, Basel, Switzerland. This article is an open access article distributed under the terms and conditions of the Creative Commons Attribution (CC BY) license (http://creativecommons.org/licenses/by/4.0/).
Share and Cite
Le Guen-Geffroy, A.; Davies, P.; Le Gac, P.-Y.; Habert, B. Influence of Seawater Ageing on Fracture of Carbon Fiber Reinforced Epoxy Composites for Ocean Engineering. Oceans 2020, 1, 198-214. https://doi.org/10.3390/oceans1040015
Le Guen-Geffroy A, Davies P, Le Gac P-Y, Habert B. Influence of Seawater Ageing on Fracture of Carbon Fiber Reinforced Epoxy Composites for Ocean Engineering. Oceans. 2020; 1(4):198-214. https://doi.org/10.3390/oceans1040015
Chicago/Turabian StyleLe Guen-Geffroy, Antoine, Peter Davies, Pierre-Yves Le Gac, and Bertrand Habert. 2020. "Influence of Seawater Ageing on Fracture of Carbon Fiber Reinforced Epoxy Composites for Ocean Engineering" Oceans 1, no. 4: 198-214. https://doi.org/10.3390/oceans1040015
APA StyleLe Guen-Geffroy, A., Davies, P., Le Gac, P.-Y., & Habert, B. (2020). Influence of Seawater Ageing on Fracture of Carbon Fiber Reinforced Epoxy Composites for Ocean Engineering. Oceans, 1(4), 198-214. https://doi.org/10.3390/oceans1040015