Article

Comparative Analysis of the Physicochemical Properties of 3D-Printed and Conventional Resins for Temporary Dental Restorations

by
Oscar Javier Valencia-Blanco
1,*,
Esteban Pérez-Pevida
2,
Daniel Robles-Cantero
2,
Enrique Montalvillo
2,
Javier Gil
3,* and
Aritza Brizuela-Velasco
2
1
Prosthodontics, Faculty of Health Sciences, C/Padre Julio Chevalier 2, 47012 Valladolid, Spain
2
DENS ia Res Grp, Faculty of Health Sciences, European University Miguel de Cervantes, C/Padre Julio Chevalier 2, 47012 Valladolid, Spain
3
Bioinspired Oral Biomaterials and Interfaces, Department Ciencia e Ingeniería de Materiales, Universitat Politècnica de Catalunya, Av. Eduard Maristany 16, 08019 Barcelona, Spain
*
Authors to whom correspondence should be addressed.
Prosthesis 2025, 7(5), 129; https://doi.org/10.3390/prosthesis7050129
Submission received: 5 September 2025 / Revised: 10 October 2025 / Accepted: 13 October 2025 / Published: 16 October 2025

Abstract

Objective. The aim of this in vitro study was to compare the physical and mechanical properties of two resins used for provisional prostheses: a direct self-curing dimethacrylate resin and a 3D-printed resin, in order to assess their potential for different clinical applications. Methods. Flexural strength, microhardness, wear resistance, and water absorption were evaluated in accordance with ISO 4049 and ISO 10477. Samples were analyzed using scanning electron microscopy, X-ray spectroscopy, and mechanical testing, including flexural, wear, and scratch assays. Results. The 3D-printed resin demonstrated superior flexural strength (128 ± 2 MPa vs. 127 ± 16 MPa), microhardness (19.45 HV vs. 8.10 HV, p < 0.05), and wear resistance (mean wear area: 0.030 mm2 vs. 0.047 mm2) compared to the self-curing dimethacrylate composite. However, it exhibited significantly higher water absorption (55.98 µg/mm3 vs. 15.0 µg/mm3), which may compromise its long-term durability in humid environments. Conclusions. Overall, the 3D-printed resin shows promising mechanical performance, but its high-water absorption remains a limitation for extended use. Further studies are required to evaluate its degradation and behavior under intraoral conditions. Clinical relevance. For the time being, self-curing resins remain the preferred choice for long-term provisional prostheses.

1. Introduction

Provisional prostheses (PPs) play a fundamental role in contemporary dentistry, as they preserve function and aesthetics during the transitional phase prior to definitive restorations. Their relevance is especially critical in implant-supported rehabilitation of the anterior region, where immediate restoration of appearance strongly influences patient satisfaction and psychological well-being [1]. Beyond aesthetics, PPs must be functional and closely mimic the properties of the final restoration [2,3]. They also contribute to periodontal and peri-implant health by guiding tissue healing through precise marginal and structural adaptation [4], which is particularly important in aesthetically demanding areas. In addition, PPs serve a diagnostic purpose, enabling the evaluation of parameters such as emergence profile, contact points, occlusion, vertical dimension, and functional patterns [4,5,6]. This information not only facilitates treatment planning, but also helps align clinical outcomes with patient expectations. While they often serve as a short-term solution during laboratory processing, PPs are frequently used for extended periods to stabilize occlusion or refine aesthetic outcomes prior to definitive restoration.
The growing clinical adoption of 3D-printed resins in dentistry has been driven by the expiration of key patents [7], reduced printing costs, and the availability of resins specifically designed for dental applications [8,9,10]. These prostheses are fabricated outside the oral environment, using intraoral scans and digital design under controlled conditions that enhance precision. Compensation for polymerization shrinkage during the digital workflow further improves fit and functionality [8,9,10]. However, the mechanical properties of 3D-printed materials are highly sensitive to the manufacturing protocol. Factors such as build orientation [11,12,13], the solvent used during cleaning (e.g., ethanol or isopropyl alcohol) [14], and the duration of post-curing [15] can significantly influence strength, surface quality, and colour stability. Strict adherence to validated protocols is therefore essential for predictable clinical performance.
Although they cannot be fabricated immediately after tooth preparation, indirectly manufactured 3D-printed offer several advantages. Their biocompatibility is enhanced by avoiding intraoral release of unpolymerized monomers [16,17,18,19,20], and they exert a reduced environmental impact on microbial ecosystems [21,22,23,24,25]. They also allow for greater aesthetic customization through individualized colouring and glazing, which improves both appearance and surface protection [26,27]. Furthermore, the digital workflow enables rapid replacement in case of fracture, as prostheses can be reprinted directly from stored design files, minimizing patient inconvenience. While the initial investment in the technology is relatively high, the lower cost per unit makes it cost-effective over time.
The physical and mechanical properties of dental resins are strongly influenced by monomer structure. Most monomers contain two methacrylate groups linked by a central carbon chain, whose length and geometry determine crosslink density, flexibility, and cohesion within the polymer network. Bis-GMA [28], remains widely used due to its rigidity and low polymerization shrinkage. However, its high viscosity, resulting from its rigid phenyl core and hydroxyl groups capable of hydrogen bonding, restricts molecular mobility and complicates filler incorporation. To overcome these limitations, low-viscosity comonomers such as TEGDMA are often added, though at the cost of increased shrinkage. Alternatives such as Bis-EMA, an ethoxylated Bis-GMA analogue with reduced hydrogen bonding capacity, and UDMA, with its flexible linear structure, have been employed to enhance handling, mobility, and toughness [29,30]. Advances in formulation have therefore focused on optimizing monomer blends and filler loading to balance mechanical performance, shrinkage, and water absorption.
Polymerization generates a three-dimensional network, in which the degree of crosslinking—determined by monomer length and structure—directly affects stiffness and strength [31,32]. Short-chain monomers increase crosslinking density and rigidity but contribute to higher shrinkage [33,34,35]. Water absorption is modulated by chemical structure: aromatic chains absorb less water than aliphatic ones, with Bis-EMA exhibiting the lowest absorption due to the absence of hydrogen bonding groups [36]. The degree of conversion, i.e., the proportion of polymerized monomers, also influences performance: higher conversion enhances strength, but reduces flexibility [36,37,38,39]. Crosslinking mechanisms—covalent or hydrogen bonding—differentially affect elasticity and solvent resistance [39,40,41]. Finally, the incorporation of inorganic fillers of varying sizes and morphologies improves wear resistance and dimensional stability [42,43,44,45].
Despite these advances, relatively few studies have directly compared the physicochemical properties of self-curing dimethacrylate composite and photopolymerized 3D-printed composite intended for fixed prostheses. The present study aims to compare the physicochemical characteristics of a 3D-printed photopolymerized resin used for indirectly fabricated PPs with those of a self-curing, nanofiller-reinforced composite. By evaluating the influence of both material composition and manufacturing technique, this work seeks to provide clinically relevant insights to guide material selection and optimize the performance of provisional fixed prosthetic restorations.
The objective of this in vitro investigation was to compare the physicochemical properties of a self-curing dimethacrylate resin and a 3D-printed resin for provisional prostheses. Accordingly, the following null hypothesis was tested: there are no statistically significant differences in the evaluated physicochemical properties between the two material groups. This research does not aim to generalize the behavior of self-curing resins or those used in 3D printing. The results refer specifically to those studied in this study, as the compositions of both organic and inorganic components can vary, as can working conditions.

2. Materials and Methods

Two commercially available resins intended for Provisional prostheses were selected for this study. One was a self-curing dimethacrylate composite (Structur 3, VOCO GmbH, Germany), and the other a photopolymerized 3D-printed composite (NextDent C&B MFH, Vertex-Dental B.V., Soesterberg, The Netherlands). The resins were processed according to their respective manufacturer’s recommendations. Due to the lack of complete compositional transparency by the manufacturers, complementary chemical information was retrieved from safety data sheets and existing literature [34] (Table 1).
Each test was performed on a minimum of fifteen samples per material (n = 15), following ISO standards (ISO 4049, ISO 10477) [46,47] or validated methods from the literature. The chosen sample sizes ensured statistical validity while maintaining experimental feasibility for in vitro testing. For mechanical tests, a sample size of n = 20 is generally considered sufficient to detect statistically significant differences, provided that the data meet the assumptions of normal distribution and homogeneity of variances. In contrast, for surface-related properties or outcomes with greater inherent variability, larger sample sizes were employed to improve statistical power and ensure result reproducibility.
During self-curing dimethacrylate composite resin manufacturing process, specific mixing tips provided by the manufacturer were used, ensuring an adequate and homogeneous mixing of the resin components. The mixed resin was poured into molds made to the required dimensions and allowed to polymerize until fully cured. The Structure 3 (VOCO) cartridge system with its mixing tips ensures homogeneous mixing and uniform curing of Structure 3, without the need for any type of activation. Once the preparations for printing are complete, the material is applied and inserted into the 316L austenitic stainless-steel mold to obtain the parts that will be subjected to the various studies. After an intraoral setting time of 45 s, the material remains slightly elastic and can therefore be easily removed from the mold. Four minutes after mixing begins, Structur 3 is sufficiently polymerized to begin finishing the margins and contours. Once curing is complete, simply wipe with a cloth soaked in alcohol to remove the inhibition layer formed by contact with atmospheric oxygen. Finishing with a rotary instrument is not necessary
The photopolymerized 3D-printed composite resin samples were designed using Blender 4.2 software (Blender HQ, Amsterdam, The Netherlands) and printed in the ARCHIMEDES® dental prosthetics laboratory (Lleida, Spain). For printing, Live Build DLP software and an Envisiontec D4K 3D printer (EnvisionTEC US LLC, Dearborn, MI, USA) were used. The resin used in this process was NextDent C&B MFH (Vertex-Dental B.V., AV Soesterberg, The Netherlands) with an impression layer height of 0.1 mm. The photopolymerization process during printing was carried out at a controlled temperature of 20 °C. The provisional was cleaned in an ultrasonic bath with isopropyl alcohol for 3 min and placed for one hour in the dental BBcure curing oven (MECCATRONICORE, Catania, Italy) at 20 °C and in a nitrogen atmosphere.

2.1. Roughness

Surface roughness refers to the microscopic topographical characteristics of a material’s surface and is quantified using various parameters, the most common being Sa (Arithmetic mean height, a 3D measurement; Sa quantifies surface roughness by measuring the average height difference between the surface’s peaks and valleys), Sy (Maximun height; represent the highest point), St (Total Height; sum of the maximum and minimum heights, reflecting the overall height variation), Sm (Mean crest height; quantifies the average height of the surface peaks. It provides information about the overall crest height characteristics of the surface) and Pc values (Peak curvature; curvature of the surface peaks. They are useful for understanding the shape and sharpness of the surface features [48].
The surface roughness measurements were performed using white light interferometer microscopy (Optical Profiling System, Wyko NT1100, Veeco, Plainview, NY, USA). Fifteen samples of each of the different material were analyzed and for every sample three readings of rugosity were carried out. A phase-correct filter, a Gaussian cut-off filter, was used to separate the waviness and form from the roughness. In our case, it was used a cut-off value (λc) of 2.5 for roughened samples which covers 2.0 < Ra range ≤ 10.0 and λc = 0.25 for smoothed samples.

2.2. Contact Angle Determination

To determine the contact angle, 8.5 mm diameter and 4 mm thick discs were prepared (15 samples per resin). The materials’ surfaces were polished with 1200 fine grit polishing discs (number of particles/cm2). Contact angles were measured with an OCA 11 goniometer (Dataphysics, Filderstadt, Germany), using distilled water and a drop volume of 2 µL, with one measurement per specimen. The goniometer, which has a stereoscopic magnifying glass attached to it, allows for the image analysis system (Image J, Burleson, TX, USA) to determine the tangents between the liquid and the air and automatically determine the contact angle. Measurements are taken immediately after the drop makes contact, although no variations in angle were observed over time.
At the rough surfaces, droplets confront two different conditions. In the first mode, the water droplet contacts with the rough surface placed under the drop, resulting in wetting of all the grooves below the drop surface, Wenzel explained that at the rough surface, the actual area of the solid–liquid contact under the drop was greater than the flat surface [21]. Modified Wenzel’s Equation (1) is
cosθW = rcosθY
where θW is the apparent contact angle in Wenzel’s theory and r is the surface roughness ratio, which is obtained in accordance with Equation (2). In fact, r is the ratio of the actual surface, Ar, to the geometric surface, A0 [25,49]:
r = ArA0 = cosθWcosθY

2.3. Determination of Flexural Strength

Twenty bar-shaped specimens per group (n = 20) were fabricated according to ISO 4049, with dimensions of 25 × 2 × 2 mm. This sample size is aligned with the minimum required by the ISO standard for flexural testing. Specimens were polished using 320-grit silicon carbide paper and stored in distilled water at 37 °C for 24 h prior to testing. The flexural strength was evaluated using a three-point bending test on a universal testing machine (Zwick/Roell, Ulm, Germany) with a 5 kN load cell, a crosshead speed of 0.75 mm/min, and a span length of 20 mm. Load was applied at the midpoint between supports.

2.4. Fracture Surface Analysis Using Scanning Electron Microscopy

The fractured specimens from the flexural strength test (n = 10 per group) were selected for morphological and elemental analysis. Scanning electron microscopy (SEM, JEOL JSM 5410) was used to observe fracture patterns, and energy-dispersive X-ray spectroscopy (EDS) was applied for chemical characterization. All specimens were sputter-coated with carbon to ensure electrical conductivity and avoid spectral interference.
A total of 20 fracture surfaces (ten specimens, each with two fracture faces) were examined under the microscope. The fractographic analysis revealed highly similar features across all surfaces, confirming that the same fracture mechanism was present in each sample. This consistency supports the use of n = 10 as a sufficient sample size for representative fractographic analysis of filler content and matrix homogeneity.

2.5. Density Determination

Four cylindrical specimens per group (n = 15) with dimensions of 15 mm diameter × 2 mm thick were fabricated. Density was determined using a Mettler Toledo XS205 balance via Archimedes’ method.

2.6. Microhardness Test

Four samples per resin (n = 15), each subjected to five indentations (totalling 20 values per group), were tested using a Vickers microhardness tester EMCO-TEST (Kuchl, Austria) (500 g load, 15 s dwell time, 10× magnification). The mean of five indentations per specimen was calculated.

2.7. Water Absorption

Five disc-shaped samples per group (n = 15), 15.0 ± 0.1 mm in diameter and 1.0 ± 0.1 mm thick, were fabricated. Mass stabilization was confirmed via a desiccation cycle before immersion in distilled water at 37 °C for 7 days. Water sorption was calculated according to ISO 4049.

2.8. Wear Resistance Study

Fifteen specimens per group (n = 15) were subjected to tribological testing using a CSEM pin-on-disc (CSEM instruments, Neuchâtel, Switzerland) device. Parameters included a 10 N normal load, 10 cm/s tangential velocity, 500 m sliding distance, and Hank’s solution as lubricant. Scratch resistance Evaluation
Scratch resistance was evaluated using a Revetest RST instrument (CSM Instruments, Neuchâtel, Switzerland), which applies a progressive load through a Rockwell C diamond indenter. For each material, fifteen specimens were prepared (n = 15), and a constant load of 10 N was applied along a 3 mm linear path. A preliminary scan with a 1 N load was performed over the same trajectory to calibrate the measurement parameters and ensure accuracy.
Three scratch lines were made per specimen, and the average value was calculated for each group. The scratch traces were analysed using optical microscopy to measure the width of the wear channel, supported by image analysis software (OmniMet Enterprise, Bühler Technologies GmbH, Ratingen, Germany) and captured with an Olympus GX51 camera.
To enhance visualization and light reflection for detailed examination, all specimens were coated with a thin carbon film using a PVD-sputtering process (LEICA, Wetzlar, Germany). This preparation allowed for the more accurate evaluation of key parameters such as friction force, dynamic friction coefficient, and indenter penetration depth.

2.9. Statistical Analysis

Statistical analysis was performed using Minitab 16 software. Normality was assessed using the Shapiro–Wilk test. For normally distributed data, the independent samples Student’s t-test was applied; otherwise, the non-parametric Mann–Whitney U test was used. A significance level of p < 0.05 was established for all comparisons.

3. Results

3.1. Roughness and Wettability

Table 2 shows the roughness parameters obtained for the different composites and the contact angles corrected by the Wenzel equation. No statistically significant difference is observed in the different parameters of roughness (p < 0.05) The average contact angle of the photopolymerized 3D-printed composite is higher, with statistically significant differences (p value 0.0033). In summary, the results indicate that self-curing dimethacrylate composite resin is more hydrophilic than photopolymerized 3D-printed composite.

3.2. Flexural Strength

The descriptive statistical results of the mechanical tests for both resins are presented in Figure 1 for five examples of 20 tested for each material and Table 3. Student’s t-test for independent samples determined statistically significant differences in all the parameters evaluated between the two resins.
The measured values are equivalent in flexural strength, but that of photopolymerized 3D-printed composite is somewhat higher, with statistically significant differences. For modulus of elasticity, toughness and displacement at break, the results of the 3D resin were superior when compared to self-curing dimethacrylate composite, with statistically significant differences and p-values, in all three cases, close to zero.

3.3. Surface Study

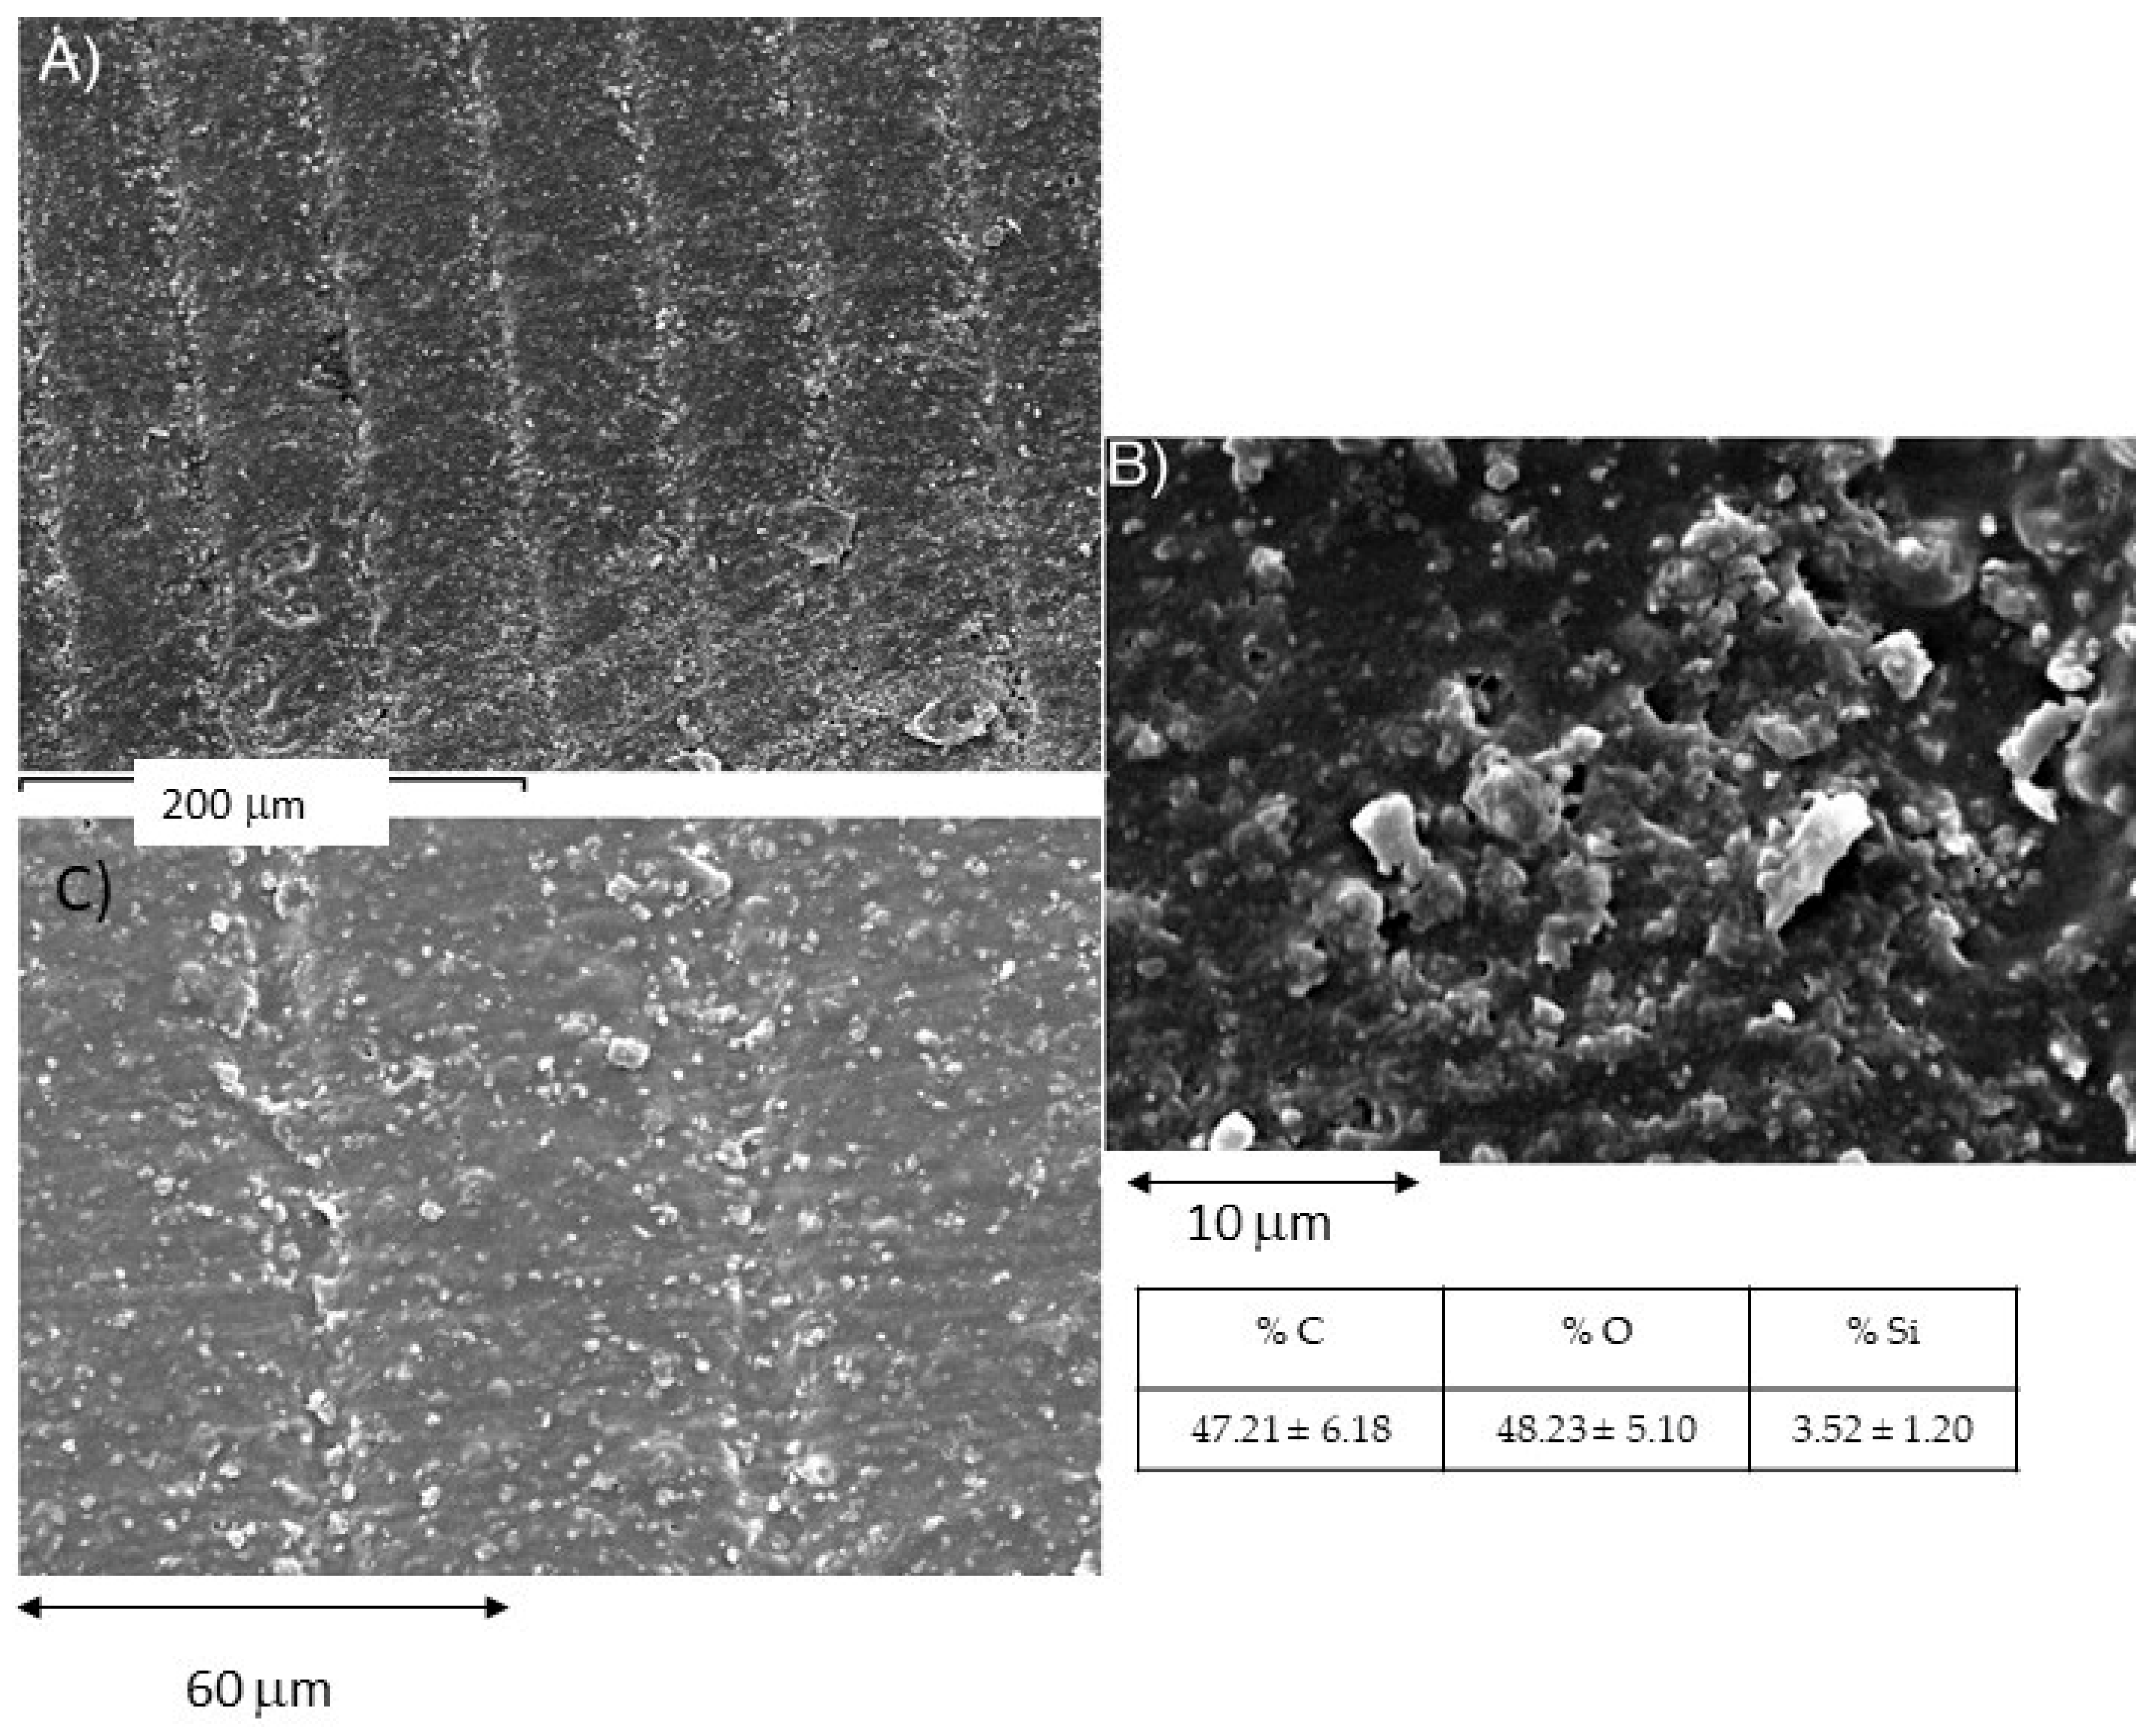
The fracture surface micrographs presented in Figure 2A,B, show the Self-curing dimethacrylate composite surface, where particles or agglomerates with an approximately 2–3 μm diameter are observed. Chemical composition by EDS microanalysis were performed on these particles, reveals the presence of silicon, suggesting they could be composed of silicon oxide. On the other hand, these findings demonstrate the presence of a nanometer-sized inorganic filler in the composition of this resin.
Figure 3 presents micrographs of the fracture surface of the photopolymerized 3D-printed composite surface, evidencing its amorphous nature, characteristic of materials composed of long molecular chains lacking crystalline structures or ordered patterns, unlike crystalline materials. Chemical analysis reveals a minimal presence of silicon oxide, with concentrations below the equipment’s sensitivity limit, recording values less than 4% in all cases analyzed. These results confirm that silicon oxide particles play a marginal role in the Photopolymerized 3D-printed composite overall composition.
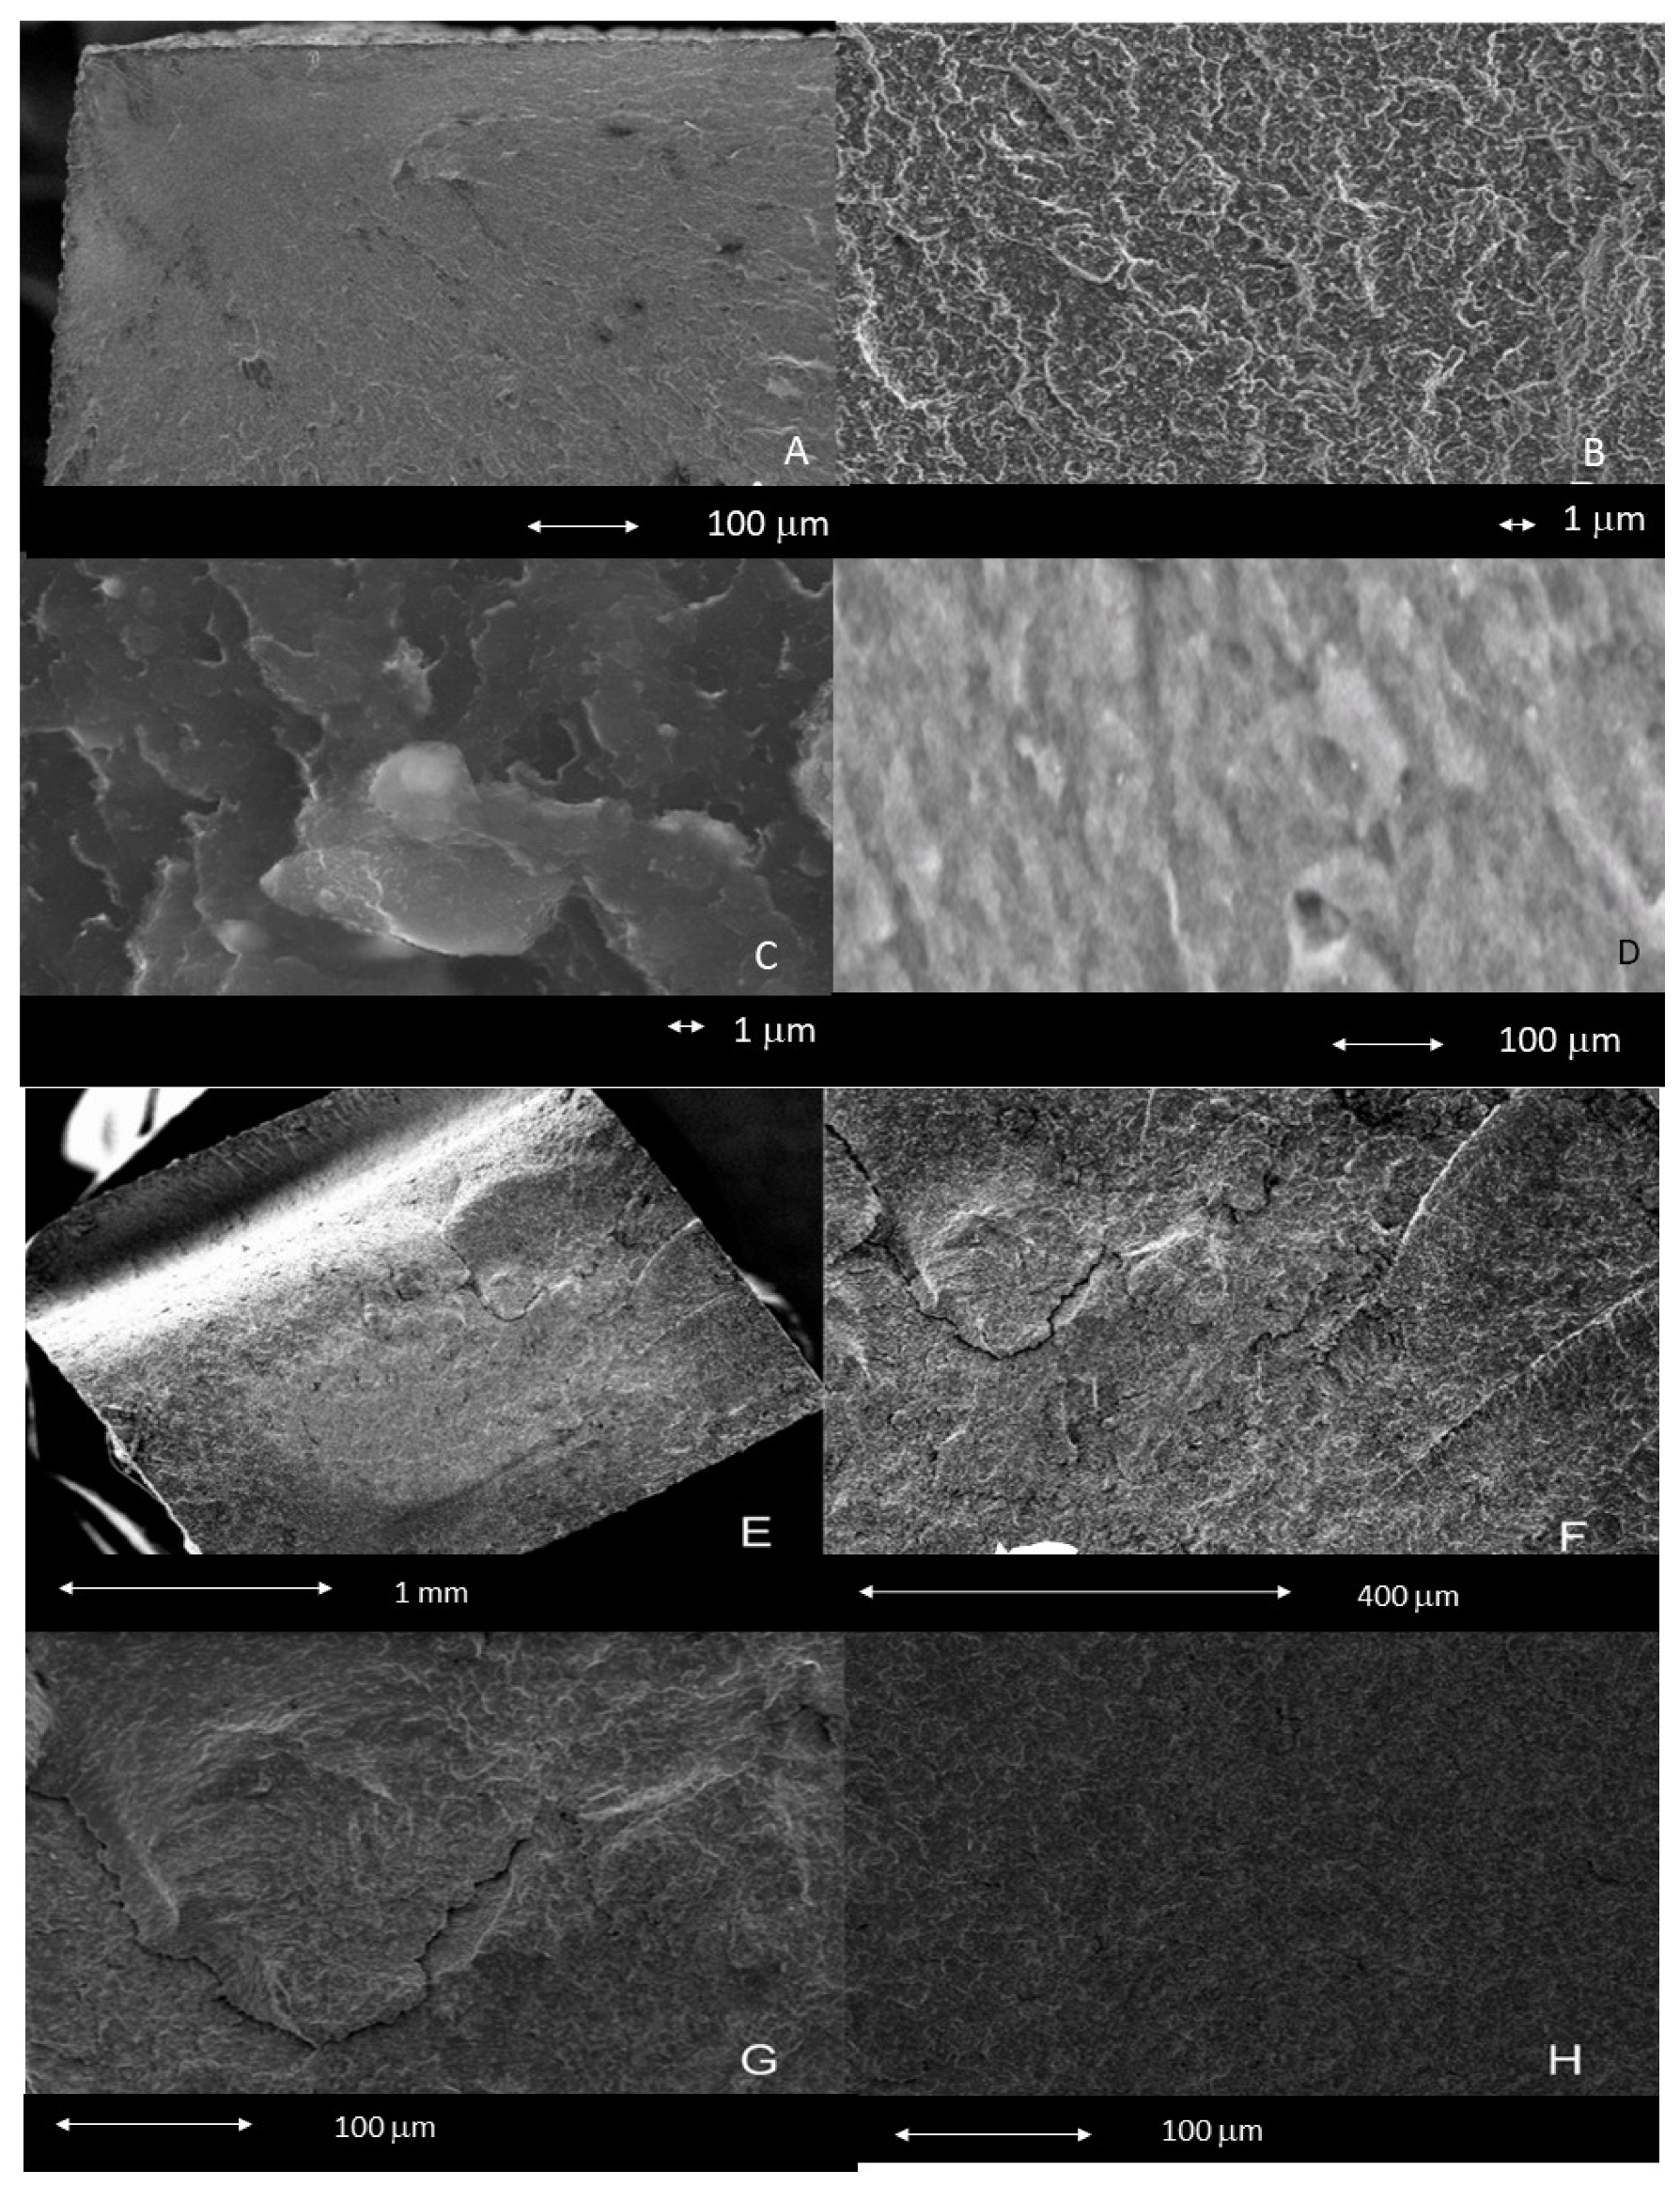
Aspects of the fracture surface of the self-curing dimethacrylate composite resin are shown in Figure 4A–C. In the upper right corner (A), a smooth area is observed. This area, called the mirror zone, could be associated with the beginning of the material fracture. In this region, it is possible that there was a defect facilitating the brittle fracture of the material. The mirror zone is a region of the fracture surface located near the fracture origin that is smooth, flat, and reflective. This characteristic is typically observed in glass and brittle, amorphous plastics such as polystyrene (PS) and polymethyl methacrylate (PMMA), as well as thermosetting resins such as polyester and epoxy. Details of the rough zone of the fracture surface are shown in Figure 4B,C, these rough zones are associated with high energy dissipation due to localized plastic deformation on the fracture surface. Figure 4E shows the fracture surface of the photopolymerized 3D-printed composite, where a central defect, similar to a crack, is identified. This could have been the origin of the material fracture. In the micrograph taken at higher magnifications (Figure 4F), characteristic lines are observed suggesting the propagation of a brittle fracture.

3.4. Density

The individual density results on the samples of both resins and their descriptive and inferential statistical analysis are shown in Table 4. For both groups, results follow a normal distribution (Shapiro–Wilk, p > 0.05). The mean density of the self-curing dimethacrylate composite is higher, with statistically significant differences (p < 0.001). These results suggest that the 3D resin and the self-curing dimethacrylate composite present differences in their structural properties.

3.5. Water Absorption (SW)

The individual results of water absorption on the samples of both resins and their descriptive and inferential statistical analysis are shown in Table 5. For both groups, results follow a normal distribution (Shapiro–Wilk, p > 0.05). The mean water absorption of the self-curing dimethacrylate composite is lower, with statistically significant differences (p < 0.001).

3.6. Microhardness Determination

The results for the self-curing dimethacrylate composite showed a normal distribution in its microhardness data (Table 6), according to the Shapiro–Wilk test (p = 0.7897), while the 3D Resin did not comply with normality (p = 0.0244). Since one of the groups does not follow a normal distribution, the Mann–Whitney U test was applied. The 3D Resin showed a significantly higher average microhardness (p > 0.001) compared to the self-curing dimethacrylate composite, which could imply higher wear resistance and superior durability in clinical applications where higher hardness is required.

3.7. Wear Resistance Study

The wear area data showed that self-curing dimethacrylate composite presented a normal distribution, according to the Shapiro–Wilk test (p > 0.05), while 3D resin did not meet this normality assumption (p < 0.05). The results can be observed in Table 7. Since one of the groups does not follow a normal distribution, the non-parametric Mann–Whitney U test was applied. The 3D resin has a significantly lower average wear area (p = 0.021) compared to the self-curing dimethacrylate composite, which could indicate a higher wear resistance for 3D resin.
Wear resistance study. Wear rate analysis showed that self-curing dimethacrylate composite presents a normal distribution in its wear rate data, according to the Shapiro–Wilk test (p > 0.05), while 3D resin did not comply with normality (p < 0.05). Since one of the groups does not follow a normal distribution, the Mann–Whitney U test was applied. The 3D Resin exhibits a significantly different wear rate (p = 0.029) compared to the self-curing dimethacrylate composite, which could have important implications on the durability and strength of these materials in wear applications.

3.8. Scratch Resistance Evaluation

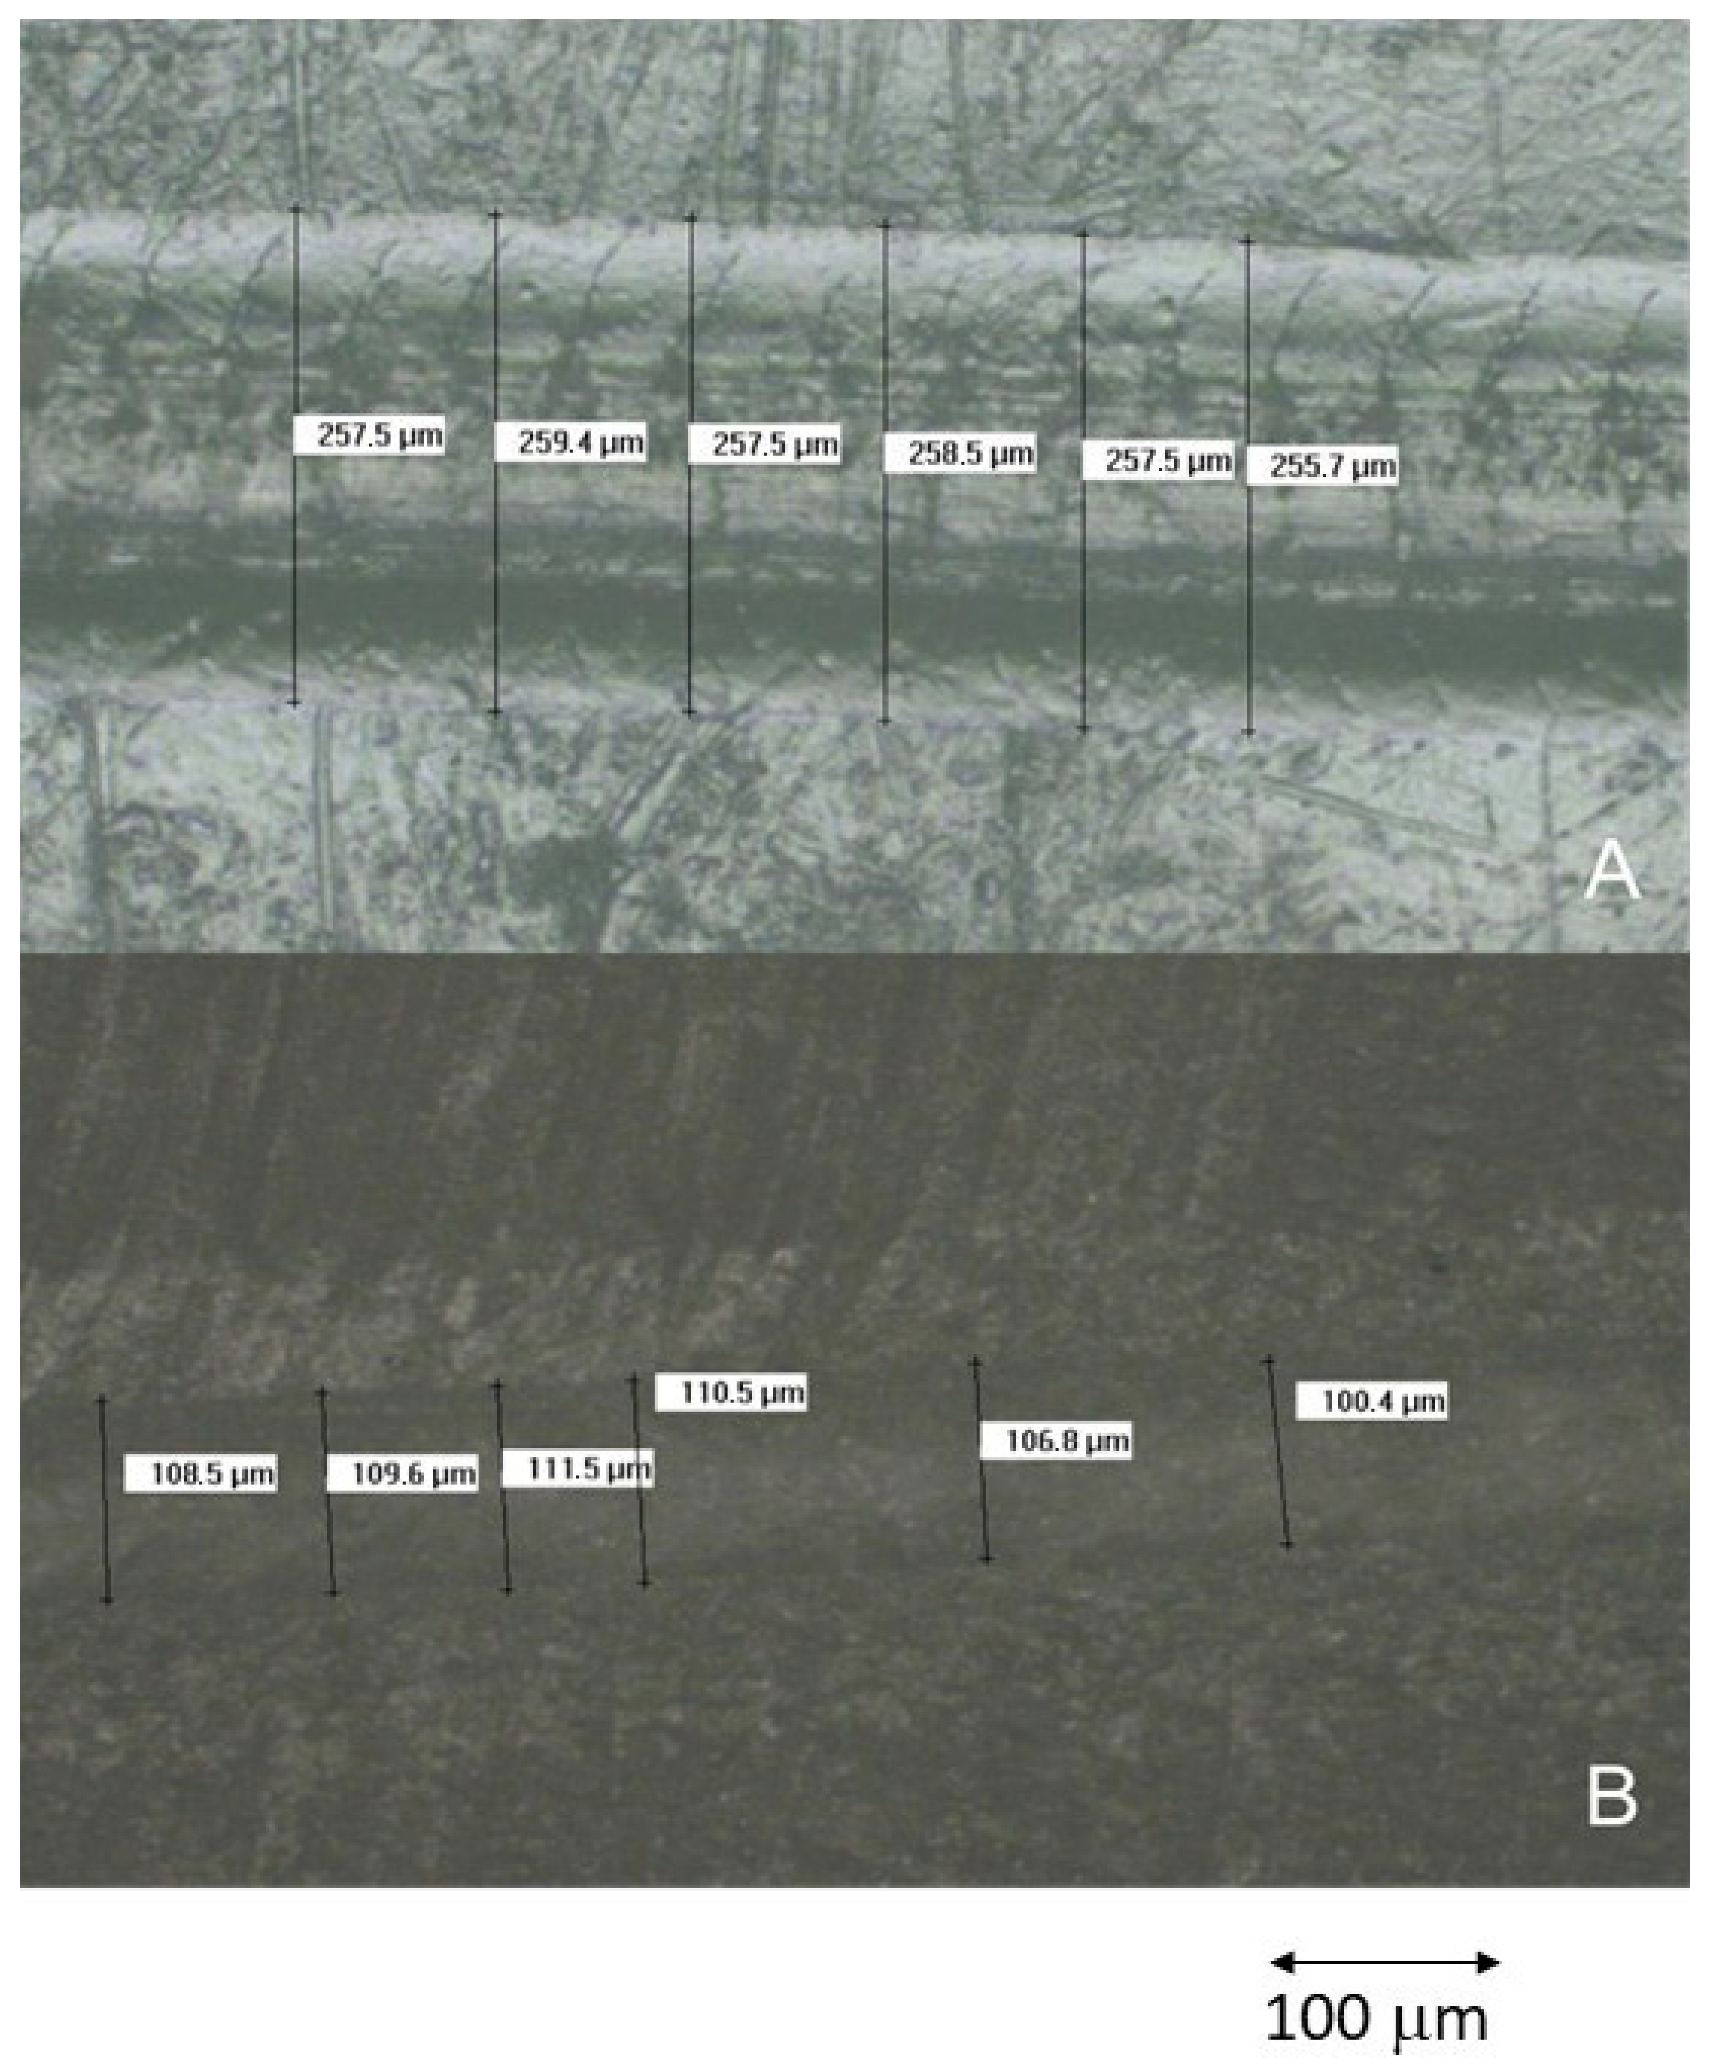
Figure 5 shows the scratch channel width measurements performed on one of the samples tested for each of the two materials evaluated: the self-curing dimethacrylate composite and the photopolymerized 3D-printed composite. The results, summarized in Table 8, indicated a statistically significant difference between the groups (p > 0.001). The self-curing dimethacrylate composite exhibited a significantly higher average scratch channel area than the photopolymerized 3D-printed composite, which may have important implications for its wear resistance.
Both variables were analyzed in terms of normality: the self-curing dimethacrylate composite and the photopolymerized 3D-printed composite showed a normal distribution according to the Shapiro–Wilk test (p > 0.05 in both cases). Therefore, Student’s t-test for independent samples was applied to compare the groups. Results indicated no statistically significant difference in friction force between the materials (p = 0.789), suggesting that any observed difference could be attributable to chance.
Once the friction force generated during the test was known, the dynamic friction coefficient was calculated. In this calculation, the applied force—constant at 10 N—was taken into account. The results, also presented in Table 8, were obtained by considering only the central 2.5 mm of the stroke, excluding the initial and final 0.5 mm to ensure measurement accuracy. Results indicated no statistically significant difference between groups (p = 0.144), suggesting that any observed differences in the dynamic coefficient of friction between the materials could be attributable to chance.
Finally, the penetration depth was analyzed, as shown in Table 8, revealing a statistically significant difference between the groups (p < 0.001). In summary, the photopolymerized 3D-printed composite showed a significantly lower average penetration depth compared to the self-curing dimethacrylate composite, which could have implications for its mechanical performance in applications where penetration resistance is critical.

4. Discussion

The primary objective of this in vitro study was to compare the physical and mechanical properties of two resins commonly used in the fabrication of provisional prostheses: a self-curing composite and a photopolymerized 3D-printed resin. The analyses were performed according to ISO 4049:2019 [46], which regulates materials for direct intraoral use, and ISO 10477 [47], which establishes requirements for indirect provisional restorations.
Although the self-curing resins tested were processed under controlled laboratory conditions, they are typically designed for intraoral application, where exposure to saliva, blood, crevicular fluid, and temperature fluctuations may further influence their behavior. Similarly, 3D-printed resins are known to be highly sensitive to processing variables such as build orientation, solvent cleaning, and post-curing time [11,12,13,14,15]. To minimize these effects, the 3D-printed samples were fabricated under strictly standardized conditions following manufacturer guidelines. Nevertheless, the absence of full disclosure regarding resin composition and filler content remains an important limitation, as proprietary formulations hinder precise attribution of the observed results to specific chemical or structural components.
It has been shown that the roughness results do not show statistically significant differences between the two composites studied. The manufacturing processes show low roughness values with a good surface finish. However, the self-curing resin has greater wettability than the 3D light-curing resin. In any case, the contact angle values of both resins are hydrophilic, as the contact angles are below 90°. This means that both resins interact well with the physiological environment, although the self-curing resin will, in principle, exhibit greater protein adsorption and, in principle, can be colonized by fibroblast cells more quickly, but they can also attract bacteria with hydrophilic characteristics [50,51].
Flexural strength values were slightly higher for the 3D-printed resin (138 ± 10 MPa) compared to the self-curing composite (122 ± 12 MPa), in line with findings from previous studies [39,40]. The superior performance of the self-curing composite relative to older reports may be attributed to its copolymerization with UDMA, which enhances both flexibility and conversion rate in dimethacrylate systems. By contrast, the modest performance of the 3D-printed resin compared to earlier reports may be explained by its use of monomers such as Bis-EMA, EGDMA, and HEMA, which reduce flexibility and crosslink density, leading to a stiffer but more brittle polymer network. This is consistent with the significantly higher elastic modulus observed for the 3D-printed resin (2.50 ± 0.11 GPa), underscoring the impact of chemical composition on stiffness and fracture behavior.
Elemental analysis confirmed the presence of silica nanofillers (~0.04 μm) in the self-curing composite, which are intended to improve aesthetics and surface polish ability. Their incorporation, however, increases surface roughness at the microscopic level, influencing wettability. In contrast, the 3D-printed resin contains only a minimal amount of filler (1–5%), producing completely smooth surfaces that favor aesthetics, but compromise wear resistance. Fractographic analysis further revealed that both materials fail by brittle fracture, underscoring their susceptibility to sudden catastrophic failure and the clinical risks associated with sharp-edged fragments in the oral cavity [52].
Contact angle measurements highlighted significant differences in wettability. Despite containing hydrophilic HEMA monomers, the 3D-printed resin exhibited a higher contact angle than the self-curing composite. This paradox can be explained by its homogeneous, filler-free surface, which reduces water retention, while the nanofilled surface of the self-curing composite provides micro-irregularities that enhance wettability, consistent with the Cassie–Baxter model [53].
Differences in density were also observed, with the self-curing composite exhibiting higher values (1.328 g/cm3) compared to the 3D-printed resin (1.260 g/cm3), likely due to its greater silica content. Water sorption values for both materials complied with ISO thresholds, but the 3D-printed resin showed significantly higher absorption (57 ± 3 µg/mm3 vs. 16 ± 2 µg/mm3). These results are consistent with the use of flexible, less crosslinked monomers in 3D printing, which enhance printability but increase hydrophilicity. Excessive water uptake is clinically relevant, as it promotes hydrolytic degradation, filler–matrix debonding, and microcrack formation, ultimately compromising mechanical stability [52,53,54,55,56]. Interestingly, controlled hygroscopic expansion may improve cemented prosthesis retention, although this potential advantage requires further clinical validation.
Microhardness testing revealed markedly superior values for the 3D-printed resin (19.5 ± 1.2 HV) compared to the self-curing composite (8.3 ± 0.5 HV). This outcome is consistent with the high proportion of UDMA in the 3D-printed resin and its relatively high degree of conversion (69–72%) [36,37,38,39], which favor denser crosslinking and chemical cohesion. Conversely, the limited conversion of Bis-GMA (34–39%) restricts crosslink density in the self-curing composite, despite the presence of reinforcing nanofillers. The homogeneity and optimized polymerization of the 3D-printed resin likely account for its superior hardness despite its lower filler content.
Wear and scratch resistance results further distinguished the two resins. The 3D-printed resin exhibited smaller wear areas and lower friction coefficients, suggesting that its homogeneous matrix better resists microcrack initiation and filler detachment, common weaknesses in filler-containing composite. However, its higher scratch penetration depth underscores a trade-off between uniform deformation and brittleness under concentrated loads. Clinically, these findings suggest that 3D-printed provisionals may maintain smoother surfaces longer, but remain prone to sudden fracture under localized stresses [56,57,58,59,60,61,62,63].
The release of microparticles through wear and scratching represents an additional concern. While the clinical impact on patients appears limited, environmental implications remain, as monomer degradation products such as Bisphenol A and its derivatives may affect microbial ecosystems due to estrogen-mimicking properties [57,58,63]. This highlights the importance of evaluating not only intraoral performance, but also the broader biocompatibility and ecological impact of dental resins. Manuelli et al. confirmed that orthodontic therapy offers a considerable number of advantages, but it is important to underline what may be the adverse consequences also. This allows for the orthodontist to inform the patient of all the possible effects of their therapeutic choice [63].
3D resins are indicated for temporary prosthetic rehabilitation with intermediate edentulous spaces. In this case, a material with greater mechanical properties is necessary due to the increased stress caused by the lack of teeth. Three-dimensional resins are also clinically recommended for anterior spaces, where greater aesthetics are required. As observed in the results, 3D resin is easier to polish and therefore more aesthetic due to the higher microhardness than self-curing composite. However, the self-curing composite is indicated for posterior areas where aesthetics does not play an important role and suffers fewer mechanical loads and wear than 3D resins. The increased water adsorption also makes the material more durable, and future studies could explore the possibility of controlled release of drugs in solution, for example, with bactericidal effects.
The results of the study show that the null hypothesis is false, as statistically significant differences are observed between the two types of materials used. Overall, the findings of this study demonstrate that the 3D-printed resin offers superior microhardness, wear resistance, and surface properties compared to the self-curing composite. However, its high-water sorption and susceptibility to brittle fracture limit its long-term applicability, particularly in most oral environments subjected to cyclic loading. Future research should include advanced degradation models simulating intraoral conditions to better predict long-term clinical behavior and guide material optimization for safer and more durable provisional prostheses.
This study of physical-chemical properties should be completed in the future with cyclic load (fatigue) tests to determine the long-term behavior of the materials. The tests in this contribution have followed international standards for each of them, but they have their limitations, such as the effect of the temperature at which they are performed, since the studies have been carried out at room temperature and not at body temperature. Another limitation is that the tests carried out in accordance with the standard do not establish the complexity of the triaxial stress state that the materials studied actually undergo, nor the wear and tear they suffer. Water adsorption should be carried out with saliva instead of distilled water. In addition, there is the limitation of product aging processes and the lack of complete transparency in the commercial products studied due to industrial secrecy. Therefore, the results do not reflect the exact reality of the behavior of the materials in service, although they clearly show the trend in the properties studied. It should also be noted that the printing and post-curing conditions can change the properties of these materials. To complete the study, FTIR studies should be carried out to determine the degree of conversion, as commercial companies do not mention this. In this study, as we have mentioned, we strictly followed the protocols of commercial companies so that the results would be as close as possible to what happens in clinical reality.
It is also important to note that in the market, there are many resins with different fillers, compositions, and mechanical properties. The results cannot be generalized to all 3D printed resins. These resins have been used due to their widespread use in dental prostheses and have always been obtained in accordance with the standards established by the product manufacturers. The results show that the reproducibility of the products obtained is quite good, as the values obtained in the tests show moderate standard deviations, indicating the homogeneity of the samples.
It would also be interesting to check the debris effect on the inflammation, monitoring the phenotypes of macrophages in the presence of debris and their possible activation, or determining the MSC status or signaling with the presence of this debris. At this point, another field of work opens up in the biofunctionalization of fibers with antibacterial agents to prevent possible bacterial colonization. The biocompatibility of both products is guaranteed by the manufacturers, but it would be a major advance to obtain materials with bactericidal properties.

5. Conclusions

This in vitro study demonstrates significant differences in the physicochemical behavior of the two resins evaluated, indicating potential for distinct clinical applications. The indirectly manufactured photopolymerized 3D-printed resin exhibited superior mechanical performance, including higher flexural strength, microhardness, scratch resistance, and lower wear rate, largely attributable to its monomeric composition and the absence of inorganic fillers. However, its high-water sorption raises concerns regarding hydrolytic degradation and long-term stability. Consequently, self-curing dimethacrylate composite with inorganic fillers remain the material of choice for long-lasting provisional prostheses. Further studies are required to evaluate the durability of 3D-printed resins under prolonged intraoral conditions. Future research should focus on optimizing photopolymerization protocols and conducting long-term degradation studies to better define the clinical viability of these emerging materials. The results cannot be generalized for all resins or self-curing composites, as there are products on the market with different chemical compositions and different inorganic fillers that could significantly alter the results.

Author Contributions

Conceptualization, J.G. and A.B.-V.; methodology, J.G.; validation, O.J.V.-B.; formal analysis, E.P.-P.; investigation, O.J.V.-B. and E.M.; data curation, D.R.-C.; writing—original draft preparation, J.G.; writing—review and editing, A.B.-V.; visualization, O.J.V.-B.; supervision, O.J.V.-B. All authors have read and agreed to the published version of the manuscript.

Funding

This study was financed exclusively by DENS-ia group research funds of the European University Miguel de Cervantes. The authors are also grateful to the Spanish Government for its support through the research project MINECO (PID2022-137496OB-I00).

Institutional Review Board Statement

Not applicable.

Informed Consent Statement

Not applicable.

Data Availability Statement

The original contributions presented in this study are included in the paper. Further inquiries can be directed to the corresponding author.

Acknowledgments

The authors are grateful to Klockner S.A. Company for your help in the machining and preparation of the materials for this project.

Conflicts of Interest

The authors declare no conflicts of interest.

References

  1. Brånemark, P.I.; Adell, R.; Breine, U.; Hansson, B.O.; Lindström, J.; Ohlsson, A. Intra-osseous anchorage of dental prostheses: I. Experimental studies. Scand. J. Plast. Reconstr. Surg. 1969, 3, 81–100. [Google Scholar] [CrossRef]
  2. Luthardt, R.G.; Stössel, M.; Hinz, M.; Vollandt, R. Clinical performance and periodontal outcome of temporary crowns and fixed partial dentures: A randomized clinical trial. J. Prosthet. Dent. 2000, 83, 32–39. [Google Scholar] [CrossRef]
  3. Vahidi, F. The Provisional Restoration. Dent. Clin. N. Am. 1987, 31, 363–381. [Google Scholar] [CrossRef]
  4. Lowe, R.A. The art and science of provisionalization. Int. J. Period Rest. Dent. 1987, 7, 64–73. [Google Scholar]
  5. Baldissara, P.; Comin, G.; Martone, F.; Scotti, R. Comparative study of the marginal microleakage of six cements in fixed provisional crowns. J. Prosthet. Dent. 1998, 80, 417–422. [Google Scholar] [CrossRef]
  6. Zinner, I.D.; Trachtenberg, D.I.; Miller, R.D. Provisional Restorations in Fixed Partial Prosthodontics. Dent. Clin. N. Am. 1989, 33, 355–377. [Google Scholar] [CrossRef] [PubMed]
  7. Hull, C.W. Apparatus for Production of Three-Dimensional Objects by Stereolithography. U.S. Patent. US4575330A, 19 December 1989. [Google Scholar]
  8. Alshamrani, A.; Alhotan, A.; Owais, A.; Ellakwa, A. The Clinical Potential of 3D-Printed Crowns Reinforced with Zirconia and Glass Silica Microfillers. J. Funct. Biomater. 2023, 14, 267. [Google Scholar] [CrossRef]
  9. Zoabi, A.; Redenski, I.; Oren, D.; Kasem, A.; Zigron, A.; Daoud, S.; Moskovich, L.; Kablan, F.; Srouji, S. 3D Printing and Virtual Surgical Planning in Oral and Maxillofacial Surgery. J. Clin. Med. 2022, 11, 2385. [Google Scholar] [CrossRef] [PubMed]
  10. Vasiliadis, A.V.; Koukoulias, N.; Katakalos, K. From Three-Dimensional (3D)- to 6D-Printing Technology in Orthopedics: Science Fiction or Scientific Reality? J. Funct. Biomater. 2022, 13, 101. [Google Scholar] [CrossRef]
  11. Keßler, A.; Hickel, R.; Ilie, N. In vitro investigation of the influence of printing direction on the flexural strength, flexural modulus and fractographic analysis of 3D-printed temporary materials. Dent. Mater. J. 2021, 40, 641–649. [Google Scholar] [CrossRef]
  12. Park, S.-M.; Park, J.-M.; Kim, S.-K.; Heo, S.-J.; Koak, J.-Y. Flexural Strength of 3D-Printing Resin Materials for Provisional Fixed Dental Prostheses. Materials 2020, 13, 3970. [Google Scholar] [CrossRef]
  13. Piedra-Cascón, W.; Krishnamurthy, V.R.; Att, W.; Revilla-León, M. 3D printing parameters, supporting structures, slicing, and post-processing procedures of vat-polymerization additive manufacturing technologies: A narrative review. J. Dent. 2021, 109, 103630. [Google Scholar] [CrossRef]
  14. Finck, N.S.; Fraga, M.A.A.; Correr, A.B.; Dalmaschio, C.J.; Rodrigues, C.S.; Moraes, R.R. Effects of solvent type and UV post-cure time on 3D-printed restorative polymers. Dent. Mater. 2024, 40, 451–457. [Google Scholar] [CrossRef]
  15. Soto-Montero, J.; de Castro, E.F.; Romano Bde, C.; Nima, G.; Shimokawa, C.A.K.; Giannini, M. Color alterations, flexural strength, and microhardness of 3D printed resins for fixed provisional restoration using different post-curing times. Dent. Mater. 2022, 38, 1271–1282. [Google Scholar] [CrossRef]
  16. Anseth, K.S.; Newman, S.M.; Bowman, C.N. Polymeric dental composite: Properties and reaction behavior of multimethacrylate dental restorations. In Biopolymers II; Peppas, N.A., Langer, R.S., Eds.; Springer: Berlin/Heidelberg, Germany, 1995; pp. 177–217. [Google Scholar]
  17. Schmalz, G.; Arenholt-Bindslev, D. Biocompatibility of Dental Materials: With 82 Tables; Springer: Berlin/Heidelberg, Germany, 2009. [Google Scholar]
  18. Mousavinasab, S.M. Biocompatibility of composite resins. Dent. Res. J. 2011, 8, S21–S29. [Google Scholar]
  19. Pascual, B.; Gurruchaga, M.; Ginebra, M.P.; Gil, F.J.; Planell, J.A.; Goñi, I. Influence of the modification of P/L ratio on a new formulation of acrylic bone cement. Biomaterials 1999, 20, 465–474. [Google Scholar] [CrossRef] [PubMed]
  20. Vázquez, B.; Ginebra, M.P.; Gil, F.J.; Planell, J.A.; López Bravo, A.; San Román, J. Radiopaque acrylic cements prepared with a new acrylic derivative of iodo-quinoline. Biomaterials 1999, 20, 2047–2053. [Google Scholar] [CrossRef]
  21. Manzano, M.; Arcos, D.; Delgado, M.R.; Ruiz, E.; Gil, F.J.; Vallet-Regí, M. Bioactive stargels. Chem. Mater. 2006, 18, 5696–5703. [Google Scholar] [CrossRef]
  22. Aparicio, C.; Manero, J.M.; Conde, F.; Pegueroles, M.; Planell, J.A.; Vallet-Regí, M.; Gil, F.J. Acceleration of apatite nucleation on microrough bioactive titanium for bone-replacing implants. J. Biomed. Mater. Res. A 2007, 82, 521–529. [Google Scholar] [CrossRef] [PubMed]
  23. Buxadera-Palomero, J.; Calvo, C.; Torrent-Camarero, S.; Gil, F.J.; Mas-Moruno, C.; Canal, C.; Rodríguez, D. Biofunctional polyethylene glycol coatings on titanium: An in vitro-based comparison of functionalization methods. Colloids Surf. B Biointerfaces 2017, 152, 367–375. [Google Scholar] [CrossRef] [PubMed]
  24. Mas-Moruno, C.; Garrido, B.; Rodriguez, D.; Ruperez, E.; Gil, F.J. Biofunctionalization strategies on tantalum-based materials for osseointegrative applications. J. Mater. Sci. Mater. Med. 2015, 26, 109. [Google Scholar] [CrossRef]
  25. Brizuela-Velasco, A.; Álvarez-Arenal, Á.; Gil-Mur, F.J.; Gil-Mur, F.J.; Herrero-Climent, M.; Chávarri-Prado, D.; Chento-Valiente, Y.; Dieguez-Pereira, M. Relationship Between Insertion Torque and Resonance Frequency Measurements, Performed by Resonance Frequency Analysis, in Micromobility of Dental Implants: An In Vitro Study. Implant. Dent. 2015, 24, 607–611. [Google Scholar] [CrossRef]
  26. Attaran, M. The rise of 3-D printing: The advantages of additive manufacturing over traditional manufacturing. Bus. Horiz. 2017, 60, 677–688. [Google Scholar] [CrossRef]
  27. Saratti, C.M.; Rocca, G.T.; Krejci, I. The potential of three-dimensional printing technologies to unlock the development of new ‘bio-inspired’ dental materials: An overview and research roadmap. J. Prosthodont. Res. 2019, 63, 131–139. [Google Scholar] [CrossRef]
  28. Alharbi, N.; Osman, R.; Wismeijer, D. Factors Influencing the Dimensional Accuracy of 3D-Printed Full-Coverage Dental Restorations Using Stereolithography Technology. Int. J. Prosthodont. 2016, 29, 503–510. [Google Scholar] [CrossRef]
  29. Unkovskiy, A.; Bui, P.H.-B.; Schille, C.; Geis-Gerstorfer, J.; Huettig, F.; Spintzyk, S. Objects build orientation, positioning, and curing influence dimensional accuracy and flexural properties of stereolithographically printed resin. Dent. Mater. 2018, 34, e324–e333. [Google Scholar] [CrossRef] [PubMed]
  30. Luo, S.; Zhu, W.; Liu, F.; He, J. Preparation of a Bis-GMA-Free Dental Resin System with Synthesized Fluorinated Dimethacrylate Monomers. Int. J. Mol. Sci. 2016, 17, 2014. [Google Scholar] [CrossRef]
  31. Polydorou, O.; König, A.; Hellwig, E.; Kümmerer, K. Urethane dimethacrylate: A molecule that may cause confusion in dental research. J. Biomed. Mater. Res. B Appl. Biomater. 2009, 91, 1–4. [Google Scholar] [CrossRef] [PubMed]
  32. Khatri, C.A.; Stansbury, J.W.; Schultheisz, C.R.; Antonucci, J.M. Synthesis, characterization and evaluation of urethane derivatives of Bis-GMA. Dent. Mater. 2003, 19, 584–588. [Google Scholar] [CrossRef]
  33. Hild, G. Model networks based on ‘endlinking’ processes: Synthesis, structure and properties. Prog. Polym. Sci. 1998, 23, 1019–1149. [Google Scholar] [CrossRef]
  34. Flory, P.J. Molecular Theory of Rubber Elasticity. Polym. J. 1985, 17, 1–12. [Google Scholar] [CrossRef]
  35. Dickens, S.H.; Stansbury, J.W.; Choi, K.M.; Floyd, D. Photopolymerization Kinetics of Methacrylate Dental Resins. Macromolecules 2003, 36, 6043–6053. [Google Scholar] [CrossRef]
  36. Lee, D.-W.; Kim, H.-N.; Lee, D.-S. Introduction of Reversible Urethane Bonds Based on Vanillyl Alcohol for Efficient Self-Healing of Polyurethane Elastomers. Molecules 2019, 24, 2201. [Google Scholar] [CrossRef]
  37. Lemon, M.T.; Jones, M.S.; Stansbury, J.W. Hydrogen bonding interactions in methacrylate monomers and polymers. J. Biomed. Mater. Res. A 2007, 83, 734–746. [Google Scholar] [CrossRef]
  38. Barszczewska-Rybarek, I.M. A Guide through the Dental Dimethacrylate Polymer Network Structural Characterization and Interpretation of Physico-Mechanical Properties. Materials 2019, 12, 4057. [Google Scholar] [CrossRef]
  39. Barszczewska-Rybarek, I.M. Characterization of urethane-dimethacrylate derivatives as alternative monomers for the restorative composite matrix. Dent. Mater. 2014, 30, 1336–1344. [Google Scholar] [CrossRef] [PubMed]
  40. Barszczewska-Rybarek, I.M. Structure-property relationships in dimethacrylate networks based on Bis-GMA, UDMA and TEGDMA. Dent. Mater. 2009, 25, 1082–1089. [Google Scholar] [CrossRef] [PubMed]
  41. Sideridou, I.; Tserki, V.; Papanastasiou, G. Effect of chemical structure on degree of conversion in light-cured dimethacrylate-based dental resins. Biomaterials 2002, 23, 1819–1829. [Google Scholar] [CrossRef] [PubMed]
  42. Gajewski, V.E.S.; Pfeifer, C.S.; Fróes-Salgado, N.R.G. Monomers used in resin composite: Degree of conversion, mechanical properties and water sorption/solubility. Braz. Dent. J. 2012, 23, 508–514. [Google Scholar] [CrossRef]
  43. Stansbury, J.W. Dimethacrylate network formation and polymer property evolution as determined by the selection of monomers and curing conditions. Dent. Mater. 2012, 28, 13–22. [Google Scholar] [CrossRef] [PubMed]
  44. Senawongse, P.; Pongprueksa, P. Surface Roughness of Nanofill and Nanohybrid Resin Composite after Polishing and Brushing. J. Esth. Rest. Dent. 2007, 19, 265–273. [Google Scholar] [CrossRef] [PubMed]
  45. Ferracane, J.L.; Pfeifer, C.S.; Hilton, T.J. Microstructural Features of Current Resin Composite Materials. Curr. Oral Health Rep. 2014, 1, 205–212. [Google Scholar] [CrossRef]
  46. ISO 4049:2019; Dentistry—Polymer-Based Restorative Materials. International Standard Organization: Geneva, Switzerland, 2019.
  47. ISO 10477:2020; Dentistry—Polymer-Based Crown and Veneering Materials. International Standard Organization: Geneva, Switzerland, 2020.
  48. Vöros, J.; Wieland, M.; Ruiz-Taylor, L.; Textor, M.; Brunette, D.M. Characterization of titanium surfaces. In Titanium in Medicine; Brunette, D.M., Tengvall, P., Textor, M., Thomsen, P., Eds.; Springer: Berlin, Germany, 2001; pp. 87–144. [Google Scholar]
  49. Keller, J.C.; Stanford, C.M.; Wightman, J.P.; Draughn, R.A.; Zaharias, R. Characterizations of titanium implant Surfaces. III. J. Biomed. Mater. Res. 1994, 28, 939–946. [Google Scholar] [CrossRef]
  50. Carrasco, B.; Brizuela, A.; Romero-Ruiz, M.M.; Gil-Mur, J. Investigation of the influence of roughness and dental implant design on primary stability via analysis of insertion torque and implant stability quotient: An in vitro study. J. Clin. Med. 2023, 12, 4190. [Google Scholar] [CrossRef] [PubMed]
  51. Bevilacqua, L.; Milan, A.; Del Lupo, V.; Maglione, M.; Dolzani, L. Biofilms developed on dental implant titanium surfaces with different roughness: Comparison between in vitro and in vivo studies. Curr. Microbiol. 2018, 75, 766–772. [Google Scholar] [CrossRef]
  52. Pfeifer, C.S.; Shelton, Z.R.; Braga, R.R.; Windmoller, D.; Machado, J.C.; Stansbury, J.W. Characterization of dimethacrylate polymeric networks: A study of the crosslinked structure formed by monomers used in dental composite. Eur. Polym. J. 2011, 47, 162–170. [Google Scholar] [CrossRef]
  53. Cassie, A.B.D.; Baxter, S. Wettability of porous surfaces. Trans. Faraday Soc. 1944, 40, 546–551. [Google Scholar] [CrossRef]
  54. Bociong, K.; Szczesio, A.; Sokolowski, K.; Domarecka, M.; Sokolowski, J.; Krasowski, M.; Lukomska-Szymanska, M. The Influence of Water Sorption of Dental Light-Cured Composite on Shrinkage Stress. Materials 2017, 10, 1142. [Google Scholar] [CrossRef]
  55. Vila, M.M.; Ginebra, M.P.; Gil, F.J.; Planell, J.A. Effect of porosity and environment on the mechanical behavior of acrylic bone cement modified with acrylonitrile-butadiene- styrene particles: I. Fracture toughness. J. Biomed. Mater. Res. 1999, 48, 121–127. [Google Scholar] [CrossRef]
  56. Gil, F.J.; Solano, E.; Peña, J.; Engel, E.; Mendoza, A.; Planell, J.A. Microstructural, mechanical and citotoxicity evaluation of different NiTi and NiTiCu shape memory alloys. J. Mater. Sci. Mater. Med. 2004, 15, 1181–1185. [Google Scholar] [CrossRef]
  57. Andrzejewska, E. Photopolymerization kinetics of multifunctional monomers. Prog. Polimer. Sci. 2001, 26, 605–665. [Google Scholar] [CrossRef]
  58. Drummond, J.L. Degradation, fatigue, and failure of resin dental composite materials. J. Dent. Res. 2008, 87, 710–719. [Google Scholar] [CrossRef]
  59. Lovell, L.G.; Berchtold, K.A.; Elliott, J.E.; Stansbury, J.W.; Bowman, C.N. Understanding the kinetics and network formation of dimethacrylate dental resins. Dent. Mater. 2001, 12, 335–345. [Google Scholar] [CrossRef]
  60. Gil, F.X.; Rodríguez, D.; Planell, J.A. Grain growth kinetics of pure titanium. Scr. Metall. Mater. 1995, 33, 1361–1366. [Google Scholar] [CrossRef]
  61. Issa, Y.; Watts, D.C.; Brunton, P.A.; Waters, C.M.; Duxbury, A.J. Resin composite monomers alter MTT and LDH activity of human gingival fibroblasts in vitro. Dent. Mater. 2004, 20, 12–20. [Google Scholar] [CrossRef] [PubMed]
  62. Reichl, F.-X.; Simon, S.; Esters, M.; Seiss, M.; Kehe, K.; Kleinsasser, N.; Hickel, R. Cytotoxicity of dental composite (co)monomers and the amalgam component Hg(2+) in human gingival fibroblasts. Arch. Toxicol. 2006, 80, 465–472. [Google Scholar] [CrossRef] [PubMed]
  63. Manuelli, M.; Marcolina, M.; Nardi, N.; Bertossi, D.; De Santis, D.; Ricciardi, G.; Luciano, U.; Nocini, R.; Mainardi, A.; Lissoni, A.; et al. Oral mucosal complications in orthodontic treatment. Minerva Stomatol. 2019, 68, 84–88. [Google Scholar] [CrossRef]
Figure 1. Flexibility test results.
Prosthesis 07 00129 g001
Figure 2. (A) Micrograph (1000×) of self-curing dimethacrylate composite surface. (B) Micrograph (3000×) of self-curing dimethacrylate composite surface and table of the chemical composition in atomic percentage. In the right corresponds to the magnification of the image B and the area marked where are showed the places where have been realized the energy dispersive X-ray microanalysis spectra (Sp). The table shows the average chemical compositions obtained.
Prosthesis 07 00129 g002
Figure 3. (A) Micrograph (1000×) of the surface of the photopolymerized 3D-printed composite. (B) Micrograph (3000×, backscattered electrons) of the photopolymerized 3D-printed composite surface. (C) The same image at (2000×) and table of the chemical composition in atomic percentage.
Prosthesis 07 00129 g003
Figure 4. Micrographs of fracture surfaces of the self-curing dimethacrylate composite and the photopolymerized 3D-printed composite at different magnifications: (A) self-curing dimethacrylate composite at 100×, (B) self-curing dimethacrylate composite at 3000×, (C) self-curing dimethacrylate composite at 5000×, (D) photopolymerized 3D-printed composite at 50×, (E) photopolymerized 3D-printed composite at 150×, (F) photopolymerized 3D-printed composite at 100×, (G) photopolymerized 3D-printed composite at 100×. (H) photopolymerized 3D-printed composite at 100×.
Prosthesis 07 00129 g004
Figure 5. Optical micrographs of scratch traces on (A) self-curing dimethacrylate composite and (B) photopolymerized 3D-printed composite.
Prosthesis 07 00129 g005
Table 1. Resin composition provided by manufacturer.
ResinSelf-Curing Dimethacrylate CompositePhotopolymerized 3D-Printed Composite
ManufacturerVOCO GmbH
Cuxhaven
Germany
Vertex-Dental B.V.
AV Soesterberg
The Netherlands
BrandStructur 3NextDent C&B MFH
BatchSC-34523657-ABPPDC-675000001238-B
Resin typeSelf-polymerizingPhotopolymerizing
CompositionBis-GMA: 5–10%
UDMA: 10–25%
Inorganic Filler
Nanofiller 32% (size 50nm)
Amines
Terpenes
Benzoyl peroxide
butylhydroxyteluene
UDMA: 50–75%
HEMA:0–25%
Bis-EMA:0–10%
EGDMA:0–10%
Silicon dioxide: 1–5%
(TPO): 1–5%
Mequinol: 0–0.1
Titanium dioxide: 0–0.1
Residual monomer2.6%3.3%
Table 2. Roughness parameters for the different treatment of the cp titanium discs. Sa (Arithmetic mean height), Sy (Maximum height), Sm (Mean crest height), Pc (Peak curvature) and Index area as the ratio of the actual surface area of the sample to the ideal surface area if there were no roughness. CA is the contact angle corrected by Wenzel equation. Asterisks means statistical difference significance with p < 0.05.
MaterialSa (mm) Sy (mm) Sm (mm) Pc (1/mm) Index Area CA (°)
Self-curing dimethacrylate composite 0.53 ± 0.090.87 ± 0.1312.25 ± 3.1223.30 ± 10.421.07 ± 0.0170.17 ± 5.65
Photopolymer, 3D-printed composite0.63 ± 0.040.65 ± 0.0613.00 ± 0.7825.37 ± 12.631.05 ± 0.0385.85 ± 1.84 *
Table 3. Mechanical properties of the resins studied.
ResinFlexural Strength
(MPa)
Modulus of Elasticity
(GPa)
Toughness
(mJ)
Displacement at Break
(mm)
Self-curing dimethacrylate composite 122 ± 121.94 ± 0.1038.52 ± 9.002.49 ± 0.48
Photopolymerized 3D-printed composite138 ± 102.50 ± 0.1166.51 ± 9.163.20 ± 0.53
Student’s t-test (p < 0.05)0.0490.0000.0000.000
Table 4. Density values obtained for both samples and statistical analysis.
MaterialSelf-Curing Dimethacrylate Composite (g/cm3)Photopolymerized 3D-Printed Composite (g/cm3)
1.328 ± 0.0051.260 ± 0.008
Table 5. Water absorption test results and statistical analysis.
MaterialSelf-Curing Dimethacrylate Composite (µg/mm3)Photopolymerized 3D-Printed Composite (µg/mm3)
16 ± 257 ± 3
Table 6. Hardness values obtained for each indentation in both sample groups and statistical analysis.
MaterialSelf-Curing Dimethacrylate Composite (HV)Photopolymerized 3D-Printed Composite (HV)
8.3 ± 0.519.5 ± 1.2
Mann–Whitney U Test (p > 0.05)6.70 × 10⁻⁸
Table 7. Pin-on-disc test results Median values with interquartile ranges (P25–P75) for wear channel area and wear rate, and mean values with standard deviations for maximum and mean friction coefficients, obtained for the self-curing dimethacrylate composite and the photopolymerized 3D-printed composite. In parenthesis is the median.
Property Self-Curing Dimethacrylate CompositePhotopolymerized 3D-Printed Composite
Wear channel area/(mm2)0.0444
(0.0302–0.0644)
0.0310
(0.0128–0.0499)
Wear Rate/(m3/Nm) × 10−132.379
(1.5550–3.14598)
1.489
(0.5023–2.8976)
Table 8. Summary of scratch mark width, friction force, dynamic friction coefficient, and penetration depth results with corresponding statistical analyses for the self-curing dimethacrylate composite and the photopolymerized 3D-printed composite.
MaterialScratch Channel Width (µm)Friction Force
(N)
Dynamic Friction Coef.Penetration Depth (µm)
self-curing dimethacrylate composite252.39 ± 4.851.878 ± 0.3860.255 ± 0.010389.77 ± 1.867
photopolymerized 3D-printed composite93.87 ± 12.781.99 ± 0.5570.19 ± 0.01263.367 ± 6.643
Disclaimer/Publisher’s Note: The statements, opinions and data contained in all publications are solely those of the individual author(s) and contributor(s) and not of MDPI and/or the editor(s). MDPI and/or the editor(s) disclaim responsibility for any injury to people or property resulting from any ideas, methods, instructions or products referred to in the content.