Article

Influence of Simulated Skin Color on the Accuracy of Face Scans

School of Dental Medicine, Stony Brook University, Stony Brook, NY 11794, USA
*
Author to whom correspondence should be addressed.
Prosthesis 2024, 6(6), 1372-1382; https://doi.org/10.3390/prosthesis6060099
Submission received: 1 October 2024 / Revised: 11 November 2024 / Accepted: 18 November 2024 / Published: 20 November 2024

Abstract

:
Aims: this study aims to investigate the impact of simulated skin color and the use of fiducial markers on the accuracy of 3D facial scans, comparing two types of structured light scanners under constant ambient lighting conditions. Materials and Methods: Three mannequins with different skin colors—black, white, and pink—were scanned using two light based hand-held scanners (infrared light and blue-light). Each mannequin was scanned with and without fiducial markers placed on defined anatomical landmarks. A total of one hundred thirty-two scans were performed and converted into standard tessellation language (STL) files. STL files from each scanner were compared to their respective control scans using point cloud comparison software. Accuracy was evaluated based on root mean square (RMS) values. Descriptive statistics summarized the data, and a t-test was performed to assess differences in RMS values between scans with and without fiducial markers for each scanner type. Results: The infrared light scanner showed the highest accuracy for the white mannequin, as evidenced by lower RMS values compared to the pink and black mannequins. Adding fiducial markers significantly enhanced scan accuracy for the pink and black mannequins. The blue-light scanner achieved accuracy for the white and pink mannequins comparable to that of the infrared scanner. However, it was unable to scan the black mannequin, even with the use of markers. Conclusions: Within the limitations of this study, simulated skin color significantly affects the accuracy of facial 3D scans. Scans of lighter (white) tones demonstrate higher accuracy compared to darker tones. Fiducial markers enhance the accuracy for an infrared scanner; however, a blue-light scanner is unable to capture dark simulated skin, even with the addition of fiducial markers.

1. Introduction

Surface scanning technology plays a vital role in fields such as dentistry, cosmetics, construction, manufacturing, and inspections, as well as in identity verification protocols [1,2]. Surface scanners have been shown to provide acceptable accuracy compared to other methods [3]. In dentistry, surface scanners (intraoral and facial) are widely used in prosthodontics, orthodontics, and oral surgery [4]. Specifically, 3D facial scanners provide precise reconstructions of oral and facial features and textures [1], enhance patient satisfaction, enable personalized outcomes, and support the manufacturing of highly accurate prostheses [5].
The accuracy of facial scanning depends on various parameters, including the type of scanner and scanning conditions [6,7,8,9,10,11,12,13,14,15,16,17,18]. Applied to face scanning, stationary scanners offer higher accuracy than handheld scanners [11], as the movement associated with the handheld scanner and the movement of the patient’s face (micro-movements of facial muscles and whole head macro-movements) can lead to less reliable models [12]. In relation to the scanning conditions, the longer it takes for a person to be scanned, the higher the likelihood of information becoming conflicting [7,8].
Facial scanning can be achieved using various techniques, including photogrammetry, photographs, video, and light-based 3D scanning. Light-based scanners use different light sources, such as white, blue, or infrared light [16,17]. Different types of light-based scanners offer unique advantages. White light scanners are generally safer for the eyes and are effective at capturing structures with irregular surfaces. In contrast, blue light scanners provide higher precision and capture fine details more accurately but require eye protection due to potential risks, such as cataracts or macular degeneration, if used without proper safeguards [17,18]
Besides the type of light, the way light interacts with an object is also a major factor when addressing light conditions. Light works by carrying energy to a material and, once reached, the energy will be transferred to that material [14]. Once the energy has reached an object, absorption and reflection occur based on the type of material the light has interacted with. Black or darker colors are recognized to be great absorbers of light, while lighter colors are known to reflect light. For example, black objects are known to perfectly absorb light containing many different wavelengths [15]. When light is absorbed instead of reflected it contributes to the formation of far fewer shadows and less recognition of edges and corners. On the contrary, lighter backgrounds are well known to reflect light and create a well-defined edge or shadow. This concept of edges and shade matching being easily definable when scanning is vastly important to ensure an accurate final result [19]. A parameter that until now has not been investigated but which may influence a scan’s accuracy is the scanned surface’s color. This parameter is relevant because the color of the scanned object interacts with the light source either by reflecting or absorbing it, thus potentially affecting the accuracy of the scanner [20].
In a recent study, Varda et al., 2022, evaluated the influence of ambient light and object color on the 3D scanning process. In their study, the authors scanned two identical geometrical samples, one white and one black, using two three-dimensional scanners and four variations in the ambient light [21]. Their study showed that both scanners possessed similar accuracy, and white objects were more consistently scanned than black objects [21]. Building on these findings, this study aims to investigate the impact of simulated skin color and the use of fiducial markers on the accuracy of 3D facial scans, comparing two types of light-based scanners (infrared light vs. blue light) under constant ambient lighting conditions. The null hypothesis is that neither skin color, the presence of markers, nor the type of scanner has any effect on scanner accuracy.

2. Materials and Methods

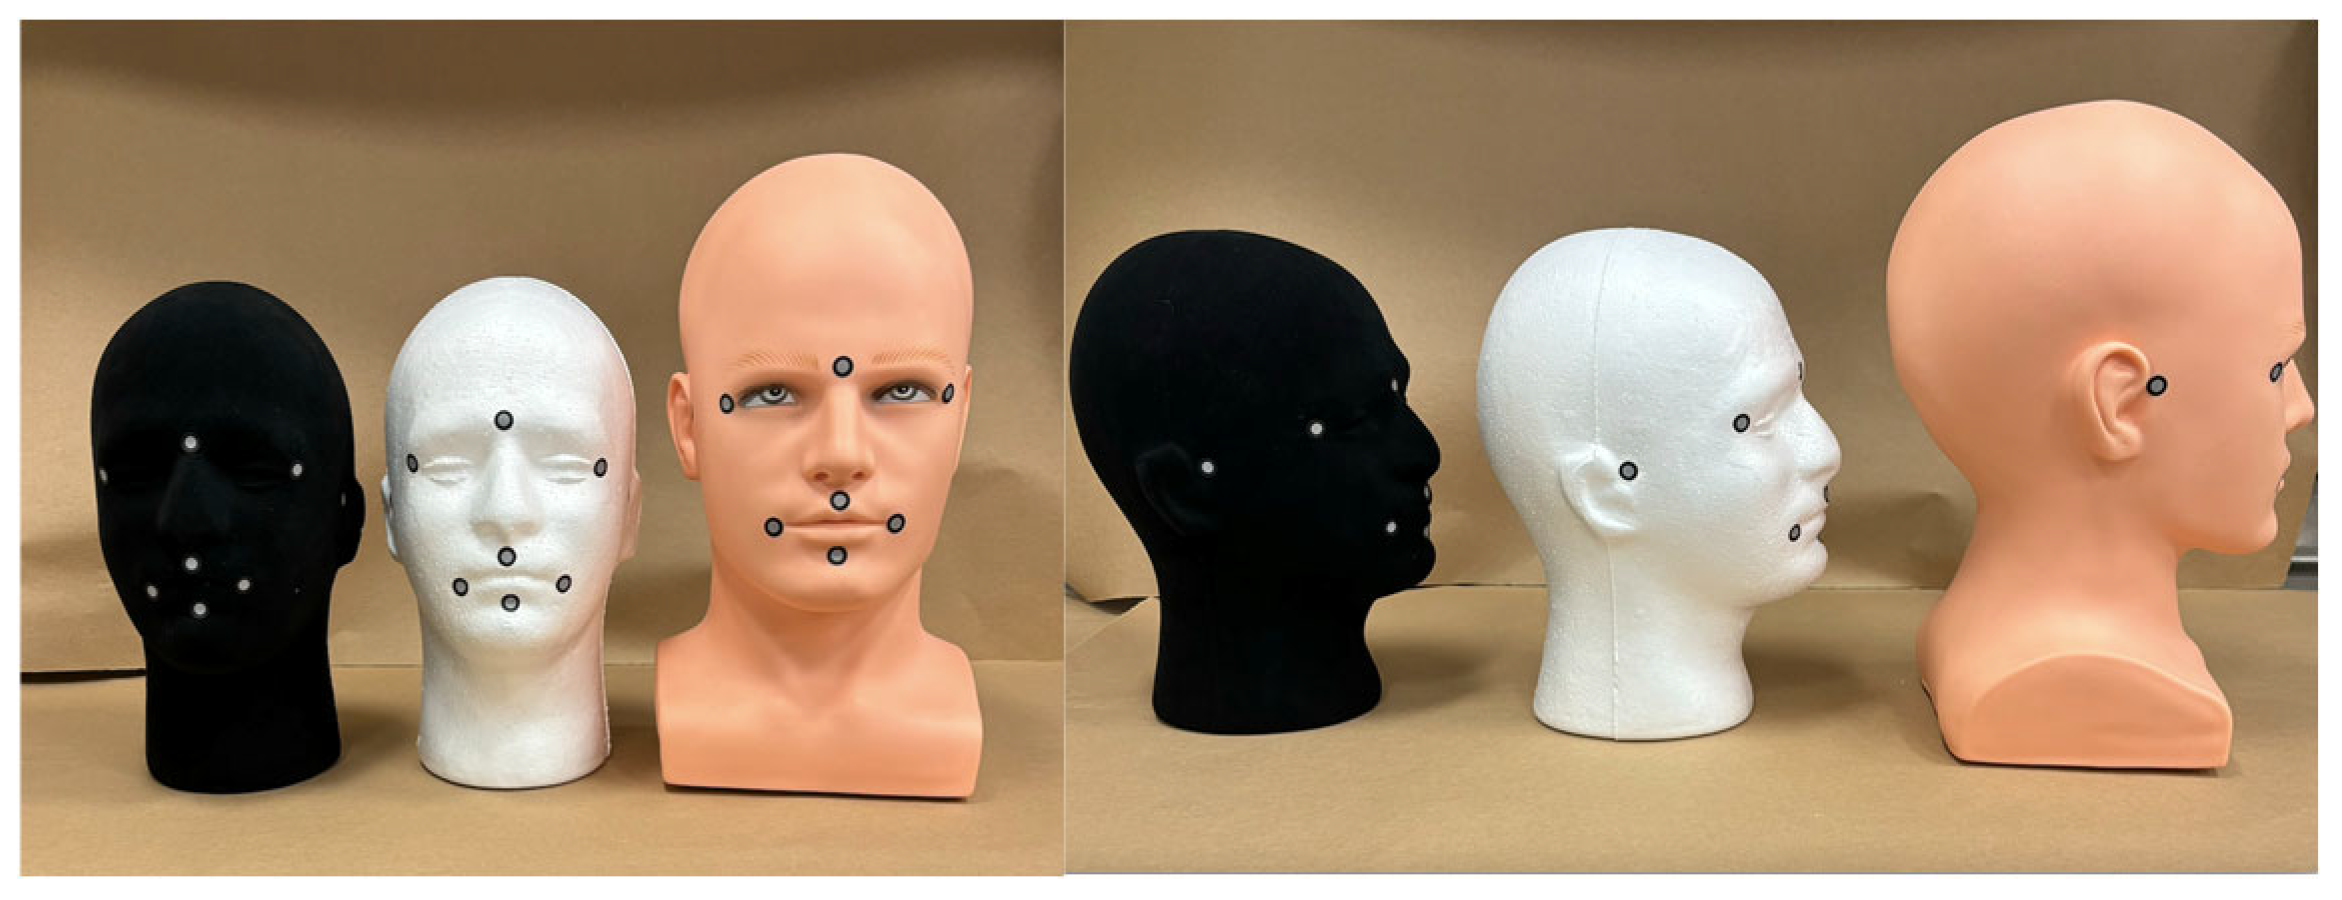
2.1. Groups and Sample Size

Mannequin heads with three different simulated skin tones—dark (black mannequin), very light (white mannequin), and medium (pink mannequin)—were used in this in vitro study. The black mannequin model ref# HTC, the white mannequin ref# Style 3, and the pink mannequin ref# Meahus, were procured online from www.amazon.com. The black and white mannequins were made of styrofoam, while the pink mannequin was constructed from silicone rubber. The dimensions of the silicone mannequin were slightly larger than those of the styrofoam mannequins. Facial scanning was performed using two protocols: the first without fiducial markers (control group, C) and the second with fiducial markers (test group, T). For the scans with fiducial markers, nine markers were placed at anatomically significant landmarks: exocanthion (right and left), cheilion (right and left), pogonion, philtrum, helical crus of the ears (right and left), and the glabella (Figure 1).
The sample size was determined using the Raosoft sample size calculator http://www.raosoft.com/samplesize.html (accessed on 10 March 2024) to achieve 80% statistical power, with a 7% margin of error and an effect size of 0.5. This analysis indicated that 132 scans were needed (66 per scanner type). For each scanner, thirty-three scans were conducted with fiducial markers (test group) and thirty-three without markers (control group). Each skin tone (black, white, and pink) was represented equally with eleven scans per skin tone.

2.2. Scanning Procedure and Post-Processing

The mannequins were placed on a Revopoint Dual-Axis Turntable stand (Revopoint, Shenzhen, China). With a rotational speed/20 s per full rotation (Figure 2).
Scanning was conducted using two types of light-based scanners. The first scanner, the POP-3 Plus® Portable 3D scanner (Revopoint, Shenzhen, China), utilizes dual-camera infrared structured light, providing an accuracy of 0.05 mm and a resolution of 0.08 mm. The second scanner, the Seal® 3D scanner (3D-Maker Pro, Shenzhen, China), is a portable 24-bit color scanner based on blue structured light, with an accuracy of 0.02 mm and a resolution of 0.07 mm (Figure 3).
Each scanner was mounted on a tripod for stability during the scanning process, while each mannequin head was placed on the rotational stand at a fixed distance of 22 inches (55.88 cm) from the scanner (Figure 4).
Calibration was conducted for each scanner by scanning each mannequin head 10 times, using various scanning options, such as unique shapes, dark object, face mode, and body mode, and high resolution for both scanners. This iterative process was used to optimize the final scanning parameters, which included high accuracy, feature tracking, and general object mode, with color scanning enabled. The duration of each scan was set for two complete rotations of the head, capturing approximately 900 to 1000 frames for each completed scan. Following the completion of scans, image post-processing was conducted using the designated software for each scanner: RevoScan 5 Version 4.3.2 (Revopoint, Shenzhen, China) for the POP-3 Plus® scanner (Revopoint, Shenzhen, China), and JMStudio-MAC-2.3.5 (3D-Maker Pro, Shenzhen, China) for the Seal® 3D scanner (3D-Maker Pro, Shenzhen, China). The post-processing included Digital Trimming, Fusion, Isolation, Overlap, Smooth, Simplify, Mesh, Fill Holes, Texture Mapping, and File export.
  • Digital trimming: Reduced noise and redundant information.
  • Fusion: Merged all captured data into a single unified model.
  • Isolation: Removed unrelated/background data not connected to the main model.
  • Overlap: Detected and eliminated overlapping data points.
  • Smooth: Removed noise and duplicated data to create a cleaner model.
  • Simplify: Compressed the data to reduce the overall file size.
  • Mesh: Enhanced the model’s quality by controlling point density and detail.
  • Fill Holes: Repaired areas with missing data to ensure uniformity.
  • Texture Mapping: Helped replicate surface textures.
  • File export: Files were exported as standard tessellation language (STL) for comparative evaluation of point clouds.
  • Eleven evaluations were completed without markers and eleven evaluations were completed with markers for each mannequin group for each scanner. For a total of one hundred and thirty-two evaluations.

2.3. Global Deviations

Global deviations between scans were assessed using the open-access surface-matching software CloudCompare Version 2.13.0 Kharkiv (https://www.cloudcompare.org/main.html, accessed on 1 June 2024). For each experimental group, a designated reference scan was compared to all other scans within the same group to evaluate deviations.
STL files (control scan and comparison scans) were imported into CloudCompare software. The models were aligned using the ‘Best Alignment’ tool, and three points were identified on each STL file to achieve finer registration. Cloud registration was employed with parameters set as follows: RMS difference of 1 × 10⁻⁵, final overlap of 100%, and a maximum thread count of 7/8. Distances between the STL models were then calculated by selecting the reference, comparing models, and using the ‘Compute Stat. Parameters’ tool. This tool provided RMS (root mean square) values and generated merged STL files with a color-coded scalar field, visually highlighting areas of deviation between the reference and compared models. The RMS value expressed in millimeters was used to evaluate the accuracy of the scans.
Descriptive statistics including mean, standard deviations, and margin of error were presented for all the groups. Box plots were used to illustrate the findings of all groups. Paired t-tests were completed to determine intra-group differences between scanners completed with and without markers. To determine the statistical significance was determined when p < 0.05.

2.4. CRIS Guidelines

In this experimental in vitro study, the Checklist for Reporting In Vitro Studies (CRIS) guidelines were implemented to improve the quality of the reported data [22]. According to the CRIS guidelines, sample size calculation must be described, meaningful difference between groups must be presented, sample preparation and handling must be described, sample allocation and statistical analysis must be described.

3. Results

Cloud comparisons showed small deviation for scanners obtained on white mannequins compared to pink and black mannequins and improved accuracy for scans completed with fiducial markers compared to scans completed without fiducial markers (Figure 5, Figure 6 and Figure 7).
The infrared scanner showed better accuracy for white and pink mannequins and lower accuracy for black mannequin scans. The accuracy for pink and black mannequins improved when markers were used (Figure 8).
The blue-light scanner demonstrated lower scanning accuracy. White and pink mannequins showed a behavior comparable to the infrared scanner, it was unable to capture scans of the black mannequins. Errors such as “object not detected”, “out of sight”, “too close”, and blank measurements were consistently recorded during attempts to scan black mannequins, regardless of the presence of fiducial markers (Figure 9).

3.1. Global Deviations for the Infrared Scanner in Mannequins with and Without Markers

The white mannequin group with markers (RedWT) had lower RMS and lower standard deviation (0.17753 ± 0.02781) compared to the white group with markers (RedWC) (0.1977 ± 0.0317). The pink mannequin with markers (RedPT) (0.13542 ± 0.01310) had lower RMS and lower standard deviation compared to the pink mannequin without markers (RedPC) (0.3612 ± 0.1685). The black mannequin with markers (RedBT) showed lower RMS and lower standard deviations (0.3417 ± 0.0506) compared with the black mannequin without markers (RedBC) (0.5902 ± 0.1063) (Table 1).

3.2. Global Deviations for the Blue-Light Scanner in Mannequins with and Without Markers

The white mannequin group with markers (BlueWT) showed lower RMS (0.8280 ± 0.45934) compared to the white group with markers (BlueWC) (1.19940 ± 0.330039). The pink mannequin with markers (BluePT) (2.26478 ± 1.0608) had lower RMS compared to the pink mannequin without markers (BluePC) (2.98472 ± 0.381317). Scanning of the black mannequin with or without markers was not possible (Table 2).

3.3. Statistical Comparison of Infrared Scans with and Without Markers

Paired t-test showed no differences in the RMS values of white mannequin with or without markers p > 0.05. Meanwhile, there were statistically significant differences in the pink mannequins and black mannequins with and without markers p < 0.05 (Table 3).

3.4. Statistical Comparison of Blue-Light Scans with and Without Markers

The paired t-test revealed no significant differences in the RMS values for the white mannequin scanned with or without fiducial markers (p > 0.05). Similarly, no differences were found in the RMS values for the pink mannequin scanned with and without markers (p > 0.05). Due to the lack of data, comparisons were not possible for the black mannequin (Table 4).

4. Discussion

This study aimed to assess the effects of simulated skin color and fiducial marker use on the accuracy of 3D facial scans, comparing the performance of two light-based scanners (infrared light vs. blue light). Findings demonstrated that scans of simulated white skin achieved higher accuracy than those of simulated pink and black skin. Furthermore, the addition of fiducial markers significantly enhanced scan accuracy for simulated pink and black skin but had minimal impact on simulated white skin with the infrared scanner. Notably, the blue-light scanner showed lower accuracy than the infrared scanner and was unable to capture scans of the black mannequin head, even with fiducial markers. Thus, the null hypothesis was partially rejected.
These findings can be attributed to the optical properties of light interaction with different colors. Light is predominantly reflected from white surfaces, partially reflected from pink surfaces, and absorbed by black surfaces [20,22]. Allred et al. [20] demonstrated that lighter colors reflect more light, while darker colors reflect less, establishing a direct correlation between color and light reflection. Similarly, Bai et al. [23] found that darker materials, such as black carbon, absorb more light compared to lighter materials like elemental carbon. Their study, using thermal–optical carbon analyzers, showed that black carbon exhibited higher absorption values for both visible and infrared light. An additional explanation for the higher scanning accuracy observed in white mannequins compared to darker ones is the influence of ambient light on the scanning process [19]. White surfaces are more prone to creating shadows, which correlate with variations in depth and height, potentially contributing to the increased accuracy of scans from mannequins with simulated white skin.
The accuracies obtained in our study for the simulated white (RMS 0.177 ± 0.02), pink (RMS 0.361 ± 0.168), and black (RMS 0.590 ± 0.106) skin colors were significantly higher than those reported by Özsoy et al. [24] (RMS 0.78 to 3.42). These discrepancies are due to differences in experimental design. Özsoy et al.’s study involved real patients exhibiting various facial expressions and utilized different face scanning technologies, which may have contributed to the observed variations in accuracy.
Our study demonstrated higher accuracy compared to the findings of Knoops et al. [25], who evaluated three different scanning technologies: a full-body MRI scanner, a handheld scanner with two cameras, and a scanner equipped with a camera, infrared sensor, and two infrared lights, all compared against a dedicated facial scanner (structured light with three cameras). The reported RMS values for the MRI scanner, general surface scanner, and infrared-based camera were 1.11 ± 0.33, 0.71 ± 0.28, and 1.33 ± 0.46, respectively. The discrepancies between our study and theirs can be attributed to factors such as patient movement during scanning and the inherent differences in scanner technologies employed.
In this study, fiducial markers were utilized to assess their impact on scanning accuracy across different simulated skin tones. Our findings indicate that using markers significantly enhanced accuracy for the pink and black mannequins. This aligns with the results of Egri et al. (2022) [26], who investigated the effect of fiducial markers on surfaces of varying colors. They observed that markers improved scanning accuracy, particularly on dark backgrounds, due to the increased number of identifiable landmarks and the enhanced contrast between the markers and the surface. These findings support the notion that fiducial markers can serve as effective reference points, especially when scanning darker surfaces, where inherent contrast is limited.
In this study, nine facial landmarks were identified using fiducial markers, which were easily visible due to their distinct black and silver colors. From an optics standpoint, the high contrast between the markers and the skin surface enhanced their detectability by the scanner. This increased the number of reference points beyond the natural surface topography of the face, improving the scanner’s triangulation accuracy. The stark contrast provided a clearer optical signal, reducing potential errors in capturing facial geometry and leading to more precise measurements [27]. As discussed previously, this study demonstrated that fiducial markers improved scanning accuracy for darker skin tones but had minimal impact on lighter skin tones. This is consistent with the findings of Varda et al. [21], who reported higher accuracy for scans of lighter-colored objects, although they did not provide an explanation for this observation. We hypothesize that lighter surfaces reflect more light, producing higher-quality data and sufficient accuracy without the need for additional markers. Conversely, darker skin tones absorb more light, resulting in reduced data capture. The use of fiducial markers on darker surfaces likely increased both the quantity and quality of reflected data, thereby enhancing scan accuracy.
In the present study, mannequin heads were used because they reduced confounding variables like facial movement [6,7]. Also, when scanning human subjects, if the time required to complete a scanner is longer, the likelihood of inaccuracies increases [4,5]. Furthermore, by using mannequin heads, the variable of the head position and movement were eliminated as a source of error [9].
An intriguing finding of this study is the inability of the blue-light-based scanner to effectively capture the black mannequin, while the infrared light scanner successfully accomplished this task. Infrared light, operating within the near-infrared spectrum (approximately 750 to 1400 nanometers), penetrates surfaces more deeply and experiences less absorption by dark materials, resulting in greater reflection. This property makes infrared light more effective for scanning objects with darker colors, including black [28]. In contrast, blue light, with wavelengths between 450 and 495 nanometers, is ideal for capturing fine surface details due to its shorter wavelength. However, blue light is more readily absorbed by dark surfaces, such as black, leading to diminished reflection and potential data loss during scanning [29], which could explain the lower accuracy of the blue-light scanner compared to the infrared-light scanner on darker surfaces.
This study has several limitations. First, the use of mannequins representing only three standardized skin tones, rather than real patients with diverse facial features and a broad spectrum of skin tones. While the mannequins provided realistic contours and anatomical landmarks, they lacked the complex characteristics of human skin, such as color variability, porosity, hair, and sweat. This controlled environment likely resulted in higher accuracy compared to what would be achieved with human subjects. However, the use of mannequins allowed for consistent and reproducible measurements, potentially mitigating some of the variability and inaccuracies associated with live facial scanning.
We recognize that the accuracy of 3D face scanners across different human skin tones requires additional investigation. Classifying human skin color presents unique challenges due to the variability in pigmentation, UV exposure, and superficial blood vessels, which can differ significantly even within the same individual. To minimize variability, we selected three basic colors for mannequins—white, pink, and black—representing very light, intermediate, and dark tones according to the individual typology angle (ITA) classification; thus, in this study, we covered half of six potential ranges of skin color [30].
This study has several strengths. First, the use of mannequins effectively eliminates head movements and micromovements of facial muscles, which can significantly impair the overall accuracy of the scanning process. Second, the incorporation of a rotating platform ensured a consistent speed of rotation for each sample, thereby standardizing the scanning procedure. Furthermore, this study is the first to evaluate the impact of simulated skin color on the accuracy of facial scanning, a critical factor in minimizing errors during facial scanning and the creation of virtual patient models.
Further studies to evaluate other scanners and scanning methods on different simulated skin tones and real patient faces are necessary. The clinical implications of this study are that non-white skin tones will benefit from the use of fiducial markers to achieve higher accuracy.

5. Conclusions

Within the limitations of this experimental in vitro study, it can be concluded that the color of the skin influences the accuracy of 3D-surface scans. White simulated skin produces higher accuracy scans and darker simulated skin colors produce lower accuracy scans. The incorporation of fiducial markers improves the accuracy of scans completed on darker skin colors, and infrared light scanners are more efficient for scanning black surfaces than blue-light scanners.

Author Contributions

Conceptualization, R.A.D.-R.; Formal analysis, R.A.D.-R.; Investigation, I.B. and A.A.; Methodology, R.A.D.-R.; Resources, R.A.D.-R. and G.E.R.; Software, I.B., A.A. and R.A.D.-R.; Supervision, R.A.D.-R.; Validation, I.B., A.A. and R.A.D.-R.; Visualization, R.A.D.-R.; Writing—original draft, I.B., A.A. and R.A.D.-R.; Writing—review and editing, I.B., A.A. and R.A.D.-R. All authors have read and agreed to the published version of the manuscript.

Funding

This research received no external funding.

Institutional Review Board Statement

Not applicable.

Informed Consent Statement

Not applicable.

Data Availability Statement

The raw data supporting the conclusions of this article will be made available by the authors on request.

Acknowledgments

The authors acknowledgment the support from the Laboratory for Periodontal Implant and Phototherapy (LA-PIP) and the Laboratory for Digital Implant and Prosthodontic Research (DIPRESLAB).

Conflicts of Interest

The authors declare no conflicts of interest.

References

  1. Singh, P.; Bornstein, M.M.; Hsung, R.T.-C.; Ajmera, D.H.; Leung, Y.Y.; Gu, M. Frontiers in Three-Dimensional Surface Imaging Systems for 3D Face Acquisition in Craniofacial Research and Practice: An Updated Literature Review. Diagnostics 2024, 14, 423. [Google Scholar] [CrossRef] [PubMed]
  2. Bootvong, K.; Liu, Z.; McGrath, C.; Hagg, U.; Wong, R.W.K.; Bendeus, M.; Yeung, S. Virtual Model Analysis as an Alternative Approach to Plaster Model Analysis: Reliability and Validity. Eur. J. Orthod. 2010, 32, 589–595. [Google Scholar] [CrossRef]
  3. Santoro, M.; Galkin, S.; Teredesai, M.; Nicolay, O.F.; Cangialosi, T.J. Comparison of Measurements Made on Digital and Plaster Models. Am. J. Orthod. Dentofac. Orthop. 2003, 124, 101–105. [Google Scholar] [CrossRef] [PubMed]
  4. Salloum, R. Revolutionizing Dentistry: Exploring the Potential of Facial Scanners for Precise Treatment Planning and Enhanced Patient Outcomes. J. Prosthet. Dent. 2024, 132, 1–5. [Google Scholar] [CrossRef] [PubMed]
  5. Srinivasan, M.; Berisha, F.; Bronzino, I.; Kamnoedboon, P.; Leles, C.R. Reliability of a Face Scanner in Measuring the Vertical Dimension of Occlusion. J. Dent. 2024, 146, 105016. [Google Scholar] [CrossRef]
  6. Quinzi, V.; Polizzi, A.; Ronsivalle, V.; Santonocito, S.; Conforte, C.; Manenti, R.J.; Isola, G.; Lo Giudice, A. Facial Scanning Accuracy with Stereophotogrammetry and Smartphone Technology in Children: A Systematic Review. Children 2022, 9, 1390. [Google Scholar] [CrossRef]
  7. Raffone, C.; Gianfreda, F.; Pompeo, M.G.; Antonacci, D.; Bollero, P.; Canullo, L. Chairside Virtual Patient Protocol. Part 2: Management of Multiple Face Scans and Alignment Predictability. J. Dent. 2022, 122, 104123. [Google Scholar] [CrossRef] [PubMed]
  8. Lippold, C.; Liu, X.; Wangdo, K.; Drerup, B.; Schreiber, K.; Kirschneck, C.; Moiseenko, T.; Danesh, G. Facial Landmark Localization by Curvature Maps and Profile Analysis. Head Face Med. 2014, 10, 54. [Google Scholar] [CrossRef]
  9. Leung, M.Y.; Lo, J.; Leung, Y.Y. Accuracy of Different Modalities to Record Natural Head Position in 3 Dimensions: A Systematic Review. J. Oral Maxillofac. Surg. 2016, 74, 2261–2284. [Google Scholar] [CrossRef]
  10. Probst, J.; Dritsas, K.; Halazonetis, D.; Ren, Y.; Katsaros, C.; Gkantidis, N. Precision of a Hand-Held 3D Surface Scanner in Dry and Wet Skeletal Surfaces: An Ex Vivo Study. Diagnostics 2022, 12, 2251. [Google Scholar] [CrossRef]
  11. Xia, S.; Guo, S.; Li, J.; Istook, C. Comparison of Different Body Measurement Techniques: 3D Stationary Scanner, 3D Handheld Scanner, and Tape Measurement. J. Text. Inst. 2019, 110, 1103–1113. [Google Scholar] [CrossRef]
  12. Renard, G.; Leid, J. Les dangers de la lumière bleue: La vérité! J. Fr. D’Ophtalmol. 2016, 39, 483–488. [Google Scholar] [CrossRef] [PubMed]
  13. Schmit, J.; Olszak, A. High-Precision Shape Measurement by White-Light Interferometry with Real-Time Scanner Error Correction. Appl. Opt. 2002, 41, 5943. [Google Scholar] [CrossRef]
  14. Rey, M.; Volpe, G.; Volpe, G. Light, Matter, Action: Shining Light on Active Matter. ACS Photonics 2023, 10, 1188–1201. [Google Scholar] [CrossRef]
  15. Mizuno, K.; Ishii, J.; Kishida, H.; Hayamizu, Y.; Yasuda, S.; Futaba, D.N.; Yumura, M.; Hata, K. A Black Body Absorber from Vertically Aligned Single-Walled Carbon Nanotubes. Proc. Natl. Acad. Sci. USA 2009, 106, 6044–6047. [Google Scholar] [CrossRef]
  16. Cheng, J.-C.; Pan, T.-S.; Hsiao, W.-C.; Lin, W.-H.; Liu, Y.-L.; Su, T.-J.; Wang, S.-M. Using Contactless Facial Image Recognition Technology to Detect Blood Oxygen Saturation. Bioengineering 2023, 10, 524. [Google Scholar] [CrossRef]
  17. Petrides, G.; Clark, J.R.; Low, H.; Lovell, N.; Eviston, T.J. Three-Dimensional Scanners for Soft-Tissue Facial Assessment in Clinical Practice. J. Plast. Reconstr. Aesthetic Surg. 2021, 74, 605–614. [Google Scholar] [CrossRef]
  18. Major, M.; Mészáros, B.; Würsching, T.; Polyák, M.; Kammerhofer, G.; Németh, Z.; Szabó, G.; Nagy, K. Evaluation of a Structured Light Scanner for 3D Facial Imaging: A Comparative Study with Direct Anthropometry. Sensors 2024, 24, 5286. [Google Scholar] [CrossRef]
  19. Akl, M.A.; Mansour, D.E.; Zheng, F. The Role of Intraoral Scanners in the Shade Matching Process: A Systematic Review. J. Prosthodont. 2023, 32, 196–203. [Google Scholar] [CrossRef]
  20. Allred, S.R.; Olkkonen, M. The Effect of Background and Illumination on Color Identification of Real, 3D Objects. Front. Psychol. 2013, 4, 821. [Google Scholar] [CrossRef]
  21. Varda, K.; Bešlagić, E.; Zaimović-Uzunović, N.; Lemeš, S. Ambient Light and Object Color Influence on the 3D Scanning Process. In New Technologies, Development and Application V; Karabegović, I., Kovačević, A., Mandžuka, S., Eds.; Lecture Notes in Networks and Systems; Springer International Publishing: Cham, Switzerland, 2022; Volume 472, pp. 37–45. ISBN 978-3-031-05229-3. [Google Scholar]
  22. Krithikadatta, J.; Gopikrishna, V.; Datta, M. CRIS Guidelines (Checklist for Reporting In-vitro Studies): A concept note on the need for standardized guidelines for improving quality and transparency in reporting in-vitro studies in experimental dental research. J. Conserv. Dent. 2014, 17, 301–304. [Google Scholar] [CrossRef] [PubMed]
  23. Bai, Z.; Cui, X.; Wang, X.; Xie, H.; Chen, B. Light Absorption of Black Carbon Is Doubled at Mt. Tai and Typical Urban Area in North China. Sci. Total Environ. 2018, 635, 1144–1151. [Google Scholar] [CrossRef] [PubMed]
  24. Özsoy, U.; Sekerci, R.; Hizay, A.; Yildirim, Y.; Uysal, H. Assessment of reproducibility and reliability of facial expressions using 3D handheld scanner. J. Craniomaxillofac Surg. 2019, 47, 895–901. [Google Scholar] [CrossRef]
  25. Knoops, P.G.M.; Beaumont, C.A.A.; Borghi, A.; Rodriguez-Florez, N.; Breakey, R.W.F.; Rodgers, W.; Angullia, F.; Jeelani, N.U.O.; Schievano, S.; Dunaway, D.J. Comparison of Three-Dimensional Scanner Systems for Craniomaxillofacial Imaging. J. Plast. Reconstr. Aesthetic Surg. 2017, 70, 441–449. [Google Scholar] [CrossRef] [PubMed]
  26. Egri, L.; Nabati, H.; Yu, J.Y. RainbowTag: A Fiducial Marker System with a New Color Segmentation Algorithm. In Proceedings of the 2022 IEEE International Conference on Connected Vehicle and Expo (ICCVE), Lakeland, FL, USA, 7–9 March 2022; pp. 1–6. [Google Scholar]
  27. Dindaroğlu, F.; Kutlu, P.; Duran, G.; Görgülü, S.; Aslan, E. Accuracy and reliability of 3D stereophotogrammetry: A comparison to direct anthropometry and 2D photogrammetry. Angle Orthod. 2016, 86, 487–494. [Google Scholar] [CrossRef]
  28. Paschotta, R. Infrared Light. RP Photonics Encyclopedia. Available online: https://www.rp-photonics.com/infrared_light.html (accessed on 30 September 2024).
  29. McDonough, M. Blue Light. Encyclopedia Britannica. 2024. Available online: https://www.britannica.com/science/blue-light (accessed on 30 September 2024).
  30. Del Bino, S.; Duval, C.; Bernerd, F. Clinical and Biological Characterization of Skin Pigmentation Diversity and Its Consequences on UV Impact. Int. J. Mol. Sci. 2018, 19, 2668. [Google Scholar] [CrossRef]
Figure 1. Frontal and a lateral view of the mannequin heads with fiducial markers placed. Nine locations were marked: left and right exocanthion, left and right cheilion, the pogonion, the philtrum, the right and left helical crus of the ears, and the glabella.
Prosthesis 06 00099 g001
Figure 2. A red arrow pointing to the rotating base/platform placed below each mannequin.
Prosthesis 06 00099 g002
Figure 3. Scanners used in this experiment. The image shows the infrared light scanner (a) and the blue light scanner (b) mounted on a tripod.
Prosthesis 06 00099 g003
Figure 4. Setting scanning distance. The image shows one of the mannequin heads on the rotational base, a meter with the set distance, and the camera mounted in the tripod.
Prosthesis 06 00099 g004
Figure 5. Illustrative images of white mannequin heads showing scans overlaid on the control scan. The left image includes fiducial markers, while the right image does not. The color scale represents the RMS values, indicating the accuracy of the scans. Best accuracy of all groups achieved with the white mannequins.
Prosthesis 06 00099 g005
Figure 6. Illustrative images of pink mannequin heads with scans overlaid on the control scan. The left image includes fiducial markers, while the right image does not. The color scale represents the RMS values, indicating scan accuracy. Accuracy on pink mannequins was lower than on white mannequins but higher than on black mannequins.
Prosthesis 06 00099 g006
Figure 7. Illustrative images of black mannequin heads with scans overlaid on the control scan. The left image includes fiducial markers, while the right image does not. The color scale represents the RMS values, indicating scan accuracy. Accuracy on black mannequins was the lowest of all groups (white and pink).
Prosthesis 06 00099 g007
Figure 8. Infrared scanner. Box-plot comparison of RMS values for object color scans in white (W), pink (P), and black (B) mannequins with (T) and without markers (C). The asterisk (*) represents outlier.
Prosthesis 06 00099 g008
Figure 9. Blue-light Scanner. Box-plot comparison of RMS values for object color scans in white (W), pink (P), and black (B) mannequins with (T) and without markers (C). The asterisk (*) represents outlier.
Prosthesis 06 00099 g009
Table 1. Descriptive statistics of RMS values for object color scans for infrared scanner on white (W), pink (P), and black (B) mannequins with (T) and without markers (C).
GroupNMeanStDev95% Cl
RedWT (Test)100.19770.0317(0.1779, 0.2175)
RedWC (Control)100.177530.02781(0.15771, 0.19734)
RedPT (Test)100.135420.01310(0.05602, 0.21482)
RedPC (Control)100.36120.1685(0.2818, 0.4406)
RedBT (Test)100.34170.0506(0.2864, 0.3970)
RedBC (Control)100.59020.1063(0.5349, 0.6455)
Table 2. Descriptive statistics of RMS values for object color scans for blue-light scanner on white (W), pink (P), and black (B) mannequins with (T) and without markers (C).
GroupNMeanStDev95% Cl
BlueWT (Test)100.82800.45934(0.1965, 1.9653)
BlueWC (Control)101.199400.330039(0.55231, 1.5223)
BluePT (Test)102.264781.0608(1.4749, 4.4803)
BluePC (Control)102.984720.381317(2.15074, 3.45292)
BlueBT (Test)10---
BlueBC (Control)10---
Table 3. T-value and P-value comparisons of RMS values for white (W), pink (P), and black (B) colored objects with (D) and without markers (C).
SamplesT-ValueAdjusted p-Value
InfraRedWC (Control) vs. RedWT (Test)−1.360.207
InfraRedPC (Control) vs. RedPT (Test)4.230.001
InfraRedBC (Control) vs. RedBT (Test)6.670.001
Table 4. T-value and P-value comparisons of RMS values in white (W), pink (P), and black (B) object color with (D) and without markers (C).
SamplesT-ValueAdjusted p-Value
BlueWC (Control) vs. BlueWT (Test)−1.810.148
BluePC (Control) vs. BluePT (Test)−1.880.092
BlueBC (Control) vs. BlueBT (Test)--
Disclaimer/Publisher’s Note: The statements, opinions and data contained in all publications are solely those of the individual author(s) and contributor(s) and not of MDPI and/or the editor(s). MDPI and/or the editor(s) disclaim responsibility for any injury to people or property resulting from any ideas, methods, instructions or products referred to in the content.

