Article

Prevalence and Spatial Patterns of Major Limb Loss in the Acholi Sub-Region of Uganda

1
MCGIS, Department of Geography, University of Manchester, Manchester M13 9PL, UK
2
School of Medicine, Gulu University, Laroo Division, Gulu City P.O. Box 166, Uganda
3
Faculty of Biology Medicine and Health, University of Manchester, Manchester M13 9PL, UK
*
Author to whom correspondence should be addressed.
Prosthesis 2022, 4(3), 369-382; https://doi.org/10.3390/prosthesis4030030
Submission received: 26 May 2022 / Revised: 15 July 2022 / Accepted: 15 July 2022 / Published: 19 July 2022
(This article belongs to the Section Orthopedics and Rehabilitation)

Abstract

:
There is a widely reported yet poorly understood preponderance of major limb loss in Northern Uganda, caused in large part by prolonged civil war. Access to rehabilitation services is extremely limited, and there is no understanding of how many people have major limb loss, nor how many have had access to medical or rehabilitative services. This research represents the first prevalence study of disability and major limb loss in the Acholi sub-region of Northern Uganda, as well as a novel evaluation of spatial patterns in cases of major limb loss. We conservatively estimate that there are c. 10,117 people with major limb loss in Acholi (c. 0.5% of the population) who require long-term rehabilitation services, as well as c. 150,512 people with other disabilities (c. 8.2% of the population). We also demonstrate that people with major limb loss are spread throughout the region (as opposed to clustered in specific locations) and are disproportionately male, older, and less well educated than the general population. This research demonstrates a clear inadequacy in both the supply and service delivery models of rehabilitation services for those with major limb loss in the study area and provides much-needed insight into the challenges that must be addressed for an effective system to be put in place.

1. Introduction

The Acholi sub-region in northern Uganda is an area of widespread poverty that suffered a prolonged war that lasted for over 20 years. In this conflict, a rebel organisation known as the Lord’s Resistance Army (LRA) fought the Ugandan Government forces and attacked civilian settlements, resulting in large-scale destruction of property, mass displacement and extensive physical injuries to the civilian and combatant populations due to explosions, gunshots and punishment amputations [1,2,3]. The extensive media coverage associated with this conflict triggered large-scale operations by relief agencies such as the United Nations, World Food Programme, International Committee of the Red Cross, AVSI and several other smaller Non-Governmental Organisations (NGOs). These voluntary agencies accounted for the vast majority of health provision during the conflict, as the already limited local health infrastructure was destroyed by war [4]. However, these services were not sufficient to meet demand, and were often not able to reach the most remote and rural communities, leaving many un-treated. The involvement of these agencies has gradually scaled down since the conflict ended in 2005, whilst limited resources and the remote nature of Acholi mean that the adequate capacity for rehabilitative service provision has not been created by the government in the intervening period. As a result, many individuals who experience MLL either from causes related to the war or due to other causes, may never receive medical treatment, rehabilitative services or assistive devices (e.g., prosthetics).
The significant health benefits associated with the provision of a suitable prosthesis for people with major limb loss (MLL) are widely understood [5,6], but difficulties in accessing such services are well recognised in Uganda and many other countries in Sub Saharan Africa. The relatively low priority given to resource provision for less visible chronic health needs such as rehabilitation services is very apparent in many countries, and Uganda (Northern Uganda in particular) is no exception to this pattern [7]. Despite the formation of positive government policy with respect to disabled people, the disability services of the Ugandan government suffer from differing statistics and definitions of disability, which makes targeting interventions difficult [8,9]. Data on disability type and prevalence are also scarce, mostly existing only at the national level, with no understanding of spatial variations of prevalence within Uganda [8].
In this context, prevalence studies are essential tools to highlight the magnitude of the problem and its potential impact on wellbeing and productivity in order to influence health policy and establish the scale of rehabilitation service requirements in regions such as Acholi. Such detailed local data are of particular importance in a country where a prolonged and violent conflict was concentrated in some of the most remote parts of the country, where data collection is likely to be worst. Nevertheless, there is a notable absence of prevalence studies for limb loss across the Global South, with the few examples in the literature limited to hospital-based studies (e.g., [10]) or more developed countries (a review is provided in [11]). It is likely that this is, at least in part, due to the remote nature of the region and the associated lack of high-quality datasets such as maps and data on population and existing health provision; all of which pose significant challenges to both study design and subsequent analysis. The authors, therefore, hope that the novel methods presented here can be adopted and implemented elsewhere in order to promote a better understanding of disability prevalence and the need for rehabilitative services across the Global South.
The present study seeks to address this deficit by systematically determining the prevalence and spatial distribution of Major Limb Loss (MLL) in the Acholi sub-region of Northern Uganda. The study seeks to:
  • Characterise the causes of MLL in the population in the Acholi sub-region;
  • Provide an estimate for the number of people with MLL in the Acholi sub-region;
  • Describe the demographic characteristics of those with MLL in the Acholi sub-region;
  • Characterise the spatial distribution of people with MLL in the Acholi sub-region;
  • Examine the implications of these findings for the creation of prosthetic and rehabilitative service provision.

2. Materials and Methods

2.1. Study Area

This work is focused on the Acholi sub-region of Northern Uganda, which comprises eight districts: Agago, Amuru, Gulu, Kitgum, Lamwo, Nwoya, Omoro and Pader. The region is approximately 28,500 km2 in area [12], and the total population of this area is currently estimated at c. 1,790,700 (the c. notation refers to the Latin circa, which is scientific shorthand for approximately) [13], plus c. 55,574 refugees [14]; approximately 1,846,274 in total. However, the population of this region is extremely difficult to determine accurately due to the remote and rural nature of the region, significant unquantified uncertainty in the Ugandan census, extremely rapid population growth, and frequent movement of people (including refugees) in both directions across international borders to the Democratic Republic of the Congo and South Sudan. This region was the worst impacted by the LRA conflict and is characterised by high levels of poverty and low levels of health service provision.

2.2. Study and Sample Design

Our study is based on a cross-sectional survey of randomly selected clusters of private household units selected from across the entire region. Our initial power calculations indicated that it would be necessary to study a random sample of 16,497 people in order to achieve a confidence level of 99% with a margin of error of 1%, which equates to approximately 3000 households [15], given an average household size for Acholi of 5.5 people [16]. However, given the high degree of uncertainty in the population estimate, the expected low levels of MLL prevalence and the expectation of spatial autocorrelation (clustering) in MLL cases, we adopted a deliberate strategy of oversampling. We, therefore, set out to survey 8000 households across the 8 districts, which equates to c. 44,000 people [16].
The sample of 8000 households was selected using a two-stage random cluster sampling approach. In the first stage, a stratified approach was used in which 100 locations were selected within each of the eight districts. In the absence of up-to-date maps or data on the distribution of the population in the region [17,18], we utilised the High-Resolution Settlement Layer (HRSL) dataset [19], which was produced in 2015 through collaboration between the World Bank and the Connectivity Lab at Facebook [20,21]. This dataset provides estimated values of population density as a continuous raster surface of c. 30 m2 (1 arc-second, or 1/3600 of a degree of latitude or longitude) cells. Values in the HRSL are calculated using high-resolution satellite imagery and a combination of computer vision and machine learning techniques in order to detect buildings, which are then combined with census data in order to determine a population estimate [20,21]. In order to select the sample locations, all cells containing non-zero values in the HRSL dataset were converted to point locations using a Python script [22], and then 100 points per district (800 in total) were selected using the ‘Random Selection’ functionality in QGIS [23]. The distribution of the 800 sampling locations is shown in Figure 1, along with an illustration of the straight-line distance to the Gulu Referral Orthopaedic Clinic, which is the only facility in the region for MLL rehabilitation and the provision of prosthetic limbs. In the second stage, at each of the 800 randomly selected sample locations, a ‘cluster’ of the closest 10 households was identified for further assessment, resulting in a sample of 8000 households.
At each household, the study comprised two pre-tested, researcher-administered semi-structured questionnaires. The first questionnaire (File S1) was completed as part of an interview of the Head of Each Household (HoH) at each of the 8000 households. The second questionnaire (File S2) was completed as part of an interview of each person identified to have MLL within those households. In both cases, the only exclusion criteria were that the consenting participant had to be able to understand the purpose of the research to give informed consent and be over 18.
Both questionnaires (Files S1 and S2) were developed through multi-stakeholder engagement, including disabled people attending the regional rehabilitation centre at the Gulu Referral Hospital, community health workers and academics from the Gulu Medical Faculty. The validity of the questionnaire was tested amongst health workers representing the Gulu Regional Health Office, volunteers representing the Gulu University School of Medicine and a cohort of disabled people attending the Gulu Regional Referral Hospital. Through these pre-evaluations and focus group discussions, the questions were refined in an iterative fashion to ensure reproducibility and clarity, thereby ensuring the ability of the field teams to administer the survey tools effectively. Both sets of survey tools were then translated to the local Acholi Language by trained translators, and the validation process was repeated for the translated survey tools with iterative corrections when needed. The validation studies for the survey tools were conducted in May 2018.

2.3. Data Collection and Analysis

The field surveys were conducted between July and September 2018, during which time a team of researchers visited all 8000 selected sample locations. Trained research assistants administered both questionnaires during a 1:1 interview with each participant, which was necessary due to low levels of literacy in the region. All participants provided informed written consent prior to being interviewed. Interviews were conducted in the local language (Acholi) and translated into English for analysis. The local village administration officer (known as the ‘Local Councillor One’, or ‘LC1’) was given prior notice of the research team’s visit to any given village and was present alongside the visiting research teams in accordance with cultural norms.
The frequency and causes for MLL within the sample population were calculated, and the observed gender, age and educational attainment distributions were compared against the expected values for this population obtained from national census data using the Chi-squared (χ2) goodness of fit statistic. Expected distributions for this comparison were determined by scaling the distribution of values drawn from the UBOS 2014 Census [24] or UBOS 2018 Mid-Year Population Projection [25].
In order to examine the spatial distribution of MLL and service access across the Acholi Sub-Region, we used the Moran’s I statistic [26] to test for spatial autocorrelation (in which the null hypothesis is that data points are randomly dispersed). This allows us to establish the extent to which areas with a high or low incidence of MLL are located closer to each other (spatial clustering) or further apart from each other (spatial dispersal) than would be expected under the assumption of a random distribution. However, with a dataset such as this, a random distribution does not provide an adequate null hypothesis, as we would expect that the distribution of people with MLL would reflect the distribution of the population, as opposed to being randomly distributed throughout the landscape. For this reason, we will adopt the approach proposed by Assuncao and Reis [27], which utilises an Empirical Bayes Index (EBI) in order to adjust Moran’s I for variation in population size, thus avoiding the loss of power that would otherwise result. Moran’s I is generally calculated from a weight matrix that describes the adjacency of different administrative zones. However, given the heterogeneity in size and population between parishes within this region, the relatively low number of samples (meaning that there is not one in every parish) and the limited impact of parish zones on daily life in the region, we instead opted for a row-standardised distance-weighted weight matrix, in which distances are calculated between the centroids of each region. The significance of the finding is determined using a standard permutation test, in which a pseudo-p-value is calculated based on 9999 permutations. In cases where a significant pattern is discovered, we can disaggregate the Moran’s I value into Local Indicators of Spatial Association (LISA) [28], which allows us to determine the location of clusters (i.e., a value surrounded by similar values) and outliers (i.e., a value surrounded by dissimilar values) in the dataset. Once again, the significance of each cluster and outlier is determined using a standard permutation test, in which a pseudo-p-value is calculated based on 9999 permutations. All statistical and spatial analyses were undertaken using Python 3.8.

3. Results

3.1. The Types and Causes of Disability and MLL

A total of 8000 households were visited by researchers, of which 7864 HoH responses to the first questionnaire were available for analysis following data cleaning. There were 3763 people with disabilities identified in the sample households (c. 47.9%), comprising 3943 individual disabilities (180 individuals had multiple disabilities). Of the 3763 individuals with disabilities, 237 had MLL (c. 6%), of which c. 59% had lost lower limbs, c. 39% upper limbs, and c. 2% both upper and lower limbs. Approximately 98% of people with MLL had unilateral limb loss, whilst c. 2% had bilateral limb loss. We were able to administer the second questionnaire to 181 of the 237 people with MLL (c. 76%). Reasons for non-participation in both questionnaires were limited to the exclusion criteria described above. The causes of identified cases of MLL are illustrated in Figure 2. As expected, war injuries are the most frequent cause in the region, accounting for c. 49.4% of cases.

3.2. Estimating Disability and MLL Prevalence

The mean household size in the Acholi Sub-Region is 5.5 [16], so our 7864 households equated to approximately 43,252 people, of which 237 had MLL. Because the sample was randomised, we can scale this up to the population of the Acholi Sub-Region using a conservative population estimate of 1,846,274 people [13,14]. Based on this, we estimate that there are approximately 10,117 people with MLL in the Acholi Sub Region (c. 0.5% of the population), which is the first formal estimate of MLL prevalence in the region. Amongst the cohort of people with MLL who completed questionnaire 2 (n = 181), 46% had not had access to any assistive devices (prosthetic limbs, crutches, walking sticks, etc.); 47% had not had access to any rehabilitative services, and 10% had not had access to any kind of healthcare whatsoever (including through local healthcare volunteers). Scaling these numbers up would suggest an estimate of 4654 and 4755 people who have never accessed devices or rehabilitative care, respectively.
However, a pervasive absence of on-going care and device maintenance in the region means that many who have had access to devices are not able to use them either because they are broken, badly fitted or otherwise unsuitable. Initial need is therefore not likely to be limited to those who have not accessed services before and these services are required for the lifetime of all patients, as devices will need adjustment, repair and replacement over time, and the health of the limb will need to be regularly checked. We also estimate that there are approximately 150,512 people with disabilities other than MLL in the region (c. 8.2% of the population), many of whom once again have had little or no access to medical or rehabilitation services. Given the expectation that the population projections used in this study are likely to be a substantial underestimate, these figures should, in turn, be considered conservative estimates.

3.3. Socio-Demographic Characterisation of Those with MLL

The gender, age, and education of those with MLL were compared with underlying population distributions using the χ2 goodness of fit statistic to identify any socio-demographic trends amongst those who are disabled. Of the 181 participants that completed the questionnaire, gender and age data were available for 167, and education was available for 166; missing data were disregarded for the purposes of this analysis. This analysis suggested that those with MLL in the Acholi Sub-Region are disproportionately male (p = 3.1 × 10⁻⁶), older (p = 1.3 × 10−67) and less well educated (p = 8.9 × 10−73) than would be expected from the respective underlying population distributions. The expected and observed distributions (as well as their differences) as illustrated in Figure 3. In all three cases, the probability that the distribution of observed values could have been drawn from the expected population distribution is vanishingly small.

3.4. Spatial Distribution of MLL and Access to Services

Spatial autocorrelation analysis of MLL incidence (n = 208) using the rate-adjusted Moran’s I statistic does not suggest a significant clustering of parishes with a high incidence of MLL (p = 0.278). This finding also holds when only war-related MLL is considered (p = 0.129), whereas if only non-war causes are considered, there is a significant dispersal of cases (I = −0.014, p = 1.0 × 10⁻³). This is the opposite of clustering, suggesting that people with MLL are more widely distributed than would be expected in a random distribution amongst the underlying population pattern. These findings clearly suggest that there is insufficient evidence to reject the null hypothesis that people with MLL are distributed randomly amongst the population. In fact, we have some evidence to support the idea that people with non-war-related MLL are more distributed than this. The implication here is that people with MLL are not clustered around certain key locations (e.g., large towns or cities or even locations where the war was most severe), which is an important consideration for the planning of service provision. An illustration of the importance of this spatial pattern arises when we compare it with the spatial pattern of those who have previously accessed rehabilitation services (n = 85). Here, the rate-adjusted Moran’s I analysis identifies that there is evidence of significant clustering (I = 0.035, p = 0.013). The application of a LISA analysis allows us to decompose the Moran’s I result and identify the locations of local clusters (both positive and negative) within the region, the results of which are presented in Figure 4.
The rate-adjusted LISA analysis presented above clearly demonstrates a significant cluster of access to rehabilitative care in the area surrounding Kitgum, one of the two large settlements in the Acholi Sub-Region. Kitgum was an area of significant focus for the LRA throughout the conflict and therefore was also a major focus for NGOs that provided services such as AVSI. This pattern illustrates the mismatch between the need (which is not clustered) and provision (which is highly clustered). It is expected that there is a cluster of people with MLL who have not had access to rehabilitative services in the southeast of the sub-region, as this is the area that is most remote from the two main settlements. However, the cluster to the west is comparatively close to Gulu (where AVSI ran a service for a period). Further research is required to better understand this pattern, but the proximity of this cluster to Gulu perhaps serves to illustrate the difficulty that people have in travelling long distances to access services. Similar clustering around urban centres was not identified for those who had been able to access prosthetic devices (p = 0.320), nor assistive devices in general (p = 0.251), which includes wheelchairs, crutches, etc.

4. Discussion

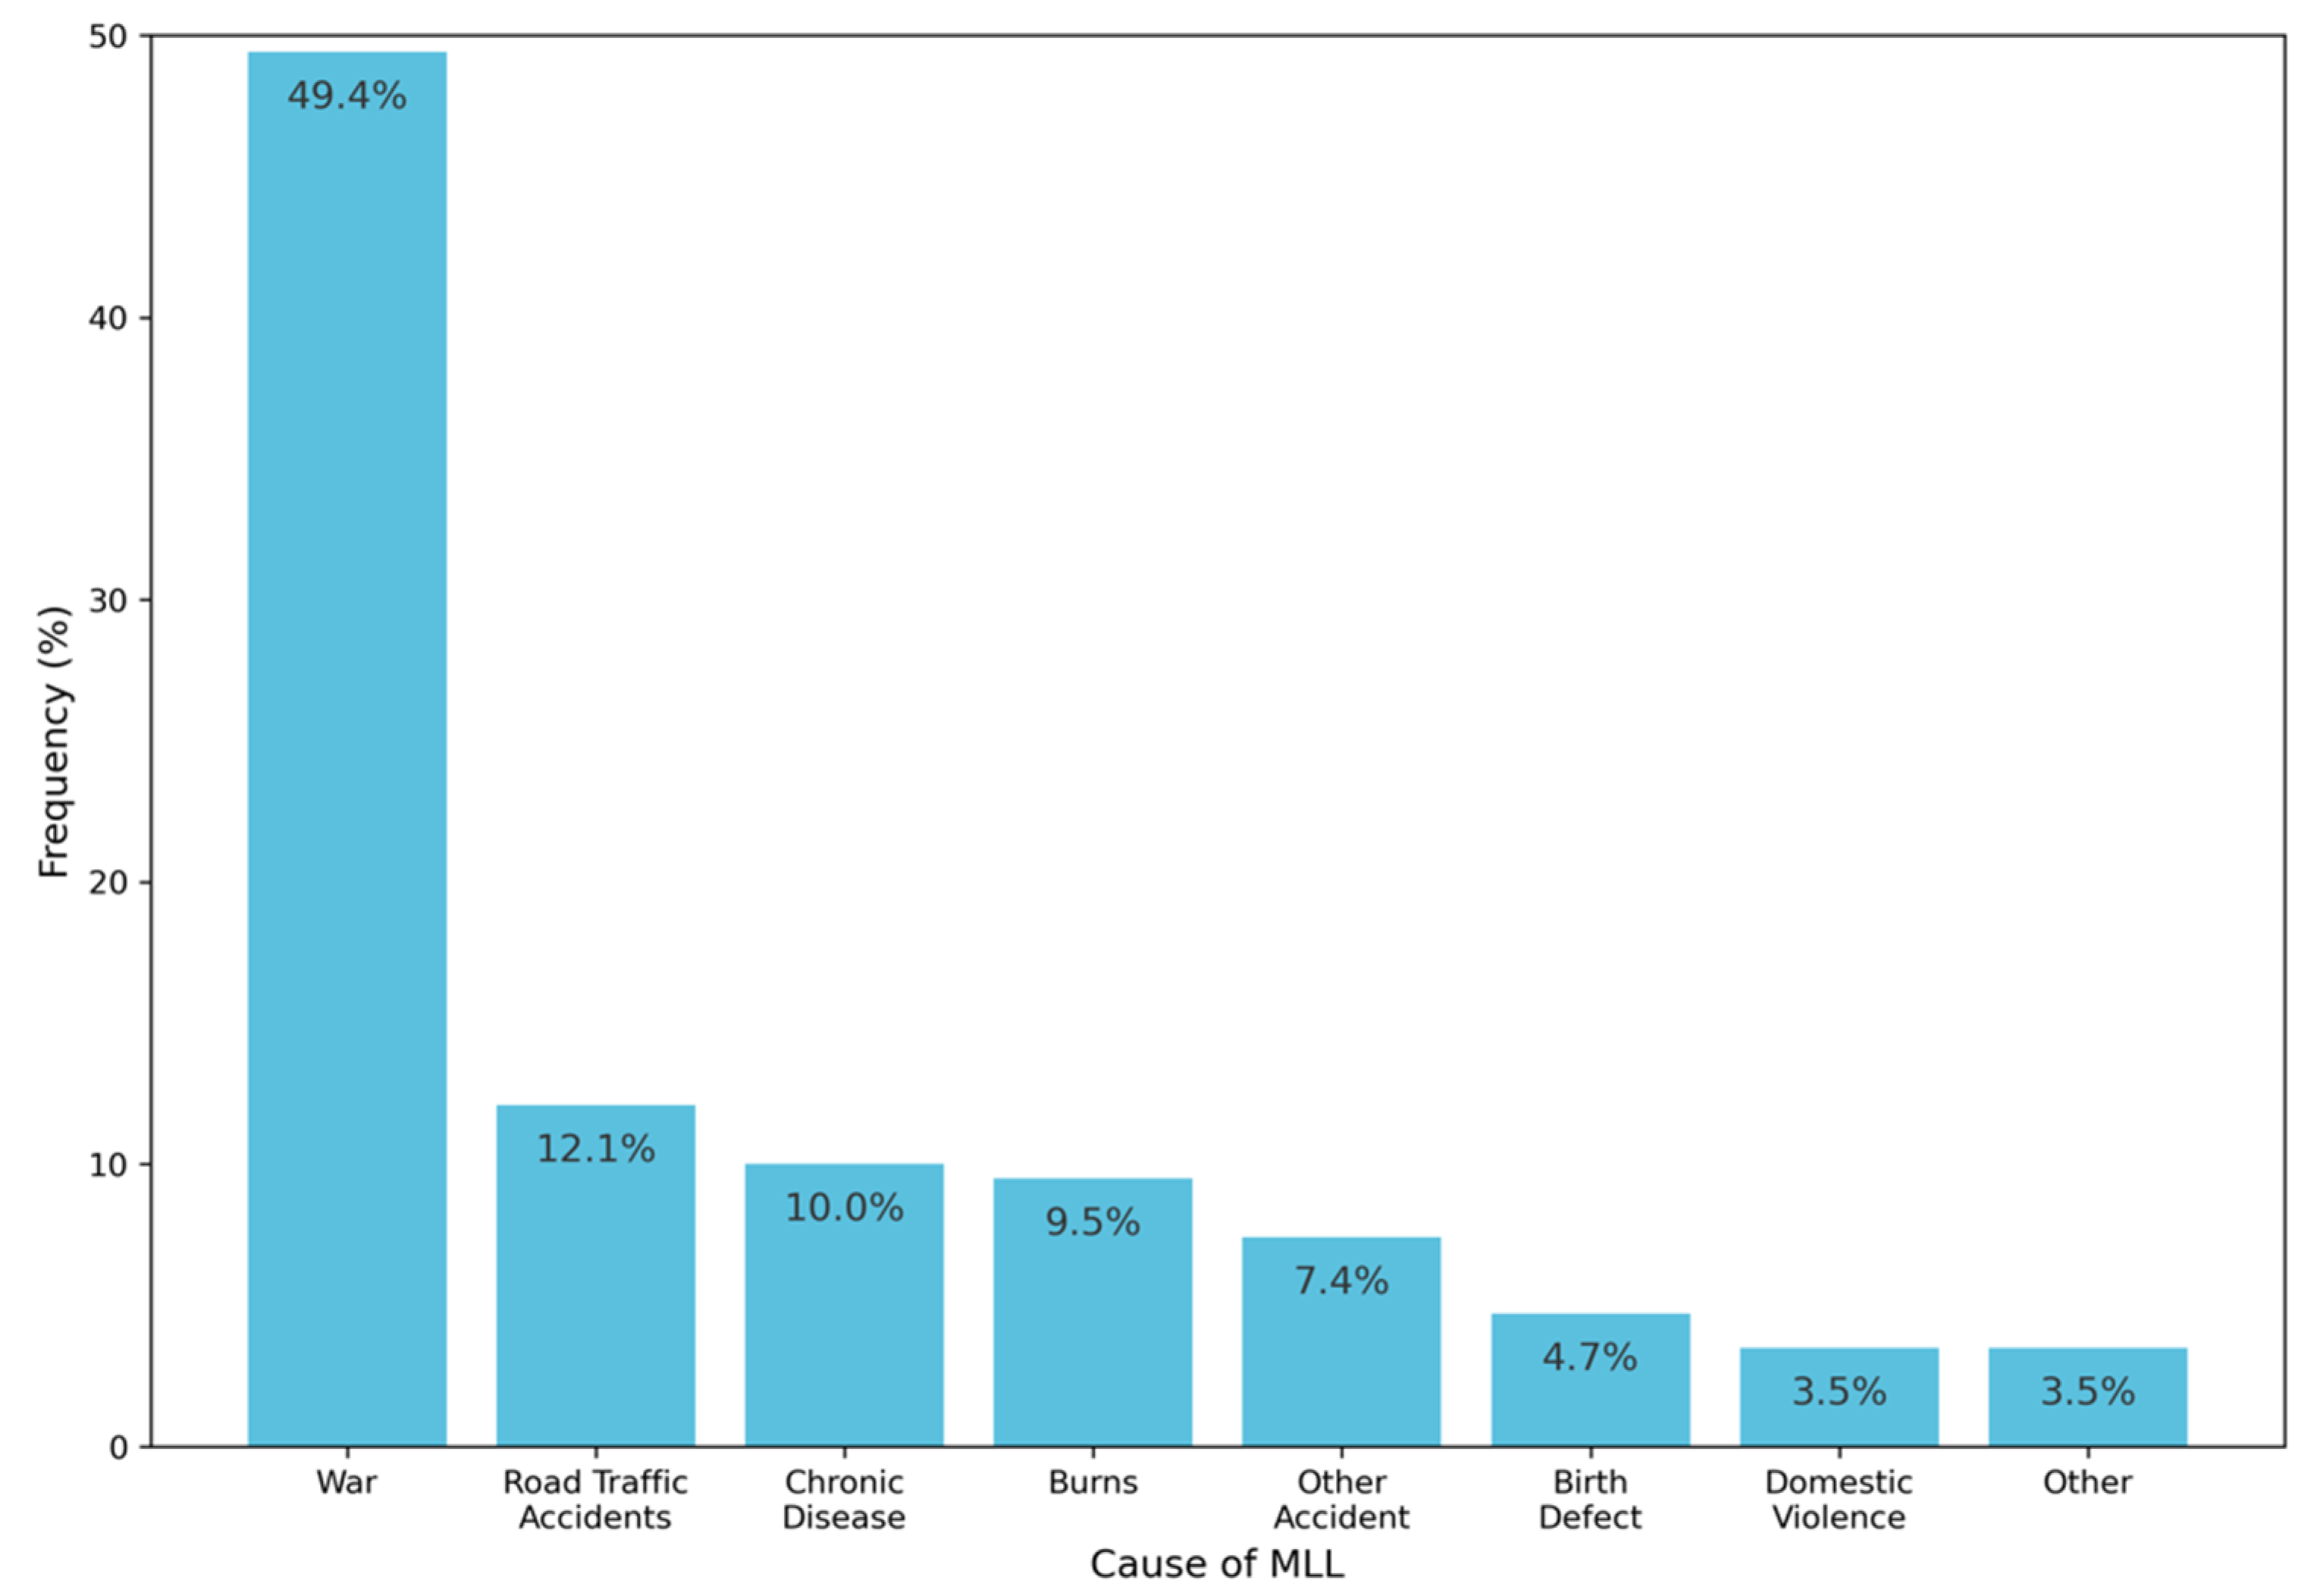
This study comprises the first systematic estimate of MLL prevalence in the Acholi Sub-Region. We estimate that there are approximately 10,117 people with MLL in this region, giving a prevalence rate of approximately 0.5% of the population. In addition to information on the prevalence of MLL, this work also provides the first detailed understanding of the causes of MLL, and their relative magnitudes. There is, of course, an important temporal aspect to these findings, which will have clear implications for future policy and service provision. For example, assuming that no new conflicts develop in the region, it is likely that the effects of the war (which currently explains approximately half of cases in the region) will reduce in relative magnitude, with a corresponding increase in causes such as road traffic accidents and chronic disease, both of which are becoming increasingly prevalent in the region as a result of changing lifestyles and the increasing proliferation of tarmac roads [10]. This expected shift could increase the likelihood of hospital attendance (e.g., for amputation) for those experiencing MLL, which could be beneficial from the perspective of increasing access to rehabilitative services, as patients receiving an amputation are already ‘in the system’ (as opposed to those who have never received formal medical care). However, a recent hospital-based study of 141 patients between 2007 and 2018 at two of the main hospitals in the region found that less than 1% of patients had been formally referred to rehabilitation services [10]. Clearly, the lack of provision in the region is a significant driver of this finding, and this work has, for the first time, provided evidence for both the size and spatial distribution of the need for rehabilitative services. These findings must therefore be used to formulate appropriate policy and training, such that a well-integrated rehabilitation service can be introduced to the system so that this urgent demand can be met.
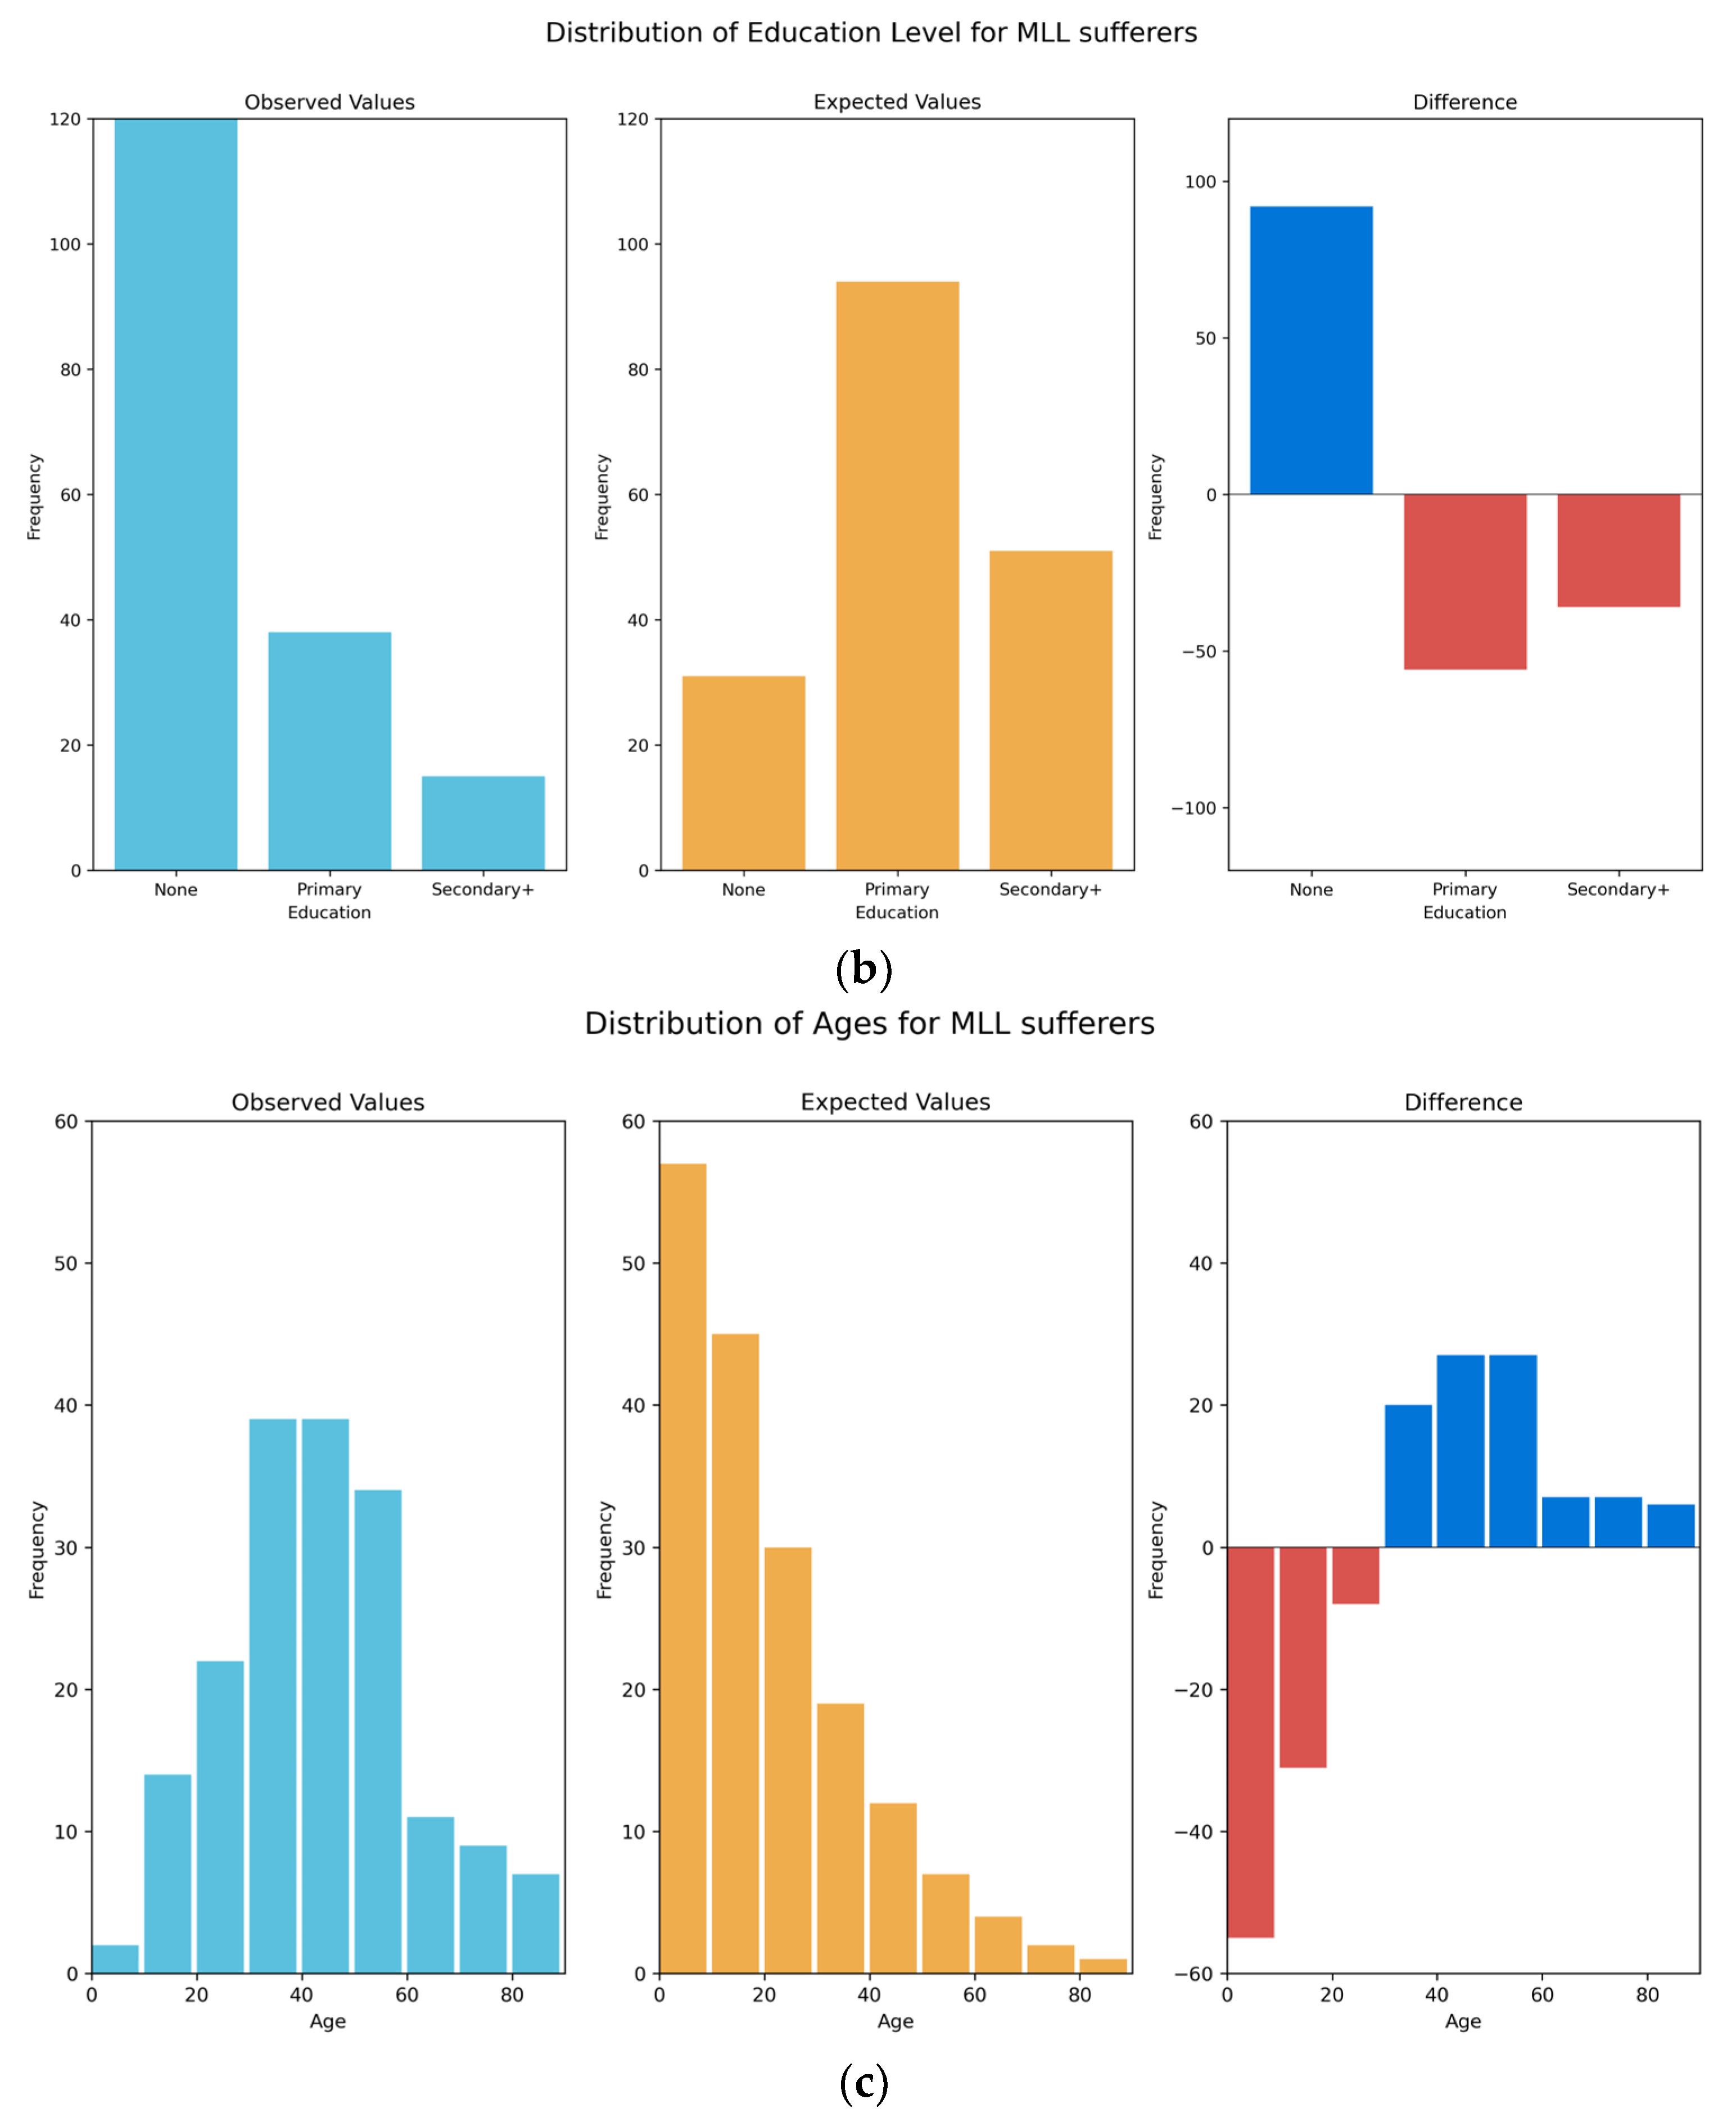
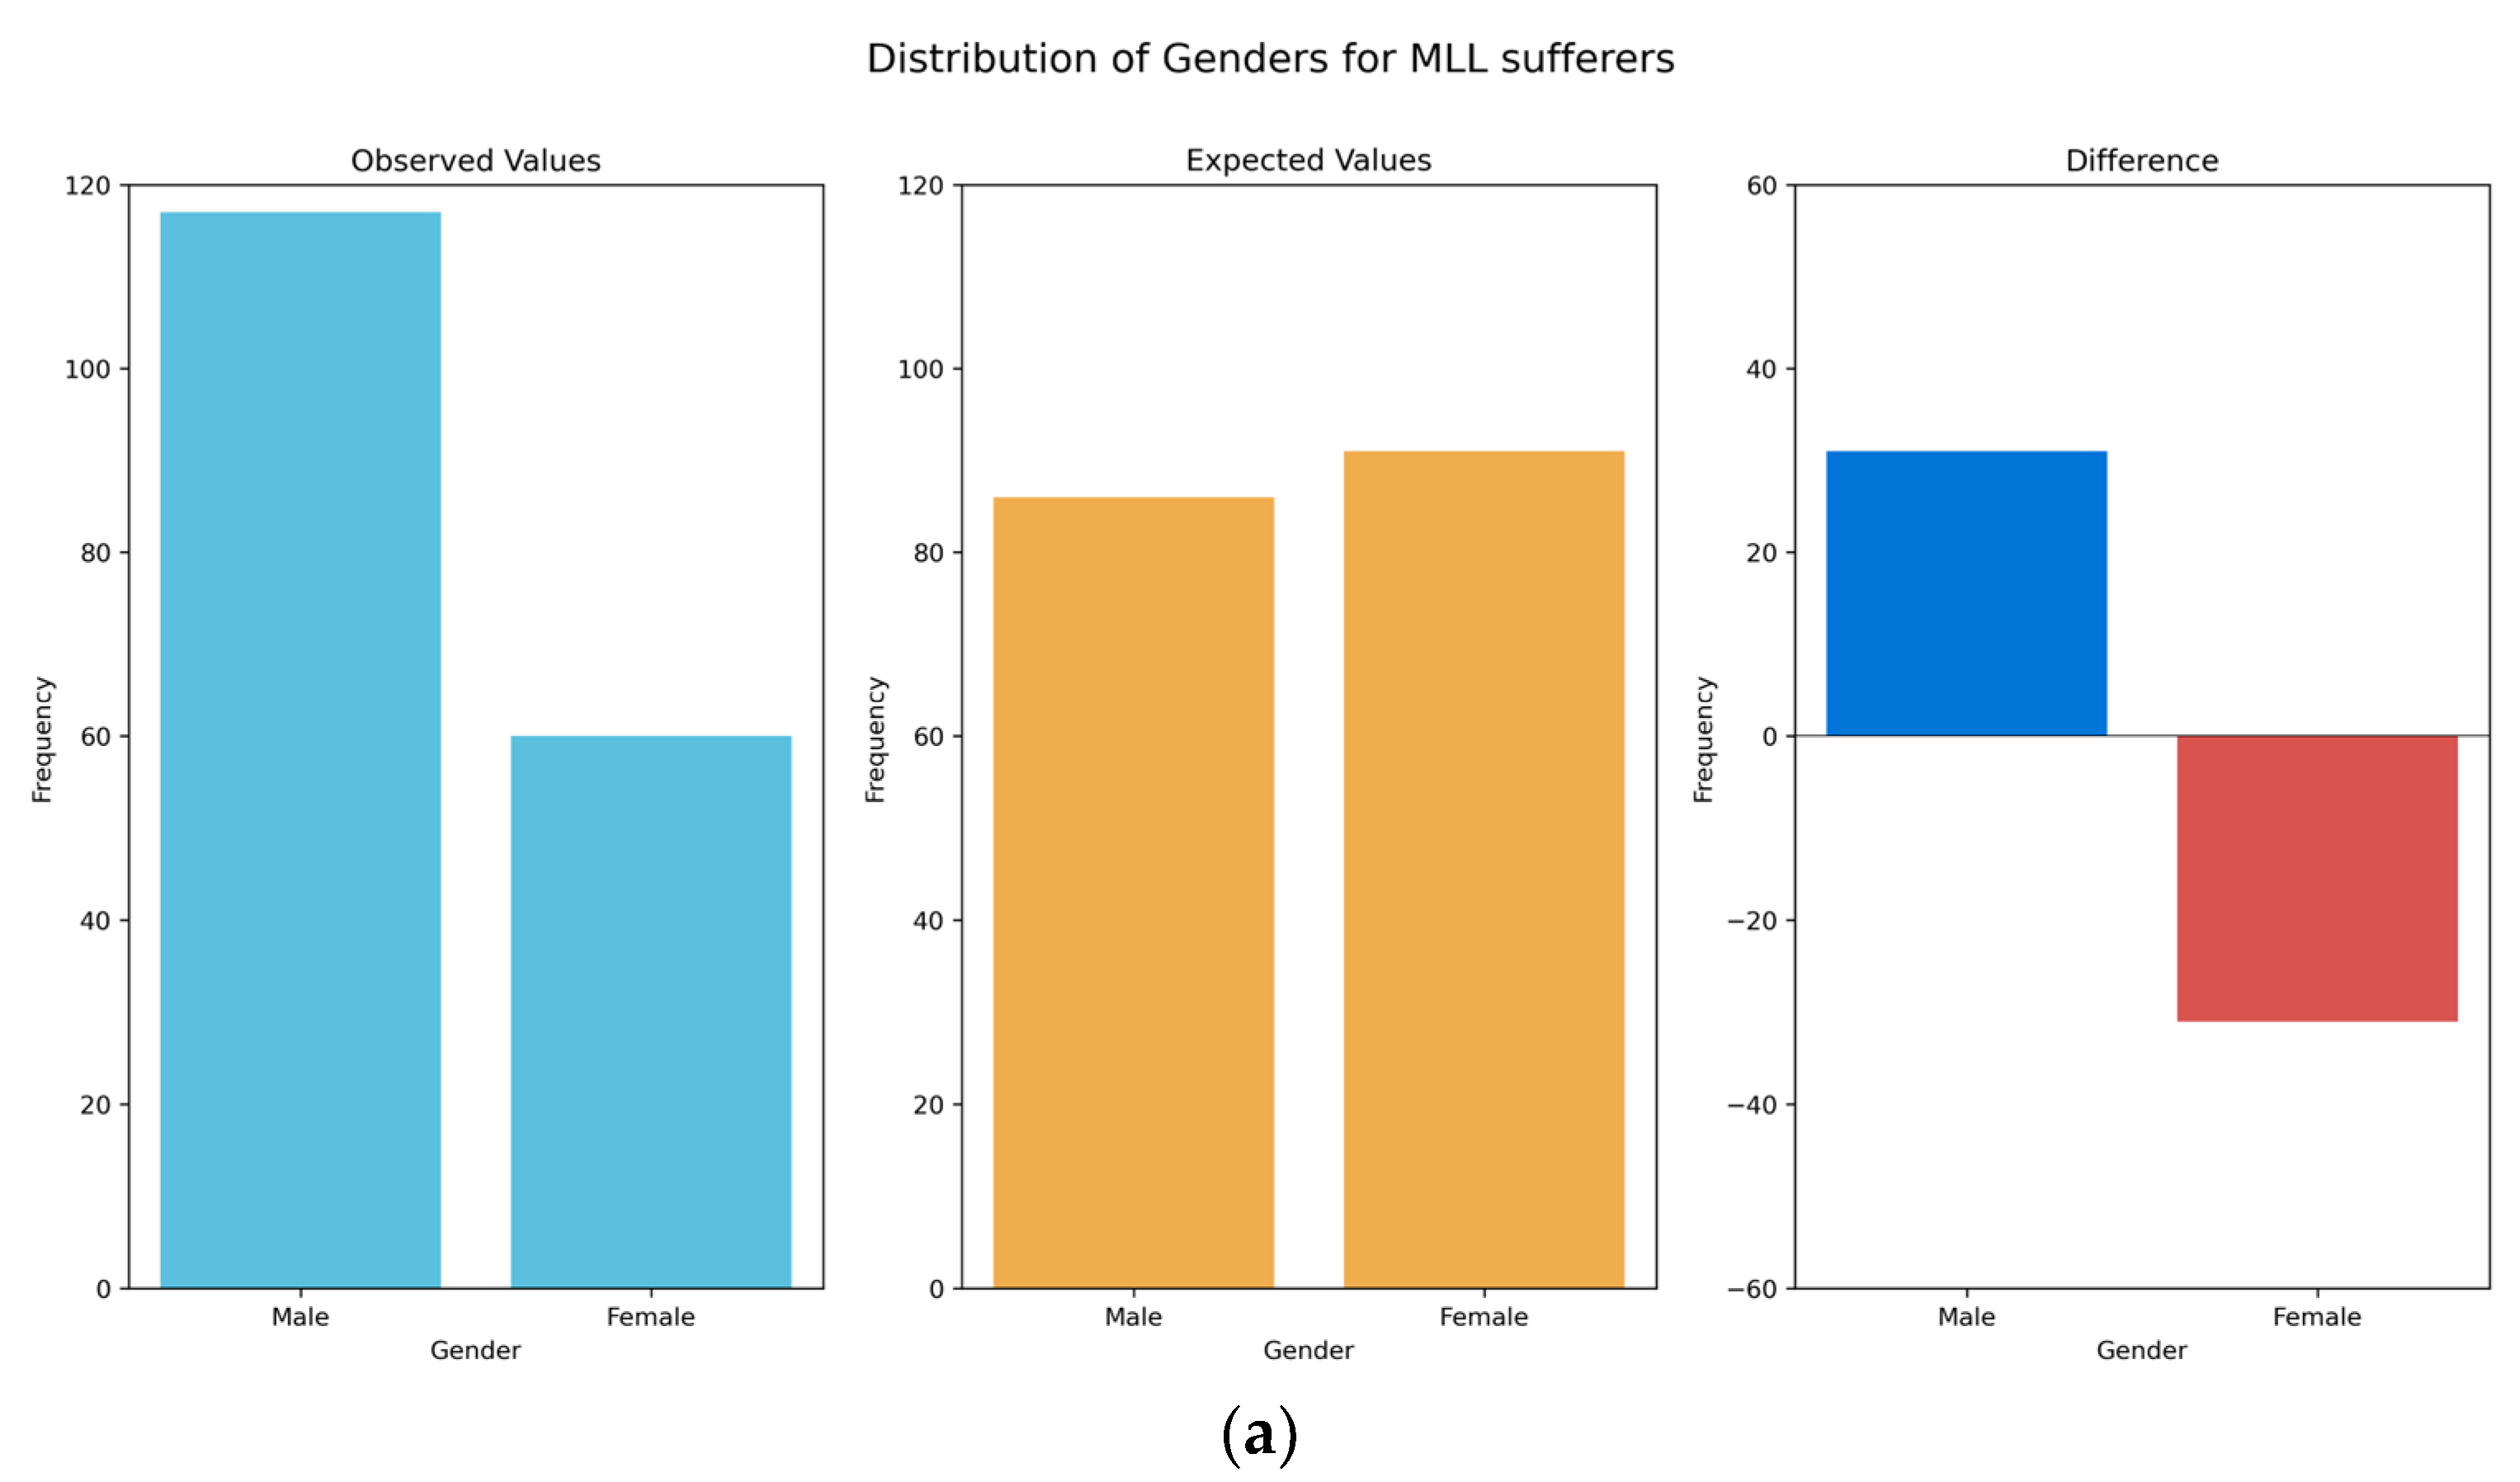
We have also demonstrated that those people with MLL in the region are predominantly male, older and have lower educational attainment when compared to the general population. These results meet with expectations, as males are more likely to have been injured during combat in the LRA insurgency, as well as being more likely to be working in the fields, where they may pick up injuries from remnant land mines or accidents caused during manual labour. The end of the LRA insurgency in around 2005 means that the young are therefore less likely to have been involved in fighting, attacks or other conflict-related injuries than older members of the population, though remnant land mines remain an issue for all. Those who lived through the conflict will also have likely experienced periods of reduced access to healthcare, meaning that less severe injuries might have resulted in MLL that could otherwise have been treated. It is also perhaps less likely that young people will have developed chronic diseases leading to MLL, such as type-2 diabetes, which typically presents later in life. With respect to levels of education, there is likely dual causation, with those who are disabled less likely to be able to afford or access education; whereas those with lower levels of education are more likely to be in situations where they might become injured, such as working in fields where they might become injured by remnant land mines, or driving a motorbike taxi (boda-boda) where they might be involved in a traffic accident. Our findings suggest that almost half of those with MLL have never had access to rehabilitative services or assistive devices of any kind. This reinforces clear inadequacy in rehabilitative service provision in the region and a clear need for urgent government investment.
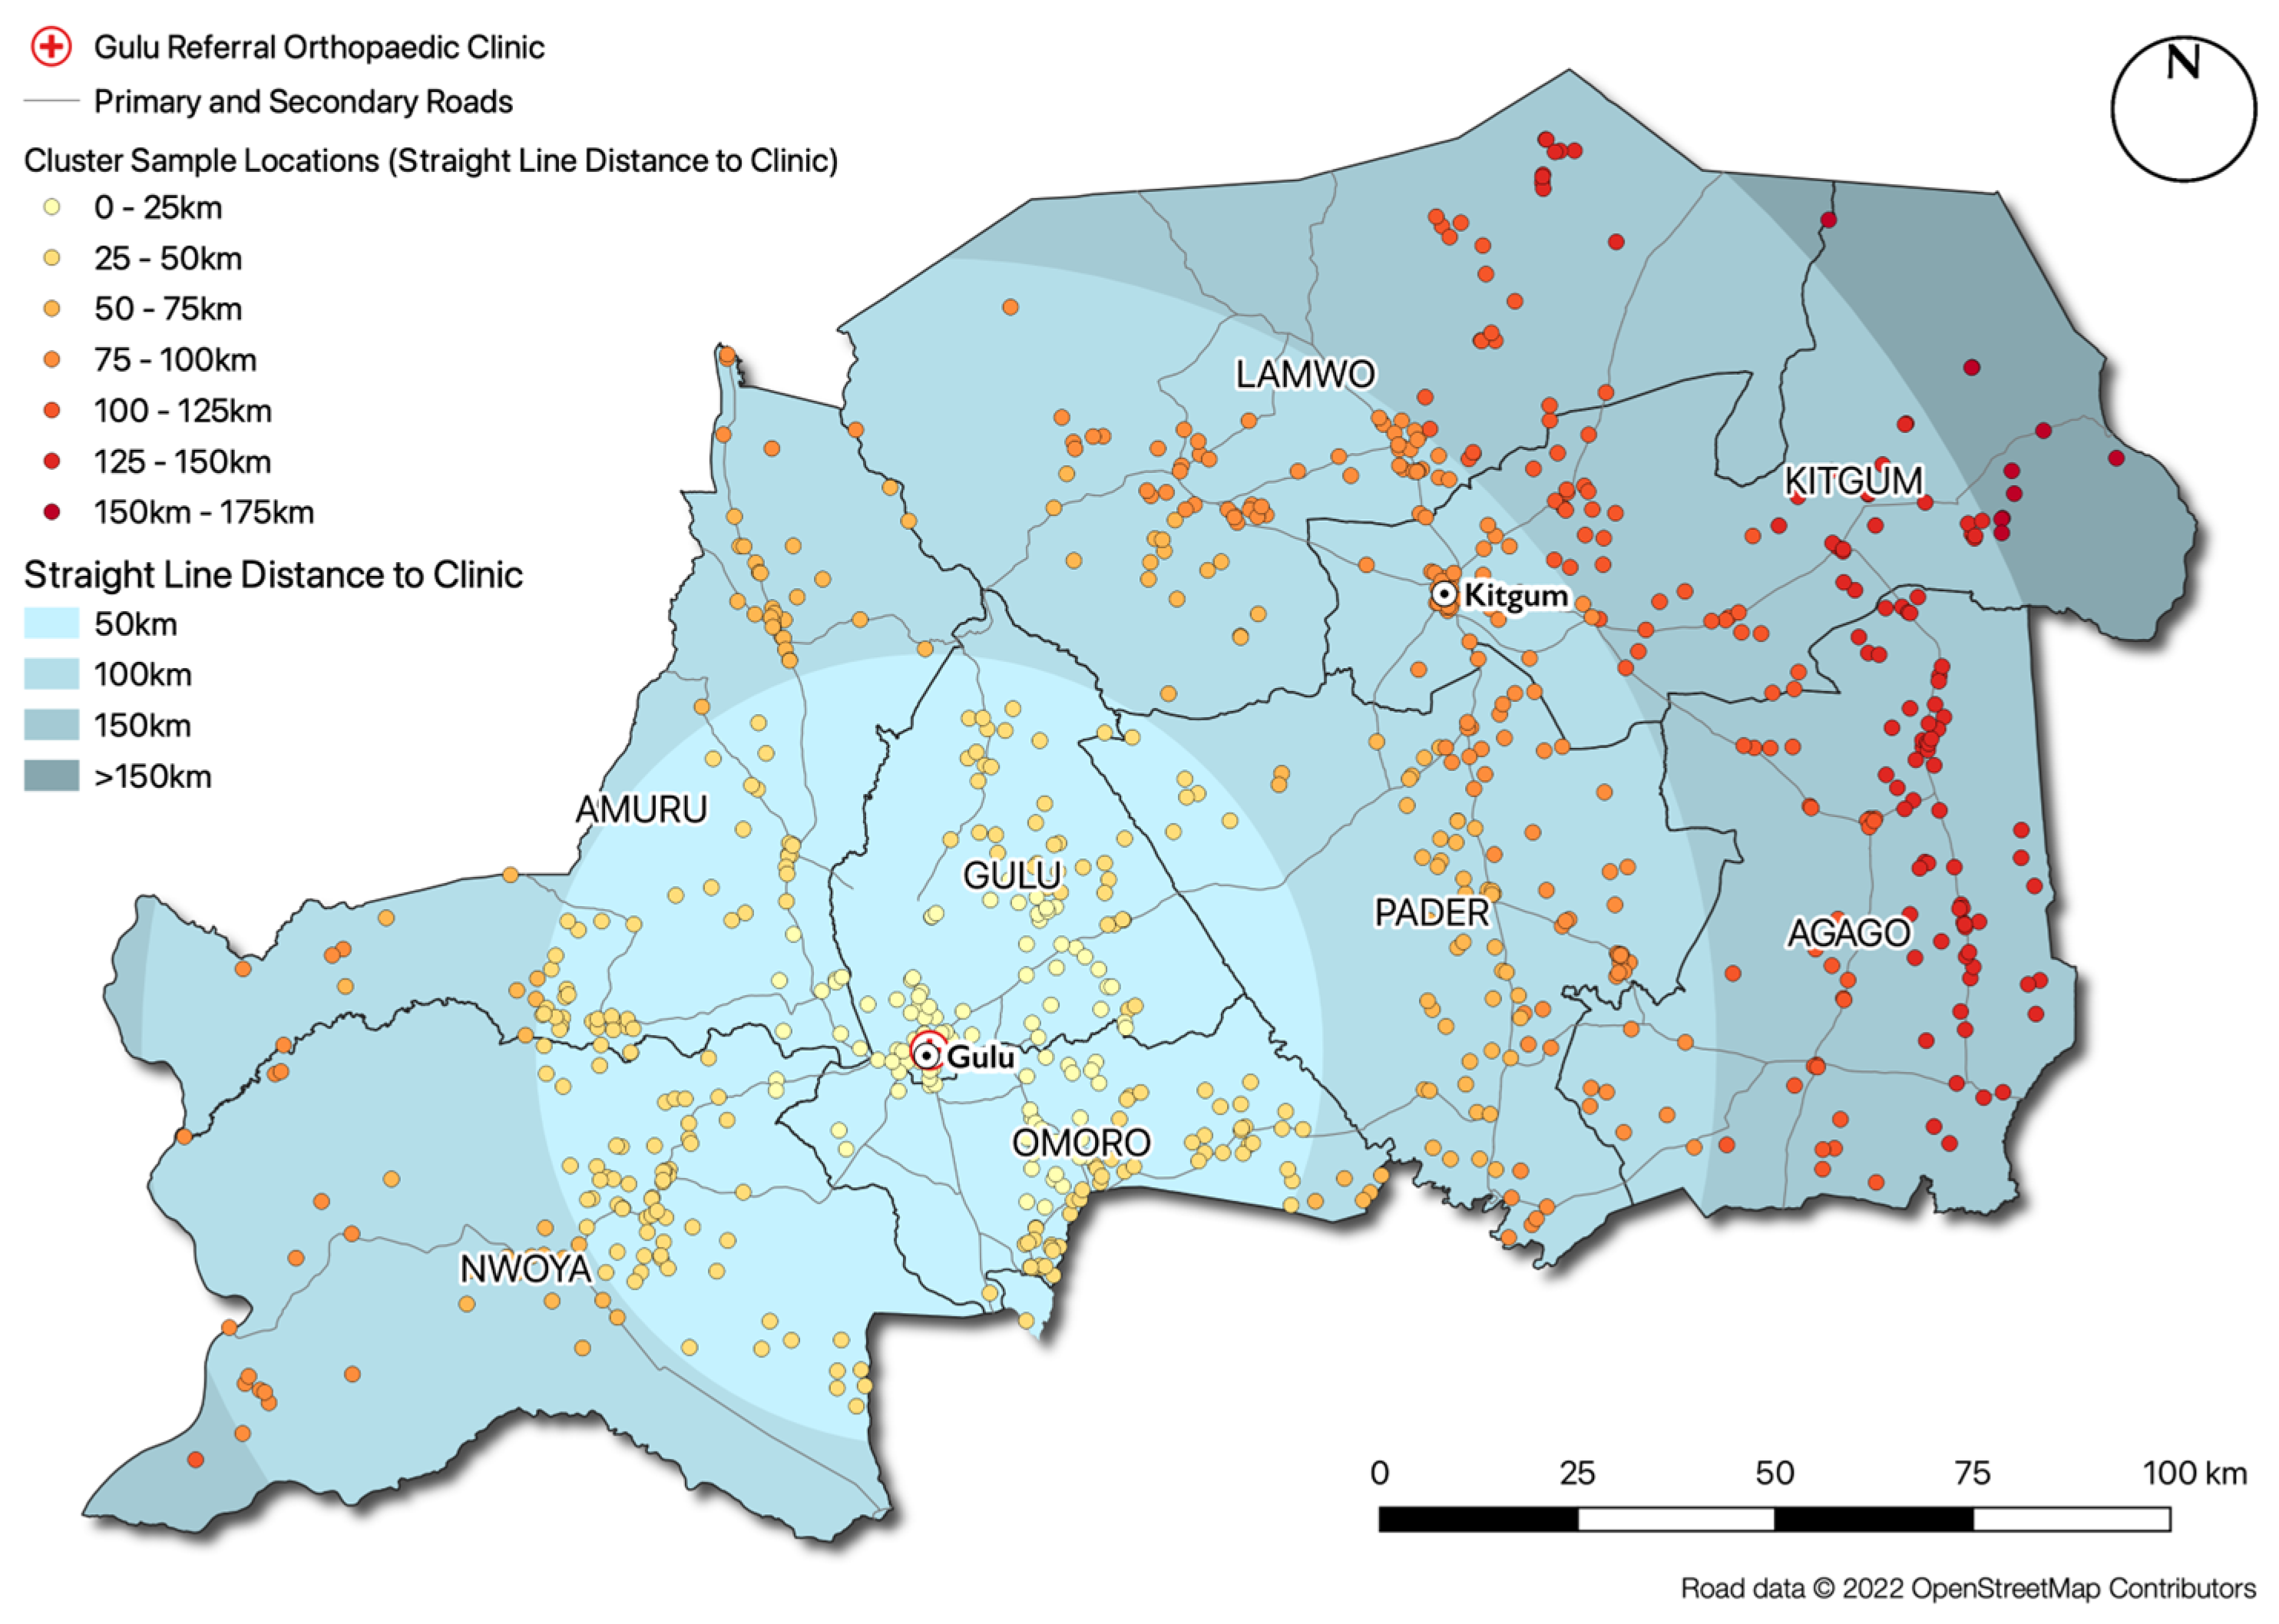
The challenge of creating such a service is illustrated by the findings of the spatial analysis presented in this research, which demonstrates that people with MLL are distributed throughout the entire region, as opposed to spatially clustered in certain locations (e.g., large towns or cities). Based on the current provision of rehabilitation and prosthetic services (a single facility at Gulu Referral Hospital, which was partly funded by this research project), those with MLL would be required to travel an average of over 60 km and a maximum of over 170 km to access these services. The estimated MLL prevalence rate (c. 0.5% of the population) clearly suggests that there is a substantial need for additional service provisions in this region. The highly dispersed spatial distribution of people with MLL, high levels of poverty in the region and poor road and transport links suggest that alternative service delivery models are urgently required, as it is unlikely that many people with MLL will be able to travel the required distances to receive services using traditional ‘centralised’ models based in the cities. This view is reinforced by the pattern found in 
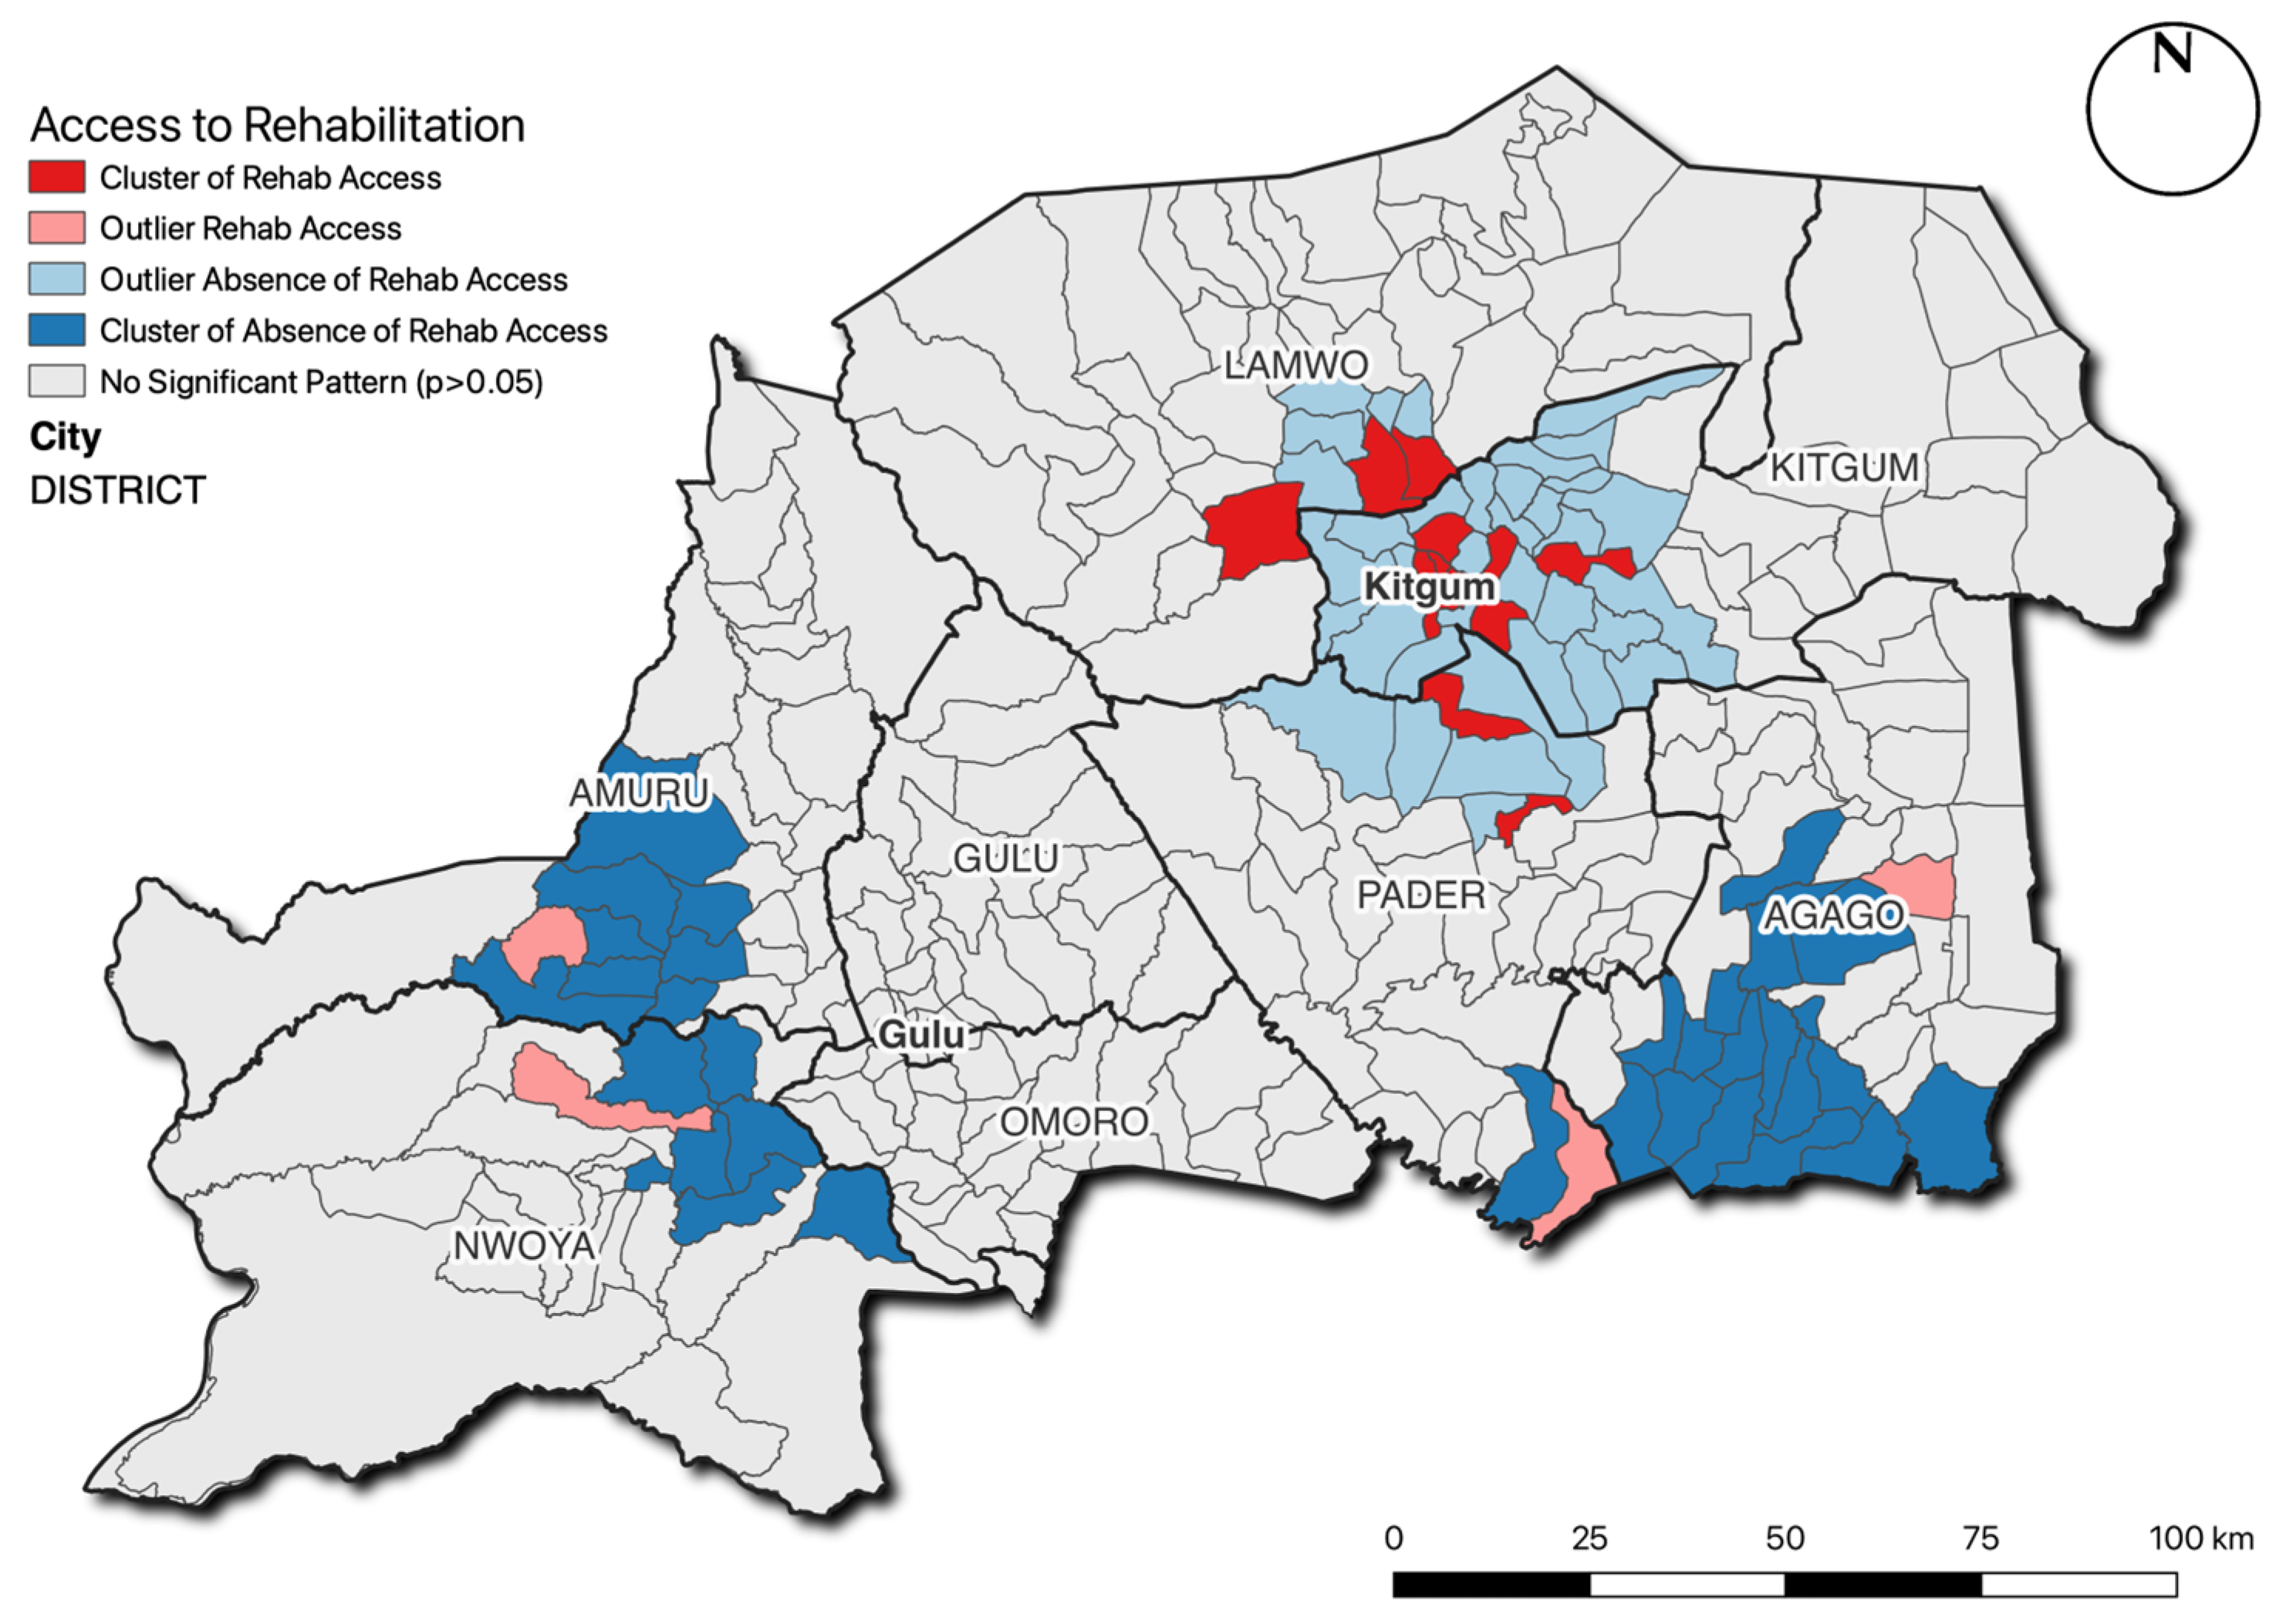
Figure 4, which demonstrates a significant cluster of those who have received rehabilitative services in the immediate vicinity of Kitgum, where centralised NGO activities were concentrated in the immediate post-war period, and significant concentrations of people who have not been able to access these services further away from this location.
As a demonstration of one such alternative service delivery model, the authors have set up an outreach prosthetic limb service operating from Gulu Referral Hospital to demonstrate the potential of such an alternative service delivery model. This outreach service was modelled on a similar approach adopted in post-war Sri Lanka [29], and seeks to deliver prosthetic limb services at open clinics held in local community centres. This is important, as this approach does not require individuals to travel to the clinic and is therefore much more accessible. People with MLL attending the clinic are assessed by a suitably qualified practitioner free of charge, and those with suitable healthy stumps receive bespoke prosthetic limbs and rehabilitative care free of charge at a location close to their homes. In 2019, this outreach service successfully provided 52 prosthetic limbs to 51 patients (one bilateral). Further evaluation of this and other models of service delivery are urgently needed to evaluate their potential to address these challenges, both in terms of efficiency and acceptance by the local population.

4.1. Study Limitations

There are a number of assumptions that had to be made in this research, chief amongst which was the estimate of the population size of the Acholi sub-region, which is a prediction based upon expected population growth from the 2014 census of household population [13], and official refugee numbers [14], both of which are expected to be significant underestimates, and also exclude those living in institutions (e.g., prisons), forest reserves, barracks and other non-household settings [12]. Further, the 2014 census was based on a sampling (rather than comprehensive) survey, introducing unknown levels of uncertainty in the resulting population figures. This uncertainty is compounded by the difficulty in predicting population change since 2014 due to the extremely rapid population growth and frequent movement of people (including refugees) both into and out of Uganda across adjacent international borders.
In our spatial analysis (Moran’s I, LISA), there are inevitable edge effects arising from the bounds of the study region (normally manifest in the identification of ‘false hotspots’ at the edges of the study region). Our approach of the use of distance-weighting between zone centroids (as opposed to the more ‘traditional’ adjacency-based approaches) mitigates this effect by increasing the number of ‘neighbours’ that are taken into account for each zone. Nevertheless, it is possible that changes in the extent of the study region (e.g., through an adjustment to Ugandan administrative boundaries) could impact the results of our spatial analysis. For example, increasing the extent of our analysis might have revealed clusters that span the edges of our current area of interest. This effect (the Modifiable Areal Unit Problem) is well understood in the spatial analysis [30], and though the problem is unavoidable, it nevertheless warrants consideration.
The expected distributions for gender and educational levels were based upon data for the Acholi Sub-Region, taken from the 2014 census. We must assume that these distributions (rather than individual values) have not changed significantly in the 4 years between the publication of the census and the data collection, and we are reliant upon the quality of the census data. The expected distribution of ages was based upon the UBOS Mid-Year Population Projection for 2018, which is a modelled extrapolation from the 2014 census. This is a national dataset (values are not given at regional, sub-regional or district level), and so we must assume that the underlying model is robust, and that the population distribution of the Acholi sub-region is not significantly different to the national population distribution. The risks associated with all three of these expected distributions are mitigated somewhat by the vanishingly small probabilities of the values in our sample being drawn from the expected distributions.
The HRSL dataset [19] that we used in the cluster sampling process describes estimated population density, rather than individual buildings. There is also a possibility that this dataset might perform less well in rural than urban settings (as there are fewer buildings available in a more-sparse distribution, which can make less-populated areas harder to detect). However, two ‘on the ground’ validation surveys of the area by the authors, as well as visual validation against high-resolution satellite imagery, showed that population patterns in the dataset correlate well with the location of buildings and huts in rural areas. Nevertheless, more detailed maps and population data would permit more precise population estimates to be undertaken and increase the robustness of the sampling strategy [17].
An error made by some of the trained researchers during data collection meant that precise locations were only collected correctly for 57 of the 181 people with MLL that were interviewed. This was addressed by aggregating people with MLL to the parish level, for which data were available for 167 people with MLL. Given the relatively small size of the parishes in comparison with the study area, their centroids provide a reasonable proxy location for sample locations, meaning that this has had only a minor impact on the analysis of distance distribution and does not affect the quality of the results. One consideration here would be that this approach would overlook significant intra-parish clusters, but the small number of cases per parish makes this unlikely, and there is no way of resolving this with the available dataset.

4.2. Implications of the Findings

The physical and mental wellbeing of people living in parts of the world that are recovering from prolonged conflict is receiving increasing attention [31,32]. It is known that people with major disabilities are prone to developing a wide range of secondary health problems because of chronic inactivity, social isolation, unemployment, discrimination and marginalisation. For example, a study of landmine victims in northern Sri Lanka showed that a large proportion of victims lost their earning capacity as a result of their injuries [33]. Furthermore, the prevalence of post-traumatic stress disorder, acute stress reaction, anxiety disorders and depression amongst the victims were significantly greater than in the general population living in the affected areas [33]. These residual issues, attributable to the direct or indirect consequences of the conflict, have a serious impact on quality of life, social cohesiveness, productivity and wellbeing and can contribute to the development of recurrent cycles of violence and poverty. This research has demonstrated how a prevalence study can be undertaken in data-poor regions, and the methods for undertaking such a study in data-poor areas (as well as the outreach clinic model) would be easily transferrable to other settings.
The new insights into MLL and disability provided by this research are vitally important, as a better understanding of the prevalence and nature of MLL will, for the first time, provide an evidence base against which medical care and rehabilitation services can be provided to those with MLL in the Acholi sub-region. We have also identified that 8.2% of the population (c. 150,512 people) in this region currently live with other forms of major physical disabilities, which may have a major impact on their life chances and quality of life. These findings reinforce the need for greater focus on developing rehabilitation services to meet the needs of the population. War, as anticipated, has been a major cause of MLL in the region, but several other significant causes of MLL have been identified, which cumulatively account for around half of cases, and notably include road traffic accidents and chronic disease. This is critically important in understanding changing service provision needs in this region, as many NGOs currently providing these services provide support only to those who lost limbs as a result of the war; meaning that approximately half of the population of people with MLL will have no access to rehabilitation services (including prosthetic devices) whatsoever.
The preponderance of lower limb loss over upper limb amputations from combat areas has been reported previously. For example, Bendinelli reported that almost 50% of civilian adults who sustained blast injuries in Cambodia had lower limb injuries [34]. As a result, most prosthetic limb services in post-conflict LMICs (including Cambodia, Uganda and Sri Lanka) have focused on lower limb prostheses. Our study revealed that approximately 39% of those with MLL had lost upper limbs, with c. 2% having lost both upper and lower limbs. Blast injuries from the ground upwards are likely to affect lower limbs more than upper limbs, but amputation of both upper and lower limbs was a widely practised punishment by the LRA [3], which (along with gunshot wounds) is likely to account for this relatively high proportion of upper limb loss in our study population. The question of rehabilitation for these upper limb amputees is compounded by the absence of any upper limb prosthetic limb services in the Acholi sub-region, and further research is required into how these services might be best provided in global contexts such as northern Uganda [35,36].

5. Conclusions

The significant health and wellbeing benefits associated with the provision of a suitable prosthesis for people with MLL are widely understood [5,6], but access to such services is extremely limited in the Acholi sub-region. Part of the reason for this is the low priority given to chronic health needs by the Ugandan Government [7], meaning that even the level of need for such services is poorly understood. This research, therefore, provides the first detailed study of MLL in the Acholi sub-region, clearly articulating the prevalence, causes and spatial distribution of MLL in the region. These findings reveal a substantial need for rehabilitative service provision that is not currently being met, with our conservative estimates suggesting that c. 0.5% of the population are living with MLL, and c. 47% have never accessed any rehabilitative services whatsoever. Our findings also demonstrate the spatial pattern of the requirement for these services, which suggests that those with MLL are dispersed throughout the region rather than concentrated in population centres, a situation that is not reflected in the centralised service models that are currently used both in Acholi and elsewhere in the country. High levels of poverty and low levels of mobility mean that extensive spatial coverage is required in order to ensure accessibility, and we have demonstrated the efficacy of such a service, which has successfully provided services (including prosthetic limbs) to over 50 people using an outreach-based model.
This study provides a new understanding of the requirement for rehabilitative services in the region and, in doing so, sets an agenda for how these needs can be met through action by researchers, NGOs and government. Further studies are now required to evaluate the acceptability, suitability and cost-effectiveness of approaches, such as outreach rehabilitation services, in order to support their adoption both in Acholi and other post-conflict settings. Further research is also required to examine how those with upper-limb loss might be best supported, as the prevalence of upper limb loss was found to be much higher than expected (c. 39%), yet there is no provision at all for upper limb prosthetic services whatsoever. Further research should also include the application of the methods presented here to other data-scarce regions where the prevalence of MLL, disability and other conditions remain poorly understood. Extant NGOs providing services elsewhere should broaden their remit to remove focus solely from those who experienced MLL due to war and adapt their operations to reflect the spatial patterns of demand that have been revealed in this study.
Finally, the Ugandan Government must use the evidence presented here to increase the priority given to a range of chronic health needs in policy, including MLL and other conditions (e.g., diabetes) that are increasingly contributing to avoidable cases of MLL. Investment is urgently needed in the development of robust, integrated and sustainable rehabilitative services in Acholi, supported by NGOs where appropriate. These services must be designed to reflect the magnitude and spatial patterns of demand that have been identified here, and a robust and efficient referral system put into place in order to increase accessibility for all of those with MLL across Acholi and other regions of Uganda.

Supplementary Materials

The following supporting information can be downloaded at: https://www.mdpi.com/article/10.3390/prosthesis4030030/s1, File S1: Semi Structured Questionnaire for Household Head; File S2: Semi-Structured Questionnaire for a Person With Major Limb Loss.

Author Contributions

Conceptualisation, M.N., E.B.M., J.J.H. and P.A.; methodology, J.J.H. and P.A.; software, J.J.H.; validation, J.J.H. and P.A.; formal analysis, J.J.H. and P.A.; investigation, P.A. and J.J.H.; data curation, J.J.H. and P.A.; writing—original draft preparation, J.J.H.; writing—review and editing, P.A., M.N. and E.B.M.; visualisation, J.J.H.; supervision: E.B.M. and M.N.; funding acquisition, M.N., E.B.M. and J.J.H. All authors have read and agreed to the published version of the manuscript.

Funding

This research was funded by the AHRC/MRC GCRF Global Public Health Scheme, grant number AH/R005796/1.

Institutional Review Board Statement

The study was conducted in accordance with the Declaration of Helsinki and approved by the Institutional Ethics Committee of The University of Manchester (2017-2624-3985); the Institutional Ethics Committee of Gulu University (GUREC-033-18); and the Uganda National Council for Science and Technology (SS4817).

Informed Consent Statement

Informed consent was obtained from all subjects involved in the study.

Data Availability Statement

Data, along with the scripts used to analyse them, are available at https://github.com/jonnyhuck/mll-analysis (accessed on 15 July 2022).

Acknowledgments

We thank the Ministry of Health (Uganda) for granting permission to use the health facilities for this study and the district authorities of the 8 Districts and their respective District Health Teams for their support. We would like to thank the Community Mapping (https://communitymapping.org, accessed on 15 July 2022) volunteers in both the UK and Uganda for their continued dedication to mapping the region. The analysis presented here relies upon several Open Source Python libraries, notably SciPy (https://www.scipy.org, accessed on 15 July 2022) and PySAL (https://pysal.org, accessed on 15 July 2022). Finally, we thank the Acholi People for their kindness, generosity and friendship.

Conflicts of Interest

The authors declare no conflict of interest. The funders had no role in the design of the study; in the collection, analyses or interpretation of data; in the writing of the manuscript, or in the decision to publish the results.

References

  1. Apuuli, K.P. The ICC Arrest Warrants for the Lord’s Resistance Army Leaders and Peace Prospects for Northern Uganda. J. Int. Crim. Justice 2006, 4, 179–187. [Google Scholar] [CrossRef]
  2. Van Acker, F. Uganda and the Lord’s Resistance Army: The new order no one ordered. Afr. Aff. 2004, 103, 335–357. [Google Scholar] [CrossRef]
  3. Vinci, A. The Strategic Use of Fear by the Lord’s Resistance Army. Small Wars Insur. 2005, 16, 360–381. [Google Scholar] [CrossRef]
  4. International Crisis Group. Northern Uganda: Understanding and Solving the Conflict. 2004. Available online: https://repositories.lib.utexas.edu/bitstream/handle/2152/4382/3482.pdf?sequence=1 (accessed on 29 June 2020).
  5. Gailey, R.; McFarland, L.V.; Cooper, R.A.; Czerniecki, J.; Gambel, J.M.; Hubbard, S.; Maynard, C.; Smith, D.G.; Raya, M.; Reiber, G.E. Unilateral lower-limb loss: Prosthetic device use and functional outcomes in servicemembers from Vietnam war and OIF/OEF conflicts. J. Rehabil. Res. Dev. 2010, 47, 317–332. [Google Scholar] [CrossRef] [PubMed]
  6. Osmani-Vllasolli, T.; Hundozi, H.; Orovcanec, N.; Krasniqi, B.; Murtezani, A. Rehabilitation outcome following war-related transtibial amputation in Kosovo. Prosthet. Orthot. Int. 2014, 38, 211–217. [Google Scholar] [CrossRef]
  7. Ministry of Health. Health Sector Development Plan 2015/16–2019/20; Government of Uganda Ministry of Health: Kampala, Uganda, 2015.
  8. Abimanyi-Ochom, J.; Mannan, H. Uganda’s Disability Journey: Progress and Challenges. Afr. J. Disabil. 2014, 3. [Google Scholar] [CrossRef]
  9. Lang, R.; Murangira, A. Disability Scoping Study for DFID Uganda; University College: London, UK, 2009. [Google Scholar]
  10. Okello, T.R.; Magada, S.M.; Atim, P.; Ezati, D.; Campion, A.; Moro, E.B.; Huck, J.; Byrne, G.; Redmond, A.; Nirmalan, M. Major limb loss (MLL): An overview of etiology, outcomes, experiences and challenges faced by amputees and service providers in the post-conflict period in Northern Uganda. J. Glob. Health Rep. 2019, 3, e2019028. [Google Scholar]
  11. Ephraim, P.L.; Dillingham, T.R.; Sector, M.; Pezzin, L.E.; MacKenzie, E.J. Epidemiology of limb loss and congenital limb deficiency: A review of the literature. Arch. Phys. Med. Rehabil. 2003, 84, 747–761. [Google Scholar] [CrossRef]
  12. UBOS. National Population and Housing Census 2014—Main Report; Ugandan Bureau of Statistics: Kampala, Uganda, 2016.
  13. City Population. Uganda: Administrative Division (Regions and Districts). Population Statistics, Chart and Map 2020. Available online: https://www.citypopulation.de/en/uganda/admin/ (accessed on 22 April 2021).
  14. UNHCR. Uganda Comprehensive Refugee Response Portal. 2021. Available online: https://data2.unhcr.org/en/country/uga (accessed on 22 April 2021).
  15. Pourhoseingholi, M.A.; Vahedi, M.; Rahimzadeh, M. Sample Size Calculation in Medical Studies. Gastroenterol. Hepatol. Bed Bench 2013, 6, 14–17. [Google Scholar]
  16. UBOS. Uganda National Household Survey 2016/17 Report; Ugandan Bureau of Statistics: Kampala, Uganda, 2018.
  17. Huck, J.J.; Perkins, C.; Haworth, B.T.; Moro, E.B.; Nirmalan, M. Centaur VGI: A Hybrid Human–Machine Approach to Address Global Inequalities in Map Coverage. Ann. Am. Assoc. Geogr. 2020, 111, 231–251. [Google Scholar] [CrossRef]
  18. Watkinson, K.; Huck, J.J.; Harris, A. Centaur VGI: An Evaluation of Engagement, Speed, and Quality in Hybrid Humanitarian Mapping. Ann. Am. Assoc. Geogr. 2022. [Google Scholar] [CrossRef]
  19. Facebook. High Resolution Population density Maps. 2019. Available online: https://data.humdata.org/dataset/highresolutionpopulationdensitymaps (accessed on 29 June 2020).
  20. Facebook. Mapping the World to Help Aid Workers, with Weakly, Semi-Supervised Learning. 2019. Available online: https://ai.facebook.com/blog/mapping-the-world-to-help-aid-workers-with-weakly-semi-supervised-learning (accessed on 29 June 2020).
  21. Tiecke, T. Open population datasets and open challenges. 2016. Available online: https://engineering.fb.com/connectivity/open-population-datasets-and-open-challenges/ (accessed on 29 June 2020).
  22. Huck, J.J. mll-Cluster-Selection. 2019. Available online: https://github.com/jonnyhuck/mll-cluster-selection (accessed on 29 June 2020).
  23. QGIS. QGIS: A Free and Open Source Geographic Information System 2020. Available online: https://qgis.org/en/site/ (accessed on 29 June 2020).
  24. UBOS. 2014 Census Data. 2020. Available online: http://catalog.data.ug/dataset/2014-census-data (accessed on 29 June 2020).
  25. UBOS. Statistical Datasets: National Mid Year Population Projections by Single Age (2015–2050). 2020. Available online: https://www.ubos.org/explore-statistics/statistical-datasets/6133/ (accessed on 29 June 2020).
  26. Moran, P.A. Notes on continuous stochastic phenomena. Biometrika 1950, 37, 17–23. [Google Scholar] [CrossRef]
  27. Assuncao, R.M.; Reis, E.A. A new proposal to adjust Moran’s I for population density. Stat. Med. 1999, 18, 2147–2162. [Google Scholar] [CrossRef]
  28. Anselin, L. Local indicators of spatial association—LISA. Geogr. Anal. 1995, 27, 93–115. [Google Scholar] [CrossRef]
  29. The Meththa Foundation—UK: A Humanitarian Service for Sri Lankan People with Physical Disabilities. 2020. Available online: http://www.meththafoundation.org.uk/ (accessed on 29 June 2020).
  30. Openshaw, S.; Taylor, P.J. The Modifiable Areal Unit Problem. In Quantitative Geography: A British View; Routledge and Kegan Paul: London, UK, 1981; pp. 60–69. [Google Scholar]
  31. Ayazi, T.; Lien, L.; Eide, A.H.; Jenkins, R.; Albino, R.A.; Hauff, E. Disability associated with exposure to traumatic events: Results from a cross-sectional community survey in South Sudan. BMC Public Health 2013, 13, 469. [Google Scholar] [CrossRef] [PubMed] [Green Version]
  32. Ghobarah, H.A.; Huth, P.; Russett, B. The post-war public health effects of civil conflict. Soc. Sci. Med. 2004, 59, 869–884. [Google Scholar] [CrossRef]
  33. Gunaratnam, H.R.; Gunaratnam, S.; Somasundaram, D. The psychosocial effects of landmines in Jaffna. Med. Confl. Surviv. 2003, 19, 223–234. [Google Scholar] [CrossRef] [PubMed]
  34. Bendinelli, C. Effects of land mines and unexploded ordnance on the pediatric population and comparison with adults in rural Cambodia. World J. Surg. 2009, 33, 1070. [Google Scholar] [CrossRef] [PubMed]
  35. Kenney, L.; Ssekitoleko, R.; Chadwell, A.E.A.; Donovan-Hall, M.; Morgado Ramirez, D.; Holloway, C.; Graham, P.; Cockroft, A.; Deere, B.; McCormack, S.; et al. Prosthetics Services in Uganda: A Series of Studies to Inform the Design of a Low Cost, but Fit-for-Purpose, Body-Powered Prosthesis; World Health Organisation: Geneva, Switzerland, 2019. [Google Scholar]
  36. Ramirez, D.Z.M.; Nakandi, B.; Ssekitoleko, R.; Ackers, L.; Mwaka, E.; Kenney, L.; Holloway, C.; Donovan-Hall, M. The lived experience of people with upper limb absence living in Uganda: A qualitative study. Afr. J. Disabil. 2022, 11, 1–13. [Google Scholar]
Figure 1. The locations of the 8000 sample locations, with an indication of the straight-line distance to the Gulu Referral Orthopaedic Clinic.
Prosthesis 04 00030 g001
Figure 2. The frequencies of the causes of MLL in the Acholi sub-region.
Prosthesis 04 00030 g002
Figure 3. Comparison of the observed and expected distribution of (a) gender, (b) education and (c) age for those with MLL in the Acholi sub-region.
Prosthesis 04 00030 g003aProsthesis 04 00030 g003b
Figure 4. Map of clusters and outliers of people with MLL who have had access to rehabilitative services identified using the rate-adjusted Local Moran’s I (LISA) analysis. This clearly shows a significant cluster around Kitgum, which was the area of greatest activity from both the LRA and NGOs during the conflict.
Prosthesis 04 00030 g004
Publisher’s Note: MDPI stays neutral with regard to jurisdictional claims in published maps and institutional affiliations.

