1. Introduction
Gait analysis is a valuable tool for assessing various pathologies. Deviations from a healthy gait template often indicate underlying health conditions. For people with amputations, an accurate gait assessment leads to the development of more efficient prosthetic devices and better evaluation of clinical outcomes. That is why more and more clinics are using technology-enabled gait analysis solutions as opposed to traditional visual gait analysis.
A prerequisite to effective gait assessment is the estimation of key gait events of heel strike (HS) and toe-off (TO), which represent the moment the foot is placed and removed from the ground, respectively [
1]. Traditionally, these are estimated using the force or pressure data from specialized platforms in research laboratories. However, due to high cost and space constraints, this method is not used widely in clinics. Instead, kinematics-based solutions are becoming popular due to the possibility of body-worn inertial sensors. These methods rely on leg or foot velocity/acceleration data and rule-based algorithms to estimate gait events. Many authors have validated this approach for TO and HS detection for healthy subjects [
2,
3,
4,
5,
6,
7,
8,
9,
10,
11] as well as for subjects with walking disorders [
12,
13,
14,
15,
16]. However, its validity for the amputee population is not well established in the literature.
The kinematic methods require an algorithm to identify observable features in the velocity or acceleration data of body segments. Several rule-based algorithms have also been developed for this purpose. A popular choice is to use the shank angular velocity for TO and HS estimation corresponding to the minima in the sagittal-plane angular velocity signal [
17]. Many researchers have exploited this signal over the years for diverse subject populations and reported a reasonable degree of accuracy [
2,
3,
7,
14,
18,
19,
20,
21,
22].
However, no study has focused on amputee subjects except [
20] which included data from a single subject. Since lower-body amputations lead to gait deviations and compensatory movements, there is a need to evaluate this paradigm with a large data set of persons with amputations. Hence, the goal of this study is to compare the accuracy of gait event prediction using the shank angular velocity against force platform data. A secondary objective is to observe if this accuracy is affected by parameters such as leg side (sound or prosthetic), subjects’ walking ability, and walking speed. A published data set of amputee subjects by Hood et al. [
23] is employed for this purpose, containing optoelectronic and force plate data for transfemoral amputees.
2. Materials and Methods
A data set consisting of marker and force plate data of 18 individuals with unilateral transfemoral amputation was recently published [
23]. It is the most comprehensive gait data set available for prosthesis users which provides force platform data for all steps taken during a trial. Moreover, the walking speed was controlled accurately on a treadmill, as opposed to subjective instructions to walk ‘slow’ or ‘fast’.
Subjects were divided into two groups based on their comfortable walking speed and reliance on the handrails. They were categorized as either K-level 2 or K-level 3 on the Medicare functional classification level (MFCL) [
24]. If a subject required the assistance of handrails for any speed above 0.8 m/s or their maximum walking speed was 0.8 m/s, they were assigned to the K2 group. This group of subjects walked at five different speeds of [0.4, 0.5, 0.6, 0.7, 0.8 m/s]. Likewise, if subjects could walk at speeds of up to 1.2 m/s without using handrails, they were assigned to the K3 group, and they walked at the speeds of [0.6, 0.8, 1.0, 1.2, 1.4 m/s]. More details on the protocol and data acquisition are available in [
23].
The original study contained an equal number of subjects in both groups. However, for this study, subjects using the handrails during walking were excluded to avoid the effect of secondary support on the gait pattern. This resulted in having ten subjects for further analysis (including three K-level 2 and seven K-level 3 subjects). These subjects are listed in
Table 1.
The data set reported four to five walking trials per speed resulting in a total of 246 walking trials for the ten subjects. However, after careful observation of the force platform and marker profiles, some trials were discarded due to either incomplete or erroneous data. This resulted in a total of 239 trials for the final analysis. A trial typically consisted of 12 to 14 walking cycles.
2.1. Estimation of Leg Velocity Signal from Marker Data
The raw data consisted of three-dimensional trajectories of 61 cutaneous reflective markers. The data contained the .c3d files for the marker trajectories which were extracted using an open-source motion analyzer software MOKKA (Motion Kinematic and Kinetic Analyzer [
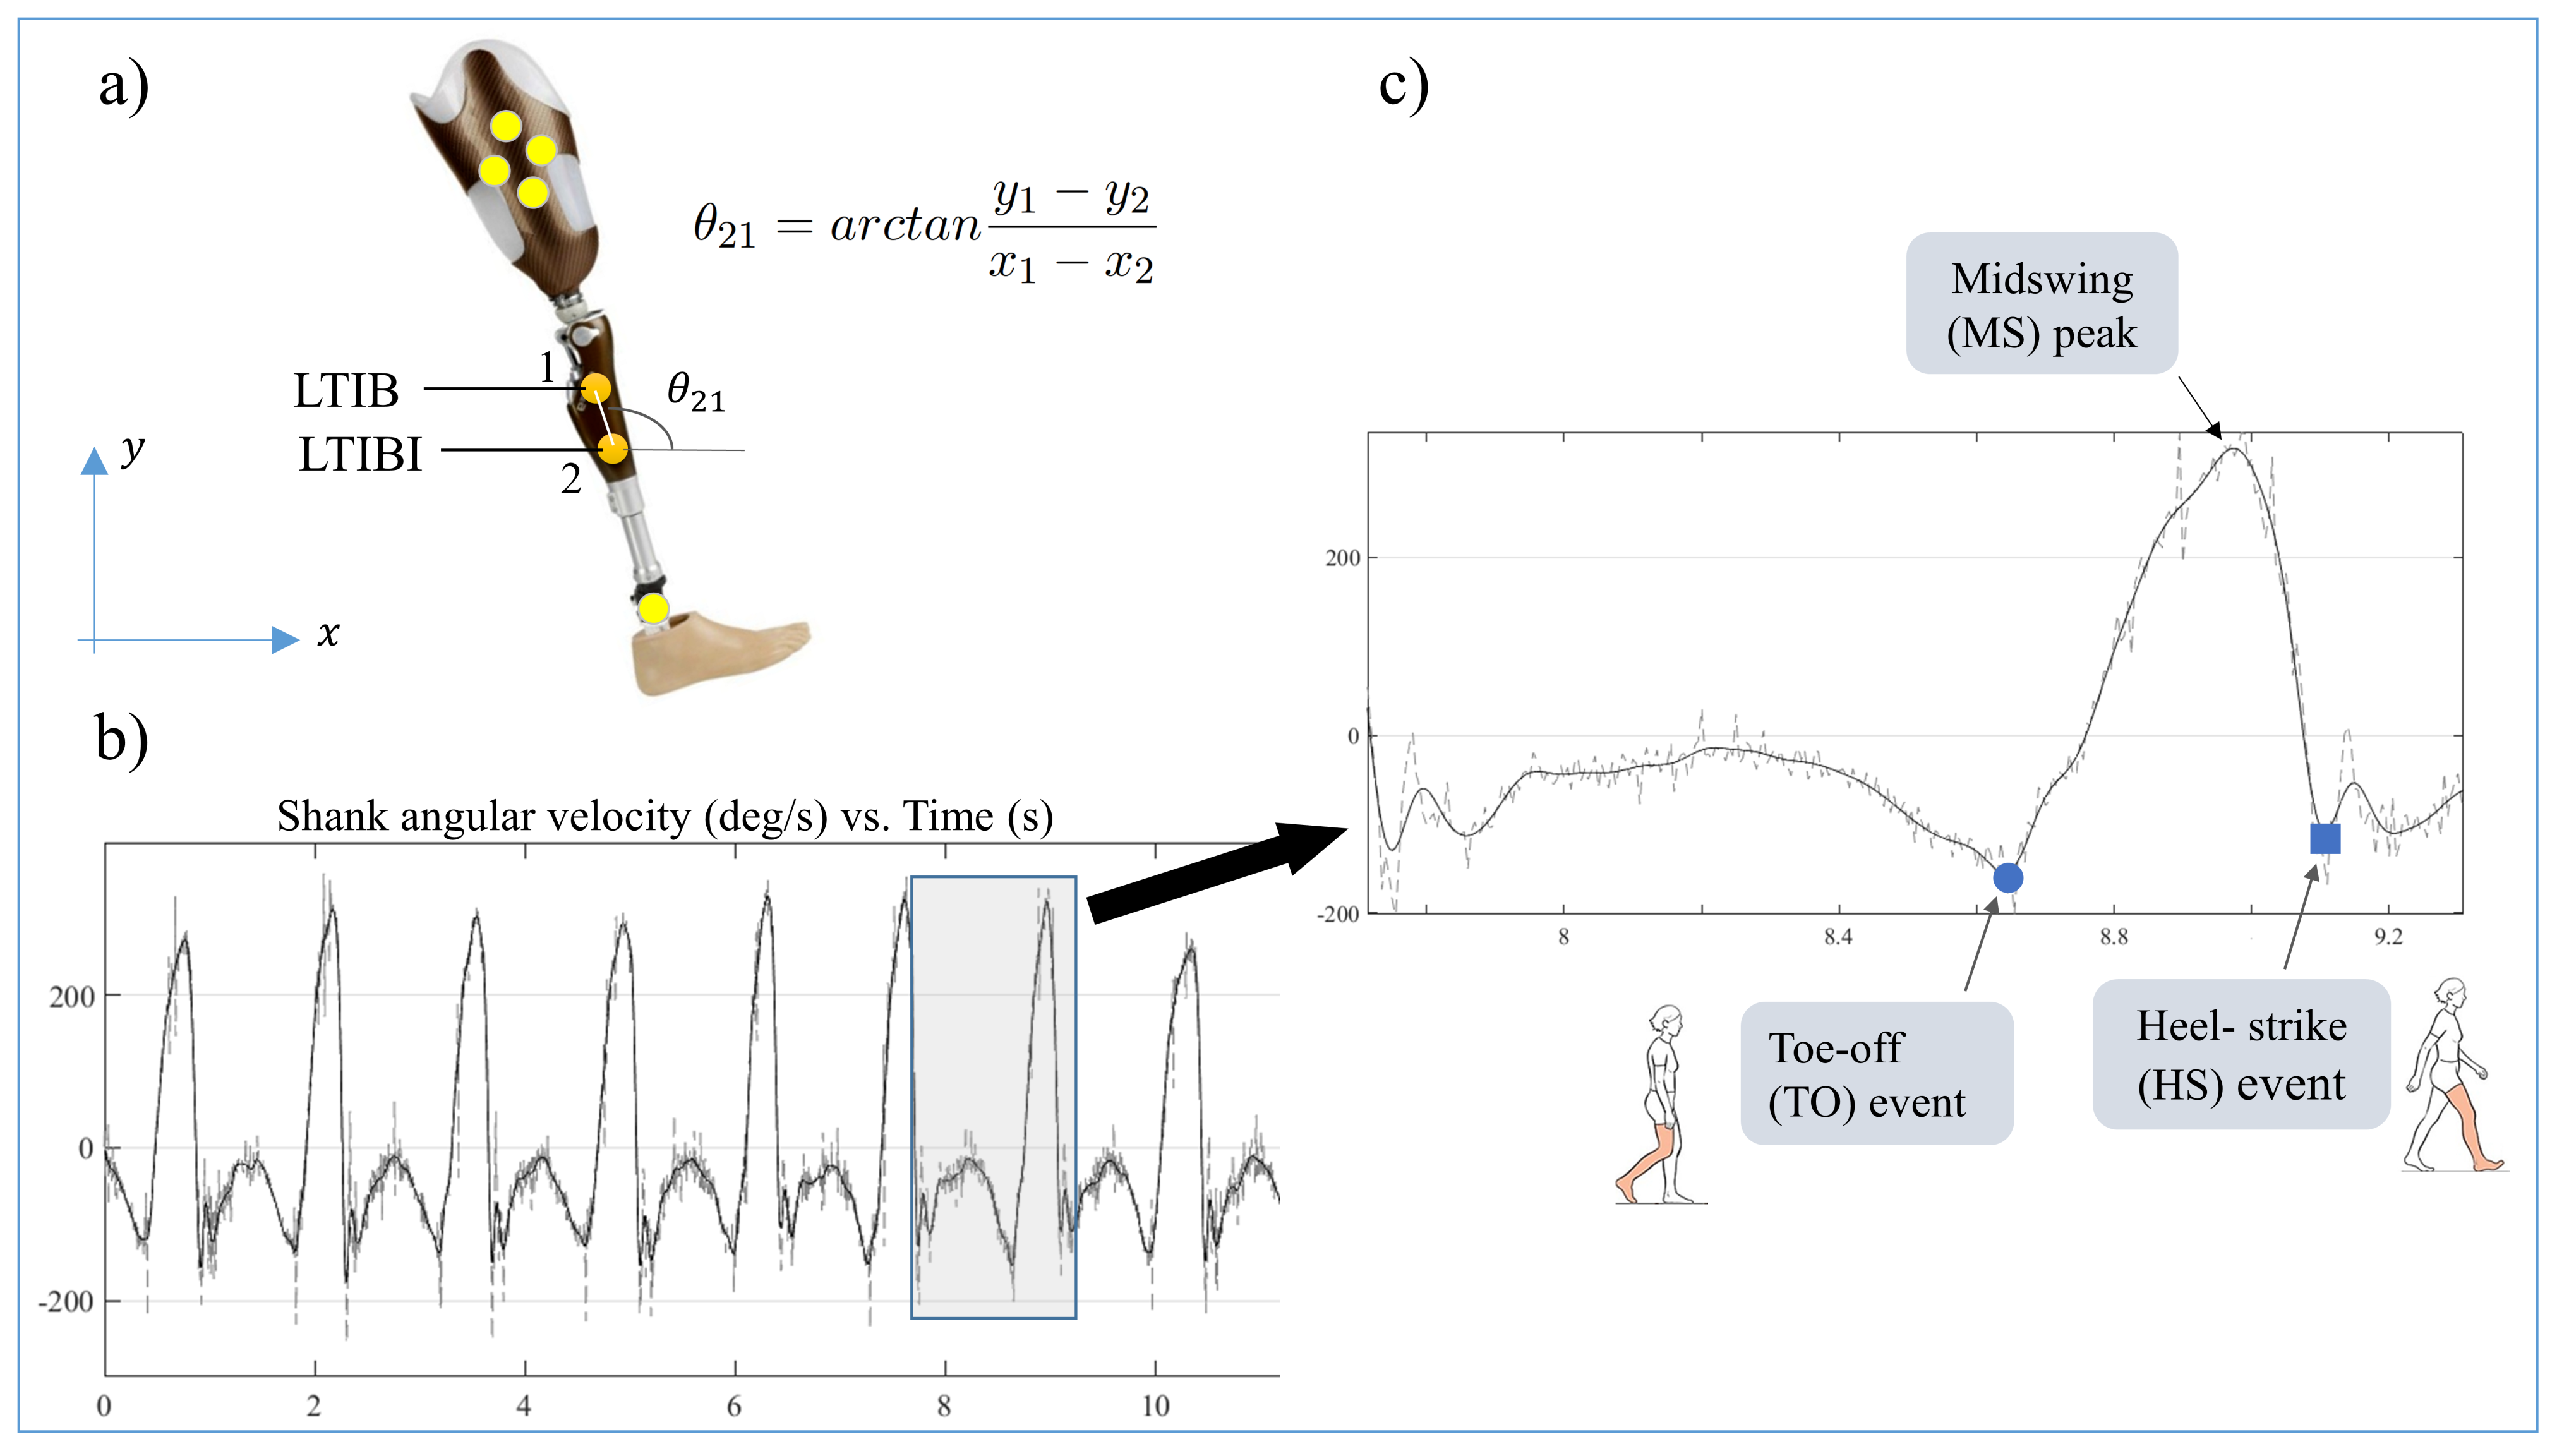
25]). For each trial, the data were exported into a .csv file and read in Matlab for the calculation of lower-leg angular velocities from the coordinates of tibia markers. Two tibia markers on each leg (
Figure 1) were used to estimate leg orientation using the method presented in [
26]. The method uses two markers in line with the bone axis to calculate the orientation of the segment, which is further differentiated with respect to time to obtain the angular velocity.
The raw marker data were collected at 200 Hz and are subject to a lot of noise due to soft tissue artifacts. To reduce the noise in the resulting angular velocity signal, a low-pass filter was designed and implemented. For this purpose, the frequency spectrum and the Nyquist frequency of the signal for all subjects were analyzed. A cut-off frequency of 4 Hz was chosen, which resulted in negligible loss of data and time shift of the signal. An example of the filtering is shown in
Figure 1 (right panel) for a trial at 1.2 m·s
−1.
2.2. Algorithm
The determination of TO and HS events in the velocity signal is based on the dual-minima approach similar to the one presented by [
22]. It starts with the detection of all the positive peaks of the signal. These positive peaks are associated with the midswing (MS) (c.f.
Figure 1). Each positive peak is accompanied by two negative peaks (or minima) on either side, which indicate the reversal of leg velocity direction. The negative peak (NP) preceding the MS is identified as the toe-off event, while the NP after the MS is marked as heel strike.
Unlike the previous implementations [
2,
3,
14,
17], our algorithm runs on the complete walking trial at once, while automatically deducing the peak threshold value. The threshold is calculated by taking the absolute mean of the complete velocity data in the trial, eliminating the need for any manual adjustment for different speeds or subjects. Moreover, the algorithm does not use any restraining time windows where the events must occur, reducing its computational cost. The algorithm is implemented in Matlab.
2.3. Statistical Analysis
For each walking cycle, the timings for the TO and HS events obtained by this algorithm are compared against the force platform-based timings provided in the data set. The errors (eTO, eHS) are calculated by taking the difference between the corresponding predicted and actual events.
where the actual events refer to the ones marked using the force platform. The error is positive when the predicted event precedes the actual event and vice versa.
Shapiro–Wilk test and visual inspection of histograms indicated that the error distribution was not normal. Hence, a 5-number summary statistic (involving the median, lower and upper quartiles, minimum and maximum values) was selected for further descriptive analysis. Nonparametric statistical tests of significance were performed (at p = 0.05 level) for group differences.
Descriptive statistics of mean error (ME) and mean absolute error (MAE) were also computed to compare the results of this study with the literature which frequently reports these averages.
3. Results
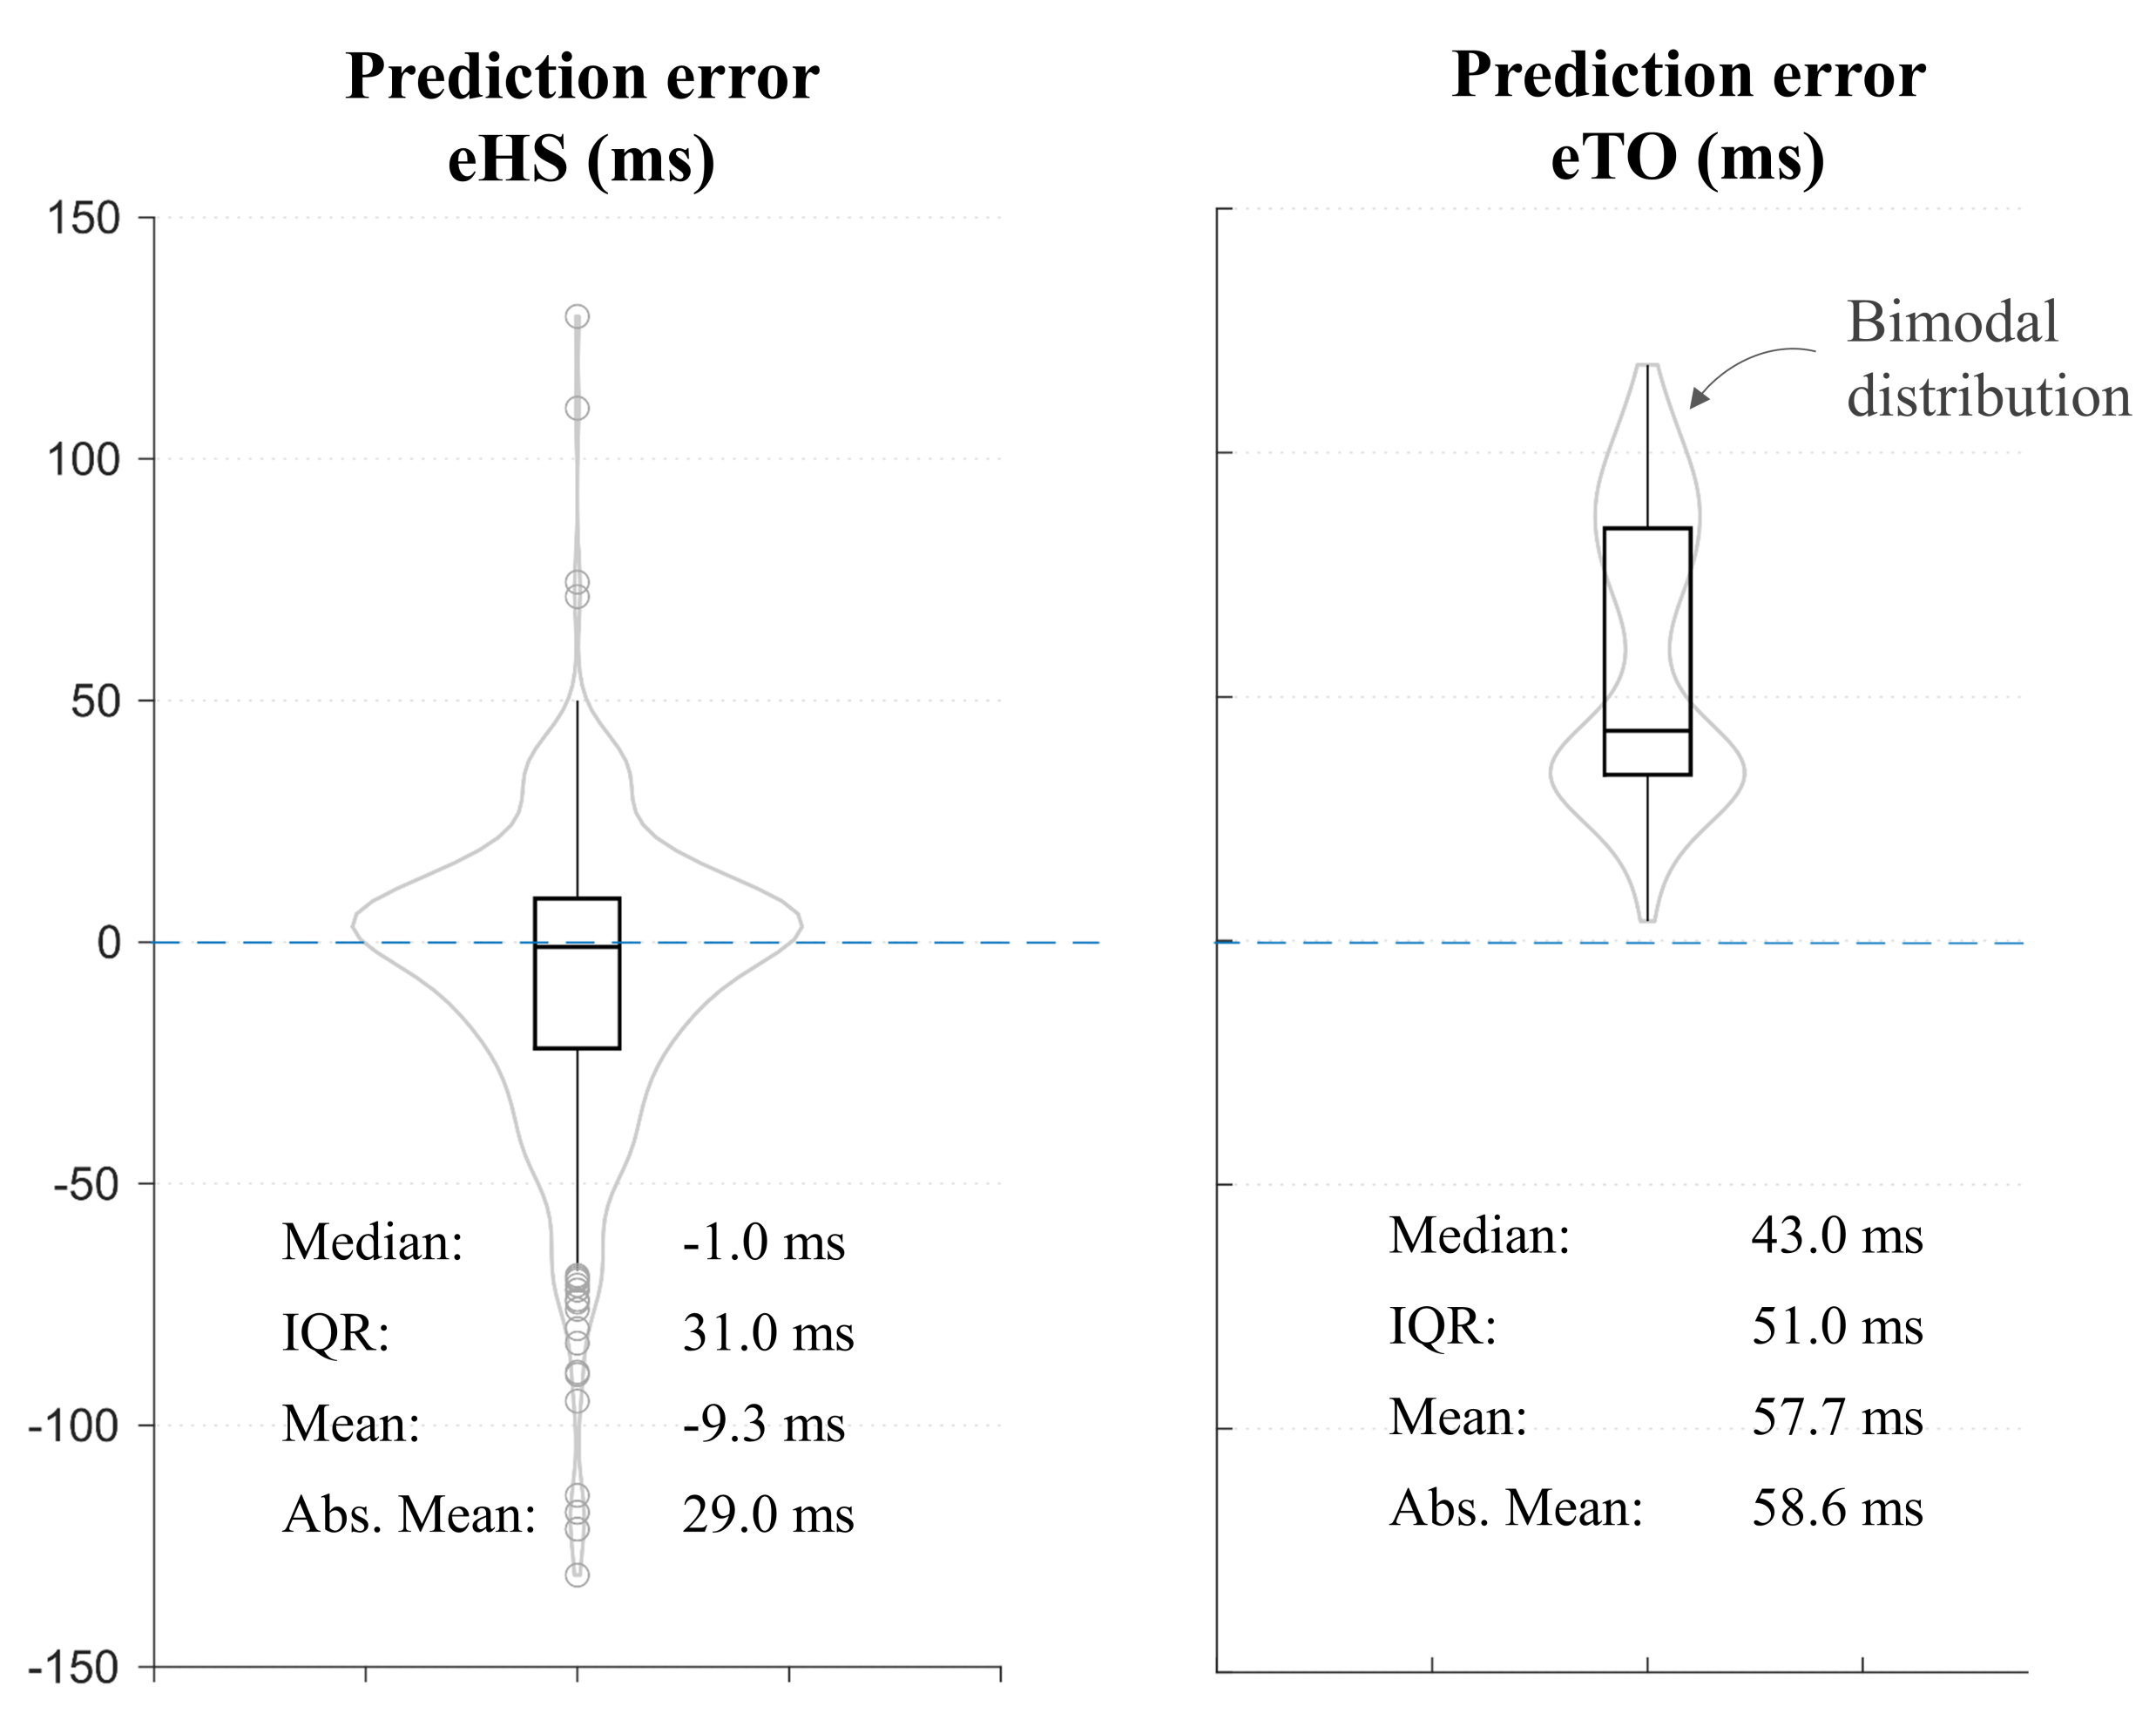
TO and HS events for a total of 2595 walking cycles from 239 trials were compared. Results are summarized in
Figure 2. The median heel strike error (eHS) was −1 ms with an interquartile range (IQR) of 31 ms. The box extended both above and below the median, indicating the predictions to be early or late than the actual event. On the other hand, the median toe-off error (eTO), as well as the IQR, were larger (43 ms and 51 ms respectively). The error is positive in all the cases indicating consistent early detection by the algorithm for TO. The mean absolute values shown at the bottom of the plot indicate that the magnitude of eHS was half of that of eTO, indicating a better HS estimation.
The accompanying violin plots (in grey) show the distribution of error values for both events. Interestingly, the distribution is bimodal in nature for the eTO with two local maxima. This indicates a dichotomy of results into two groups.
3.1. Difference by the Leg Side
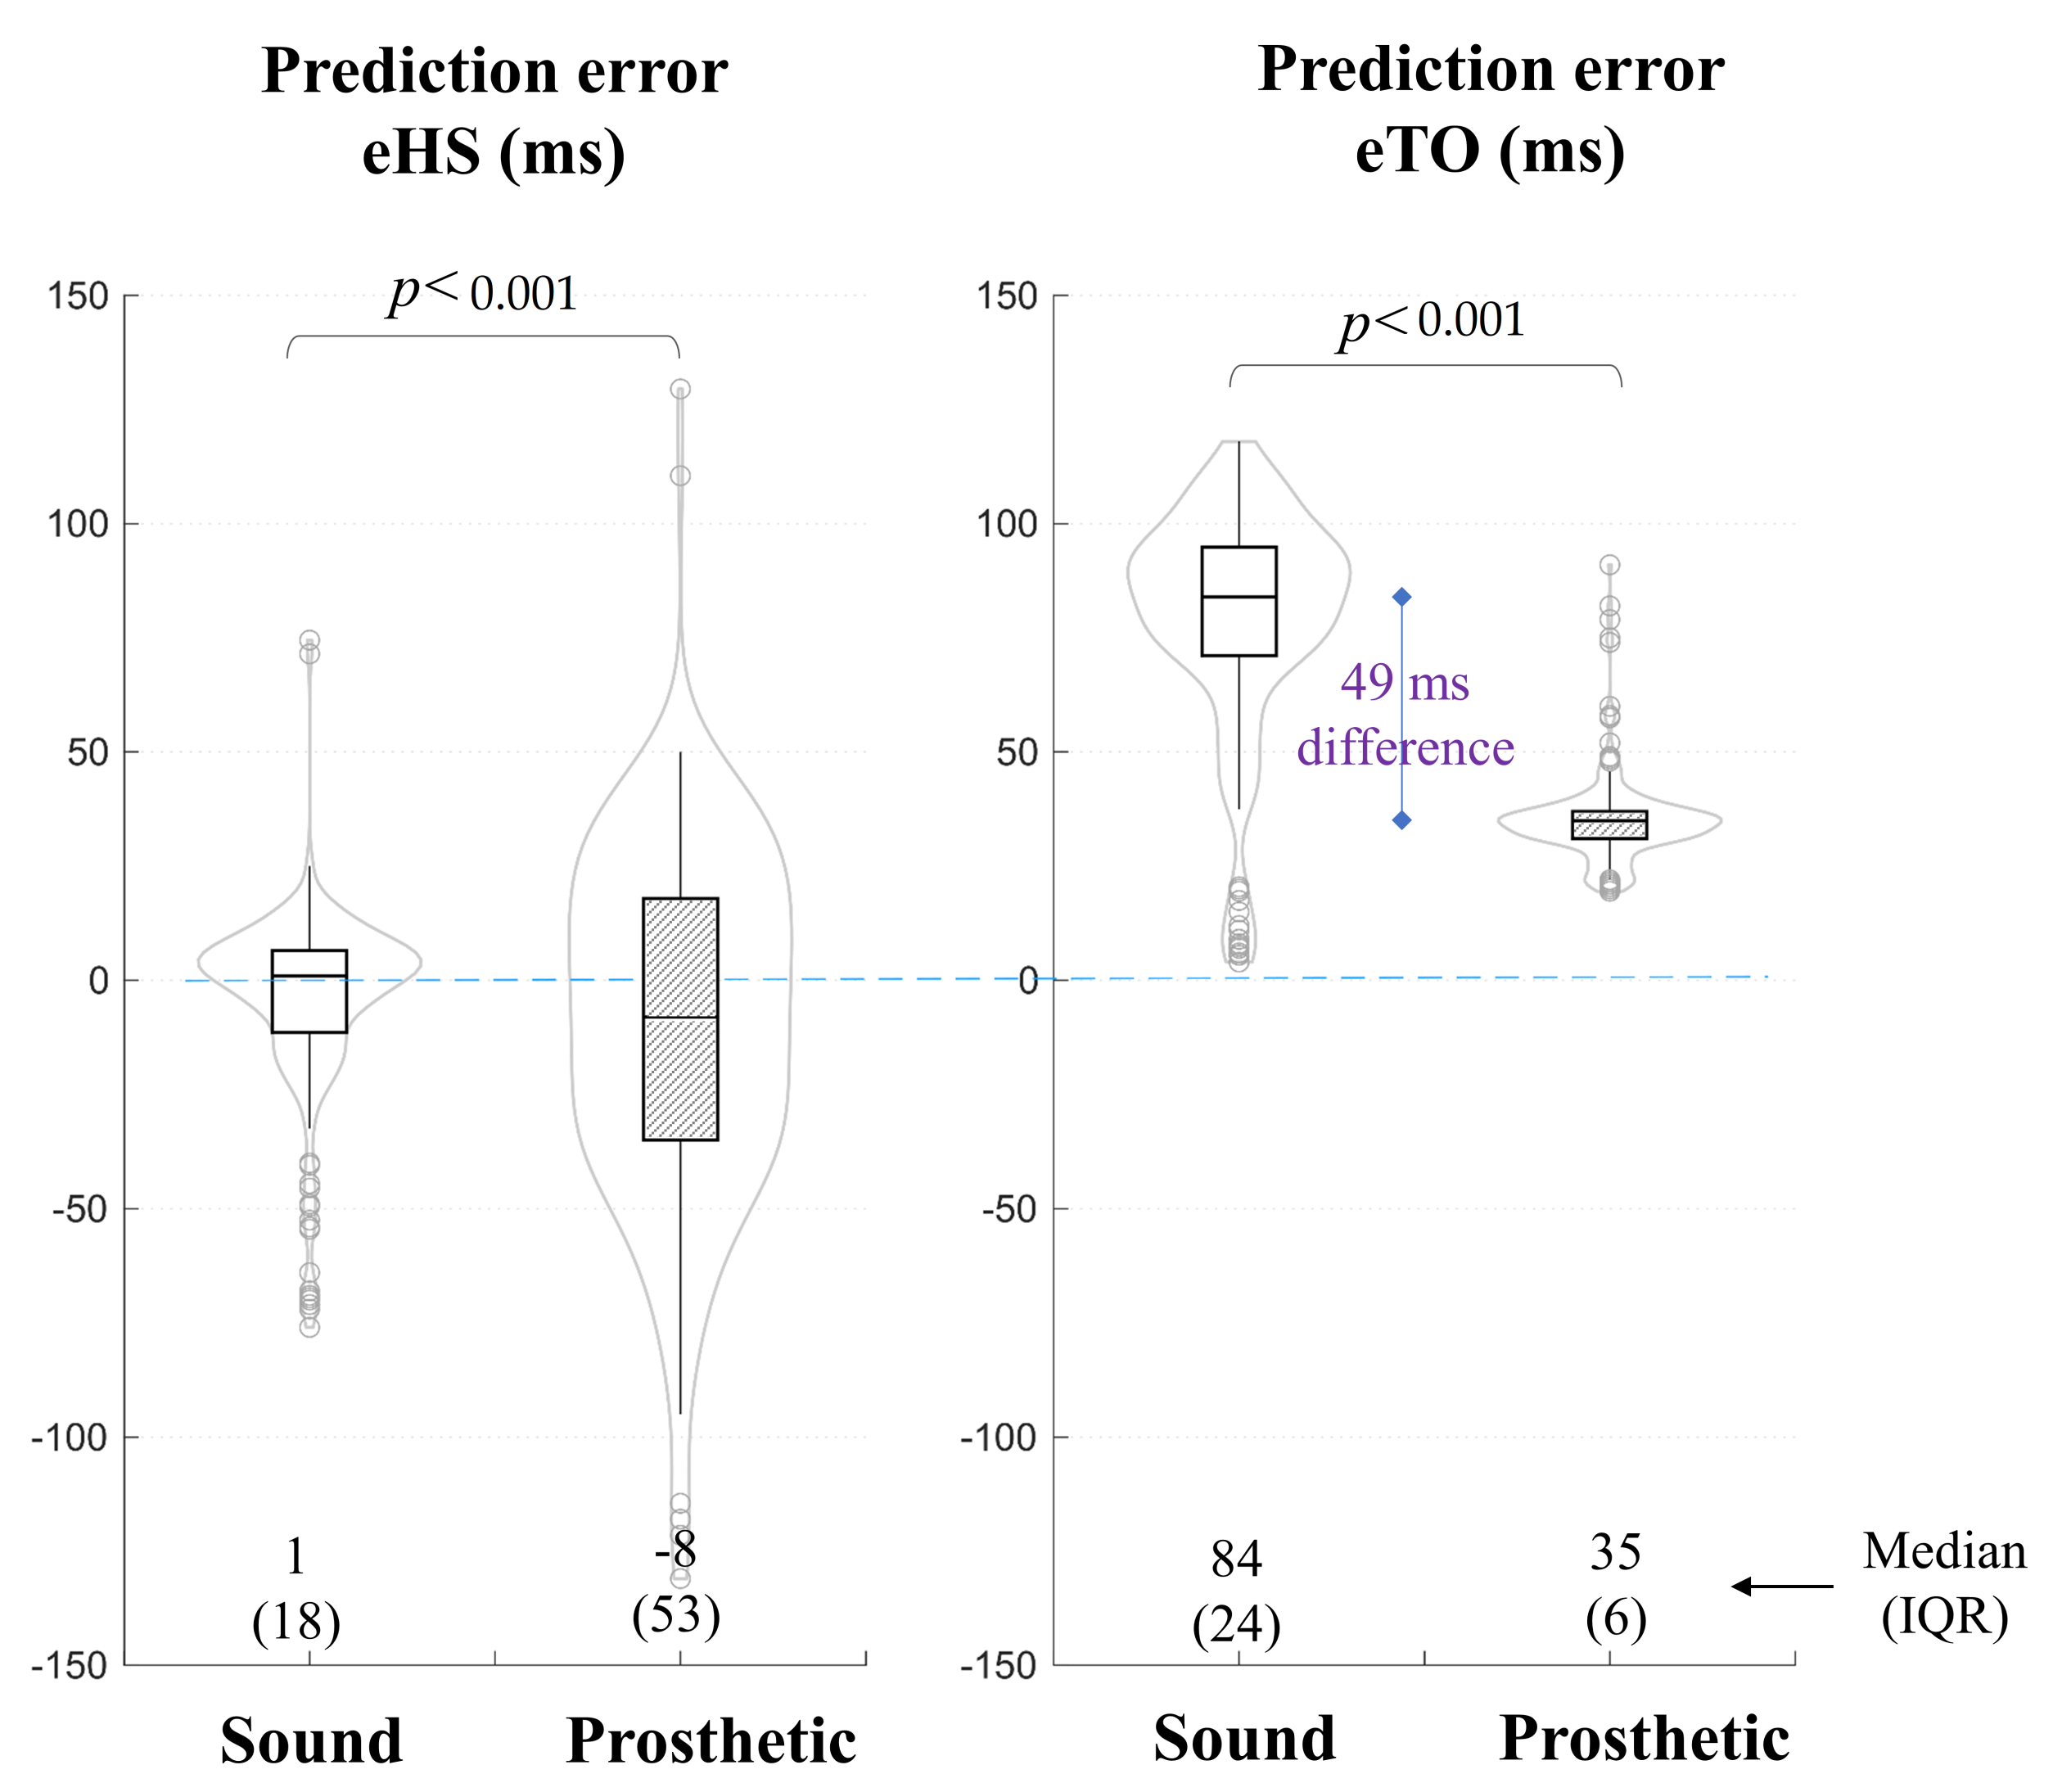
To observe the differences in prediction error between legs (sound vs. prosthetic), separate error values are plotted for each leg in
Figure 3. A Wilcoxon signed-rank test was also performed to reveal any significant differences.
For the heel strike, the median error remained closer for both legs (1 ms and −8 ms for sound vs. prosthetic side). However, the error showed larger dispersion on the prosthetic side with an IQR of 53 ms. For the TO event, there was clearly a large difference in the median error value between the two legs. The median error on the sound side was 84 ms versus 35 ms on the prosthetic side. This explains the bimodal distribution of error observed in
Figure 2.
Statistically significant differences were found between the two sides for both TO and HS events (p < 0.001).
3.2. Effect of K-Level and Walking Speed
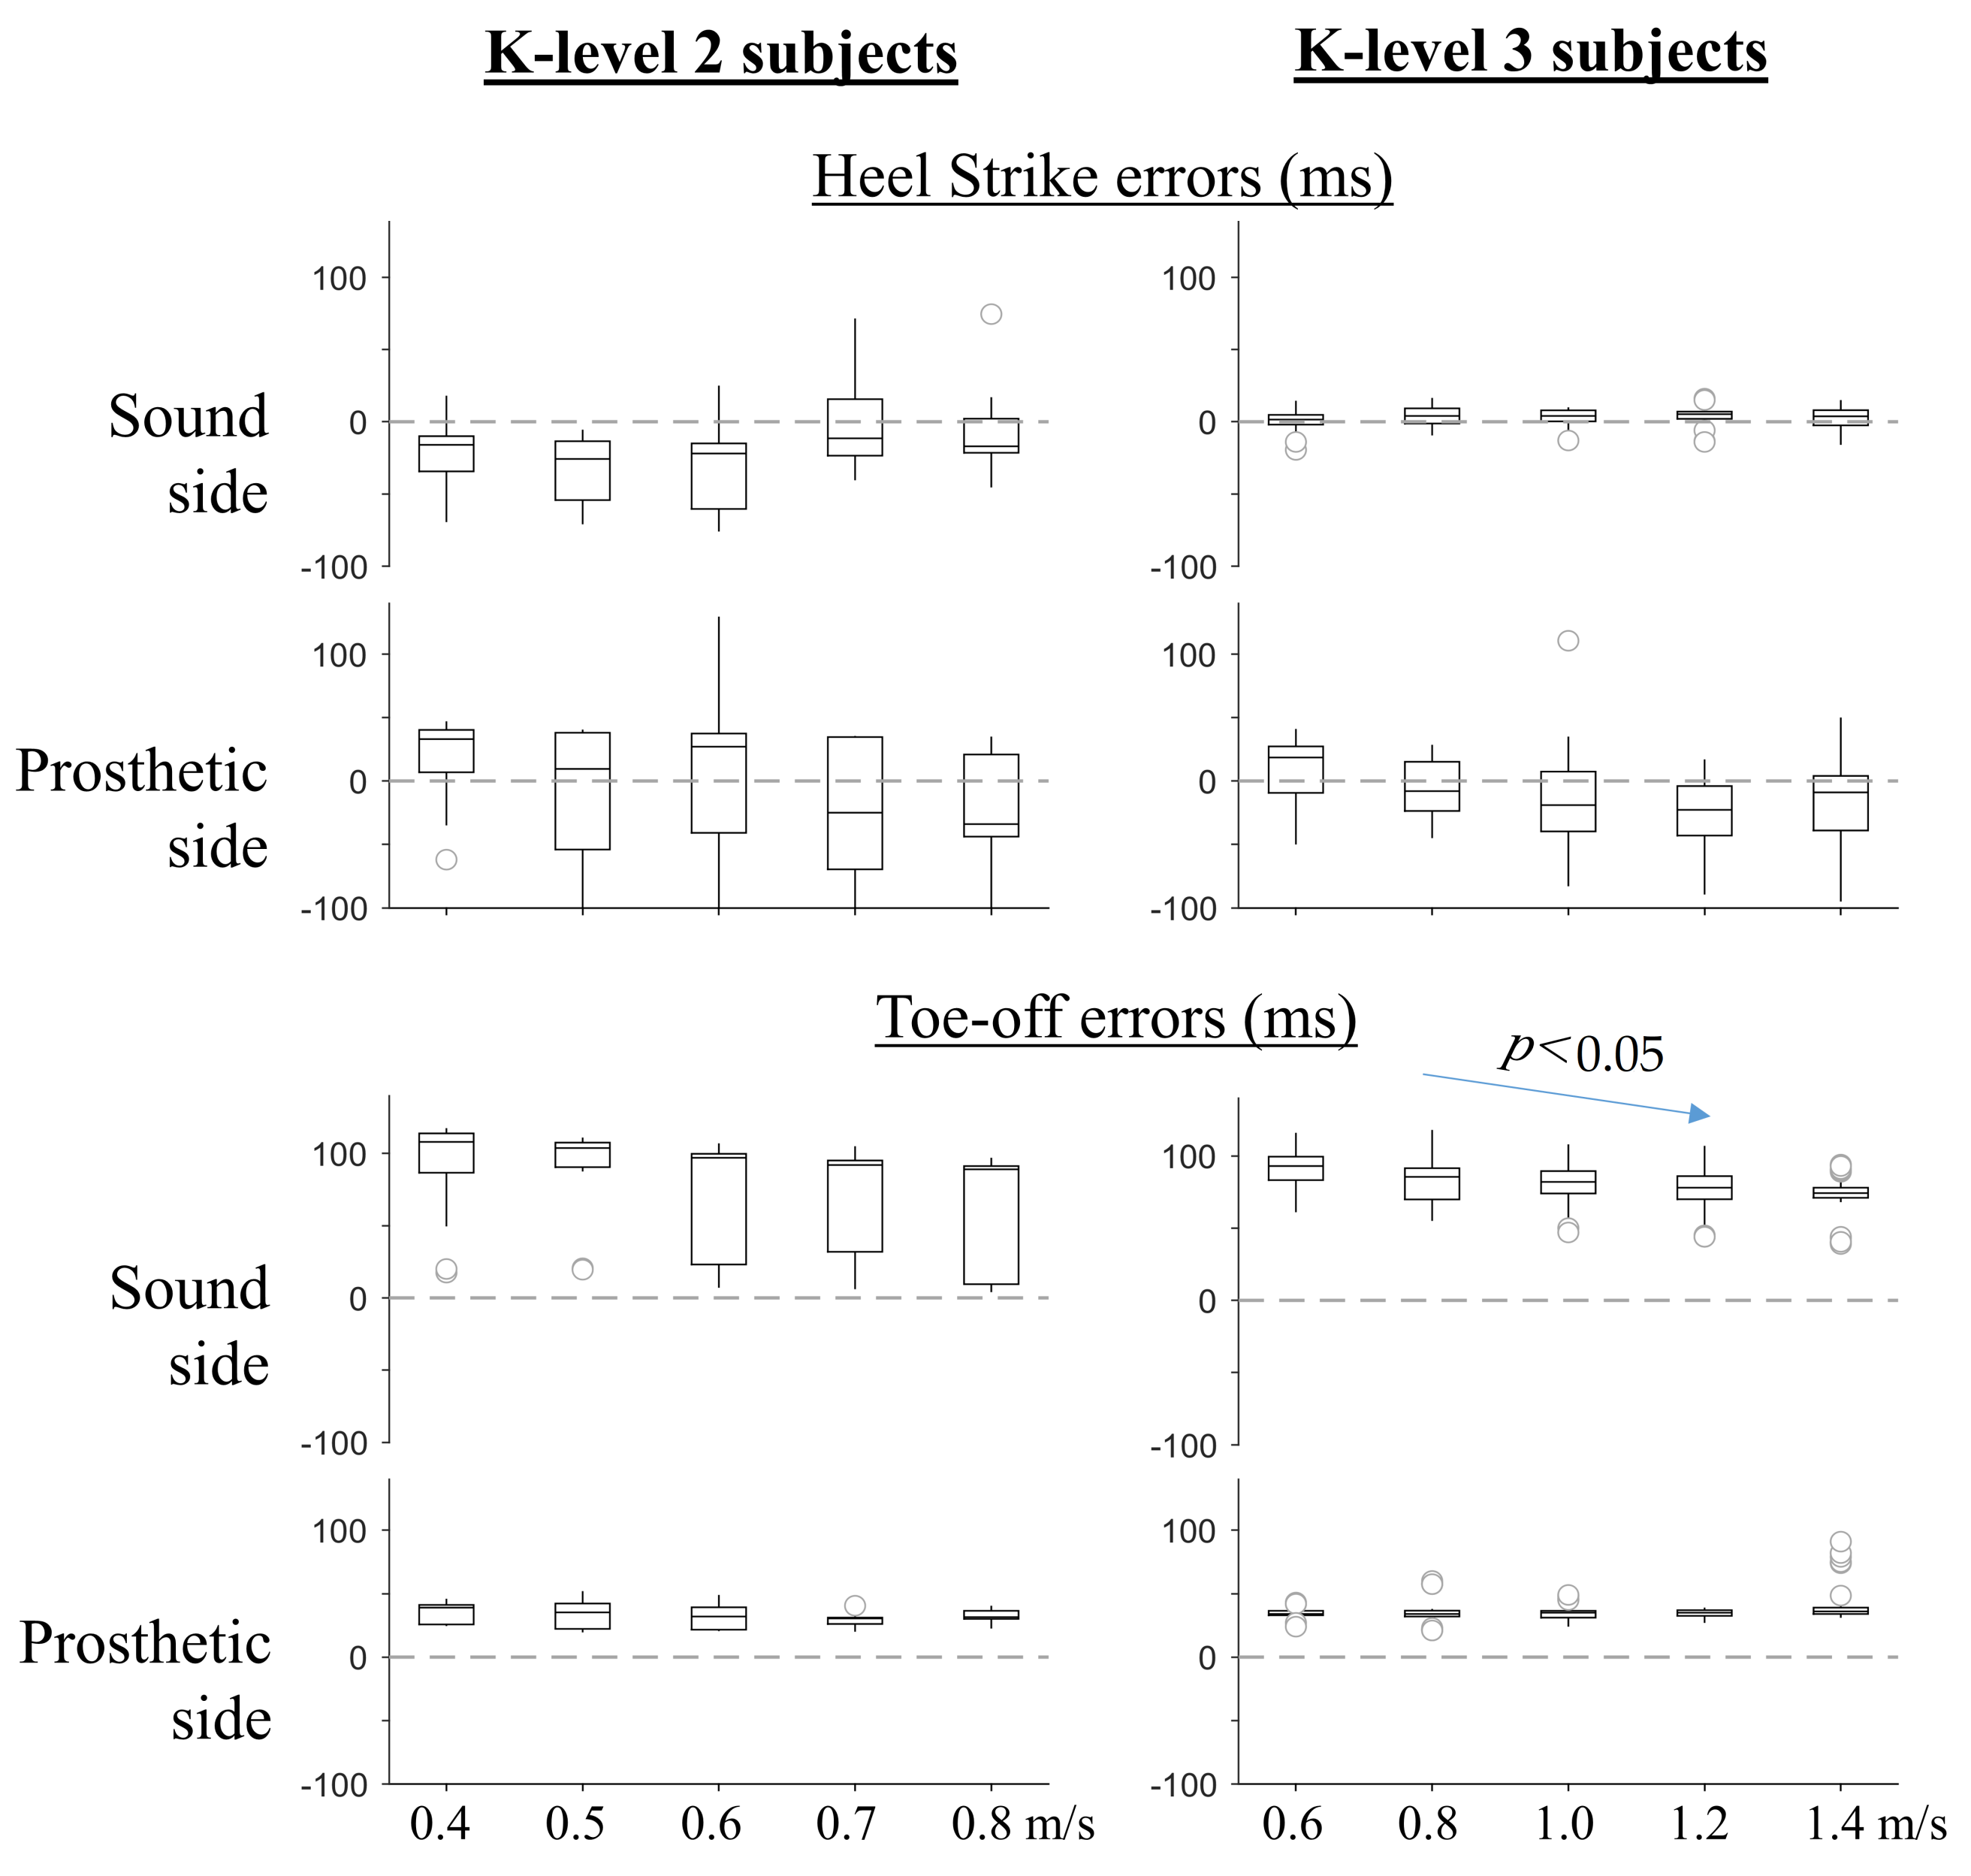
Finally, in order to observe the effect of subjects’ functional classification level and walking speed on the prediction error, separate boxplots were produced for both subject groups at different walking speeds (
Figure 4). Plots for trials from K2 subjects are shown on the left, while trials from K3 subjects are on the right. Walking speed is varied on the x-axis.
As a whole, the K2 group results had greater dispersion compared to K3 groups indicated by larger IQR values at all speeds. Moreover, the error distribution was highly skewed for K2 subjects, as indicated by asymmetrical boxplots. On the other hand, walking speed had a significant effect on the TO prediction error on the sound side only for K3 subjects (p < 0.05, Friedman test). Other variables did not exhibit any significant correlation with walking speed.
4. Discussion and Conclusions
This is one of the most comprehensive studies for any population which compares kinematics-based TO and HS prediction against the force platform data. The results provide an insight into the degree of credence of velocity-based gait event prediction. At the same time, the results can be exploited by researchers for event prediction in the absence of force platforms.
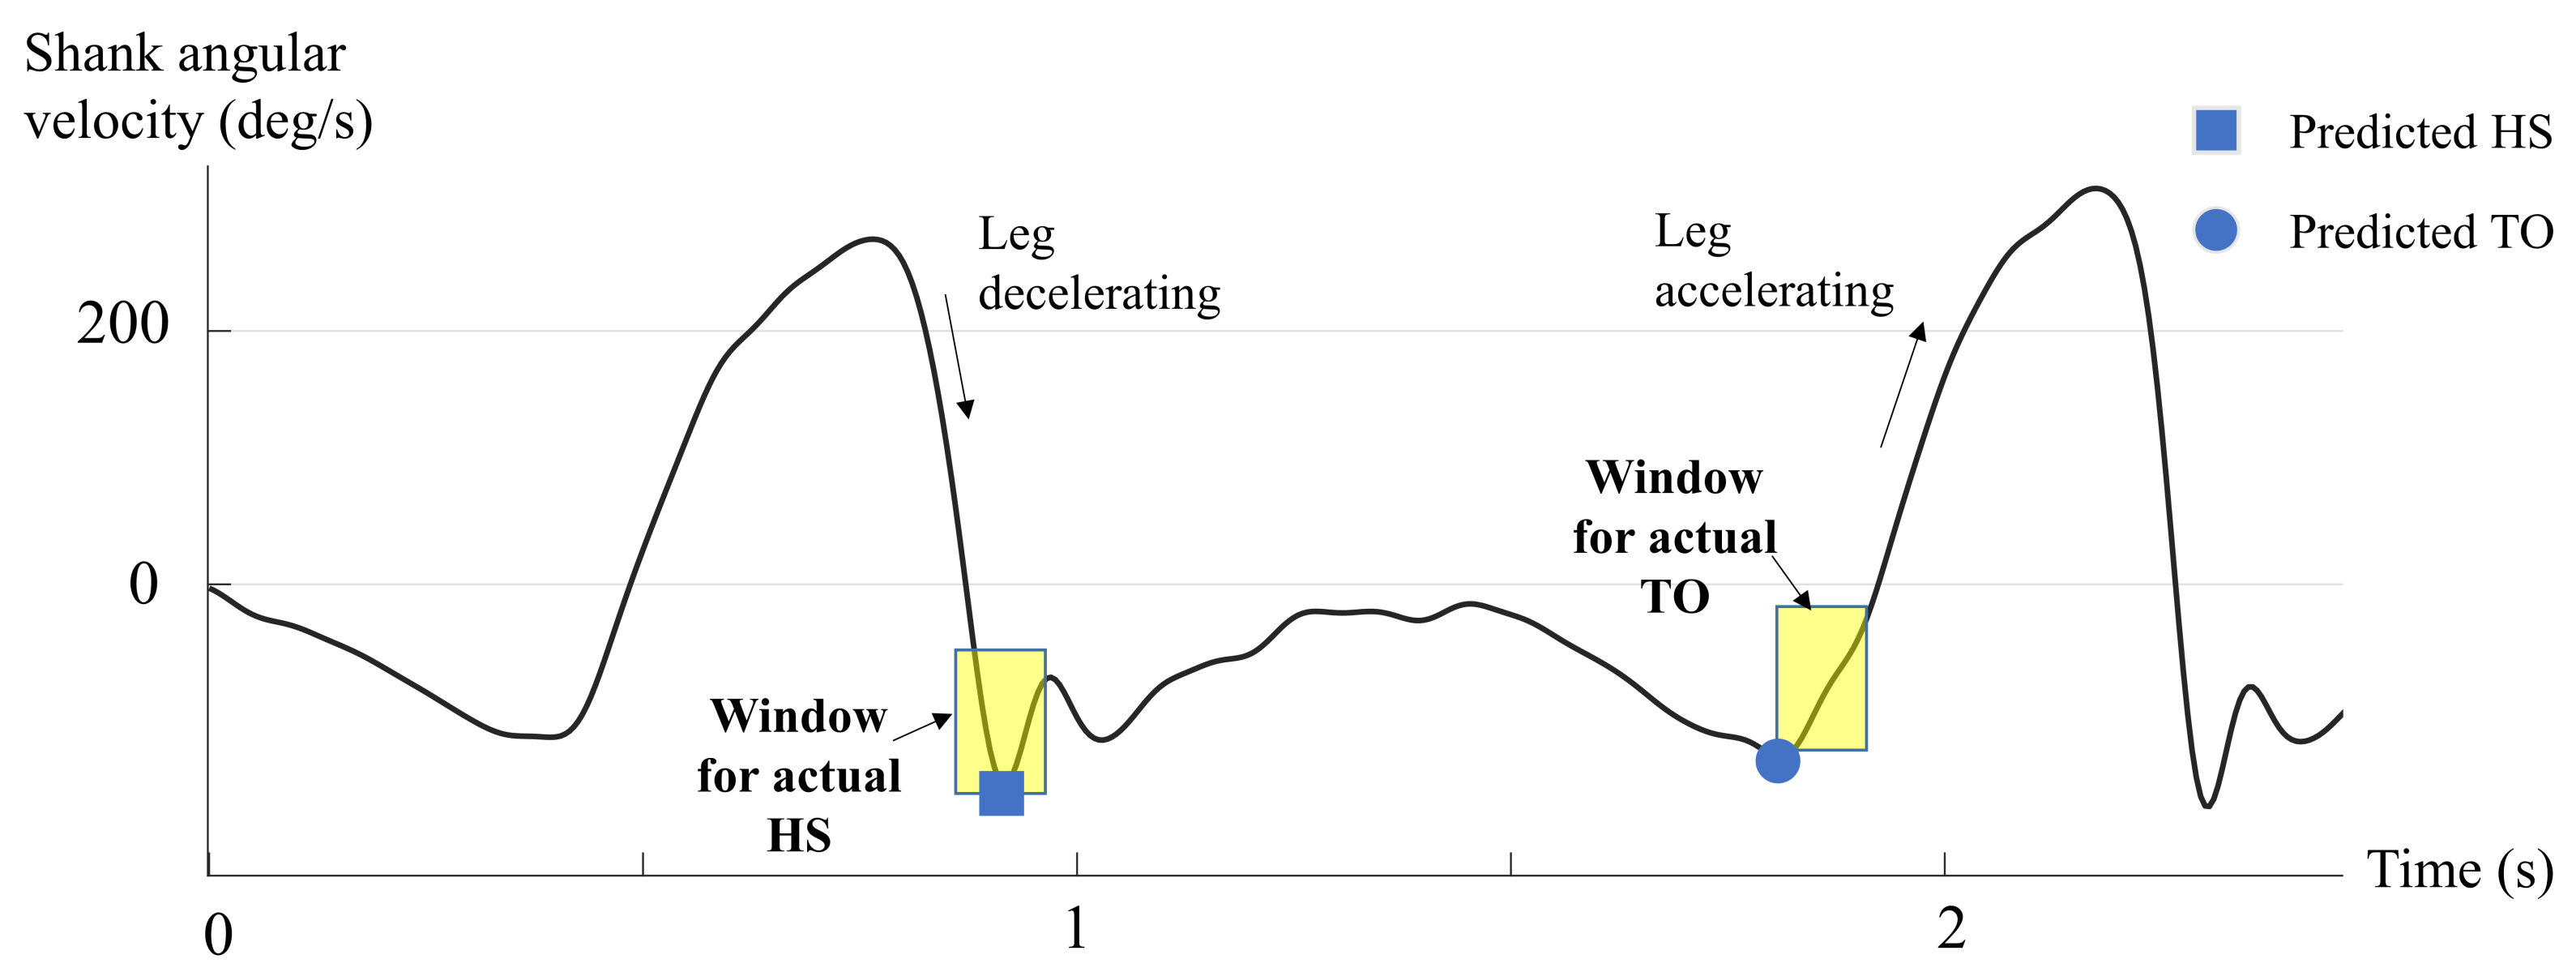
A key finding from this study is the consistent early prediction of the toe-off event for both legs. This means that the actual toe-off takes place after the first negative peak or minima of the velocity signal and points towards an inherent limitation of this algorithm. In physiological terms, it indicates that the leg has already started to accelerate forward before the foot leaves the ground. Some authors have proposed the point of zero-crossing (the point where the signal crosses from negative to positive) as TO event (e.g., [
27]). However, observation of our velocity signals for numerous trials does not support this view. We postulate that the actual TO event occurs after the negative peak (NP), but before the zero-crossing (ZC) of the velocity signal, hence yielding a narrow NP-ZC zone. Future studies should focus on this zone for accurate prediction of TO events.
On the other hand, the HS prediction stretched both positive and negative values, indicating early and late prediction, respectively. The error magnitude was however smaller indicating that the actual heel strike occurs in a small window around the second negative peak. The result of this study can be used to define a search window around the negative peaks of the leg velocity graph as shown in
Figure 5. For the HS, the window stretches about 50 ms in both directions of the first negative peak. Similarly, for the TO, the actual event window stretches up to 100ms after the second negative peak. Future research should focus on these windows while improving the prediction accuracy of kinematics-based methods, possibly by including information from other signals such as foot and/or leg accelerations.
4.1. Leg and Group Effects
Group comparisons indicated that the eTO prediction accuracy was better on the prosthetic side (
Figure 3) and further correlated negatively with walking speed (
Figure 4) on the sound side. On the other hand, the eHS variability was larger for K-level 2 subject group, which warrants precaution when using the kinematics method for subjects classified as ’limited community ambulators’ on the functional classification system.
4.2. Application to IMU-Based Velocity Estimation
Inertial measurement units (IMUs) are frequently mounted on the shank segment for gait analysis [
14,
19,
22]. While this study used a marker-based shank velocity for event prediction, the results are apply to IMU studies as long as the accuracy of data is ensured. Several studies have validated the IMU-based position and velocity estimation against the marker-based estimation [
28,
29,
30]. In particular, the study from [
29] reported measurement errors of less than 1% in the shank angular velocity from Xsens MVN and Vicon motion capture systems. Similarly, Zhang and colleagues [
31] reported high fidelity in terms of joint kinematics in the sagittal plane. These studies indicate that IMU technology can reliably detect limb kinematics, leading to the translation of the findings of this study to IMU-based systems.
Nevertheless, while the technological errors in data obtained from IMUs may be small, factors such as poor attachment or slipping of the sensor on the skin may still lead to errors. Similarly, variations in anatomical frames between the IMU and motion capture systems may lead to errors in determining joint kinematics [
31]. These factors must be considered while extending these results to the IMU-based kinematic data.
4.3. Application to Prosthesis Control Applications
While the consistent early TO prediction could lead to errors in clinical gait analysis, it could be a beneficial feature for the control of prosthetic devices. In prosthetic control, early detection is better than late. Most microprocessor-based prostheses need to adjust the knee joint’s damping or locking during both phases of walking. Assuming that the algorithm could be implemented in real-time, the negative peak in the signal could indicate an imminent toe-removal in the next 50–100 ms window (c.f.
Figure 5), allowing the control system to initiate the control action on the prosthetic limb at this point. Similarly, for the HS event, an early point of reference could be the zero-crossing of the signal just before the corresponding negative peak, while the negative peak itself could serve as the confirmation of the heel-strike event.
4.4. Comparison with Studies in the Literature
As mentioned in the beginning, there are barely any published studies with the amputee population, which makes a direct comparison of results difficult. Nevertheless, a comparison of the results of this study with the available literature is presented in
Table 2. Almost all studies have reported early TO prediction with this algorithm, albeit with smaller magnitudes than our results. Catalfamo et al. [
2] reported early TO prediction for all steps with a mean error of 50–73 ms for healthy and children suffering from cerebral palsy. Trojaniello et al. [
14] reported mean absolute TO errors in the range of 16 to 22 ms for elderly and gait-impaired subjects. These smaller magnitudes further reinforce our premise that the actual TO event occurs in the NP-ZC zone mentioned earlier for all populations.
Similarly, for HS prediction, the error values are smaller than for TO prediction as in this study. For instance, Zahradka et al. [
19] reported a mean error of −10.45 ms for a group of healthy and gait-impaired subjects, which is very close to our results. Storm et al. [
3] reported absolute mean error for indoor and outdoor walking in healthy adults in the range of 11–14 ms. The study by Catalfamo et al. [
2] reported a mean HS error of −8 ms, an absolute mean of 15 ms for level-ground walking. All in all, the findings of this study match well the literature and indicate a higher level of confidence for the HS prediction than for the TO prediction.
As a whole, the results of this study support the use of shank angular velocity signal for gait segmentation in amputees, albeit with limited accuracy for the toe-off event. These results could be translated into clinical practice using IMU-based leg velocity data, as well as into gait research for marker-based event estimation in the absence of force platforms.
Author Contributions
Conceptualization, Z.A.; methodology, Z.A.; software, Z.A. and G.A.; validation, Z.A. and G.A.; formal analysis, Z.A. and G.A.; investigation, Z.A.; resources, Z.A.; data curation, Z.A. and G.A.; writing—original draft preparation, Z.A. and G.A.; writing—review and editing, Z.A. and G.A.; visualization, G.A.; supervision, Z.A.; project administration, Z.A.; funding acquisition, Z.A. All authors have read and agreed to the published version of the manuscript.
Funding
This research received no external funding.
Institutional Review Board Statement
Not applicable.
Informed Consent Statement
Not applicable.
Data Availability Statement
Not applicable.
Conflicts of Interest
The authors declare no conflict of interest.
References
- Perry, J.; Burnfield, J.M. Gait Analysis: Normal and Pathological Function; Slack: Thorofare, NJ, USA, 1992. [Google Scholar]
- Catalfamo, P.; Ghoussayni, S.; Ewins, D. Gait event detection on level ground and incline walking using a rate gyroscope. Sensors 2010, 10, 5683–5702. [Google Scholar] [CrossRef] [Green Version]
- Storm, F.A.; Buckley, C.J.; Mazzà, C. Gait event detection in laboratory and real life settings: Accuracy of ankle and waist sensor based methods. Gait Posture 2016, 50, 42–46. [Google Scholar] [CrossRef] [PubMed] [Green Version]
- Gouwanda, D.; Gopalai, A.A. A robust real-time gait event detection using wireless gyroscope and its application on normal and altered gaits. Med. Eng. Phys. 2015, 37, 219–225. [Google Scholar] [CrossRef] [PubMed]
- Ding, S.; Ouyang, X.; Liu, T.; Li, Z.; Yang, H. Gait event detection of a lower extremity exoskeleton robot by an intelligent IMU. IEEE Sens. J. 2018, 18, 9728–9735. [Google Scholar] [CrossRef]
- Zhao, H.; Wang, Z.; Qiu, S.; Wang, J.; Xu, F.; Wang, Z.; Shen, Y. Adaptive gait detection based on foot-mounted inertial sensors and multi-sensor fusion. Inf. Fusion 2019, 52, 157–166. [Google Scholar] [CrossRef]
- Fadillioglu, C.; Stetter, B.J.; Ringhof, S.; Krafft, F.C.; Sell, S.; Stein, T. Automated gait event detection for a variety of locomotion tasks using a novel gyroscope-based algorithm. Gait Posture 2020, 81, 102–108. [Google Scholar] [CrossRef]
- Sahoo, S.; Saboo, M.; Pratihar, D.K.; Mukhopadhyay, S. Real-Time Detection of Actual and Early Gait Events During Level-Ground and Ramp Walking. IEEE Sens. 2020, 20, 8128–8136. [Google Scholar] [CrossRef]
- De Asha, A.R.; Robinson, M.A.; Barton, G.J. A marker based kinematic method of identifying initial contact during gait suitable for use in real-time visual feedback applications. Gait Posture 2012, 36, 650–652. [Google Scholar] [CrossRef]
- Jasiewicz, J.M.; Allum, J.H.J.; Middleton, J.W.; Barriskill, A.; Condie, P.; Purcell, B.; Li, R.C.T. Gait event detection using linear accelerometers or angular velocity transducers in able-bodied and spinal-cord injured individuals. Gait Posture 2006, 24, 502–509. [Google Scholar] [CrossRef] [Green Version]
- O’Connor, C.M.; Thorpe, S.K.; O’Malley, M.J.; Vaughan, C.L. Automatic detection of gait events using kinematic data. Gait Posture 2007, 25, 469–474. [Google Scholar] [CrossRef]
- Gonçalves, R.V.; Fonseca, S.T.; Araújo, P.A.; Araújo, V.L.; Barboza, T.M.; Martins, G.A.; Mancini, M.C. Identification of gait events in children with spastic cerebral palsy: Comparison between the force plate and algorithms. Braz. J. Phys. Ther. 2020, 24, 392–398. [Google Scholar] [CrossRef] [PubMed]
- Behboodi, A.; Zahradka, N.; Wright, H.; Alesi, J.; Lee, S.C. Real-time detection of seven phases of gait in children with cerebral palsy using two gyroscopes. Sensors 2019, 19, 2517. [Google Scholar] [CrossRef] [PubMed] [Green Version]
- Trojaniello, D.; Cereatti, A.; Pelosin, E.; Avanzino, L.; Mirelman, A.; Hausdorff, J.M.; Croce, U.D. Estimation of step-by-step spatio-temporal parameters of normal and impaired gait using shank-mounted magneto-inertial sensors: Application to elderly, hemiparetic, parkinsonian and choreic gait. J. Neuroeng. Rehabil. 2014, 11, 152. [Google Scholar] [CrossRef] [PubMed] [Green Version]
- Visscher, R.M.; Sansgiri, S.; Freslier, M.; Harlaar, J.; Brunner, R.; Taylor, W.R.; Singh, N.B. Towards validation and standardization of automatic gait event identification algorithms for use in paediatric pathological populations. Gait Posture 2021, 86, 64–69. [Google Scholar] [CrossRef]
- Hundza, S.R.; Hook, W.R.; Harris, C.R.; Mahajan, S.V.; Leslie, P.A.; Spani, C.A.; Spalteholz, L.G.; Birch, B.J.; Commandeur, D.T.; Livingston, N.J. Accurate and reliable gait cycle detection in parkinson’s disease. IEEE Trans. Neural Syst. Rehabil. Eng. 2014, 22, 127–137. [Google Scholar] [CrossRef]
- Aminian, K.; Najafi, B.; Büla, C.; Leyvraz, P.F.; Robert, P. Spatio-temporal parameters of gait measured by an ambulatory system using miniature gyroscopes. J. Biomech. 2002, 35, 689–699. [Google Scholar] [CrossRef]
- Niswander, W.; Kontson, K. Evaluating the impact of imu sensor location and walking task on accuracy of gait event detection algorithms. Sensors 2021, 21, 3989. [Google Scholar] [CrossRef]
- Zahradka, N.; Verma, K.; Behboodi, A.; Bodt, B.; Wright, H.; Lee, S.C. An evaluation of three kinematic methods for gait event detection compared to the kinetic-based ‘gold standard’. Sensors 2020, 20, 5272. [Google Scholar] [CrossRef]
- Maqbool, H.F.; Husman, M.A.B.; Awad, M.I.; Abouhossein, A.; Dehghani-Sanij, A.A. Real-time gait event detection for transfemoral amputees during ramp ascending and descending. In Proceedings of the 2015 37th Annual International Conference of the IEEE Engineering in Medicine and Biology Society (EMBC), Milano, Italy, 25–29 August 2015; pp. 4785–4788. [Google Scholar]
- Fraccaro, P.; Walsh, L.; Doyle, J.; O’Sullivan, D. Real-world Gyroscope-based Gait Event Detection and Gait Feature Extraction. In Proceedings of the 6th International Conference on eHealth, Telemedicine, and Social Medicine, Barcelona, Spain, 23–27 March 2014; pp. 247–252. [Google Scholar]
- Lee, J.K.; Park, E.J. Quasi real-time gait event detection using shank-attached gyroscopes. Med. Biol. Eng. Comput. 2011, 49, 707–712. [Google Scholar] [CrossRef]
- Hood, S.; Ishmael, M.K.; Gunnell, A.; Foreman, K.B.; Lenzi, T. A kinematic and kinetic dataset of 18 above-knee amputees walking at various speeds. Sci. Data 2020, 7, 150. [Google Scholar] [CrossRef]
- Gailey, R.S.; Roach, K.E.; Applegate, E.; Cho, B.; Cunniffe, B.; Licht, S.; Maguire, M.; Nash, M.S. The Amputee Mobility Predictor: An instrument to assess determinants of the lower-limb amputee’s ability to ambulate. Arch. Phys. Med. Rehabil. 2002, 83, 613–627. [Google Scholar] [CrossRef] [PubMed] [Green Version]
- Barre, A.; Armand, S. Biomechanical ToolKit: Open-source framework to visualize and process biomechanical data. Comput. Methods Programs Biomed. 2014, 114, 80–87. [Google Scholar] [CrossRef] [PubMed]
- Winter, D.A. Biomechanics and Motor Control of Human Movement: Fourth Edition; John Wiley & Sons: New York, NY, USA, 2009; pp. 1–370. [Google Scholar] [CrossRef]
- Allseits, E.; Lučarević, J.; Gailey, R.; Agrawal, V.; Gaunaurd, I.; Bennett, C. The development and concurrent validity of a real-time algorithm for temporal gait analysis using inertial measurement units. J. Biomech. 2017, 55, 27–33. [Google Scholar] [CrossRef] [PubMed] [Green Version]
- Robert-Lachaine, X.; Mecheri, H.; Larue, C.; Plamondon, A. Accuracy and repeatability of single-pose calibration of inertial measurement units for whole-body motion analysis. Gait Posture 2017, 54, 80–86. [Google Scholar] [CrossRef] [PubMed]
- Blair, S.; Duthie, G.; Robertson, S.; Hopkins, W.; Ball, K. Concurrent validation of an inertial measurement system to quantify kicking biomechanics in four football codes. J. Biomech. 2018, 73, 24–32. [Google Scholar] [CrossRef] [PubMed]
- Clemente, F.M.; Akyildiz, Z.; Pino-Ortega, J.; Rico-González, M. Validity and reliability of the inertial measurement unit for barbell velocity assessments: A systematic review. Sensors 2021, 21, 2511. [Google Scholar] [CrossRef]
- Zhang, J.T.; Novak, A.C.; Brouwer, B.; Li, Q. Concurrent validation of Xsens MVN measurement of lower limb joint angular kinematics. Physiol. Meas. 2013, 34, N63. [Google Scholar] [CrossRef]
| Publisher’s Note: MDPI stays neutral with regard to jurisdictional claims in published maps and institutional affiliations. |
© 2022 by the authors. Licensee MDPI, Basel, Switzerland. This article is an open access article distributed under the terms and conditions of the Creative Commons Attribution (CC BY) license (https://creativecommons.org/licenses/by/4.0/).
