Article

The Complexity of Medical Device Regulations Has Increased, as Assessed through Data-Driven Techniques

Natural Interaction Lab, Department of Engineering Science, University of Oxford, Oxford OX1 3PJ, UK
*
Author to whom correspondence should be addressed.
Prosthesis 2021, 3(4), 314-330; https://doi.org/10.3390/prosthesis3040029
Submission received: 31 August 2021 / Revised: 16 September 2021 / Accepted: 24 September 2021 / Published: 28 September 2021
(This article belongs to the Special Issue Regulatory Data Science for Medical Devices)

Abstract

:
Medical device regulations are dynamic, as they need to cover an ever changing landscape. In Europe this has led to a new set of regulations (both for Medical Devices and In Vitro Diagnostics), which replaced the old rules. This study is interested in how the complexity of these medical regulations changed over time and if additional time-based metrics can be associated with any of the complexity metrics. Complexity is defined in terms of readability of the text and it is computed using established linguistic measures, as well as Halstead complexity scores. It was shown that the regulatory complexity of new EU medical device regulations was higher than their predecessors, especially when Halstead complexity measures were considered. The complexity metrics obtained for the new regulations were subsequently associated with the time it took to consider these regulations. Only very weak Pearson’s correlation coefficients were found between the complexity scores and the obtained response times for the new regulations. This could indicate that there are issues with how complexity is perceived by those that need to apply these regulations. Taking the complexity of regulations into account can greatly help with the development of more user friendly regulations. The results from the data-driven methods that are applied in this research indicate that governments could benefit from focusing on making regulations more accessible and utilitarian. This would improve the stakeholder adherence and facilitate effective implementation. This work also highlighted the need to develop more suitable methods to analyse regulatory text to further inform the wider research community.

1. Introduction

The medical device industry has been home to some of the most revolutionary innovations by mankind. The evolution in this field has been a cornerstone of the advances in global health. The term medical device itself encompasses a vast array of products that are used for diagnosing, treating and assisting patients. All aiming to improve the quality of life of patients. There is a great demand for new medical devices due to the aging population [1] and it is a growing global market, which was valued at $425.5 Billion in 2018 [2]. The United Kingdom alone was estimated in 2015 to have 4060 medical device manufacturers [3] and globally there are many small and medium enterprises operating in this domain. All these medical device companies have to engage with the medical device regulations if they want to bring their ideas to market.

Medical Device Regulations

Regulations are primarily designed to protect the patients, with regulatory bodies ensuring that medical devices are safe and that they perform as intended [4], but the regulations are also in place to protect the manufacturers themselves [5]. In some circumstances, patients may misuse devices or ignore instructions, injuring themselves in the process. Compliance with the regulations acts as a safety net for the manufacturers in the case of a legal dispute. Manufacturers and designers can also use regulation to their advantage and innovate more efficiently, as they can follow clearer guidelines which in turn saves time and reduces some of the uncertainty regarding the process. Additionally, regulations enforce that devices offer a clinical benefit, which prevents markets from being flooded with devices that provide no gains for the user [6]. Finally, regulations are also intended to enhance post-market surveillance to ensure that devices have good longevity and prevents faulty devices from remaining in circulation [7].
While medical device regulations have been implemented for many years, much like other legislation, they do vary between different countries and continents. A major challenge faced by regulators is to ensure that the regulations remain relevant and fit for purpose. This is made more difficult by the sheer rate of innovation, as well as the ever changing needs within healthcare [8]. Consequently, regulations could become outdated and thus compromise patient safety. A prime example of this is the emergence of medical device software [9] and medical devices which have solely cosmetic purposes. These can range from coloured contact lenses to instruments used in cosmetic surgery for liposuction or tattoo removal. It was in fact a scandal related to leaky silicone breast implants from French company Poly Implant Prothèse that highlighted the short-comings in the Medical Device Directive which covered the regulations at that time [10]. Another well-documented example of where regulations did not adequately prevented harm was the discovery of blood poisoning in patients using metal-on-metal hip implants [11]. These kind of events led to an overhaul of the regulatory system in 2017 in Europe. Two new EU legislations were brought into force. Firstly the Medical Device Regulations (MDR) [12] replaced the Medical Devices Directive and Active Implantable Medical Devices Directive (MDD) [13,14]. Whilst, the In Vitro Diagnostic Regulations (IVDR) [15] replaced the EU [16,17]. For these new legislations, manufacturers had until May 2021 and May 2022 respectively to update their technical documents in order to conform with the new requirements. This clearly shows how manufacturers or suppliers of medical devices must continuously adhere to new regulations by ensuring that the correct device classification is achieved, general safety and performance requirements are met and conditions for clinical evidence are met. Manufacturers are responsible for regulatory compliance and that the specific requirements for importers, as well as distributors are respectively met where relevant [18].

2. Background

2.1. Complexity of Regulations

There are clear arguments for more stringent regulations in terms of patient safety, yet this form of legislation can only be effective if it is well understood and properly implemented. The MDR and IVDR are 175 and 157 page-long documents. They take the form of complex legal documents filled with lots of jargon. They can be difficult to navigate with the aim of locating specific information and subsequently the information itself can be hard to interpret once it has been found. Many medical devices, especially at the point of conceptualisation, are designed and manufactured by small or medium companies. The small nature of many companies means that their teams are often compact, with few employees. This means that they can struggle to secure the resources necessary to have sufficient legal competencies to navigate these regulations. Most of the innovators are academics or entrepreneurs with no or limited legal training or knowledge. Not understanding the regulations can cause misclassification and innovators might incorrectly interpret the regulations. This can have a compounding effect that leads to expensive redesign and/or retesting of certain devices. Not only does this hamper and discourage innovation, but companies could inadvertently develop faulty or inadequate devices. This raises concerns about patient safety, whilst simultaneously presenting risks to the manufacturers who have legal liabilities and also face significant losses of time and money. These outcomes are undesirable for all stakeholders and so it is vital to facilitate proper understanding of the regulations by medical device companies and innovators. The complexity of the legal text will have a direct effect on the ability of the reader to understand it.

2.2. Complexity of Text

The difficulty presented by a particular piece of text can be attributed to its linguistic complexity which is a measure of the extent to which the type of language used makes communication more or less complicated. Though the complexity of text is inherently subjective, for research purposes and large scale projects, it is important to utilise objective metrics to gain a better understanding of the problems innovators face.
Natural Language Processing (NLP) is a branch of computer science, combined with linguistics and artificial intelligence to interpret, analyse and process human text and speech across many languages. Recent progress in the management of unstructured data, the type generated from conversations or human written text, has equipped machines to understand language in a cognitive way which facilitates the identification of particular nuances and features of language [19]. The automatic manipulation of natural language by software is a field which has benefited from a data-driven approach.
The use of NLP methods enables the evaluation of text to return a quantitative score for its complexity and is particularly useful for treating vast quantities of data efficiently. These techniques range from numerical methods that focus on text length and sentence structure, to readability metrics which estimate the number of years of education required to easily read the text and finally, more evolved complexity methods that investigate the types of words and language used in a text to determine the overall complexity. Each of these methods are used in a range of fields, but not all are applicable to legal texts.
Intuitively, it can be assumed that the longer a piece of text is, the bigger of a challenge it will present and therefore it will require more time to read and process. This line of thinking generates numerical techniques which count the words, characters or syllables and only focus on the overall length as a predictor of expected time taken. However, the most common method for assessing text complexity originates from techniques focused around the expected level of education required to read the text. Traditionally, text complexity has been equated to its readability and this is what a series of methods from the 20th century aim to measure.

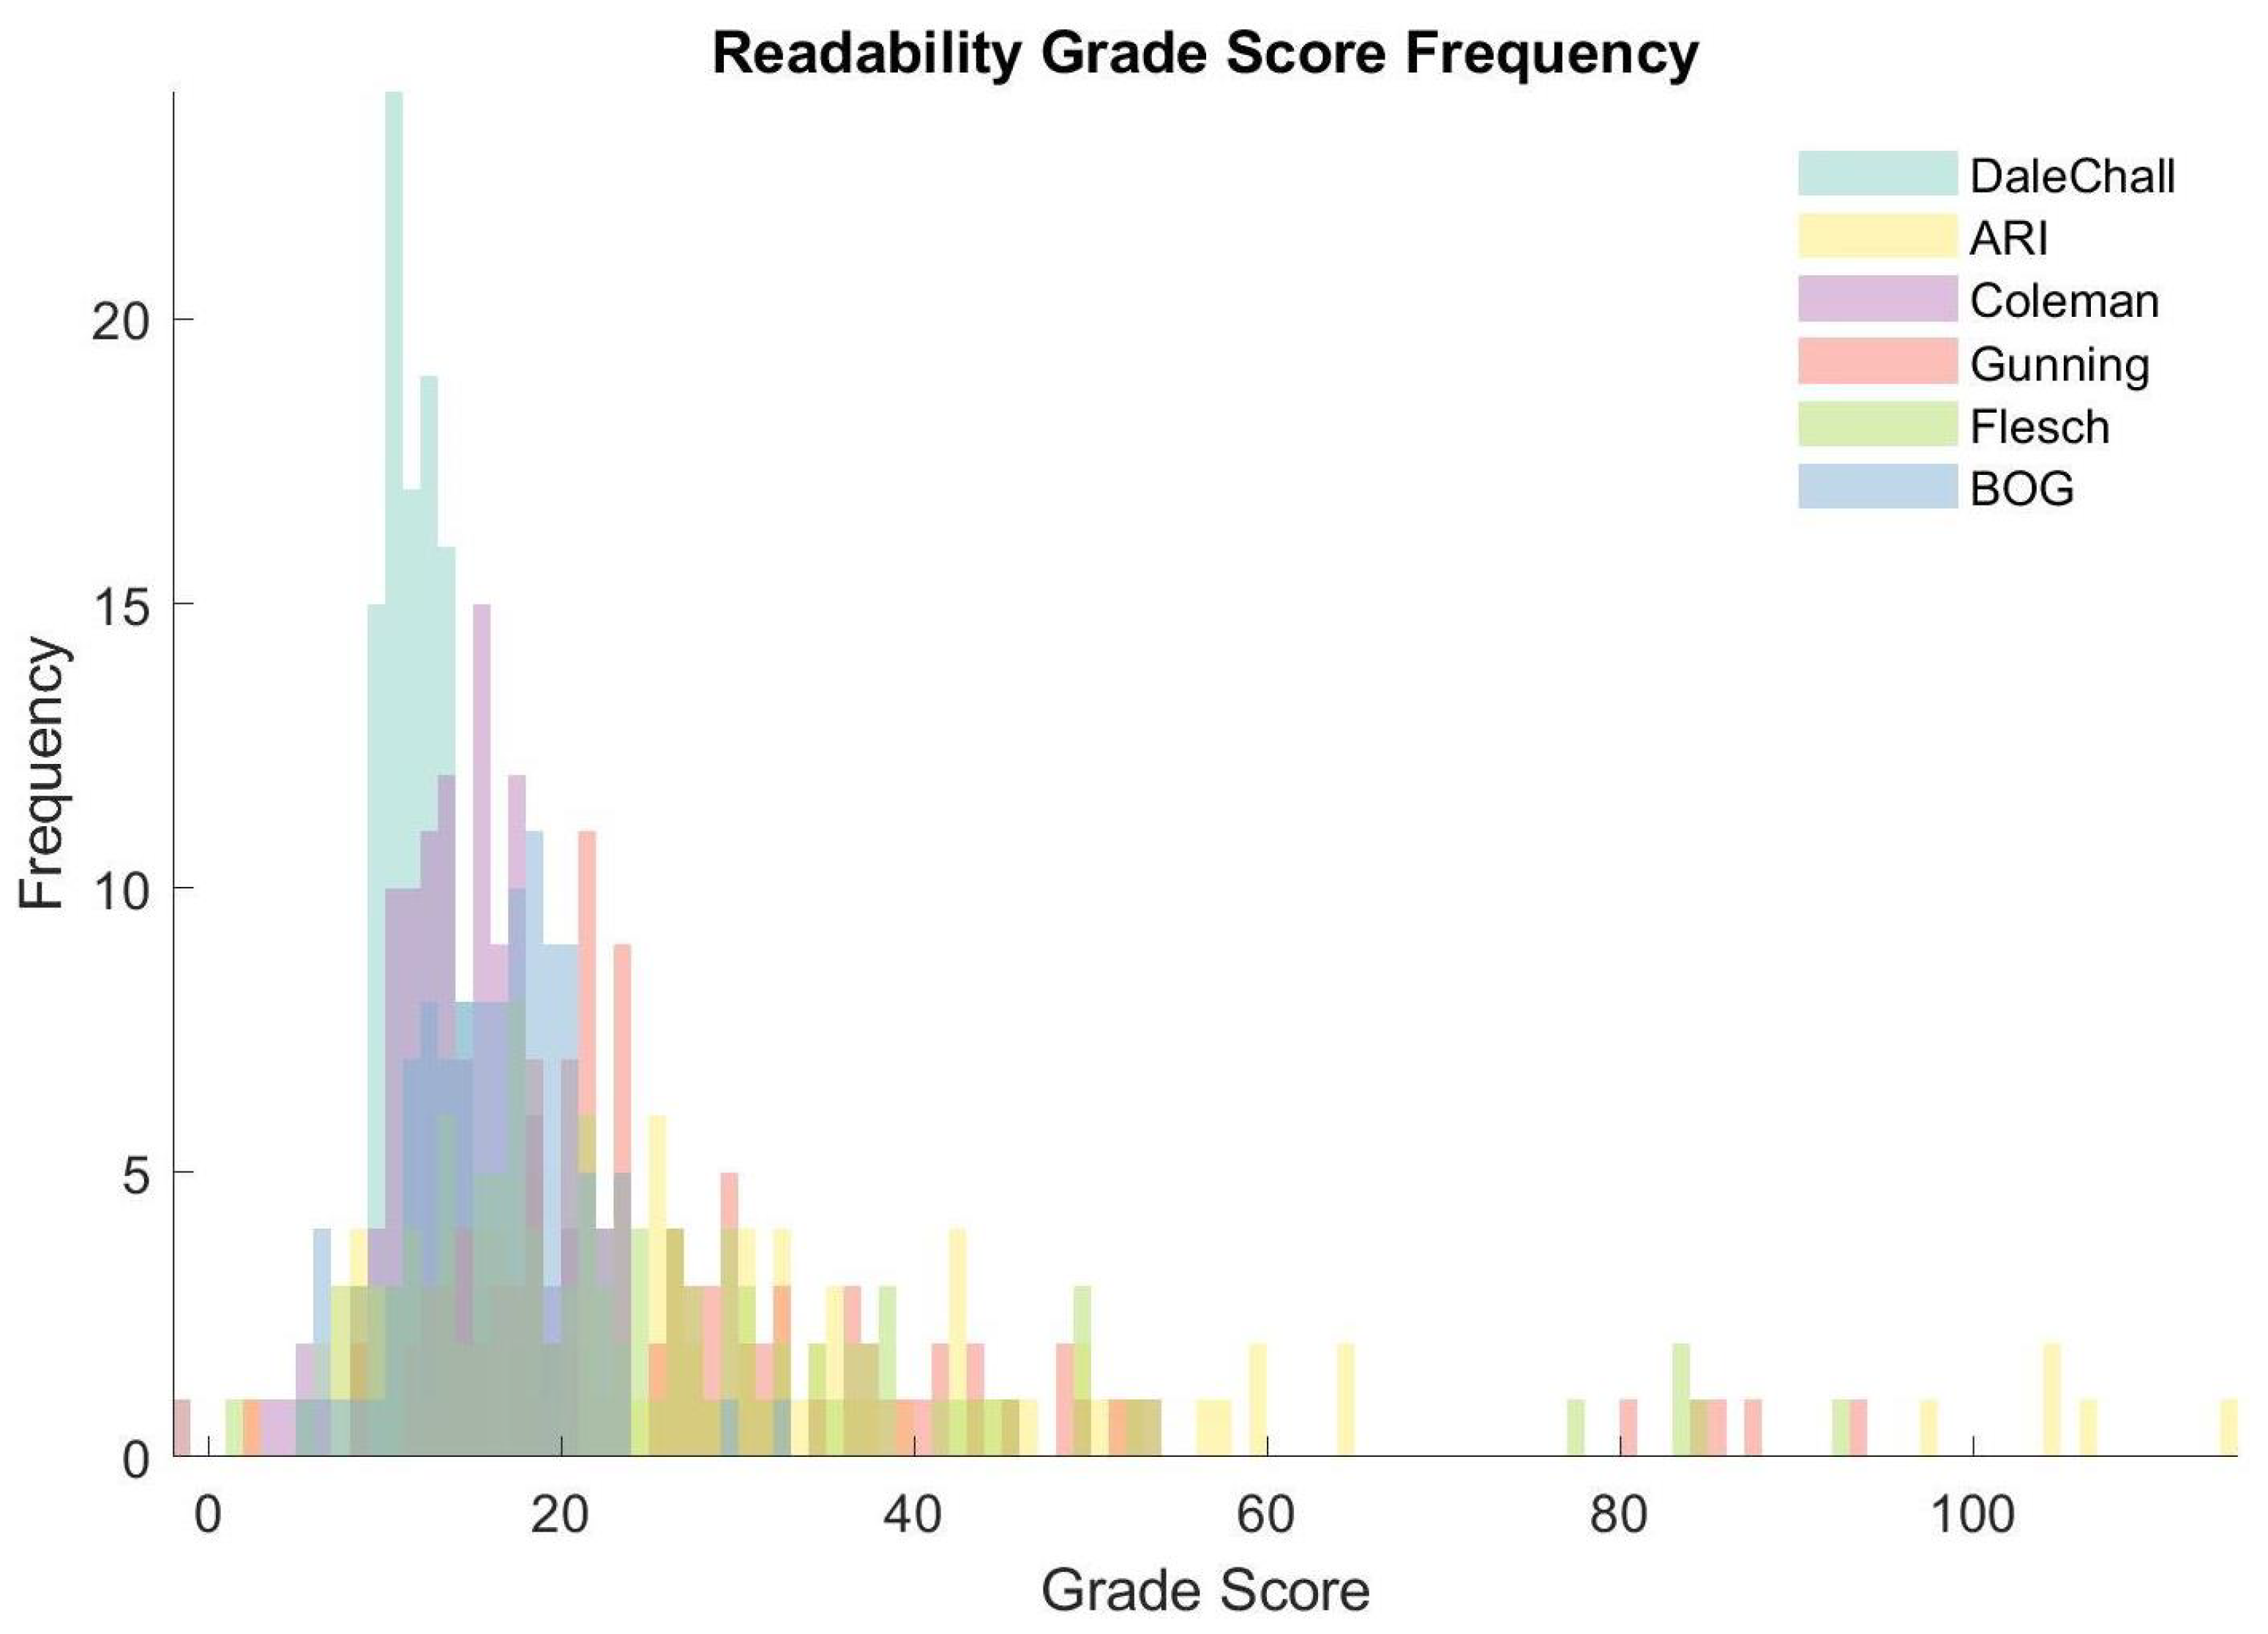
2.2.1. Common Readability Metrics

The Dale–Chall Readability formula was initially developed in 1948 under the name of “A Formula for Predicting Readability” [20], but has since been updated to reflect the changes undergone by language use [21]. The formula is based around a list of common words which are deemed “not difficult”; this list was initially 973 words long but has since been expanded to 3000 words. The formula combines the average length of sentences, in terms of the number of words, with the percentage of words which are not present on the list (these are known as difficult words). The method returns a grade estimate ranging from “Grade 4 and below” to “Grades 16 and above” which are equivalent to college graduates. The theory behind the use of familiar words as a metric, as opposed to letter or syllable count, is that tests have shown that readers typically find it easier to read, process and recall a passage if it is made up of familiar words [22,23]. However, this method has been criticised for failing to account for more complex structural relations within a text [24].
The Flesch-Kincaid Reading Ease formula follows a similar concept of determining the age of students who should be able to easily read a text [25]. This is achieved by attributing a score of 0–100 to the text; the higher the score, the easier the text. These scores are then associated with grades; scores above 90 indicate that the text is very easy and should be easily read by an average 5th grade student. The Flesch-Kincaid formula has become the chosen readability metric of many US Government Agencies such as the US Department of Defense. Also developed in 1948, the formula uses the ratios of words per sentence and syllables per word to calculate the score [26].
Another metric that assesses the U.S. grade level required to read sections of text is the Automated Readability Index (ARI) [27]. The index was designed in 1967 for real time readability on typewriters used by the military [28]. The origins of the formula dates back to the writing of manuals in the U.S. Navy, as the manuals used previously were written in a style which was above the reading capabilities of most of the staff. The ARI was validated as being more reliable and better suited to the technical nature of the text than other formulae such as Flesch-Kincaid [29]. Similarly, the ARI considers the words per sentence ratio, but it also includes the number of characters per word. This outputs a score that corresponds to the grade level required, but it exceeds the actual number of grades and reaches 14 (with this score corresponding to being above the level of a college student, for example a professor).
The Coleman–Liau index is the youngest of these formulae and was developed in 1975 to assess the readability of textbooks used in U.S. public schools [30]. Its creators deemed that counting syllables was too time-consuming and lacked accuracy. Therefore the Coleman–Liau Index uses the average number of letters per hundred words and also the number of sentences per hundred words [31]. This does have the drawback that it means that for shorter texts, these figures need to be extrapolated and thus may not be as representative. Once again, the numerical output is the estimated grade level required to read the text.
Whilst the Dale–Chal considers the familiarity of words, the other methods almost exclusively inspect the text as a collection of characters without considering the meaning of each word. Sentiment analysis is an area of machine learning which has seen exponentially more use in recent years. It aims to identify and extract subjective information from text which allows it to determine whether there is a positive, neutral or negative sentiment [32]. This process of perception is unconscious cognition within humans but until very recently was impossible for machines to achieve. Sentiment analysis techniques are incredibly powerful and are now being leveraged in fields such as market research, customer interactions and the analysis of social media activity [33]. Its entire premise is using computational linguistics to extract subjective meaning and information from text. In the regulatory context, all text is written in an objective manner to clearly outline regulations that must be adhered to and so sentiment analysis is redundant. Similarly, work done on phonetic analysis cannot be applied to this area either as it assesses speech rather than written text.
With this in mind, when exploring methods from other fields, it is important to consider the type of language that is used. Consequently, attention should be focused on similarly technical fields. The field of financial regulation was found to offer a wealth of previous work. This is largely due to an overhaul of financial regulation following the financial crisis of 2008. This increasingly stringent regulation has drawn attention, with a number of research papers investigating the change in complexity such as those by Gai et al. [34], Colliard & Georg [35] and Spatt [36]. Parallels can be drawn between this situation and the change in medical device regulation, therefore, the techniques should be transferable to a certain extent.
Historically, it was widely accepted in the field of financial research that the Gunning Fog Index was most suitable to measure the readability of documents and it was therefore almost universally used. First published in 1952 [37], the Gunning Fog Index is a metric that generates a grade level from 0 to 20 to indicate the level of education required to read the text, much like the other readability methods described earlier [38]. The formula combines the total number of words, number of sentences and also the number of complex words. Complex words are considered to be those consisting of three or more syllables, excluding common suffixes such as -es, -ed, or -ing. This list also excludes proper nouns, familiar jargon or compound words. A number of studies use the Gunning Fog Index, showing its popularity [39,40].
Despite being widely adopted, the method is not perfectly suited to for example financial text and this was highlighted by Loughran and Mcdonald [41]. At one point the Securities and Exchange Commission (SEC) considered using the Gunning Fog Index to gauge filings’ compliance with the SEC’s plain English initiatives, however, it was argued that it is ill-suited to analysing financial text, which inherently contains many longer words, despite these being well understood by analysts. Instead it was proposed that a focus on financial terminology and vocabulary that appears in a glossary and master dictionary is more pertinent to assess the readability. Though its efficacy may be questioned in a financial context, the Gunning Fog Index could be an interesting method to apply with the regulatory medical data field.
Whilst text containing intricate ways of describing concepts and elaborate language may once have been highly regarded and considered well written, there is now an ever growing desire for simplicity and effective communication in all fields. A prominent example of this is the Plain English Movement and other campaigns to limit the use of superfluous language and make technical text more accessible for everyone [42]. In some cases, these campaigns have published guidelines for individuals to refer to when drafting text to ensure that it is made as rudimentary as possible. Moreover, this drive for simple language extends further to regulatory agencies such as the SEC who provide very specific guidance in recommending that managers employ plain English attributes, by avoiding writing constructs like passive voice, weak or hidden verbs, superfluous words, legal and financial jargon, numerous defined terms, abstract words, unnecessary details, lengthy sentences, and unreadable design and layout in their financial disclosures [43]. The notion that the absence of such constructs makes text less complex (in a variety of fields that include medical, legal and military), is supported by many language experts [44]. It is with these considerations in mind that S.B. Bonsall IV et al. introduced a new readability metric by the name of the Bog Index [45]. The Bog Index aims to implement the concepts discussed above and one of its features is the way in which complexity is determined. The word complexity is derived from the principle of familiarity which is based on a proprietary list of over 200,000 words. This is in contrast to other techniques which assume that words are complex if they are multi-syllabic or contain many characters. Note that this is the primary criticism of the Gunning Fog Index from many language experts. The fundamentals of the Bog Index evaluate complexity using the trade off between Bog and Pep characteristics. Bog characteristics, as the name describes, bog the user down in unnecessary complexity such as jargon. Conversely, Pep identifies writing attributes that facilitate the understanding of texts by readers. The lower the Bog score, the easier the text is to read. 0–20 is considered excellent, most business and government writing scores 60–100 but some legal texts score over 1000 [46].
Colliard and Georg [35] also aimed to quantify the complexity of financial regulation by methods other than the mere length. In their work they attempted to achieve this by treating the regulation as an algorithm, using concepts from computer science literature to consider the rules for how an input leads to an output (the regulatory decision). The concept of operators and operands is the core feature of this analogy. This approach to complexity was pioneered by Maurice Howard Halstead [47]. The principle is that by segmenting a computer programme into its constituent parts, the relationships between these entities can be used to measure the algorithmic complexity. The two classes are known as the operators and operands and this logic is applied to financial regulation by [35]. Several techniques translate financial information such as balance sheets into pseudo-code to implement the algorithms developed. These methods will not be considered here due to the discrepancies in the format of the regulations. Instead, focus will be placed on methods designed for treating text. Words can be classified according to their function as either operands or operators, using the classification system proposed by Colliard and Georg. The focus is then to translate the algorithmic complexity from code to text-based analysis. The operators are words such as “and” or “excluding” which serve as logical connectors within an algorithm or, in this case, a sentence. “Operands” on the other hand are variables and parameters represented by values (e.g., “seven years” and “10 days”), concepts (e.g., “maturity” and “expiry”) or entities (e.g., “manufacturers” and “council”). Words used for grammatical reasons (e.g., “by”, “on”, “the”) can be ignored as they don’t correspond to either operators or operands. Instead they are classed as function words which serve to ensure coherence of the text. The concept of unique operators and operands refers to words from those categories that have not been previously used in the text up to that point. A series of formulae relating the quantities of operators, operands, unique operators and unique operands were first developed by Halstead, but have since been tailored and added to by other papers including research by David Flater [48]. A combination of these equations can be used to assess the complexity of the regulatory text.

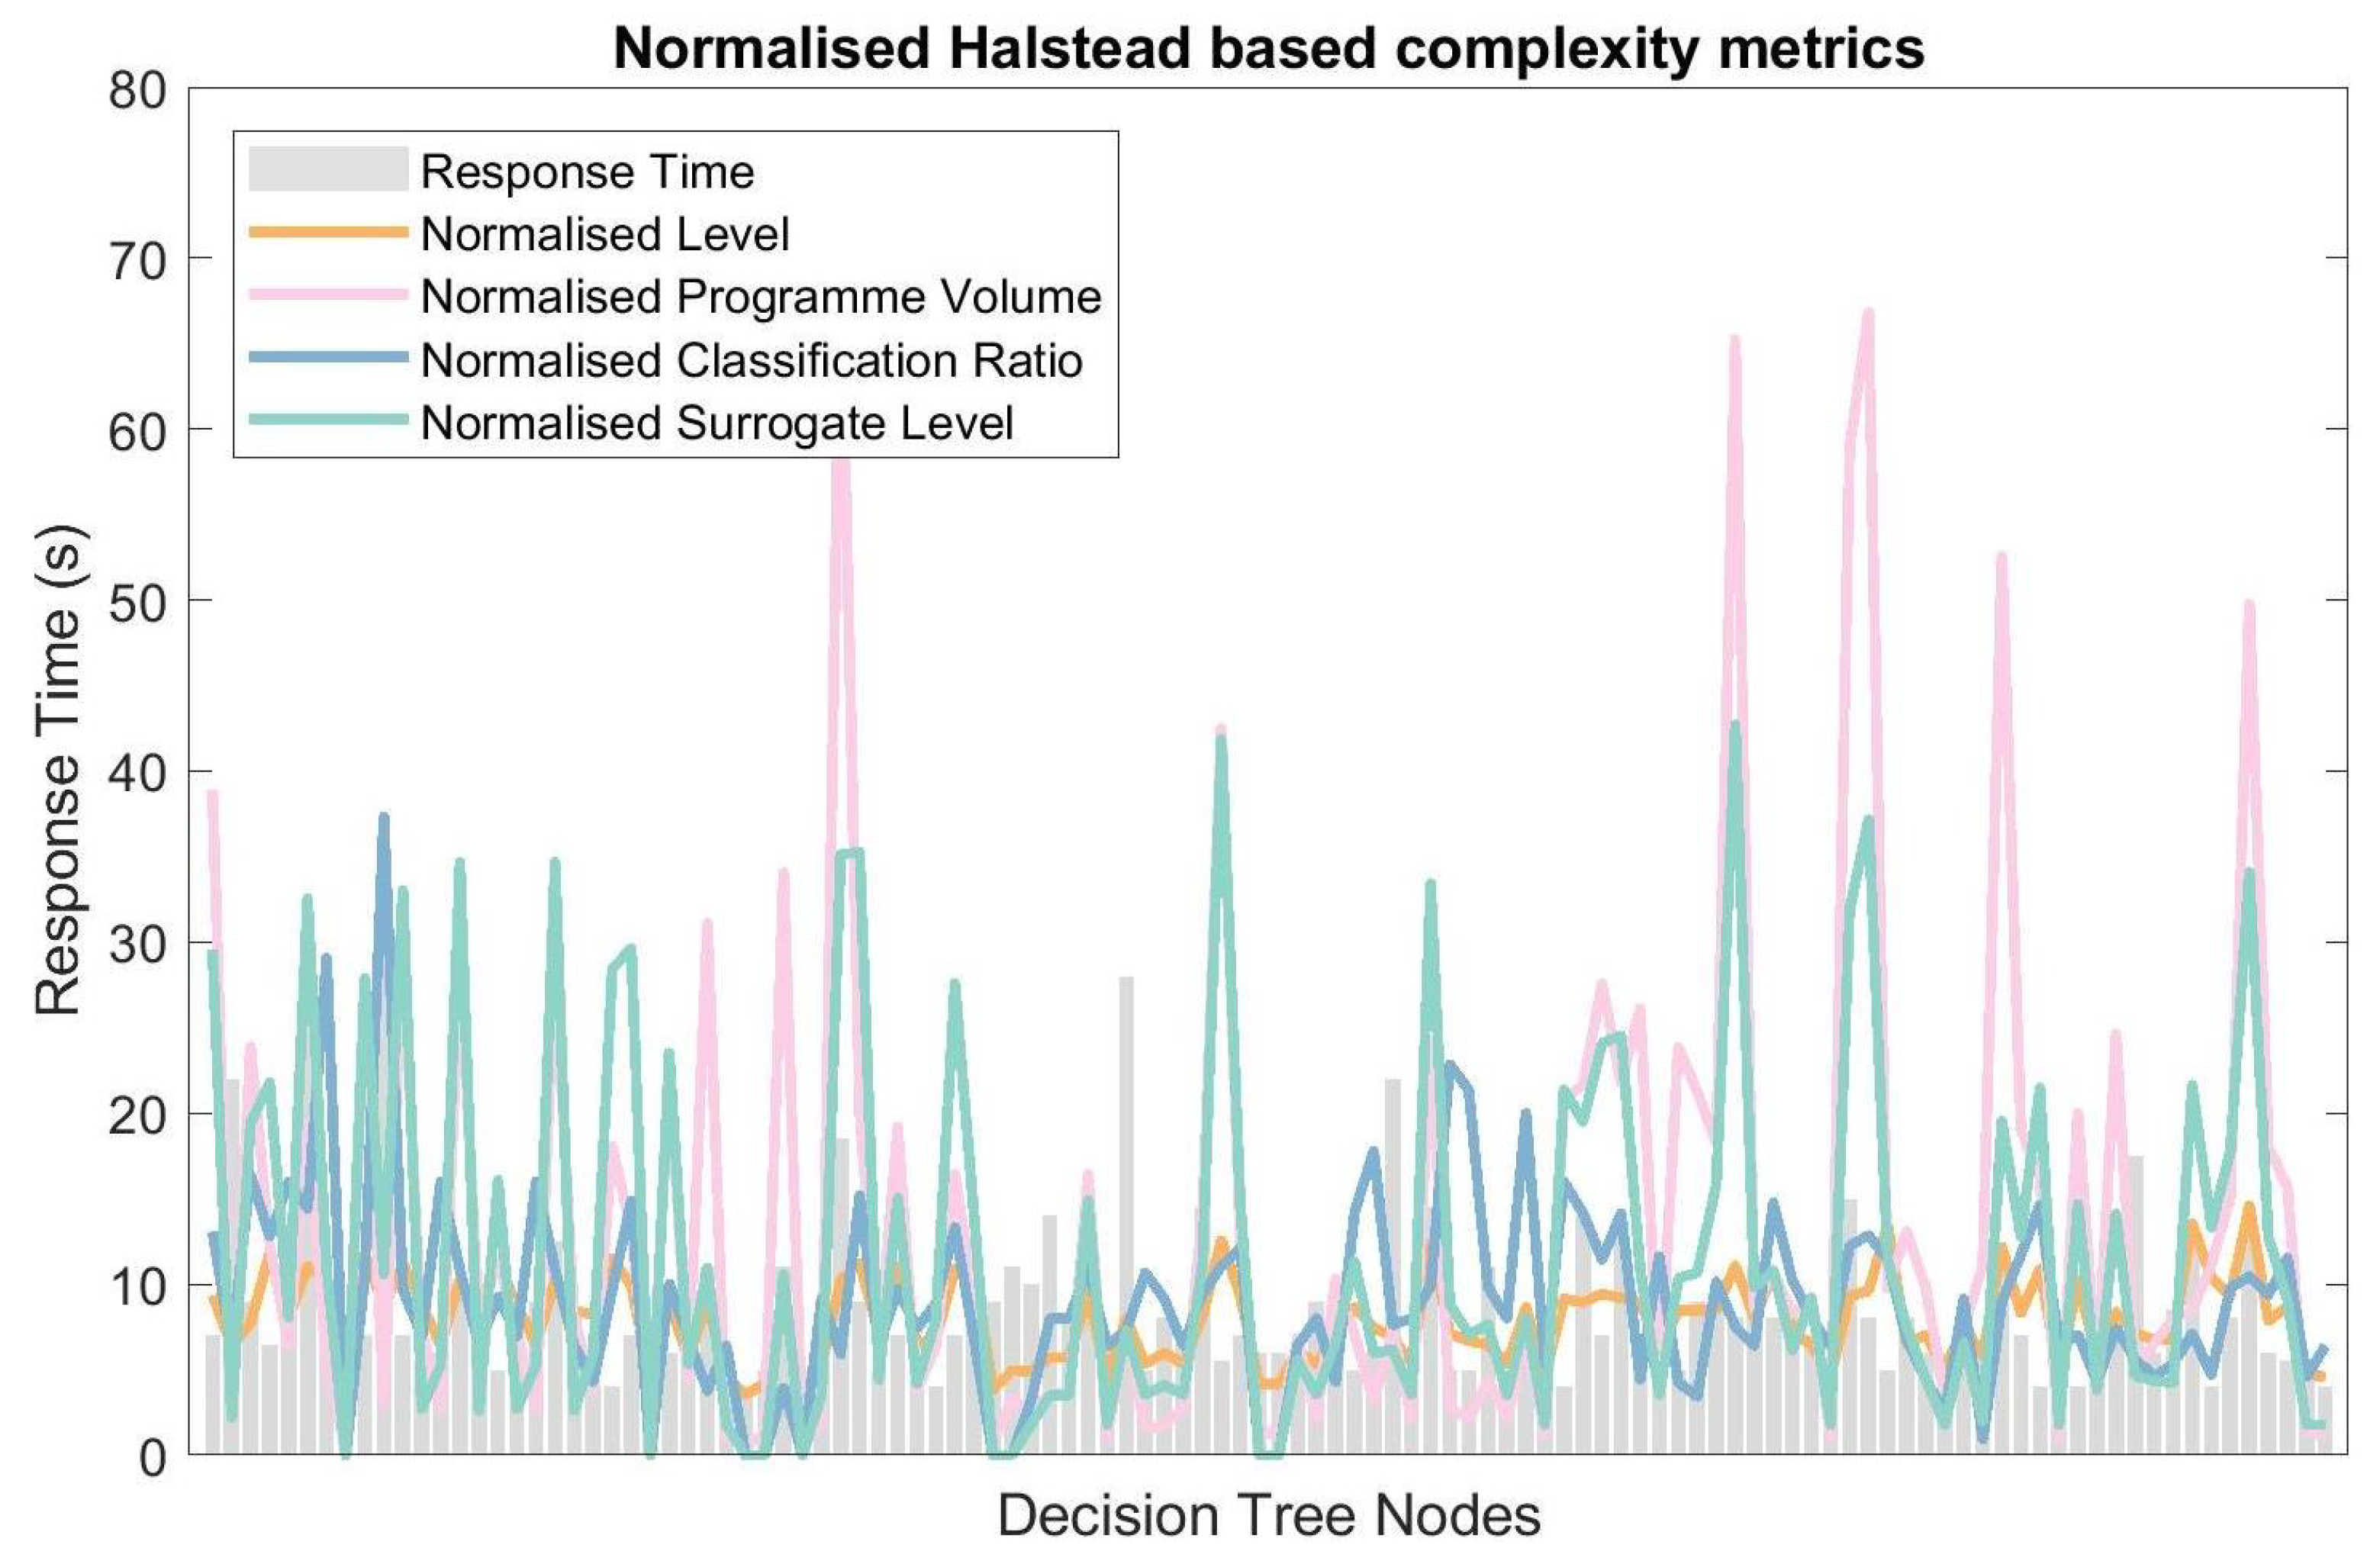
2.2.2. Complexity and Response Time

Time driven methods can provide a further insight into the complexity of the regulations in addition to metrics that are obtained directly from the available text. Text length is often positively associated with overall complexity and therefore response time. This theory also translates to question length, with longer questions requiring more cognitive resources and therefore being more likely to interfere with the mapping process. This suggests that question length is likely to be positively associated with the prevalence of both comprehension and mapping difficulties. However, if a question is long because the author has taken care to explain its intent fully, then comprehension will actually improve [49]. The medical device regulations can be posed as a set of questions [50], which allows for further exploration of this metric. One can then even incorporate a suggested minimum of 3 s that is considered needed to perform cognitive tasks and formulate responses to questions [51]. Applying this to the context of questions can provide a sense of expected response times once the reading time and answer selection time is accounted for.
Time-based data for medical regulations can be obtained from a rule-based classifier that is available online [52]. The questions have been ordered using a rule-based decision tree which leads the user through the nodes within the tree, ensuring that users only encounter questions that will aid the classification of their device, based on their previous responses. The technical text is made more accessible through the use of glossaries and examples to contextualise the information. The terms contained within the glossary are those which are defined individually in the definitions sections of the MDR and IVDR regulations. To accurately represent the classification guidelines, phrases of each question posed in the digital tool retain wording from the regulations, which provides a clear mapping back to the regulatory content published by the EU. Each user’s interaction with the tool is recorded, which creates a unique database (that will be referred to as OGGD in this paper). Due to the importance of speed and simplicity in the classification process, the time taken to respond to each rule in the decision tree is used as a metric for the regulatory burden that each question places on the user.

2.2.3. Research Aims

The first aim of this paper is to explore how the complexity of the medical device regulations has changed when the MDD/IVDD was replaced with the new MDR/IVDR. The aforementioned complexity metrics can be applied to objectively assess this and determine to what extend regulations within the EU might have increased in complexity. Secondly, an association between the time it takes to consider parts of the regulation and the complexity of these parts will be investigated. This would provide an idea on how the complexity of regulations maps onto the user experience. It also provides an additional metric with time itself acting as an surrugate for complexity.

3. Materials and Methods

3.1. Linguistic Complexity of Regulatory Documentation

A descriptive analysis will be performed on the available textual data. This will include the total number of pages, letters, words and syllables. In addition, the average word length will be determined for each relevant document.
Subsequently, a set of readability metric scores will be computed consisting of the Dale–Chall Readability score, Automated Readability Index (ARI), Coleman Liau Index, Gunning Fog, Flesch Kincade Grade and Bog Index. The formulae for these can be found in the Table 1. In the case of this paper, the output from each formula will be retained in its raw form for analysis as it is the variation of scores between questions that is of interest rather than the variation of estimates across individual techniques.
The Bog Index will also be determined, including contrasts Bog and Pep features which ultimately determine the Bog score for the text [45]. The StyleWriter software [46] is used to process the text in order to obtain Bog metrics.
B o g I n d e x F o r m u l a = S e n t e n c e B o g + W o r d B o g P e p
S e n t e n c e B o g = ( a v e r a g e s e n t e n c e l e n g t h ) 2 l o n g s e n t e n c e l i m i t
W o r d B o g = ( s t y l e p r o b l e m s + h e a v y w o r d s + a b b r e v i a t i o n s + s p e c i a l i s t w o r d s ) × 250 n u m b e r o f w o r d s
P e p = ( n a m e s + i n t e r e s t w o r d s + c o n v e r s a t i o n a l ) × 25 n u m b e r o f w o r d s + s e n t e n c e v a r i e t y
For the Halstead-based methods, the first step was to classify words as either operators or operands. However, inferring the class of the elements of medical device regulations is novel and there is no preceding literature which can be used as a benchmark. Online scientific glossaries were used alongside the financial classification lists published by [35] and some case-by-case discretion to compile two distinct dictionary lists of words. Combined, these contained over 100,000 words, primarily medical in nature, which were utilised to assign classes. Words that were not contained within either the list of operators or that of operands were assigned to the “other words” category. These contained primarily function words that are included to make the text readable and coherent. The count of unique operators n 1 , total operators N 1 , unique operands n 2 and total operands N 2 formed the basis of the different approaches to quantifying complexity in the text (defined as “programme” for this approach). The metrics for complexity begin in a similar vein to the numerical techniques by associating psychological complexity to the length of the parts of the algorithm. Programme length, vocabulary size and programme volume, which actually measures the length of the binary encoding of the programme in software, all fall into this category. The remaining methods are in form of the ratio of total operators to total operand and the two programme level constructs, which take into consideration the most efficient expression of the programme by considering unique words. The equations for these methods are outlined below.
P r o g r a m m e L e n g t h , N = N 1 + N 2
V o c a b u l a r y S i z e , n = n 1 + n 2
P r o g r a m m e L e v e l , L = ( N 1 + N 2 ) ( 2 + n 2 )
S u r r o g a t e P r o g r a m m e L e v e l , L ^ = ( n 1 × N 2 ) ( 2 × n 2 )
C l a s s i f i c a t i o n R a t i o , C = N 1 N 2
P r o g r a m m e V o l u m e , V = N log 2 n

3.2. Data

Complexity of the text was determined for the European Union regulatory documentation that consisted of the new Medical Device Regulations (MDR) [12]/the In Vitro Diagnostic Regulations (IVDR) [15] and the older Medical Devices Directive (MDD) [13,14]/In Vitro Diagnostics Directive (IVDD) [16,17].
The time data was obtained from a online tool that mapped the MDR and IVDR on to a rule-based classifier [52]. Complexity of the text was determined for each node of the classifier. These nodes consisted of questions that cover specific parts of the regulations. The response time reflected the time it took to consider the relevant regulatory text and answer the question accordingly. This response data was generated using timestamps from users’ interactions with the online regulatory text [52]. Upon submitting a response to a question on the corresponding web page, the user is then brought to a new web page corresponding to the next question to be answered according to the rule-based decision tree nodes. This submission generates an entry into a database which records the question number, the number of questions answered up to that point in the session, the answer submitted, the user’s unique identification (ID) and the session ID. The time of answer submission is recorded as a timestamp and it is the difference between the timestamps for two successive questions that is used to calculate the time spent answering a particular question. In total the data set contains information for 903 unique user sessions, covering 112 questions. Data anonymization was performed, so there was no identifiable information about the users that generated the data.

3.3. Data Processing and Analysis

All readability metrics of the text were divided by taking the median of the full data set for a particular metric in order to aid the visual comparison. The same processing took place for both the data obtained from the legal documentation, as well as the online tool.
All outliers for the time data, in the form of response times less than 0.1 s in length and those greater than an hour, were removed. A total of 17,903 response data points were remaining. These were generated from 903 unique user session IDs, with a mean number of questions per session of 19.8. They covered responses to 112 nodes from the online tool. The time data had skewed distribution and thus the median was used for the analysis of the response times which were calculated for each node in the classifier. The readability metrics are computed for each of the 112 questions that are included in the online tool and represent the text in both the IVDR and MDR.
Pearson’s Correlation Coefficients were computed between response times and the aforementioned complexity metrics. Data processing and analysis were done using Python (3.8.0, Python Software Foundation, Wilmington, DE, USA).

4. Results

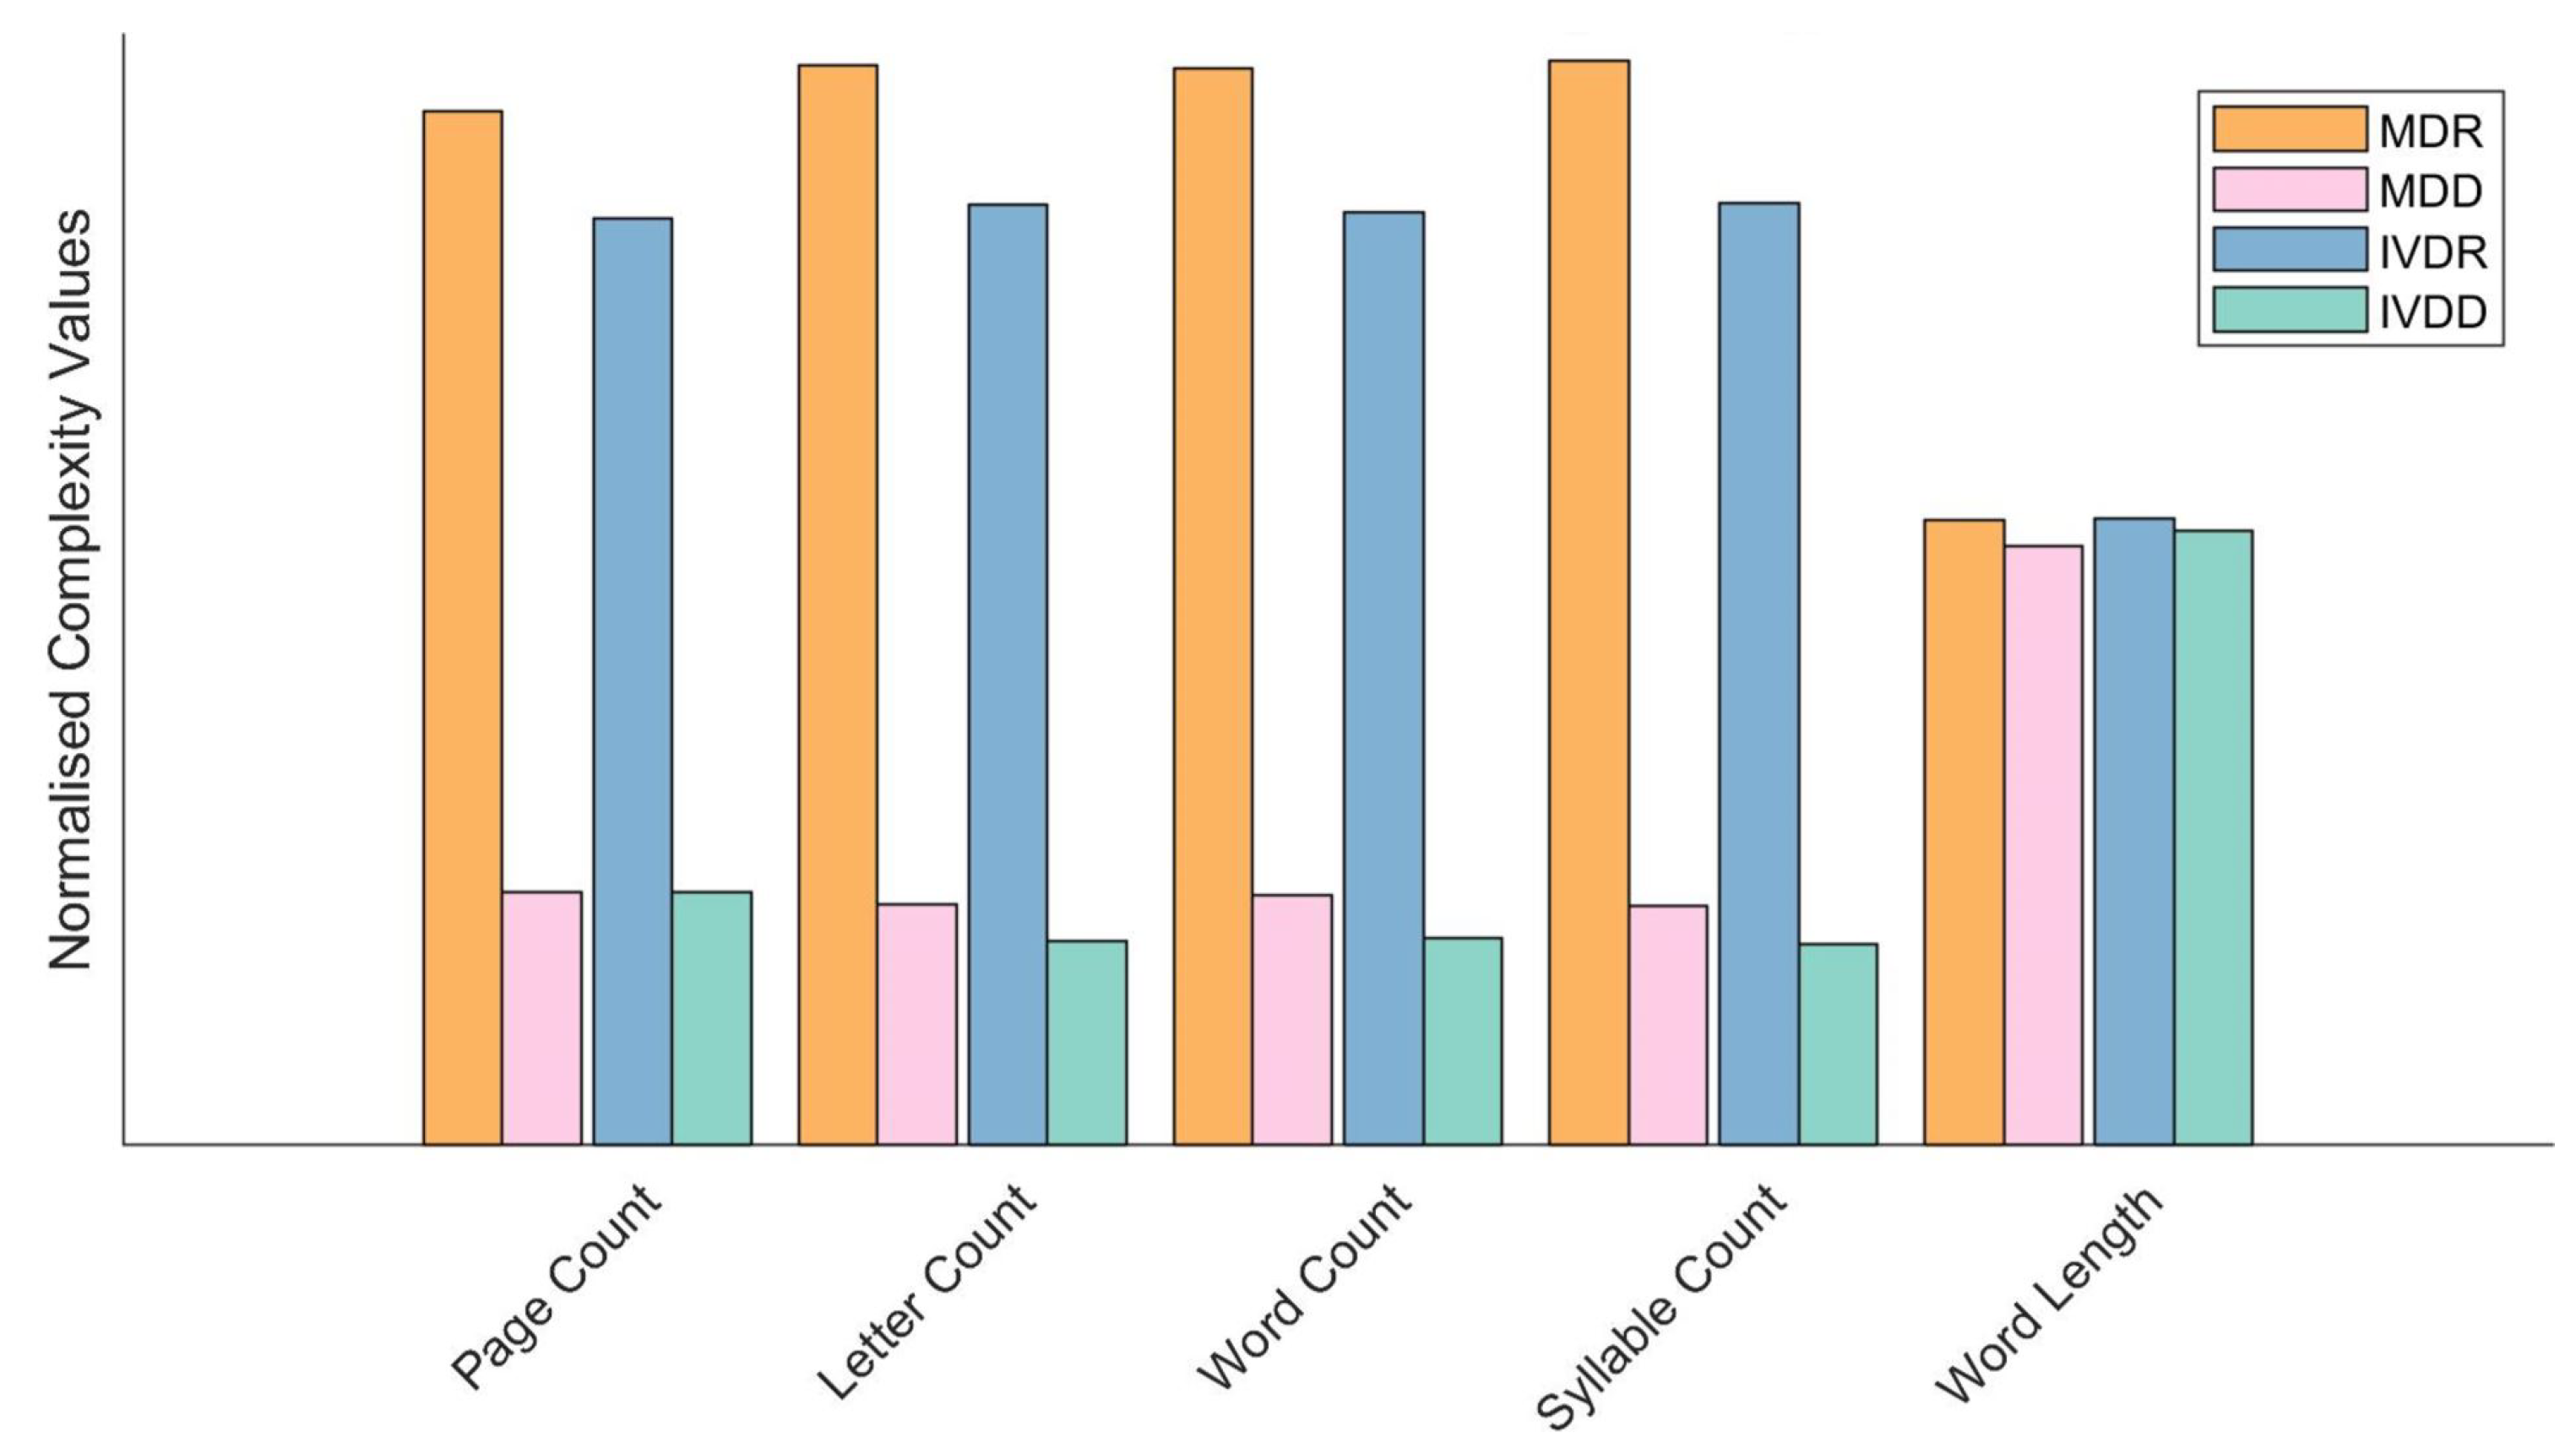
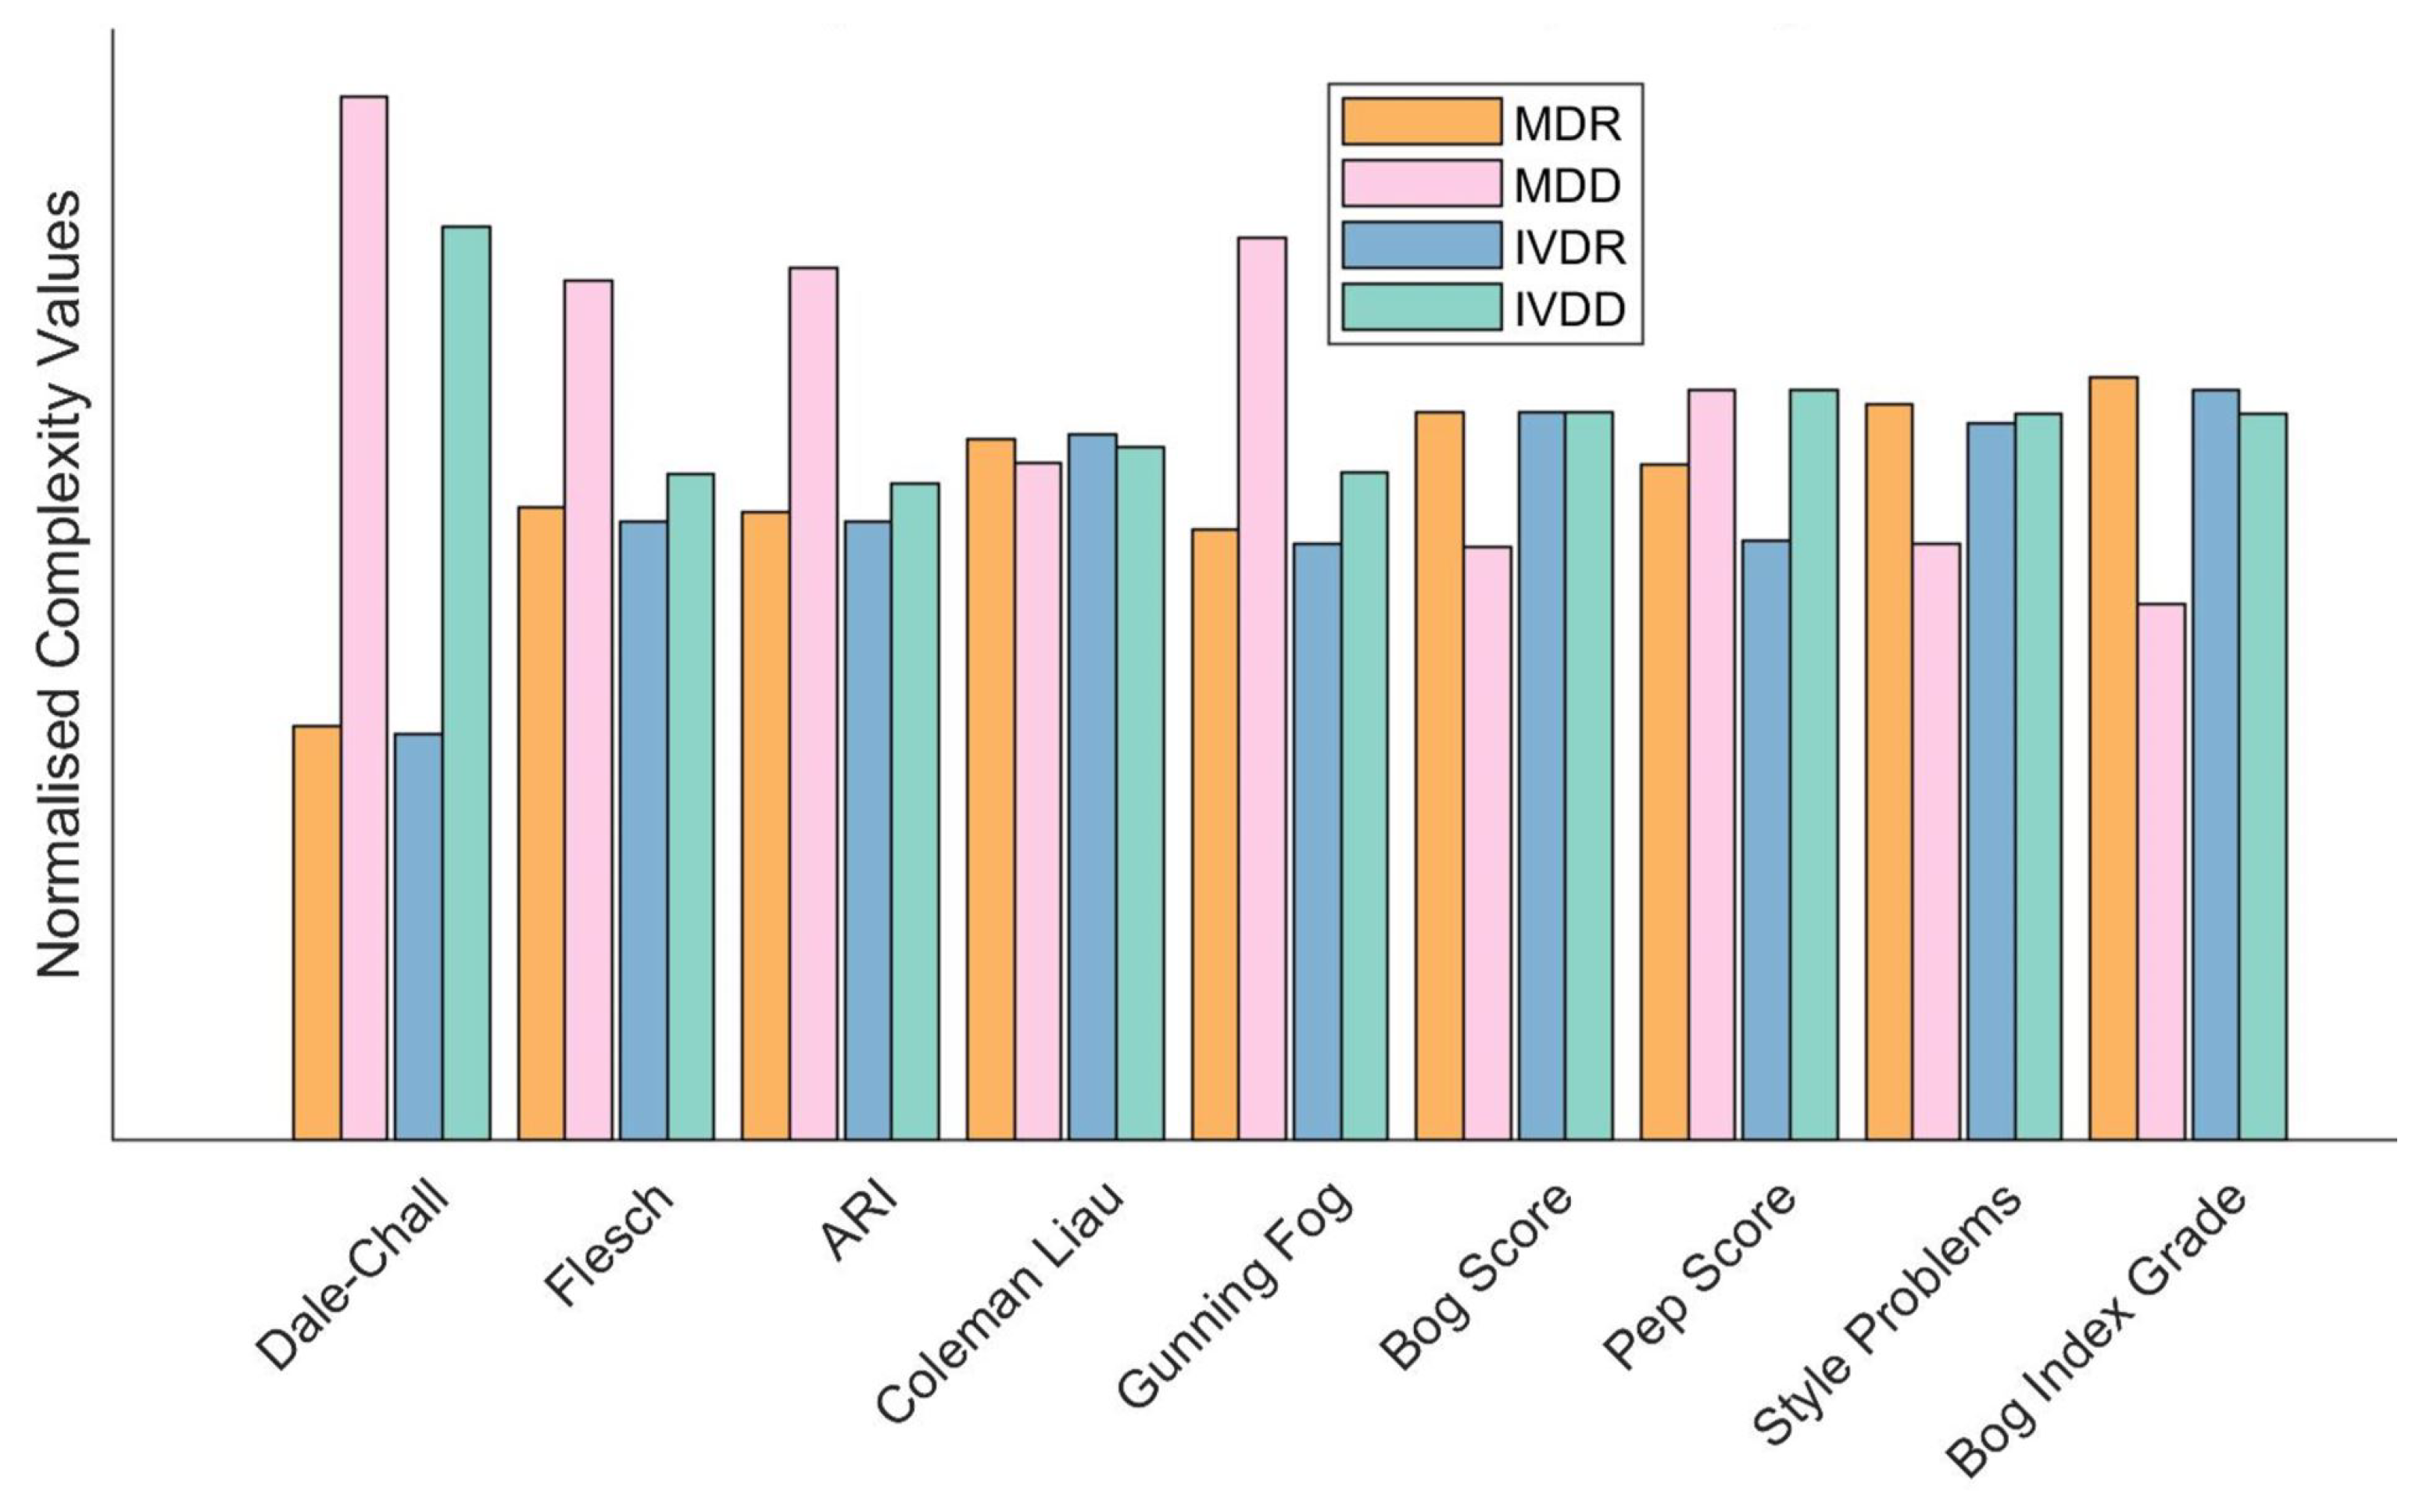
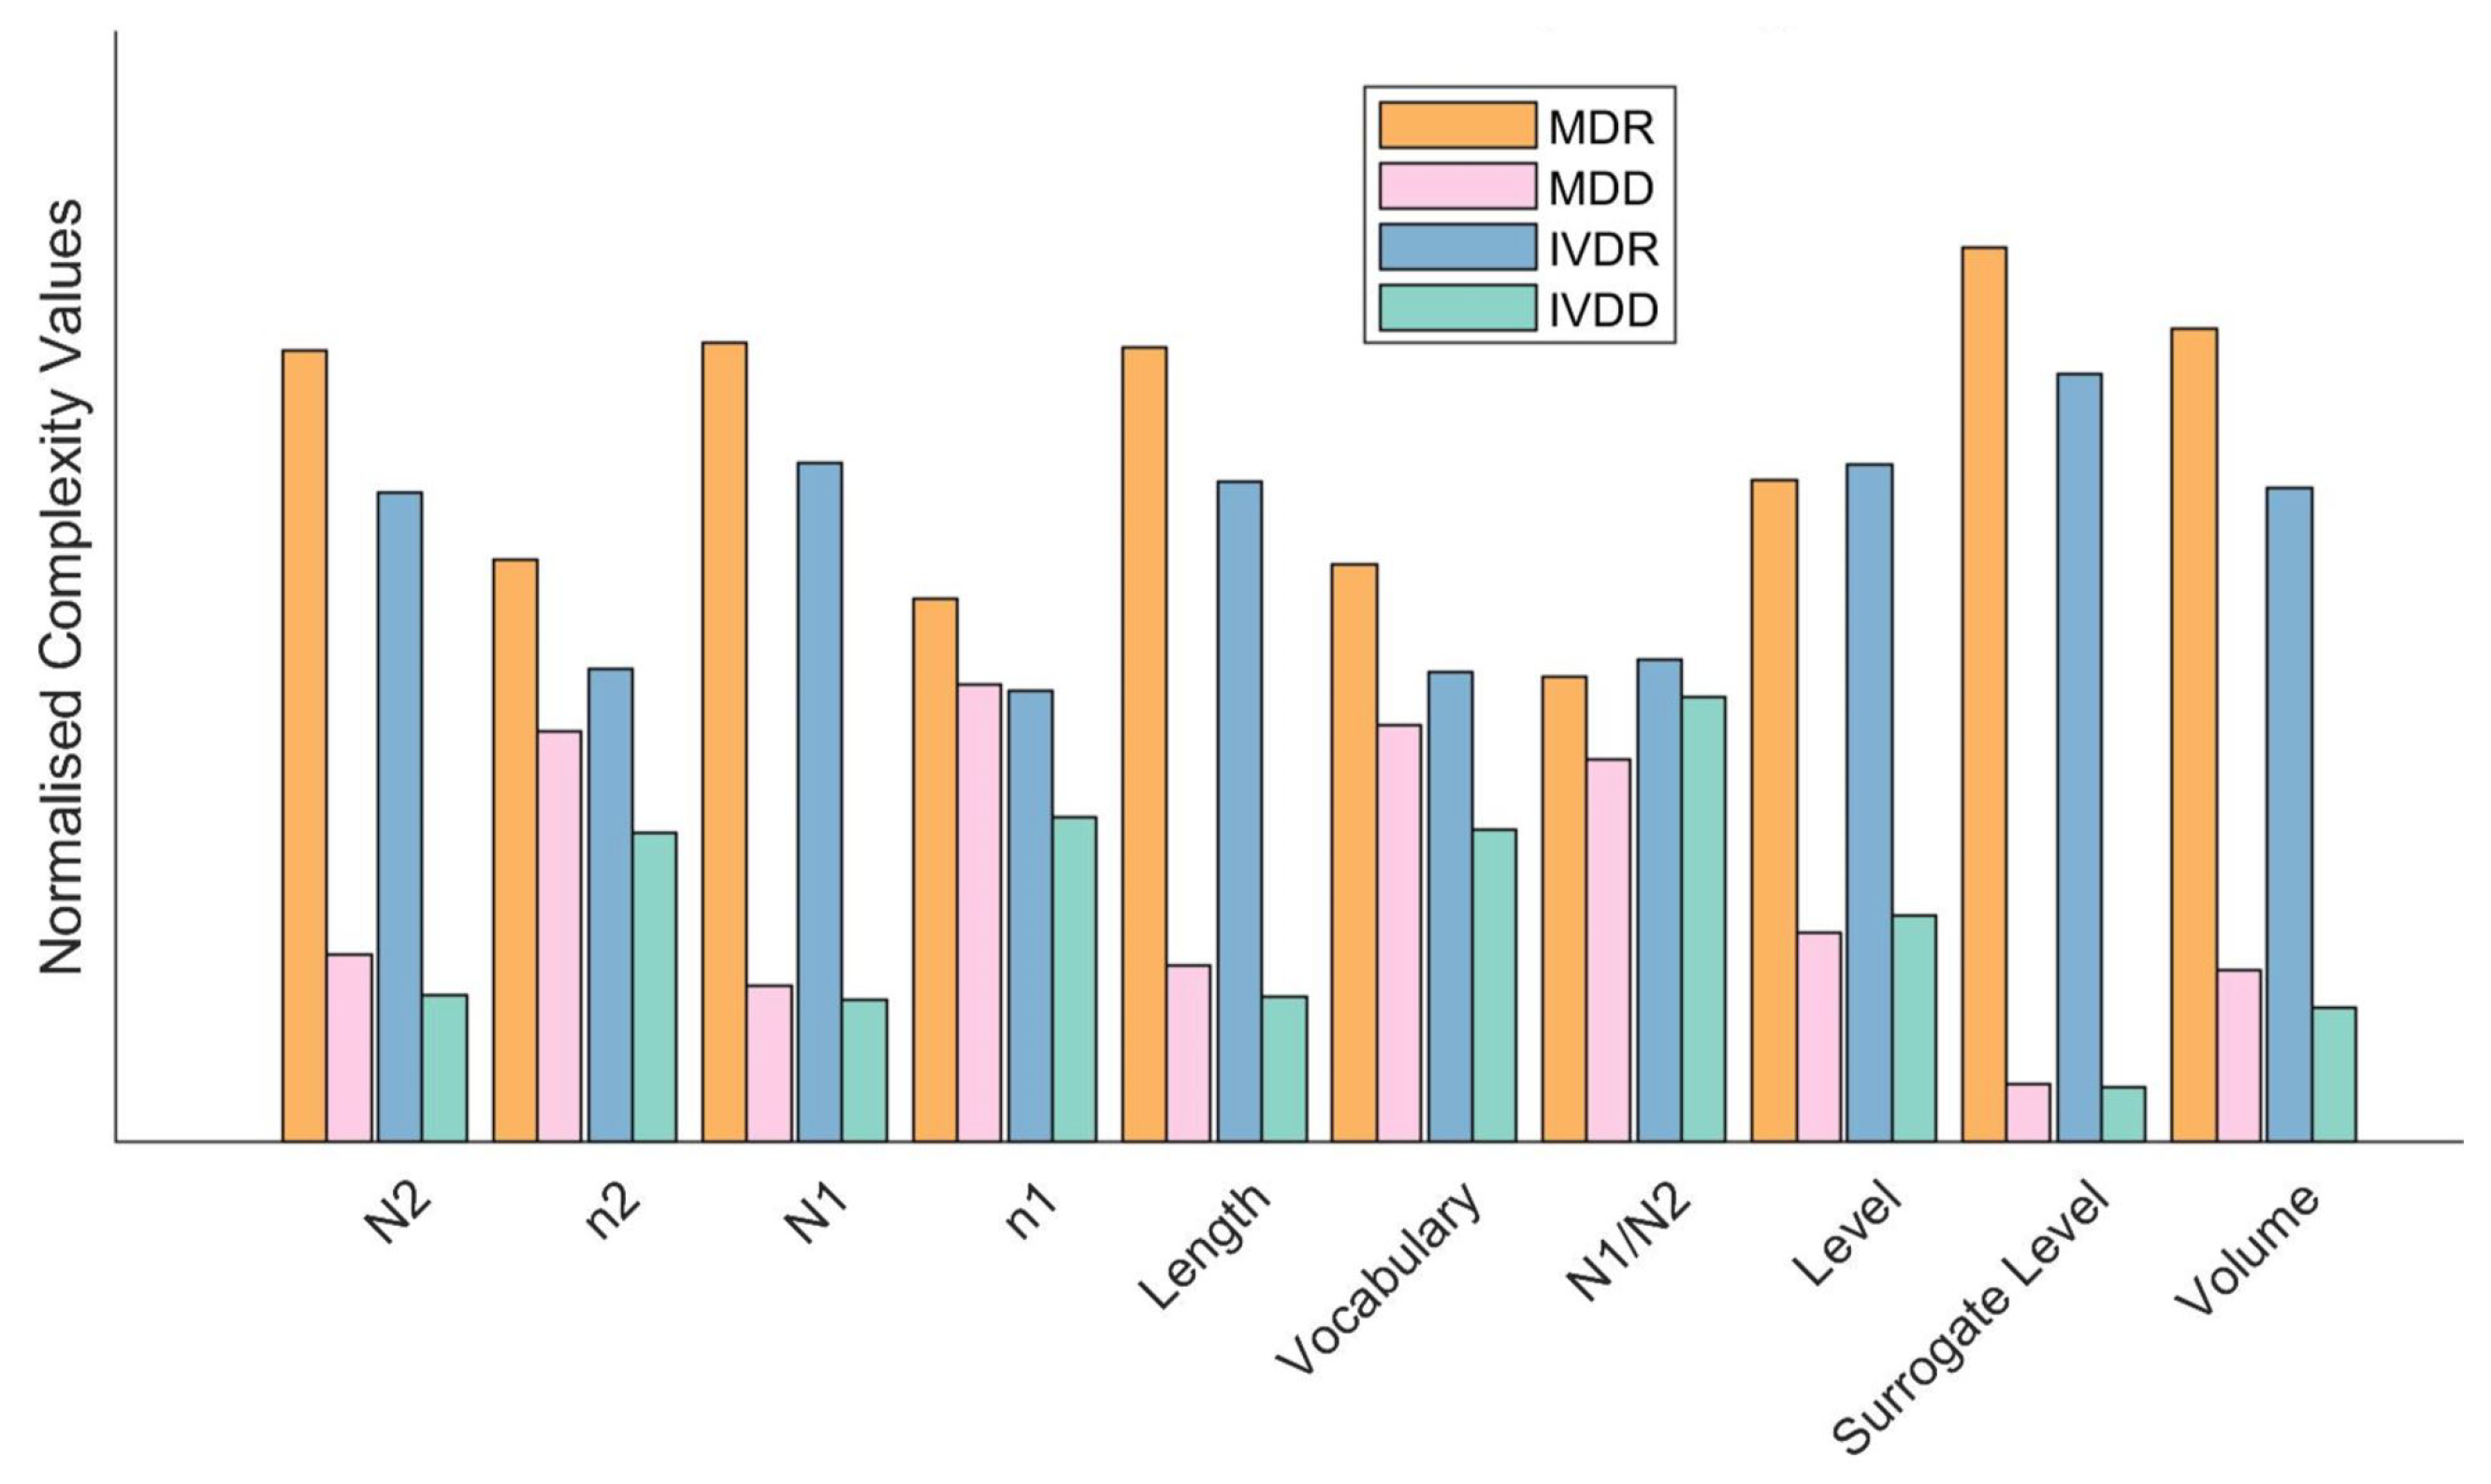
4.1. Linguistic Complexity of Regulatory Documentation

The overall count of the MDR/IVDR compared to the MDD/IVDD has increased according to every metric, with some increase in the average word length as well (Figure 1).
The outcomes of the readability scores applied to the overall documents are shown in Figure 2.
The Halstead-based complexity analysis is shown in Figure 3. All the metrics increased when new regulations (MDR/IVDR) were compared to the previous legislation.

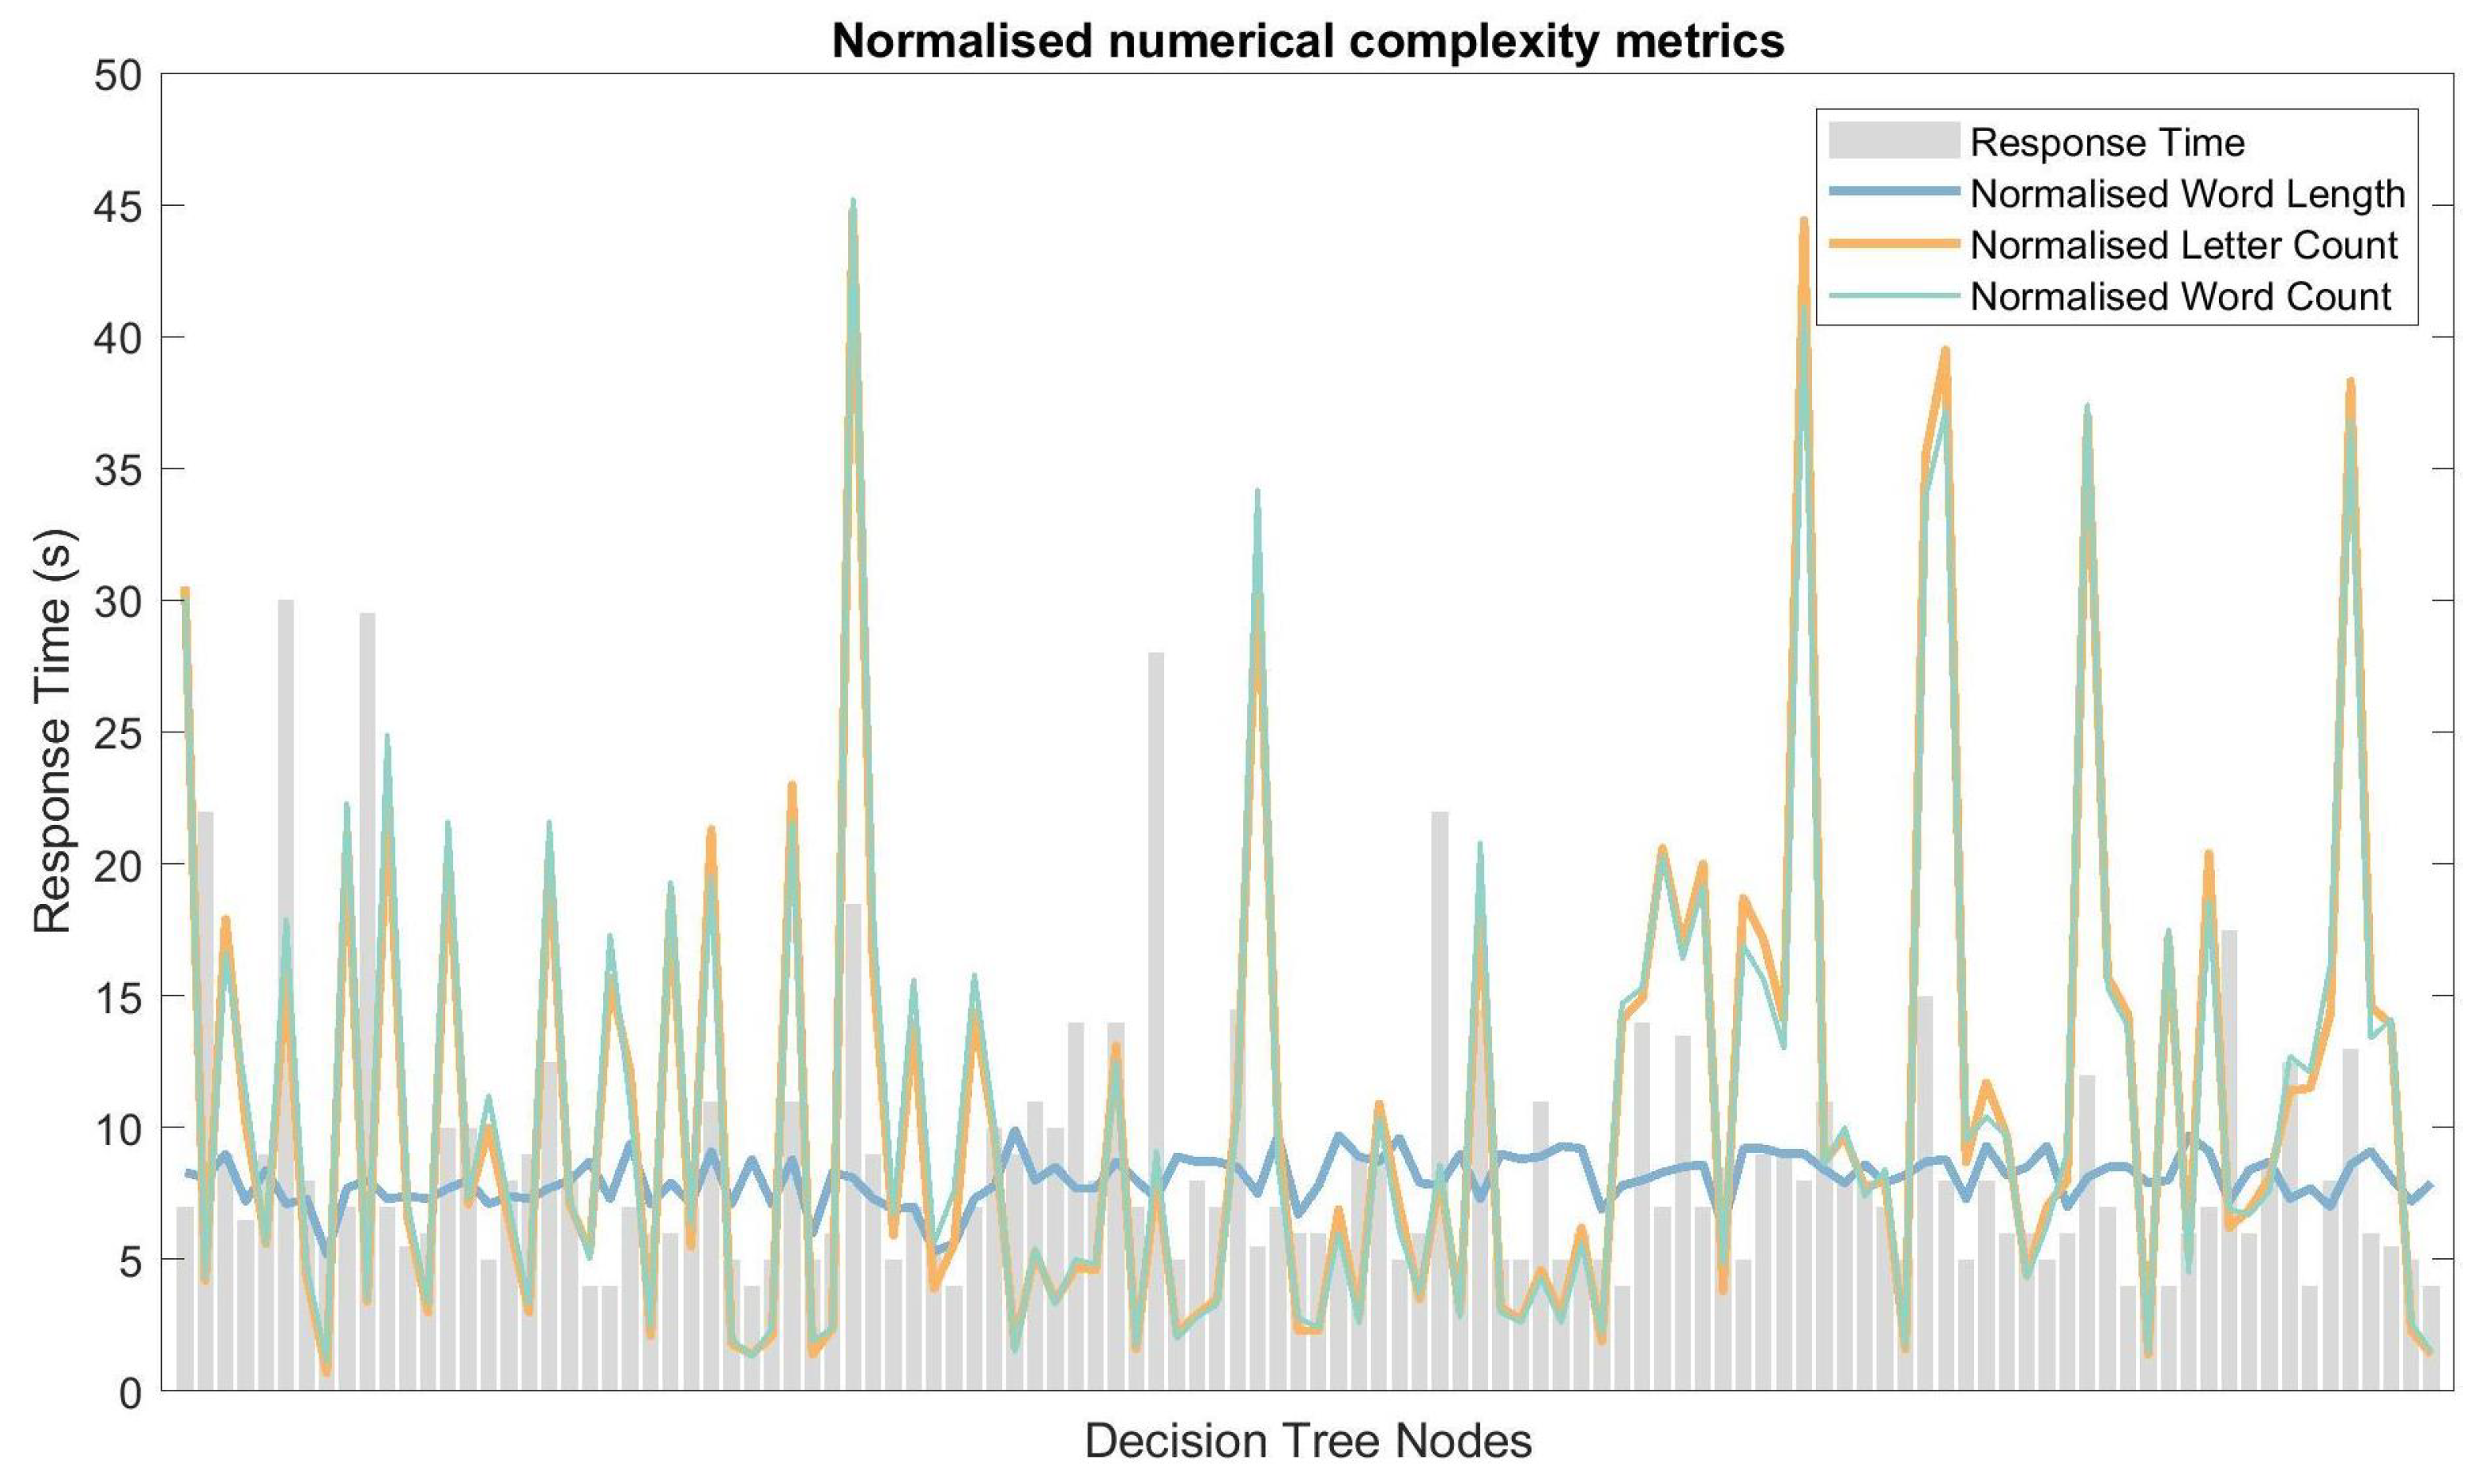
4.2. Response Time and Linguistic Complexity

Having removed the outliers, in the form of response times less than 0.1 s in length and those greater than an hour, there were 17,903 response times remaining. The majority (96.7%) of question/node response times were within a minute, with the median being 7 s for the overall dataset. Figure 4 shows a box and whisker plot for all of the nodes.
Figure 5 shows the median response time for each question plotted as a bar graph which is overlaid by the normalised values for three numerical complexity methods: Word length, letter count and word count. The variation in mean word length is smaller than the differences in overall question text length.
The readability scores for all 112 questions is shown in Figure 6. The histograms are overlaid on top of one another and there is a range of spread between the distribution of scores.
The correlation coefficients for each of the readability methods are tabulated in Table 2. The Dale–Chall has the lowest absolute Pearson’s correlation coefficient, whilst the strongest association is found between the word count and response time.
Four Halstead-based complexity metrics for each question are plotted with the response times overlaid upon it as a bar graph (see Figure 7).
The Pearson’s correlation coefficients for Halstead-based complexity metrics are shown in Table 3. The lowest correlation coefficient was found for operand count and the highest was for the classification ratio. However, there was only a difference of 0.035 between these coefficients.

5. Discussion

In general, the majority of the complexity scores indicate that complexity increased with the implementation of the new legislation. The most important contributor to this seems to be the vast increase in length of the documents. This has undoubtedly made the regulations more difficult to negotiate for users.

5.1. Linguistic Complexity of Regulatory Documentation

The most complex words found in the regulations are in the form of technical medical references. While these words may be hard to understand, they are not particularly long. This is different to what is found for words in a non-scientific context where word length is indicative of complexity [53]. The findings of this study suggest that the conventional readability metrics may need to be further improved for use within a regulatory context and it echos the limitations summarised by Redish [54]. The techniques that were applied are actually used in many fields as the default measures of complexity. However, they are likely to fall short in similar ways as seen in this paper.
The Dale–Chall method, based on a set list of common words, did not yield a strong association with response time. This is understandable as the list of words was not designed with either scientific or technical objectives in mind and thus it would be constrained for this task. Perhaps a similar list, which had been tailored for for regulations could perform better. The Gunning Fog method also looks at a ratio of complex words and raises similar concerns as also seen in technical financial fields [45]. The Coleman Liau Index was designed to average metrics over 100 words, but several regulatory segments that need to be considered consisted of regulatory “questions” that were considerably shorter than this. Several approaches also heavily relied on the average word length, which might not capture complexity well in regulations. The ARI is the only method that was designed with technical content in mind, which should make it more suitable. However, it does not fully cover the regulatory context. Finally, there is the Bog Index which is far more recent and uses a more developed method to assess the complexity. This method gives importance to style and Pep, which is the way in which the language can serve the interest of the reader. Neither of these are considerations for writing regulation. Consequently, it was hard to differentiate between many of the regulatory text in this regard, which is reflected in the histograms of Bog Index scores. It should be noted that more sophisticated metrics need to be developed to capture the regulatory complexity more accurately. These metrics provide an initial assessment, but are limited in terms of measuring the nuances that are present within the regulatory text. Despite these limitations the metrics due seems to indicate a similar trend in terms of the complexity increase seen in the new regulations.

5.2. Response Time

The box plot with the individual nodes demonstrates how the spread of samples for each question varied (see Figure 4). These differences would be amplified without applying a log scale for the response time. Certain nodes have very tightly packed response times while others see a vast spread of times. This could be explained by the nature of each question. Some questions could be perceived as easy (or difficult) by most users and thus their response times will be very similar. However, other questions which are particularly technical or specific to a certain field may polarise the user cohort with some users having significant difficulties, which can explain the variation in ranges for response times. It is hard to account for this and perform robust corrections on the data. Yet, increasing the size of the data set could cover a more representative set of users.
The current data set consisted of over 17,000 unique response times. However, a larger data set can help further increase the external validity of the research findings. Furthermore, no in-depth information was gathered with regards to the response times that were generated, due to the fact that data was anonymised. Future studies can aim to collect information on the expertise of the user, device type considered and confidence of answering a particular question. This could create a better model, which can help to explain the response times that were observed.

5.3. Response Time and Linguistic Complexity

Only a (very) weak relationship was found between the response times and the complexity of the questions. This could be due to the lack of variation in the complexity measures. However, there are other factors that can also influence the strength of the association. Information was missing with regards to the specific intent of the device considered for the questions, the user’s knowledge on regulations and a reliance on the outcome of the classifier. Therefore, the strength of these associations should not be considered to generalise easily. Response time data under more controlled settings can yield important additional information that can be used to build a more robust model to determine if there is not a stronger link between complexity and time. It should also be noted that the time spend on the questions might not be fully representative of the overall time spend on considering it. These are limitations that can be addressed in future studies.

5.4. Considerations

The techniques presented here offer a starting point to better understand the complexity of regulations. As shown there is no clear association between the time spent on a regulatory question and the associated complexity. However, it should be noted time only focuses the (instant) answer of the classification questions and therefore just captures the first steps in the regulatory process. More work can be done to objectively study the time consideration across the full application of the regulatory text. Using more data-driven methods can greatly increase our understanding of the regulations and allows to generate better questions that can help improve future regulations [9].
The complexity of a legal text can form a barrier to innovators. Understanding the complexity can therefore be essential in optimising the pathway for new devices. The increased complexity found in this study highlights the importance of improving education and guidance. Previous research already showed that more can be done to provide further support in terms of education [55] and this should be considered by stakeholders as complexity of regulations increases. Regulations that are currently being created can benefit from considering these aspects during the development process. These preliminary findings from this paper propose that the complexity of regulations should be reduced, with a focus on making them more accessible and utilitarian. This would improve the stakeholder adherence and facilitate effective implementation, which in the long term will improve patient welfare.

Author Contributions

Conceptualization, R.H. and J.B.; methodology, A.A. and J.B.; software, A.A. and J.B.; formal analysis, A.A.; investigation, A.A., R.H. and J.B.; resources, R.H. and J.B.; data curation, R.H. and J.B.; writing—original draft preparation, A.A. and J.B.; writing—review and editing, A.A., R.H. and J.B.; visualization, A.A.; project administration, R.H. and J.B.; funding acquisition, J.B. All authors have read and agreed to the published version of the manuscript.

Funding

This research was funded by the European Institute of Innovation and Technology (EIT) Health and supported by the National Institute for Health Research (NIHR) Oxford Biomedical Research Centre (BRC).

Institutional Review Board Statement

The study was approved by Central University Research Ethics Committee (CUREC): R63968/RE001.

Informed Consent Statement

Informed consent was obtained from all subjects involved in the study.

Data Availability Statement

All data on complexity were obtained from public documents and references are provided in the manuscript whenever they are discussed.

Conflicts of Interest

The authors declare no conflict of interest.

References

  1. KPMG. The Changing Landscape of the Medical Devices Industry in the APAC Region. 2020. Available online: https://assets.kpmg/content/dam/kpmg/jp/pdf/2020/jp-medical-device-apac-en.pdf (accessed on 25 July 2021).
  2. Insights, F.B. Medical Device Market Size, Share and Industry Analysis by Type. 2021. Available online: https://www.fortunebusinessinsights.com/industry-reports/medical-devices-market-100085 (accessed on 25 July 2021).
  3. Office for Life Science. UK Medical Technology Sector, Bioscience and Health Technology Sector Statistics. 2019. Available online: https://assets.publishing.service.gov.uk/government/uploads/system/uploads/attachment_data/file/910441/Bioscience_and_Health_Technology_Statistics_2019_Infographic_-_Medical_Technology.pdf (accessed on 25 July 2021).
  4. Em Agency; AGENCY, E.M. Medical Devices. Available online: https://www.ema.europa.eu/en/human-regulatory/overview/medical-devices (accessed on 25 July 2021).
  5. World Health Organization. Medical Device Regulations: Global Overview And Guiding Principles. 2003. Available online: https://apps.who.int/iris/handle/10665/42744 (accessed on 25 July 2021).
  6. Medical Device Coordination Group. Regulation (EU) 2017/745: Clinical Evidence Needed for Medical Devices Previously CE Marked under Directives 93/42/EEC or 90/385/EEC. A Guide for Manufacturers and Notified Bodies. Available online: https://ec.europa.eu/docsroom/documents/40904 (accessed on 25 July 2021).
  7. World Health Organization. Guidance for Post-Market Surveillance and Market Surveillance of Medical Devices, Including IVD; World Health Organization: Geneva, Switzerland, 2020. [Google Scholar]
  8. Soliman, E.; Mogefors, D.; Bergmann, J.H. Problem-driven innovation models for emerging technologies. Health Technol. 2020, 10, 1195–1206. [Google Scholar] [CrossRef]
  9. Ceross, A.; Bergmann, J. Evaluating the Presence of Software-as-a-Medical-Device in the Australian Therapeutic Goods Register. Prosthesis 2021, 3, 221–228. [Google Scholar] [CrossRef]
  10. Martindale, V.; Menache, A. The PIP scandal: An analysis of the process of quality control that failed to safeguard women from the health risks. J. R. Soc. Med. 2013, 106, 173–177. [Google Scholar] [CrossRef] [Green Version]
  11. News, D.I. The Metal-on-Metal Hip Implants Scandal. Available online: https://www.druginjurynews.com/news/metal-metal-hip-implants-scandal/ (accessed on 25 July 2021).
  12. The European Parliament and the Council of the European Union. Regulation (EU) 2017/745 of the European Parliament and of the Council of 5 April 2017 on Medical Devices. 2017. Available online: https://eur-lex.europa.eu/legal-content/EN/TXT/PDF/?uri=CELEX:32017R0745 (accessed on 25 July 2021).
  13. Medical Device Regulation Revision. Available online: https://www.bsigroup.com/en-GB/medical-devices/our-services/MDR-Revision/ (accessed on 25 July 2021).
  14. The European Parliament and the Council of the European Union. Council Directive 93/42/EEC of 14 June 1993 Concerning Medical Devices. 1993. Available online: https://eur-lex.europa.eu/LexUriServ/LexUriServ.do?uri=CONSLEG:1993L0042:20071011:en:PDF (accessed on 25 July 2021).
  15. The European Parliament and the Council of the European Union. Regulation (EU) 2017/746 of the European Parliament and of the Council of 5 April 2017 on In Vitro Diagnostic Medical Devices. 2017. Available online: https://eur-lex.europa.eu/eli/reg/2017/746/oj (accessed on 25 July 2021).
  16. In Vitro Diagnostic Regulation Revision. Available online: https://www.bsigroup.com/en-GB/medical-devices/our-services/IVDR-Revision/ (accessed on 25 July 2021).
  17. Directive 98/79/EC of the European Parliament and of the Council of 27 October 1998 on In Vitro Diagnostic Medical Devices. 1998. Available online: https://eur-lex.europa.eu/legal-content/EN/TXT/PDF/?uri=CELEX:31998L0079 (accessed on 25 July 2021).
  18. Government, U. Guidance for Medical Devices: EU Regulations for MDR and IVDR (Northern Ireland). Available online: https://www.gov.uk/guidance/medical-devices-eu-regulations-for-mdr-and-ivdr (accessed on 25 July 2021).
  19. Chowdhury, G.G. Natural language processing. Annu. Rev. Inf. Sci. Technol. 2003, 37, 51–89. [Google Scholar] [CrossRef] [Green Version]
  20. Dale, E.; Chall, J.S. A formula for predicting readability: Instructions. Educ. Res. Bull. 1948, 27, 37–54. [Google Scholar]
  21. Chall, J.S.; Dale, E. Readability Revisited: The New Dale–Chall Readability Formula; Brookline Books: Cambridge, MA, USA, 1995. [Google Scholar]
  22. Frisson, S.; Pickering, M.J. The processing of familiar and novel senses of a word: Why reading Dickens is easy but reading Needham can be hard. Lang. Cogn. Process. 2007, 22, 595–613. [Google Scholar] [CrossRef]
  23. Zhang, J.; Liu, X.L.; So, M.; Reder, L.M. Familiarity acts as a reduction in objective complexity. Mem. Cogn. 2020, 48, 1376–1387. [Google Scholar] [CrossRef] [PubMed]
  24. Benjamin, R.G. Reconstructing readability: Recent developments and recommendations in the analysis of text difficulty. Educ. Psychol. Rev. 2012, 24, 63–88. [Google Scholar] [CrossRef]
  25. Schuyler, M.R. A readability formula program for use on microcomputers. J. Read. 1982, 25, 560–591. [Google Scholar]
  26. Flesch, R. A new readability yardstick. J. Appl. Psychol. 1948, 32, 221. [Google Scholar] [CrossRef]
  27. Senter, R.; Smith, E.A. Automated Readability Index; Technical Report; Cincinnati University: Cincinnati, OH, USA, 1967. [Google Scholar]
  28. Thomas, G.; Hartley, R.D.; Kincaid, J.P. Test-retest and inter-analyst reliability of the automated readability index, Flesch reading ease score, and the fog count. J. Read. Behav. 1975, 7, 149–154. [Google Scholar] [CrossRef] [Green Version]
  29. Smith, E.A.; Kincaid, J.P. Derivation and validation of the automated readability index for use with technical materials. Hum. Factors 1970, 12, 457–564. [Google Scholar] [CrossRef]
  30. Coleman, M.; Liau, T.L. A computer readability formula designed for machine scoring. J. Appl. Psychol. 1975, 60, 283. [Google Scholar] [CrossRef]
  31. Zhou, S.; Jeong, H.; Green, P.A. How Consistent Are the Best-Known Readability Equations in Estimating the Readability of Design Standards? IEEE Trans. Prof. Commun. 2017, 60, 97–111. [Google Scholar] [CrossRef]
  32. Prabowo, R.; Thelwall, M. Sentiment analysis: A combined approach. J. Inf. 2009, 3, 143–157. [Google Scholar] [CrossRef]
  33. Gohil, S.; Vuik, S.; Darzi, A. Sentiment analysis of health care tweets: Review of the methods used. JMIR Public Health Surveill. 2018, 4, e5789. [Google Scholar] [CrossRef]
  34. Gai, P.; Kemp, M.H.; Sánchez Serrano, A.; Schnabel, I. Regulatory Complexity and the Quest for Robust Regulation. Number 8. Reports of the Advisory Scientific Committee. 2019. Available online: https://ideas.repec.org/p/srk/srkasc/20198.html (accessed on 25 July 2021).
  35. Colliard, J.E.; Georg, C.P. Measuring Regulatory Complexity. 2020. Available online: https://www.institutlouisbachelier.org/wp-content/uploads/2019/11/papier_jean-edouard-colliard.pdf (accessed on 25 July 2021).
  36. Spatt, C.S. Complexity of regulation. Harv. Bus. L. Rev. Online 2012, 3, 1. [Google Scholar]
  37. Gunning, R. The Technique of Clear Writing; McGraw-Hill: New York, NY, USA, 1952. [Google Scholar]
  38. Bothun, L.S.; Feeder, S.E.; Poland, G.A. Readability of Participant Informed Consent Forms and Informational Documents From Phase III COVID-19 Vaccine Clinical Trials in the United States. In Mayo Clinic Proceedings; Elsevier: Amsterdam, The Netherlands, 2021. [Google Scholar] [CrossRef]
  39. Li, F. Annual report readability, current earnings, and earnings persistence. J. Account. Econ. 2008, 45, 221–247. [Google Scholar] [CrossRef]
  40. Miller, B.P. The effects of reporting complexity on small and large investor trading. Account. Rev. 2010, 85, 2107–2143. [Google Scholar] [CrossRef]
  41. Loughran, T.; McDonald, B. Measuring readability in financial disclosures. J. Financ. 2014, 69, 1643–1671. [Google Scholar] [CrossRef]
  42. Felsenfeld, C. The plain English movement. Can. Bus. LJ 1981, 6, 408. [Google Scholar]
  43. Securities and Exchange Commission. Plain English Disclosure. 1998. Available online: https://www.federalregister.gov/documents/1998/02/06/98-2889/plain-english-disclosure (accessed on 25 July 2021).
  44. DuBay, W.H.; The Principles of Readability. Impact Information. 2004. Available online: http://impact-information.com/impactinfo/readability02.pdf (accessed on 25 July 2021).
  45. Bonsall IV, S.B.; Leone, A.J.; Miller, B.P.; Rennekamp, K. A plain English measure of financial reporting readability. J. Account. Econ. 2017, 63, 329–357. [Google Scholar] [CrossRef]
  46. Nirmaldasan. StyleWriter’s Bog Index. Available online: https://strainindex.wordpress.com/2010/01/19/stylewriters-bog-index/m (accessed on 25 July 2021).
  47. Halstead, M.H. Elements of Software Science (Operating and Programming Systems Series); Elsevier Science Inc.: Amsterdam, The Netherlands, 1977. [Google Scholar]
  48. Flater, D.W. ’Software Science’ Revisited: Rationalizing Halstead’s System Using Dimensionless Units; National Institute of Standards and Technology: Gaithersburg, MD, USA, 2018. [Google Scholar]
  49. Holbrook, A.; Cho, Y.I.; Johnson, T. The impact of question and respondent characteristics on comprehension and mapping difficulties. Int. J. Public Opin. Q. 2006, 70, 565–595. [Google Scholar] [CrossRef]
  50. Bergmann, J.H.; Hendricusdottir, R.; Lee, R. Regulatory Navigation: A Digital Tool to Understand Medical Device Classification Pathways. In Comprehensive Biotechnology, 3rd ed.; Moo-Young, M., Ed.; Pergamon: Oxford, UK, 2019; pp. 167–172. [Google Scholar] [CrossRef]
  51. Stahl, R.J. Using “Think-Time” and “Wait-Time” Skillfully in the Classroom. ERIC Digests. 1994. Available online: https://eric.ed.gov/?id=ED370885 (accessed on 25 July 2021).
  52. Natural Interaction Lab, University of Oxford. Oxford Global Guidance. 2021. Available online: https://www.oxfordglobalguidance.org (accessed on 25 July 2021).
  53. Lewis, M.L.; Frank, M.C. The length of words reflects their conceptual complexity. Cognition 2016, 153, 182–195. [Google Scholar] [CrossRef] [PubMed] [Green Version]
  54. Redish, J. Readability formulas have even more limitations than Klare discusses. ACM J. Comput. Doc. (JCD) 2000, 24, 132–137. [Google Scholar] [CrossRef]
  55. Hendricusdottir, R.; Hussain, A.; Milnthorpe, W.; Bergmann, J.H. Lack of Support in Medical Device Regulation within Academia. Prosthesis 2021, 3, 1–8. [Google Scholar] [CrossRef]
Figure 1. Descriptive complexity scores for the MDR, MDD, IVDR and IVDD. The word length represents the average word length.
Prosthesis 03 00029 g001
Figure 2. Readability scores for the MDR, MDD, IVDR and IVDD. Outcomes consist of the Dale–Chall Readability score, Automated Readability Index (ARI), Coleman Liau Index, Gunning Fog, Flesch Kincade Grade and Bog Index.
Prosthesis 03 00029 g002
Figure 3. Halstead-based metric scores for the MDR, MDD, IVDR and IVDD. The following metrics are used: Total operators ( N 1 ), unique operators count ( n 1 ), total operands ( N 2 ) and unique operands count ( n 2 ). Other metrics consist of the length, vocabulary size, classification ratio ( N 1 / N 2 ), level, surrogate level and volume of the “programme”.
Prosthesis 03 00029 g003
Figure 4. Box and whisker plot for the response times (vertical axis) of individual nodes (horizontal axis). Any data point which is greater than 1.5 times the interquartile range away from either the upper or lower quartile is denoted an outlier and marked by a circle. The data is displayed on a log axis for response time.
Prosthesis 03 00029 g004
Figure 5. Normalised numerical complexity metrics and response times (vertical axis) of individual nodes (horizontal axis). The mean word length and median response times are shown. The central tendency metrics are selected based on the distribution of the data.
Prosthesis 03 00029 g005
Figure 6. Frequency distributions for the readability metrics across all 112 nodes/questions of the digital tool.
Prosthesis 03 00029 g006
Figure 7. Normalised Halstead-based complexity metrics and response times (vertical axis) of individual nodes (horizontal axis).
Prosthesis 03 00029 g007
Table 1. Readability metrics. WC = Word Count, DWC = Difficult or Complex Word Count, SC = Sentence Count, SyC = Syllable Count, CC = Character Count.
Complexity MethodEquation
Dale–Chall Readability Formula [21]
0.1579 × ( D W C W C × 100 ) + 0.0496 × ( W C S C )
Flesch Kincaid Grade Level [25]
0.39 × ( W C S C ) + 11.8 × ( S y C W C ) 15.59
Automated Readability Index Formula [28]
4.71 × ( C C W C ) + 0.5 × ( W C S C ) 21.43
Coleman Liau Index Formula (adapted from [31])
5.89 × ( C C W C ) 0.3 × ( S C W C ) 15.8
Gunning Fog Formula [31]
0.4 × [ ( W C S C + 100 × ( D W C W C ) ]
Table 2. Pearson’s correlation coefficients for readability metrics and response times.
Complexity MetricPearson’s Correlation Coefficient (p-Value)
Letter Count0.204 (0.015)
Word Count0.214 (0.011)
Syllable Count0.202 (0.016)
Syllables per Word−0.087 (0.180)
Letters per Word−0.019 (0.421)
Dale–Chall0.003 (0.488)
ARI0.158 (0.048)
Coleman Liau0.055 (0.283)
Gunning Fog0.133 (0.081)
Flesch Grade0.149 (0.059)
Bog Index0.153 (0.054)
Table 3. Pearson’s correlation coefficients (p-values) for Halstead-based complexity metrics and the response times.
Complexity MetricsPearson’s Correlation Coefficient (p-Value)
Operator Count0.200 (0.017)
Operand Count0.193 (0.021)
Programme Length0.200 (0.020)
Vocabulary Size0.201 (0.020)
Classification Ratio0.228 (0.008)
Level0.209 (0.013)
Surrogate Level0.214 (0.011)
Programme Volume0.197 (0.019)
Publisher’s Note: MDPI stays neutral with regard to jurisdictional claims in published maps and institutional affiliations.

