
Article

A Quantum-Accelerated Mapping Algorithm for Sequence Alignment
by
Konstantinos Prousalis
1,*,
Dimitris Ntalaperas
1,
Konstantinos Georgiou
1,
Andreas Kalogeropoulos
1,
Thanos G. Stavropoulos
2,
Theodora Karamanidou
2,
Christos Papalitsas
2,
Lefteris Angelis
1 and
Nikos Konofaos
1
1
School of Informatics, Aristotle University of Thessaloniki, 54124 Thessaloniki, Greece
2
Pfizer Center for Digital Innovation, 55535 Thessaloniki, Greece
*
Author to whom correspondence should be addressed.
Quantum Rep. 2026, 8(2), 51; https://doi.org/10.3390/quantum8020051
Submission received: 10 April 2026 / Revised: 24 May 2026 / Accepted: 27 May 2026 / Published: 2 June 2026
(This article belongs to the Topic Quantum Computing: Latest Advances and Prospects)

Abstract

A novel quantum algorithm for biological sequence alignment is presented and analyzed. The large volumes of data generated through genome sequencing, de novo assembly, resequencing, and transcriptome sequencing at the DNA and RNA levels foreshadow the growing demand for higher computational power and more sophisticated alignment methodologies. The rapid advancement of modern sequencing technologies in genomics has motivated the reconsideration of existing approaches for the design and implementation of alignment protocols. Emerging quantum computing accelerators may provide transformative solutions in this domain as quantum hardware progressively reaches higher levels of gate-operation maturity. This work proposes a computer-vision-based approach that exploits the unique properties of quantum entanglement within a dot-matrix representation to address the increasing demand for efficient processing of biological data. A quantum-accelerated protocol is developed and evaluated using the Qiskit software framework of IBM. Runtime experiments support the potential of the proposed methodology to provide advantageous sequence-alignment performance in terms of accuracy, completeness, and computational complexity. The system is evaluated under multiple operational conditions and demonstrates promising performance advantages.

1. Introduction

In the algorithmic fields of string metrics and string searching in information processing, comparing two strings and estimating their similarity degree is a highly applicable task in many scientific areas. In the fields of bioinformatics and molecular biology, this process is known as sequence alignment (SA) and constitutes a foundation for several key areas such as evolutionary relationships, functional annotations, comparative genomics, drug design and development, disease studies, database search, and research in molecular and structural biology. At the same time, genomic data are generated at unprecedented rates, due to the faster and more diversified Next-Generation Sequencing (NGS) technologies, entering an era where biodata requires efficient and powerful computing machines for analytics as never before. Current computational capabilities remain insufficient to meet these demands.
Since the milestone algorithms of Needleman–Wunsch (N.W.) in 1970 and Smith–Waterman (S.W.) in 1981 [1,2,3], several heuristic strategies have been invented to accelerate the SA procedure, such as FASTA or BLAST series [4,5]. Dynamic programming approaches developed over the past decades provided optimal solutions but remain time-consuming. The emergence of NGS technologies introduced the fragmentation of genomes into shorter sequences—the well-known “reads”—in fact, they dictated the form of modern aligners, leading to the development of modern short-read aligners. Most of them adopted the popular seed-and-extend (S&E) strategy, which was adjusted to the specifications of NGS. Then, more advanced tools appeared, like BWA [6], HISAT [7], MUMmer series [8,9], etc. However, in the era of big data, the need for even stronger alternatives led to completely unconventional ideas for hardware systems that are based on optics [10] and quantum computing technologies [11,12]. Both examples are still in an embryonic stage.
In this project, a previously reported algorithmic idea [12] is re-examined and transformed into a functional pairwise SA (or PSA) system implemented by quantum computing means. The initial idea was to create a quantum dot-plot and apply the quantum Fourier Transform (QFT) to detect regions of high similarity. Although the QFT is an exceptional mathematical tool to detect similarities [13], further experimentation on four-letter biological data (DNA/RNA) confronted inaccuracies and pattern detection difficulties when multiple diagonals exist in the same dot-plot window. This limitation necessitates additional segmentation and examination of the window in a brute force, inefficient fashion without guarantee of detecting the exact pattern, something which is commented in [12]. Now, the same concept is partially revised to provide more accuracy. The idea of the dot-matrix is conserved, but the QFT is replaced by a Hamming distance calculator. A series of XOR operations isolates specific areas of possible similarities, and a counting algorithm validates similarities of a pre-specified threshold—acting as a thresholding mechanism. Since acceptable similarities are detected, they can be further evaluated, providing more alignment details if required. The final step may be implemented classically or not. In case this system is part of a larger classical system, it may be viewed as a hybrid quantum-accelerated solution.
The proposed system is tested under the OpenQASM v3.0 software platform [14] under the Qiskit Ecosystem framework [15], and it is connected and transpiled to a possible hardware implementation—compatible with IBM quantum hardware constraints. The multifaceted applicability of the proposed system is discussed for different operational modes or SA conditions.

2. The Proposed Sequence Alignment Protocol

The S&E strategy, originally introduced in the FASTA sequence-alignment tool, is employed by the vast majority of modern read aligners and constitutes the primary focus of the present study. A typical implementation of this strategy consists of four principal stages: data preparation, seeding, filtering, and extension. The proposed approach bypasses the preparation stage, which generally involves the construction of large indexing structures, and instead focuses on accelerating the seeding stage through quantum computing techniques. The subsequent filtering and extension stages are executed classically in order to refine and validate the alignment results. Nevertheless, alternative quantum computing methodologies may also be employed as replacements for these latter stages, thereby avoiding repeated transitions between quantum and classical computational regimes. Such alternatives are discussed as secondary approaches in the Supplementary Materials.

2.1. Hybrid System Architecture

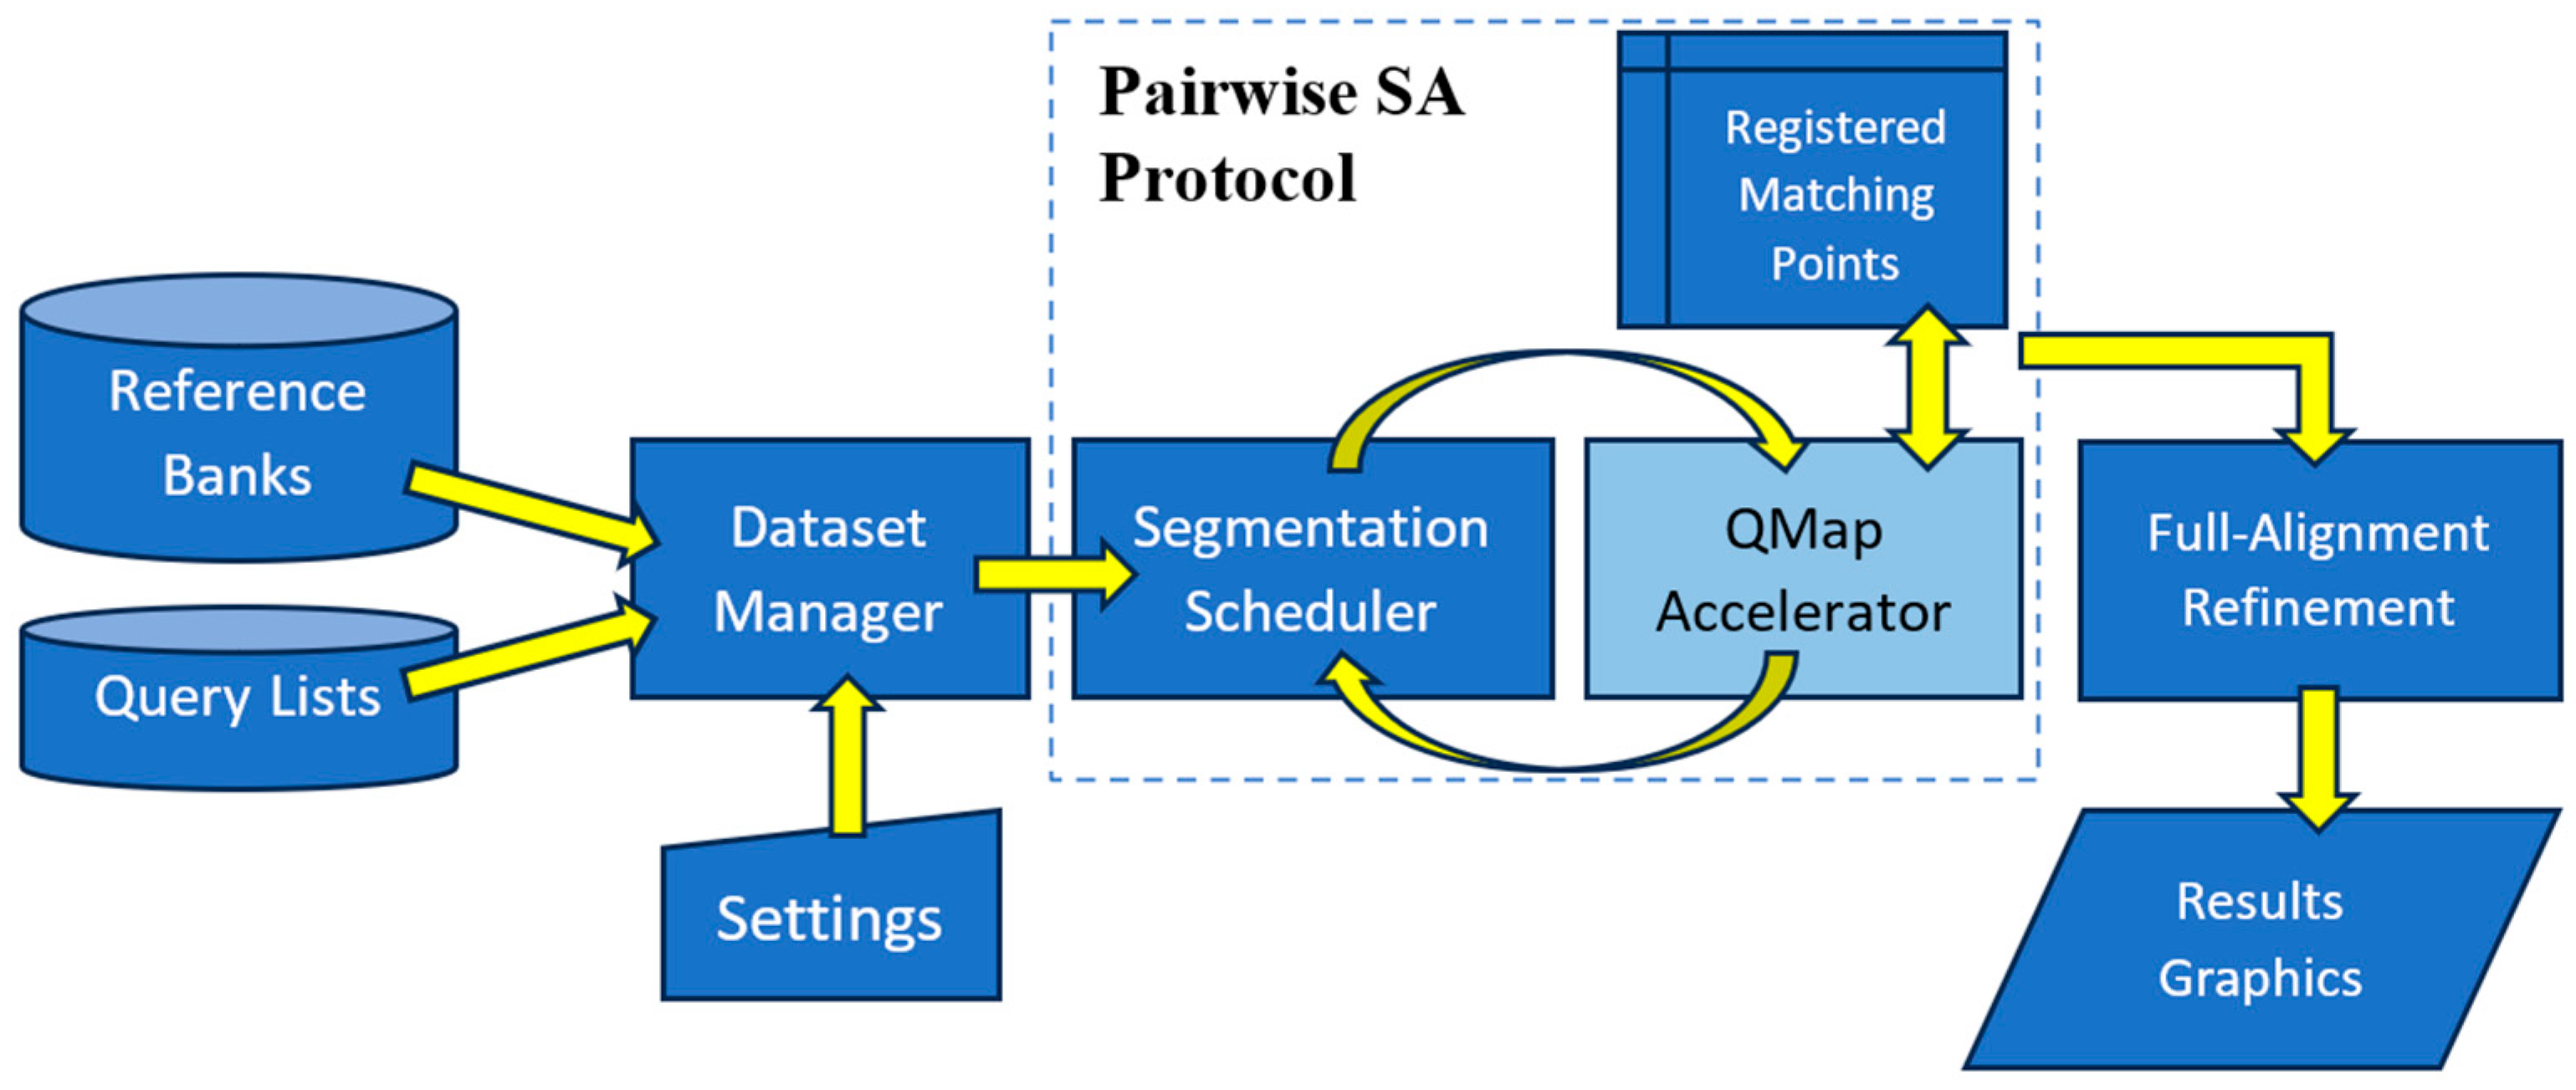
The prototype system architecture of a typical read-aligner is depicted in Figure 1, including the quantum read-mapping accelerator QMap. It constitutes a hybrid system that combines classical processing with quantum acceleration for improved read-mapping efficiency.
According to the user-defined settings, the dataset manager retrieves the selected reference genome from a bio-database along with the query reads and initiates the PSA procedure. The segmentation scheduler then determines the optimal partitioning of the reference sequence into segments (sliding windows), whose size is equal to or greater than the read length. Based on this segmentation, it computes the number of required QMap executions, since the routine is applied once per sliding window to fully align each read to the reference. Auxiliary details on the scheduling policies are provided in the Supplementary Materials.
Once scheduling is complete, the scheduler systematically dispatches the generated query datasets to QMap in an iterative manner, ensuring that each pair—comprising a read and a corresponding sliced reference segment—is processed in turn. QMap then identifies consecutive base-pair similarities within these segments by constructing a dot-matrix and detecting diagonal patterns. The resulting similarity regions, visualized as a heatmap, are subsequently refined and stitched into longer candidate alignments. Final accuracy is achieved through classical algorithms such as S.W. or N.W., which account for indels not captured by the quantum routine.
The segmentation scheduler splits the problem into smaller segments and orchestrates their processing, enabling parallelism. Its major task is to apply the size of the sliding window w . This parameter may be a user-defined, statistically motivated parameter that balances detection sensitivity, noise suppression, and computational efficiency. In modern terms, it plays a role analogous to k -mer size in S&E aligners. But how do you decide upon a formal way to estimate the size of the sliding window?
A short algorithmic solution for selecting the slicing window size w can be provided by Algorithm 1.
Algorithm 1: Slicing window size estimation
Input:
      Sequence lengths: n , m
      Alphabet size: σ
      False-positive tolerance: ϵ
      Expected similarity: p
      Detection threshold: δ
1. Compute statistical lower bound (noise control):
w m i n = log ( n m / ϵ ) log σ
2. Compute biological upper bound (sensitivity preservation):
w m a x = log ( δ ) log ( p )
3. Check feasibility:
      If w m i n > w m a x , then no valid window size exists (relax parameters)
4. Select optimal window size:
      Choose w [ w m i n , w m a x ] with a practical choice the mean.
This algorithm explicitly balances random-match suppression and true-match detectability, making it suitable for hybrid pipelines. Protein bases tend to perform better in alignment than DNA/RNA bases, as the “signal-to-noise ratio” in protein sequences is much better than nucleotides. Longer reads are easier to detect than short reads, while larger sliding window frames accelerate the process at a cost of sensitivity. Moreover, by imposing specific filtering cut-offs, we can speed up runtime and save computing resources. More complex situations may require the calculation of a cost function if the optimality of w depends on multiple parameters.

2.2. Processing Pipeline Flow

The pipeline of the operational workflow is presented in Figure 2, demonstrating the sequential interaction between preprocessing, quantum dot-plot generation, candidate searching, filtering, and final alignment refinement stages. More specifically, this workflow demonstrates how quantum-assisted similarity detection can be integrated with classical optimization techniques to potentially improve the alignment procedure. Next, each step is detailed.
  • Input: This stage initializes the alignment workflow by loading the reference genome database, the query reads, and the user-defined configuration parameters. These settings determine factors such as segmentation size, matching thresholds, and execution policies used throughout the pipeline. The format follows FASTA specifications.
  • Segmentation Scheduler: The reference sequence is partitioned into overlapping sliding windows of size w × w . The scheduler determines the optimal segmentation strategy to balance mapping accuracy, computational cost, and parallel execution efficiency.
  • Dot-Matrix Plot: In this phase, the sequence segments are transformed into a quantum-compatible dot-plot representation using the NEQR encoding scheme. Logical XOR operations are then applied to compare corresponding symbols between reference and query sequences, generating similarity patterns.
  • Searching: The encoded dot-plot is processed to identify potential matching regions. Quantum logical AND operations and counting procedures are employed to detect and quantify similarity clusters corresponding to candidate alignment locations.
  • Filtering Hits: Low-quality or noisy matches are discarded to reduce false positives. The remaining candidate seeds are grouped into clusters according to their spatial or diagonal consistency, producing a refined set of promising alignment regions.
  • Extension: The shortlisted candidate regions are extended using classical dynamic programming algorithms, such as Smith–Waterman or Needleman–Wunsch. Final alignment scores are then computed to determine the optimal sequence alignments.

2.3. QMap Accelerator

The quantum part of the system is described in algorithmic terms, while a circuit-level implementation is proposed.

2.3.1. Quantum Algorithm

The quantum part is restricted in the QMap box of the system. Given that the size of the sliding window w is determined, the algorithmic steps are defined in Algorithm 2:
Algorithm 2: QMap: Quantum Sequence Mapping
Input: (a) two portions of sequences: { S x , S y } of equal size w , (b) alphabet: σ , (c) window size: w , (d) detection threshold: δ .
Output: A superposition state representing the dot-matrix plot.
Qubit Registers:
(a) Two positional and two data registers of log 2 w and log |σ|, respectively.
(b) A single ancilla qubit register.
(c) (2w-1-2δ) registers of log 2 w qubits.
1. Encoding: Embed the input string set via NEQR technique
       (a)
Apply Hadamard transformations to all index registers.
       (b)
For each input sequence, apply multi-(anti)controlled-Not operations coupling index and data registers in a programmable logic. The “controlled” part is connected to the index register while the “target” part to the data registers.
2. Bitwise Inner Product Operation (XOR):
       (a)
The first data register is coupled once with each of the rest of the data registers using controlled-Not operators. Each coupling is realized as a XOR operation.
       (b)
The terminal targeted data registers of the previous step (3a) are coupled to the ancilla single-qubit register by applying an anti-controlled-Not gate. The controlled part are the data qubits and the target part the ancilla qubit.
       (c)
The single qubit ancilla register is measured assuming a post-selection of 1. The final overall quantum state is:
i 1 , i 2 = 1 2 2 w i 1 = 0 2 w 1 i 2 = 0 2 w 1 i 1 , i 2 , S 1 S 2
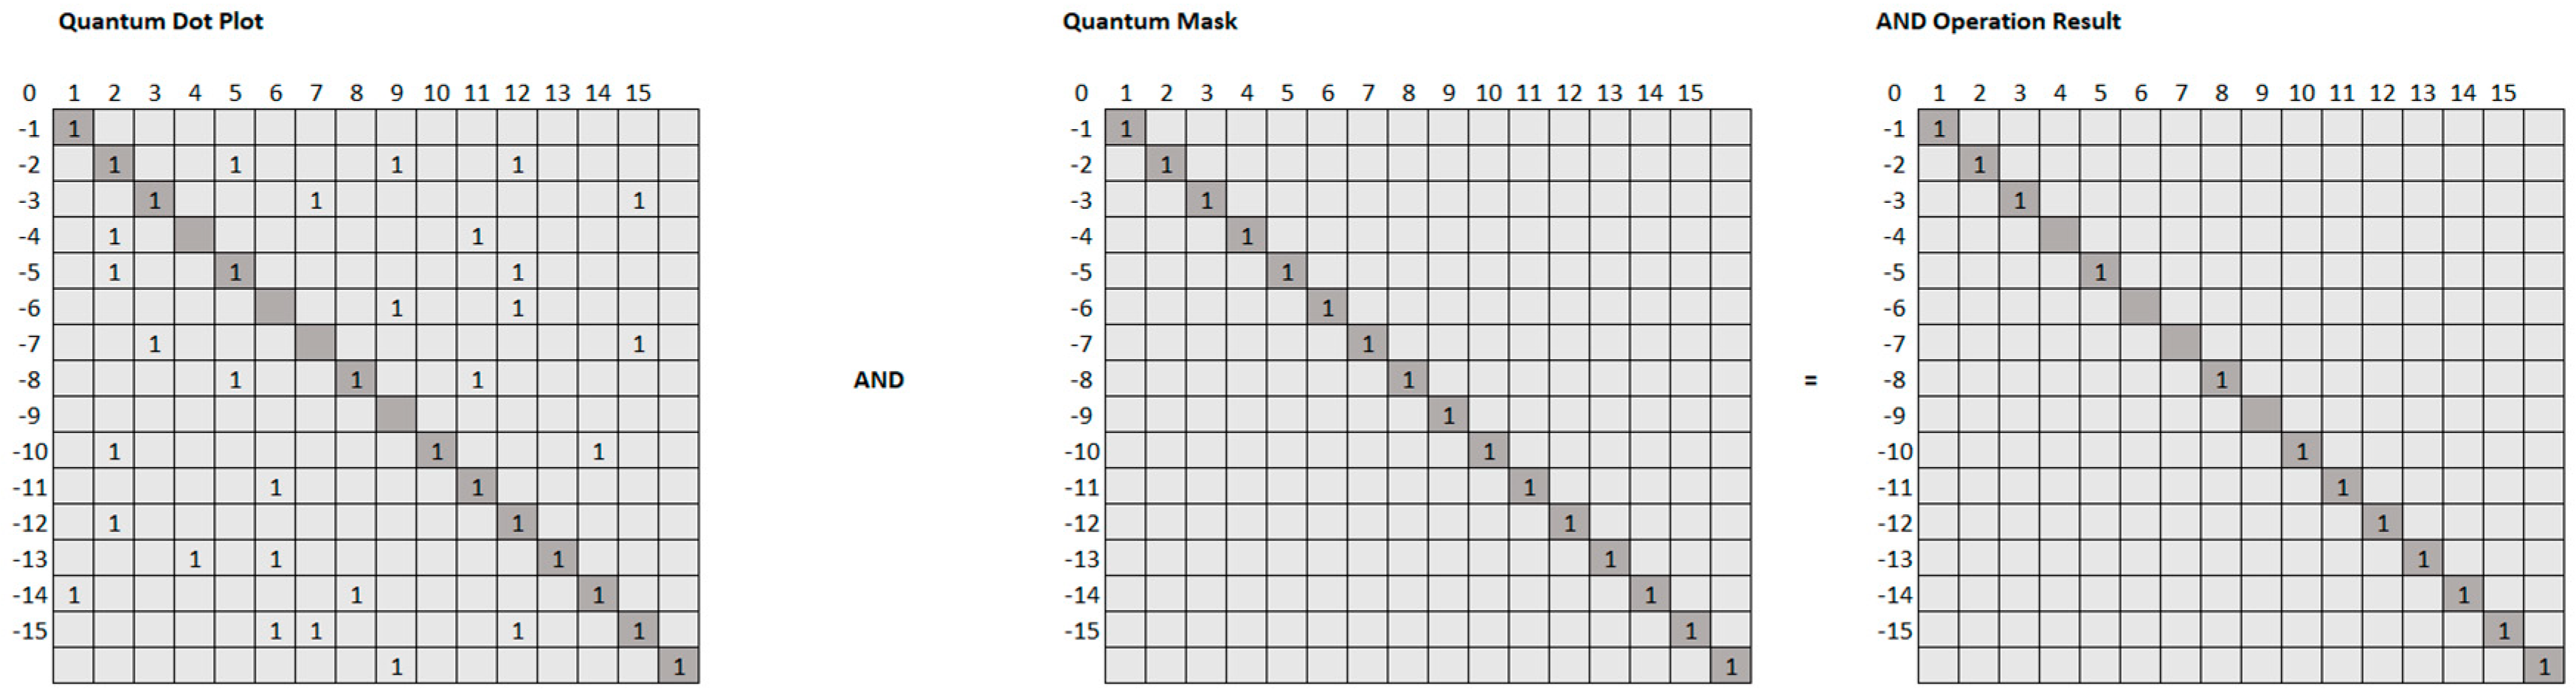
3. Apply sequentially 2w-1-δ AND operations to isolate diagonals. The first control is applied to the index registers and the second to a specific mask pattern.
4. Apply 2w-1-δ times the counting subroutine at the target output of AND to detect significant diagonals.
In Figure 3, the quantum logic AND is visually explained between the realistically generated and the perfect mask pattern. The “mask pattern” is realized as a dot-plot, too, of the same size as the sliding window, with a continuous single diagonal. Some example patterns are depicted in Figure 3. Generally, these patterns should be configured according to the adopted scanning policy, which is discussed in the following.

2.3.2. Circuit Design

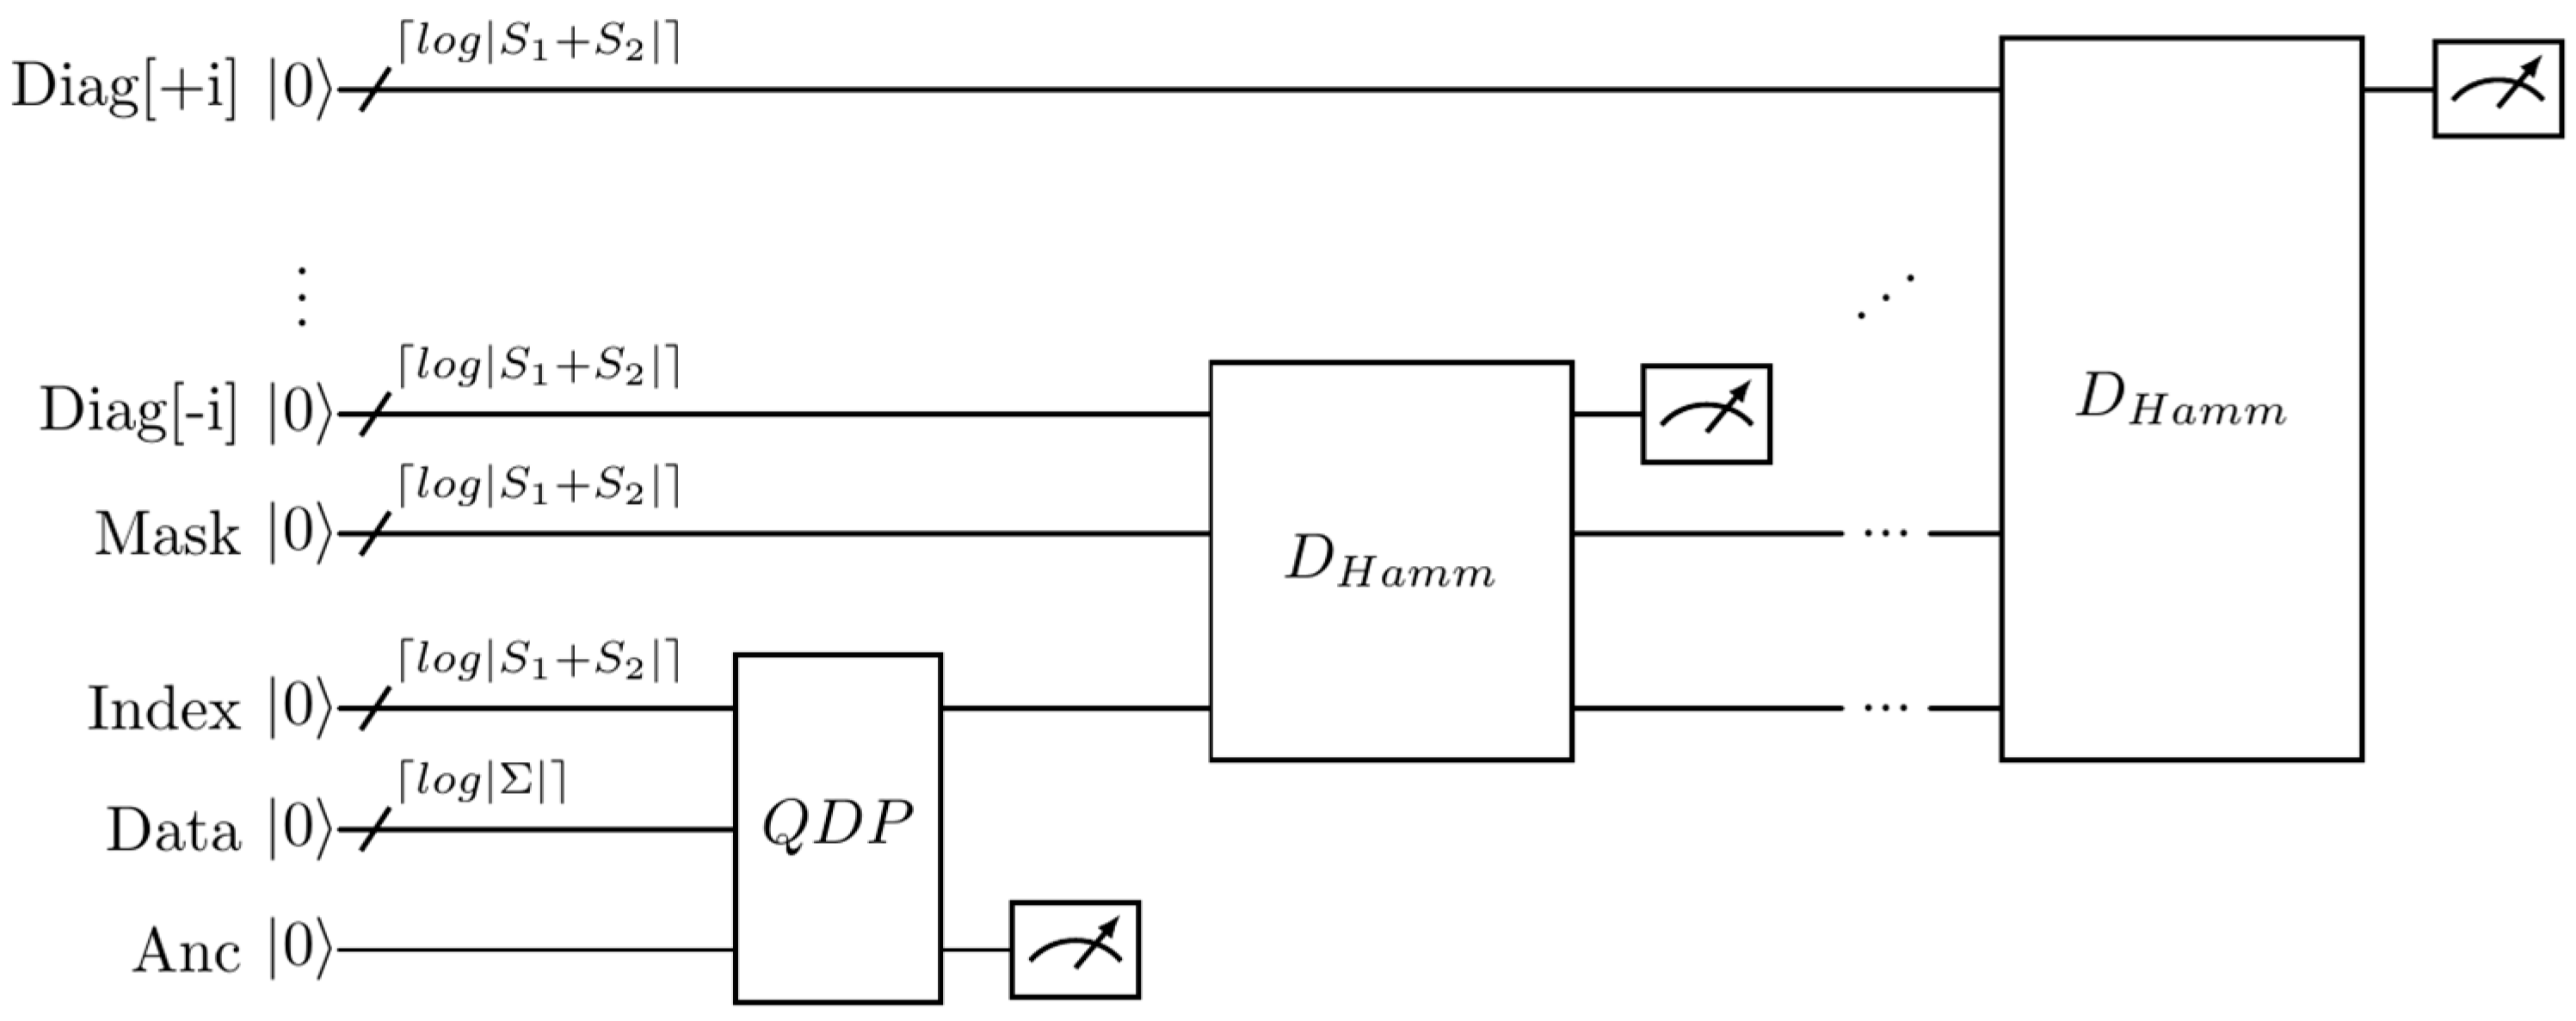
A possible design for the QMap quantum routine may be the circuit model as shown in Figure 4. Its main constituent elements are two basic subcircuits. The first one is responsible for the dot-matrix pairwise alignment generator, while the second one is responsible for the detection of regions which bare significant similarity. The first subcircuit is executed once per sliding window, while the second subcircuit is executed multiple times per sliding window. The repetition number of the second subcircuit depends on many parameters: (a) mainly by the design of the circuit, (b) the similarity threshold as a function of the size of the query read and/or the sliding window, (c) the available resources of the system which may set some bounds, (d) the adopted fragmentation policy of the reference, (e) the adopted scanning policy of the matrix by the single or double diagonal vectors, or even (f) the acceptable room for computing parallelism. Suppressing the repetition number will significantly accelerate the whole mapping procedure.

3. Quantum Computing Techniques

A more detailed analysis of the circuit sub-modules is presented to facilitate the realization of each part.

3.1. Submodules of QMap

The model circuit of the QMap routine is composed of two basic component logic subcircuits. The first Subcircuit A of the dot-plot generator is executed once per QMap call. Since the setting up of the dot-matrix binary structure is accomplished, Subcircuit B will estimate the Hamming distance. Both constructions are based on well-tested subcircuit implementations, which have been simulated individually to validate the results of their combination. A universal gate set is adopted to support all the circuitry. All the simulations are conducted with the aid of the Qiskit framework.

3.1.1. Subcircuit_A: Encoding and Dot-Plot Generator

Embedding classical information into quantum states of the Hilbert space is a critical issue for any algorithmic procedure, as the adopted quantum feature mapping scheme will affect the performance of the overall algorithm in terms of time consumption. This issue is discussed in J. Clapis’s work [16] regarding the exponentially difficult base encoding scheme, which is admittedly a well-known problem. The most prominent theoretical encoding schemes are the basis [17], the angle [18], and the amplitude [19] encoding schemes. All of them are exponentially difficult, but there is a great utility in estimating the circuit depth and runtime. Our analysis is based on the basis encoding scheme, which is oriented for numerical calculations. Similar performance seems to be obtained by the application of the angle encoding scheme. The more compact way of amplitude encoding may be more advantageous in terms of qubits, but algorithmic operations are not compatible with this type of encoding. Furthermore, the instantaneous quantum polynomial protocol [20] could be applied, but its restrictive non-universal model is prohibitive in our case. A comparison is given among these schemes in Table 1. Other promising ways to encode and manipulate quantum information may be employed in the near term, inspired by the QAOA ansatz [21].
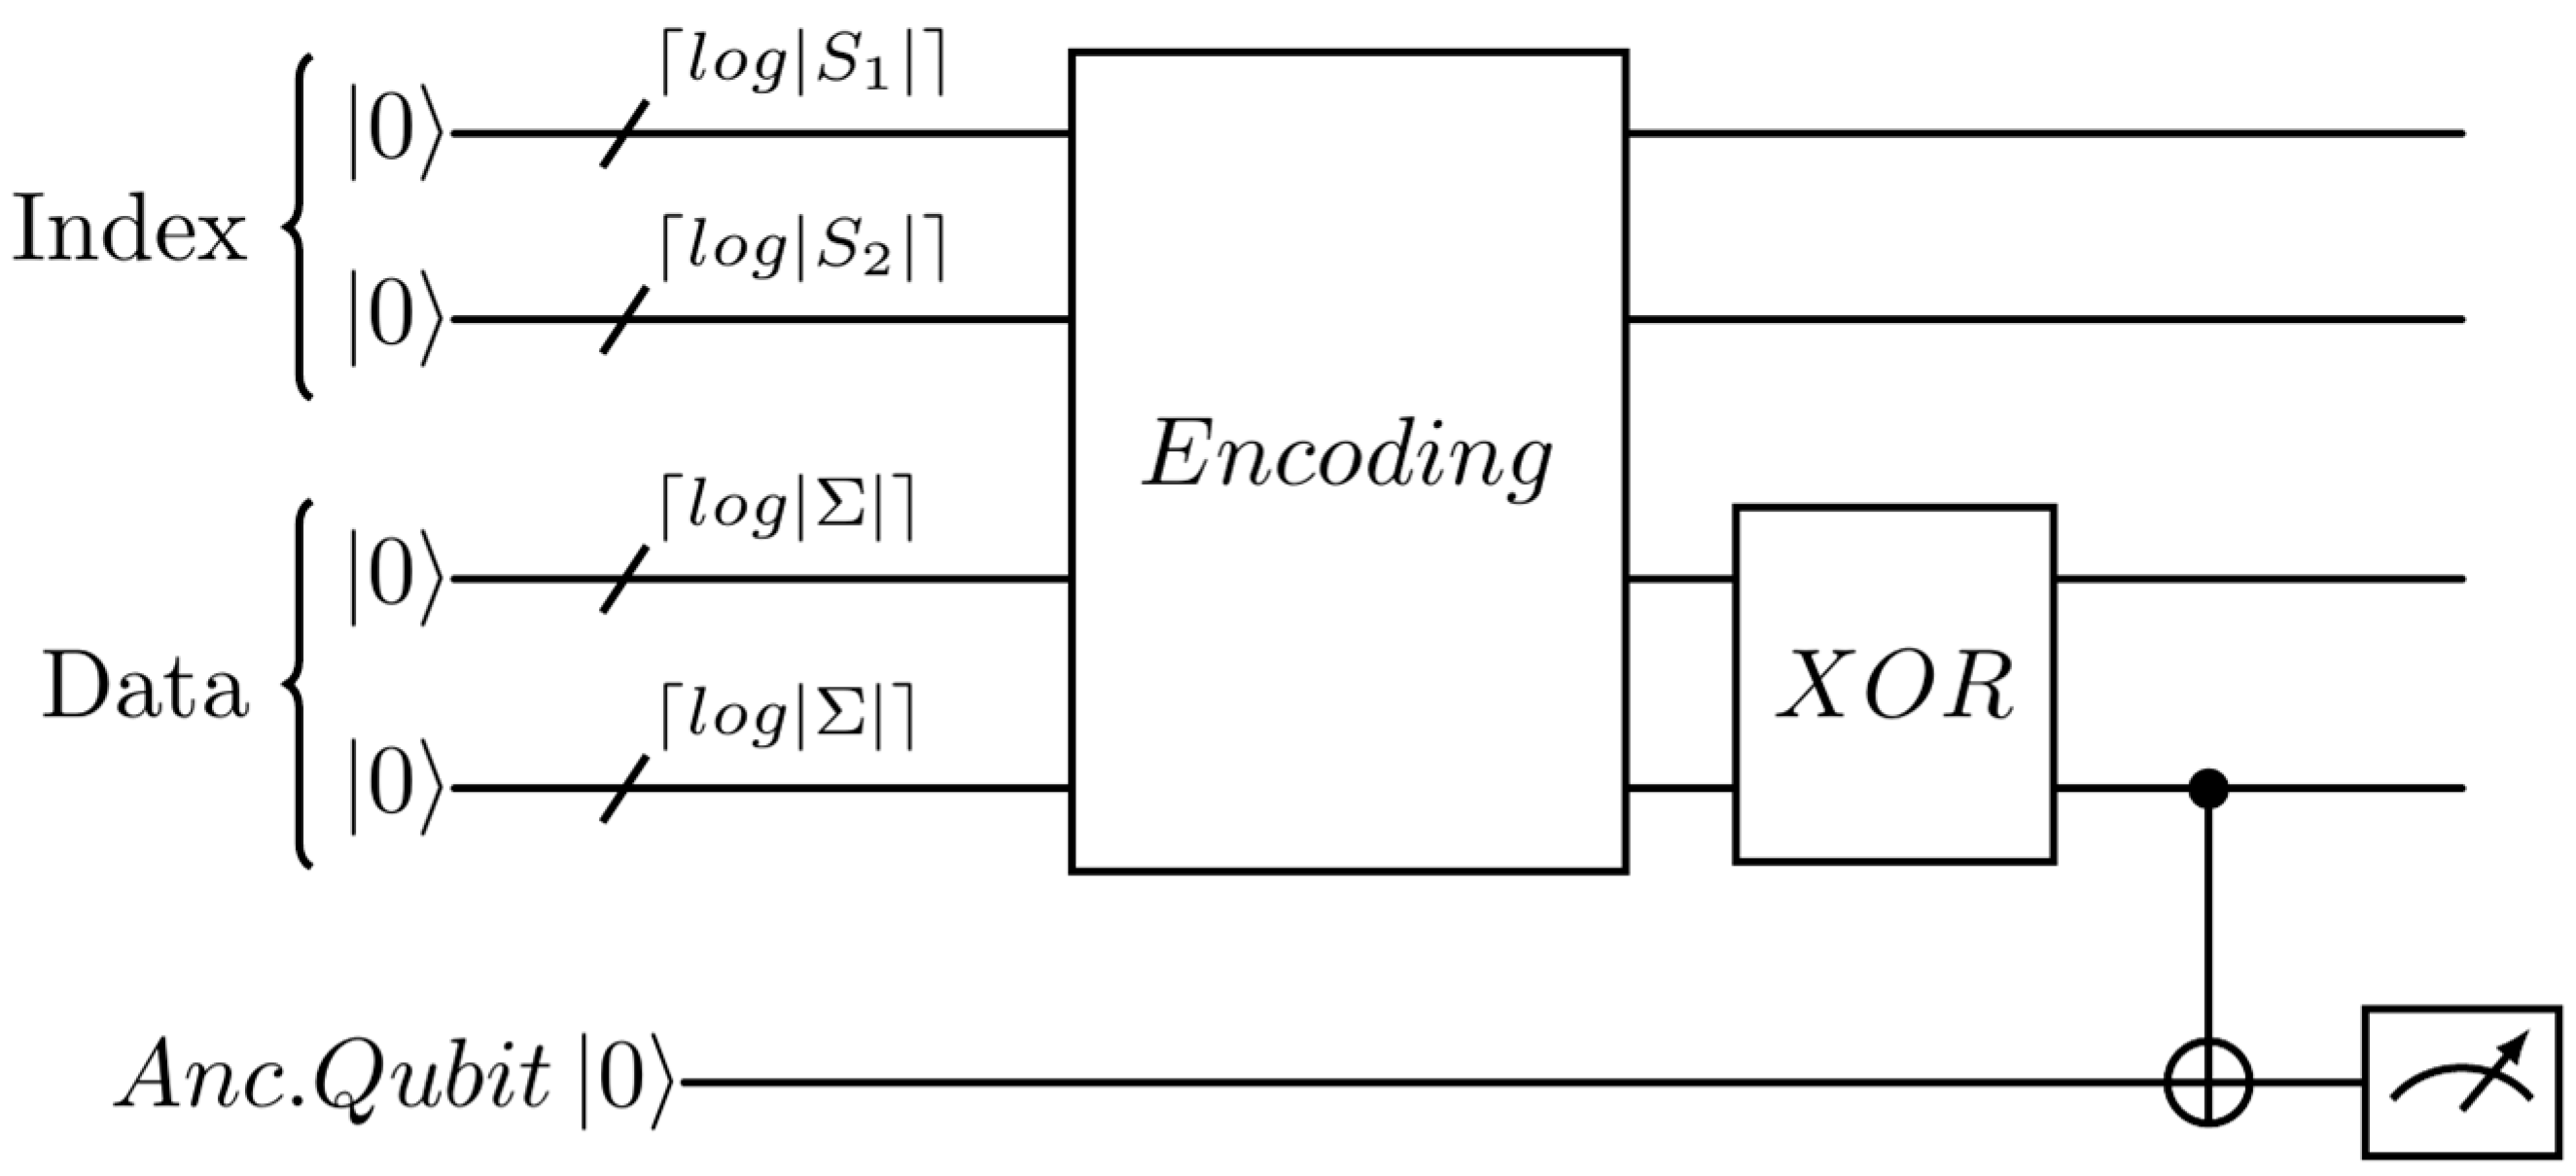
The dot-matrix generator subcircuit comprises the NEQR encoder and the logic XOR operation, as it is depicted in Figure 5. The encoder gets a classical dataset of two strings to embed into qubits. The XOR operation makes the preparation of the values of the dot-matrix as a superposition, and the measurement applies to the operation XOR in a quantum parallel way. This procedure is extensively explained by Clapis [16], providing a feasible solution to the previous problem of the Black-Box QDP considered in [12]. Once the dot-matrix is created, the position registers are used as an input for Subcircuit B.

3.1.2. Subcircuit_B: Hamming Distance Estimation

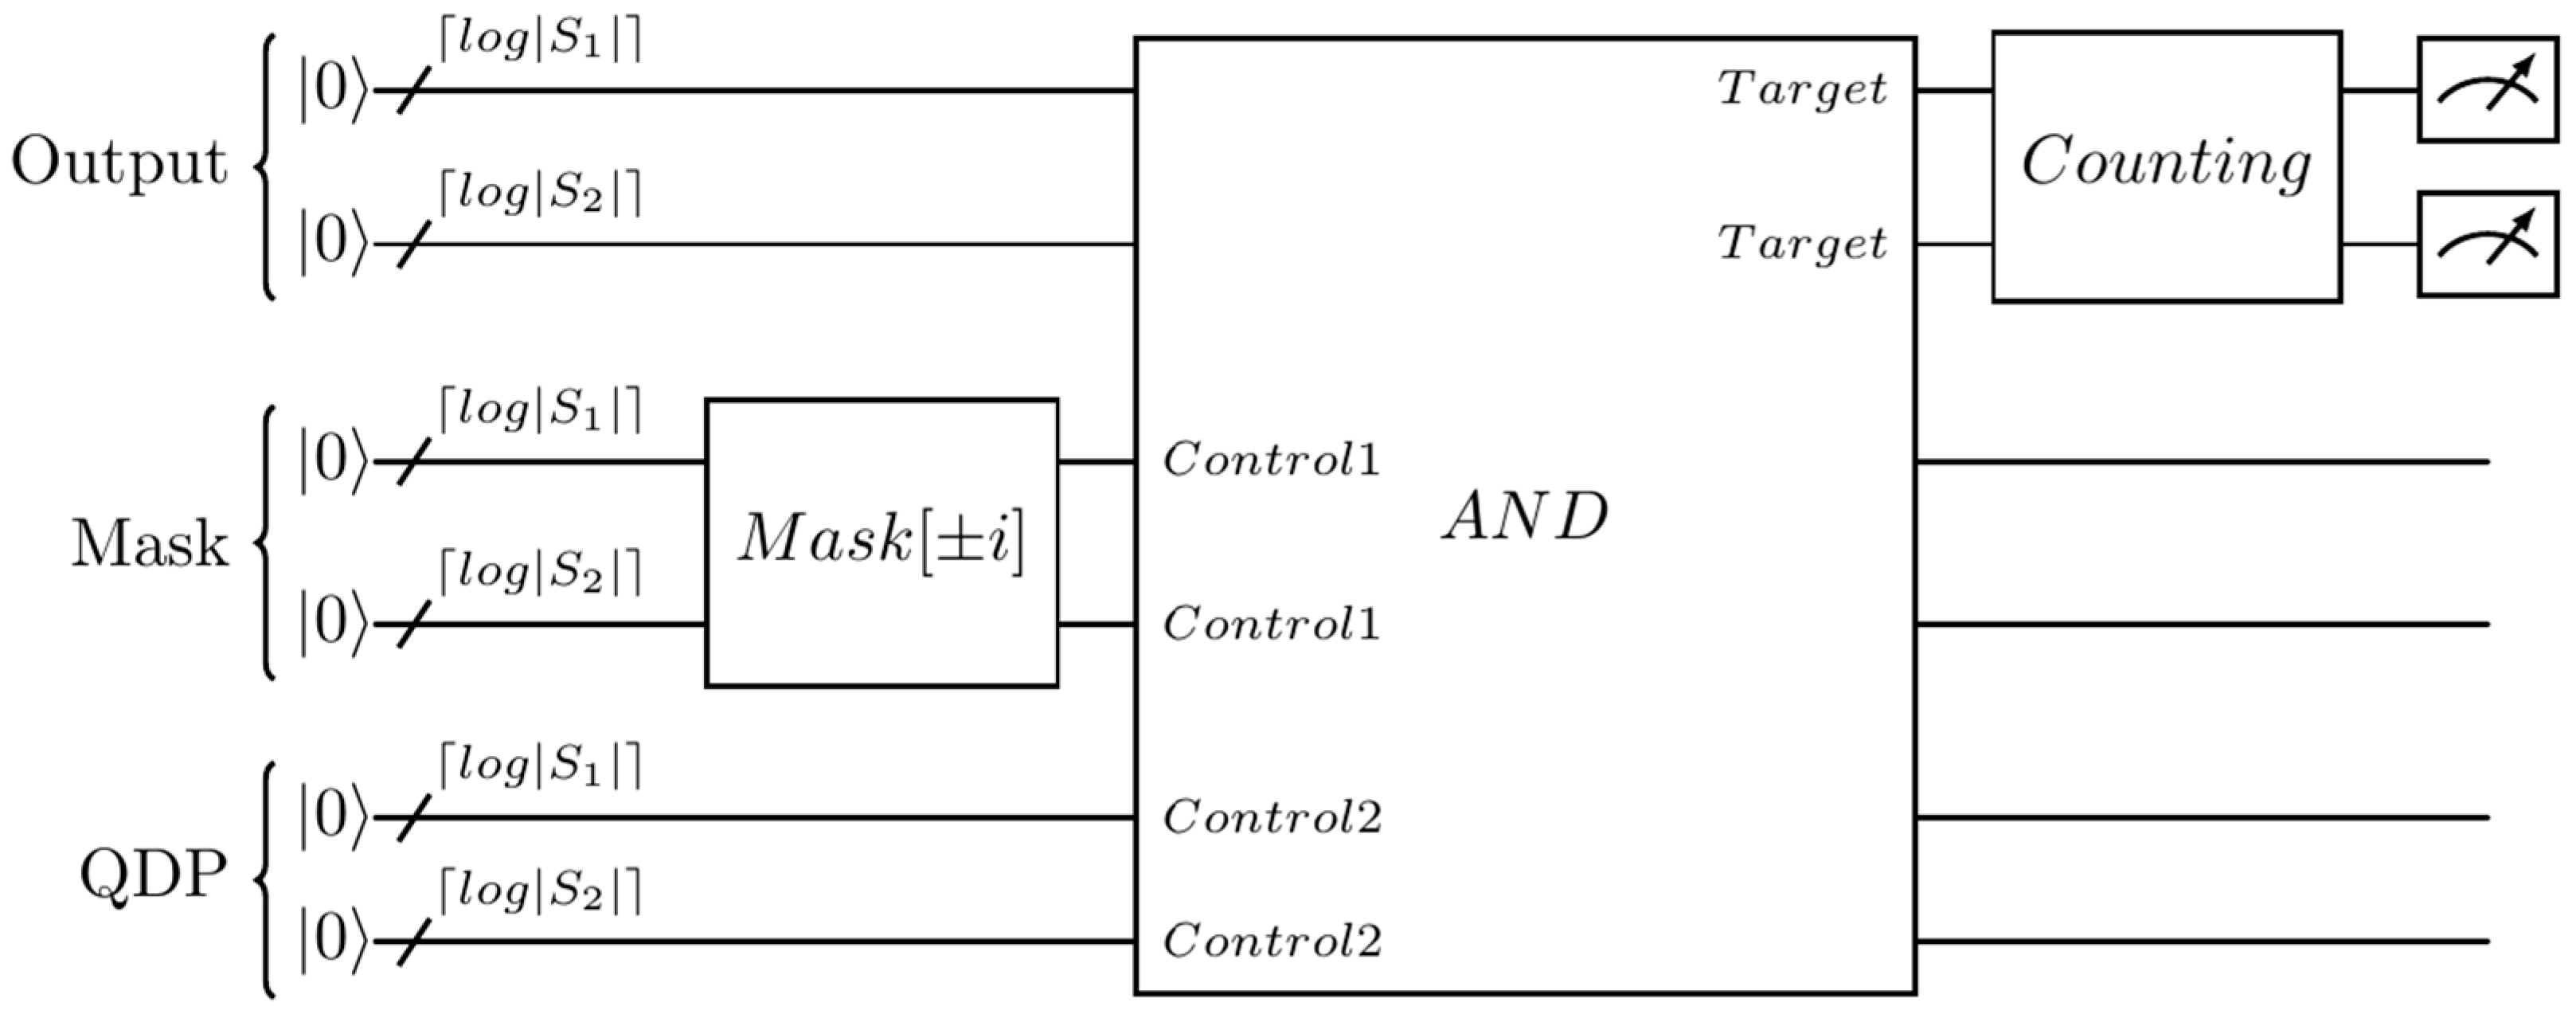
In this subroutine, the Hamming distance between a perfect (meaning continuous) diagonal and a random diagonal is calculated. The logic AND operation is applied to estimate the distance between the diagonals of the QDP and those of a dynamically transformed pattern (mask), as described in the QMap algorithm. These pattern transformations are realized as QDPs with a single perfect diagonal or more complex patterns that are designed according to statistical precalculated data based on dot noise distributions. Typically, we assume that one diagonal is tested per QMap execution, but sophisticated scanning policies and techniques may save drastically on diagonal scanning effort, something which is discussed later. In the final step, the known quantum counting algorithm is employed to determine the significance per diagonal of the QDP. The overall quantum circuit model is presented in Figure 6.
Note that related works on Hamming distance estimation, like those in [22,23,24], are incompatible with the architecture of our quantum algorithm.

3.2. Scanning Policy Strategies

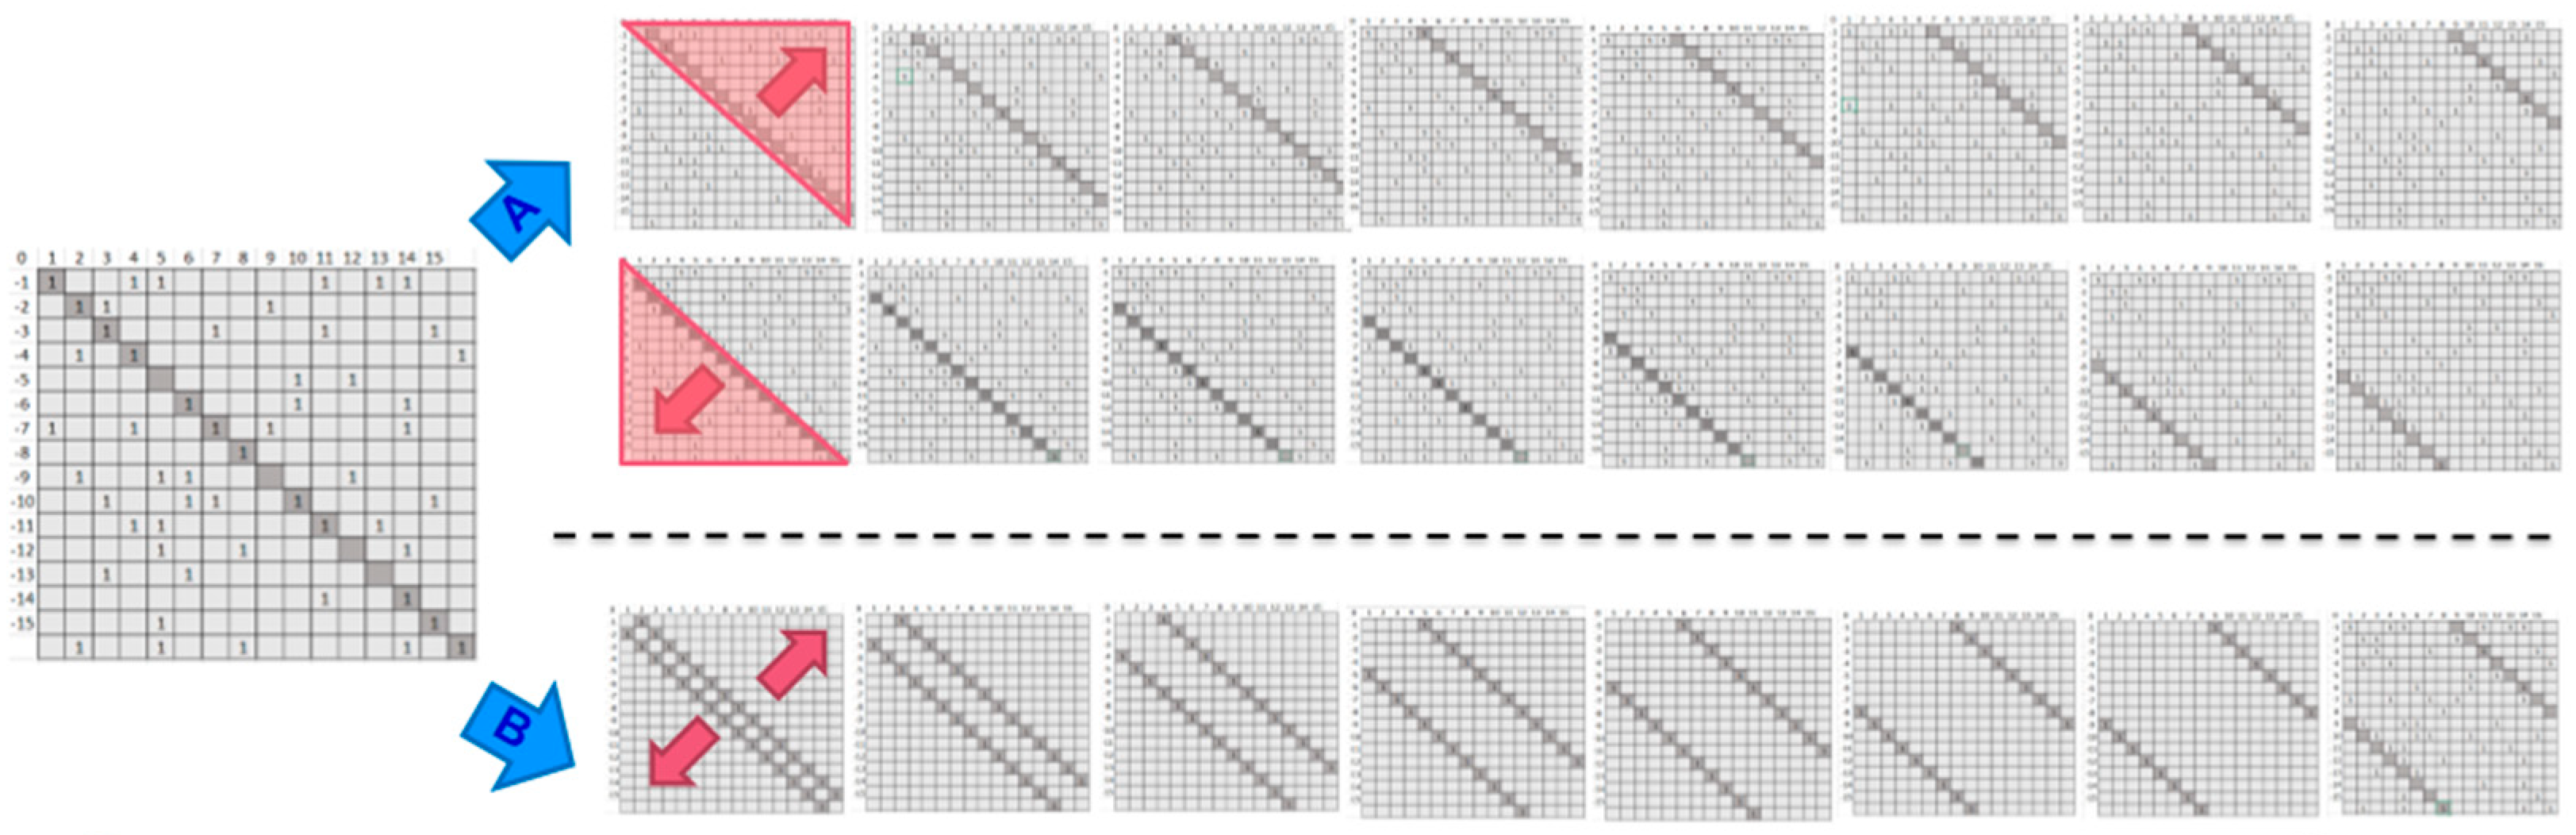
Matrix diagonals in a dot-plot can be scanned using different traversal strategies, potentially reducing runtime. Two representative protocols are considered. The first, single-diagonal scanning (Policy A), processes each candidate diagonal independently, requiring one execution of Subcircuit B per diagonal that satisfies the adopted significance criterion. Consequently, for a given dot-plot window, the number of Subcircuit B executions scales proportionally with the number of diagonals passing the significance threshold.
The second approach, parallel diagonal scanning (Policy B), jointly processes symmetric diagonal pairs (e.g., + i and i relative to the main diagonal), such that each accepted pair requires only one execution of Subcircuit B. Under ideal pairing conditions, this reduces the number of executions by approximately a factor of two compared to Policy A. More generalized schemes involving larger groups of diagonals could further reduce runtime; however, such approaches may compromise detection sensitivity. An illustrative example is presented below to demonstrate the operation of the proposed scanning policies.
In the 16 × 16 dot-plot example in Figure 7, it is considered that query and reference sequences have the same length, generating a square dot-matrix plot, and the threshold similarity is configured at 50%. Policy A requires the execution of Subcircuit B 16 times in total, while Policy B requires eight applications making a reduction of 50%.
A confidence-based analysis on Policy B provides the required statistical significance for the symmetric diagonal detection. Let i denote the diagonal offset with respect to the main diagonal ( i = 0 ), such that i > 0 corresponds to upper-triangular diagonals and i < 0 to lower-triangular diagonals. For each symmetric pair + i , i , we define the cumulative dot counts as Si = Ui + Di. Making the hypothesis of random matches and the probability of a random dot occurrence p , for a partial scan of t positions in each diagonal, the paired statistic follows as S i ( t ) B i n o m i a l ( 2 t , p ) . With expectation μ t = 2 t p and variance σ t 2 = 2 t p ( 1 p ) , for sufficiently large t , a normal approximation yields the standardized score:
z i ( t ) = S i ( t ) 2 t p 2 t p ( 1 p )
from which a confidence measure can be defined as
C i ( t ) = 1 Φ ( z i ( t ) )
where Φ ( ) denotes the cumulative normal distribution.
A diagonal pair is considered significant whenever C i ( t ) C t h r or equivalently z i ( t ) z t h r for a predefined confidence threshold. For example, z t h r 3 corresponds to approximately 99.9 % confidence.
This criterion enables early termination of diagonal scanning once sufficient statistical evidence is accumulated. Consequently, instead of fully traversing every diagonal, the detection process may terminate after observing only t r positions, where r denotes the complete diagonal length. The resulting average computational cost becomes O ( K E [ t ] ) , where K is the number of symmetric diagonal pairs and E [ t ] is the expected stopping point. Therefore, the proposed confidence-guided paired-diagonal strategy reduces redundant traversal, improves signal-to-noise discrimination, and provides a statistically principled mechanism for accelerating classical dot-matrix alignment.

4. Validity of Hamming Distance-Based Approach

In this section, the reliability of the Hamming distance-based diagonal evaluation is investigated by deriving probabilistic bounds on misclassification events and characterizing the statistical behavior of similarity scores under both null (random) and alternative (true alignment) hypotheses.
Let d = ( d 1 , , d L ) , with d i { 0,1 } , denote a diagonal and p , the probability of a random match (e.g., p = 1 / | σ | for uniform alphabet σ ). Each entry is modeled as an independent Bernoulli random variable:
i.
Null hypothesis H 0 (random similarity): d i Bernoulli ( p ) ;
ii.
Alternative hypothesis H 1 (true alignment): d i Bernoulli q , q > p .
Consider that H = i = 1 L ( 1 d i ) is the Hamming distance and S = 1 H L the normalized similarity score. Under either hypothesis, H follows a binomial distribution between B ( L , 1 p ) under H 0 and B ( L , 1 q ) under H 1 . Thus, the expected Hamming distance (or similarity score) satisfies
E [ S ] = p   under   H 0 ,   and   E [ S ] = q   under   H 1 .
When shifting the evaluation of our hybrid tool to realistic data, the Anderson-Darling test [25] was utilized to assess the underlying distribution of the matching scores. Such examples exist in the Supplementary Materials.
A false positive occurs when a random diagonal satisfies S τ . Using a Chernoff bound for sums of independent Bernoulli variables,
P r ( S τ ) e x p L   D ( τ p )
where D ( τ p ) is the Kullback–Leibler divergence:
D ( τ p ) = τ l o g τ p + ( 1 τ ) l o g 1 τ 1 p
So, the false positive probability decays exponentially with diagonal length L , provided τ > p .
A false negative occurs when a true alignment fails the threshold S < τ . By applying a Chernoff bound, it is
Pr S < τ exp L   D τ q , for     τ < q
Missed detections also decay exponentially with L , assuming the threshold is below the true match probability.
The threshold τ controls the trade-off between false positives and false negatives. A principled choice is p < τ < q . A common strategy is to set τ = p + q / 2 , which symmetrizes the exponential decay rates: Pr(FP) ≈ Pr(FN). For small L , asymptotic bounds become loose. Using the normal approximation,
S N p p ( 1 p ) L under   H 0 .
This highlights that variance scales as 1 / L , reinforcing that longer diagonals yield more reliable decisions.
Consequently, the Hamming distance-based criterion admits strong statistical guarantees due to the exponential error decay with diagonal length, explicit control of false positives and negatives via threshold τ , and robustness under large-scale parallel evaluation (multiple diagonals). However, if Bernoulli independence assumptions are relaxed (e.g., due to biological correlations), concentration inequalities still apply under weak dependence, though with looser constants. In practice, correlated matches increase variance, leading to weaker guarantees, while insertions/deletions violate positional alignment, leading to systematic bias in S . Our practice cannot provide a gap-aware (S.W. or N.W.) or substitution (like PAM/BLOSUM) mechanism. All in all, these properties justify its suitability within the proposed hybrid quantum-classical framework, if it is combined with dynamic programming or an equivalent alignment tool. This method is conceptually similar to the S&E paradigm used in tools like BLAST +2.17.0, where our diagonal scoring plays the role of a globalized seed detector.

5. Evaluation

The proposed system is evaluated on two fronts: performance and algorithmic and hardware complexity. A compact but systematically structured benchmark is used to evaluate the performance of our alignment pipeline, while complexity is investigated with respect to algorithmic escalation, execution time, and realistic feasibility.

5.1. Systematic Benchmark

The benchmark is constructed around controlled, interpretable sequence pairs with fully known ground truth, enabling precise attribution of errors to either the seeding or extension stage of the hybrid pipeline. Each subset isolates a single difficulty factor (e.g., substitutions, indels, or repeats) while systematically varying sequence length and mutation rate to probe scalability. The design supports both nucleotide and protein sequences, ensuring that local similarity detection and global refinement are evaluated in tandem. Unlike large-scale empirical benchmarks, our framework emphasizes controlled synthetic datasets with known ground truth, enabling precise attribution of errors to either the seeding or extension stages.
Our dataset composition consists of 290 sequence pairs, partitioned into the following categories:
(i)
Exact and near-exact matches (40 pairs);
(ii)
Controlled substitution regime (Hamming Sweep) (60 pairs);
(iii)
Indel perturbation set (70 pairs);
(iv)
Low-complexity and repetitive regions (30 pairs);
(v)
Orientation variants (20 pairs);
(vi)
Local similarity embedding (30 pairs);
(vii)
Protein substitution models (40 pairs).
Each pair is provided as two entries (seq1/seq2) with known implicit ground truth derived from the applied transformations. All simulation experiments were conducted via the Qiskit framework under a sliding window size of 16 or 32 bp.
Performance is quantified through complementary measures that capture both the correctness and the completeness of the alignment, as well as the effectiveness of intermediate steps in the hybrid pipeline. Alignment accuracy reflects how closely the predicted alignment matches the ground truth at the residue level (% correctly aligned positions), while completeness evaluates how much of the true aligned region is successfully recovered. At the seeding stage, metrics assess the ability to detect genuine similarity signals while limiting spurious matches. Additional indicators evaluate how reliably detected seeds are extended into coherent alignments, including continuity and boundary precision. Together, these metrics provide a structured view of performance across all stages of the algorithm.
All methods are executed on the same benchmark under consistent parameter settings to ensure fair comparison. The evaluation proceeds in a stage-wise manner, separately analyzing seed detection, extension, and final alignment reconstruction. Results are reported both per dataset category—highlighting specific strengths and failure modes—and in aggregate to summarize overall performance. To ensure reproducibility, all sequence pairs are generated with fixed random seeds and accompanied by complete ground-truth annotations. When applicable, experiments include multiple runs to account for stochasticity in quantum or probabilistic components, with results summarized using standard descriptive statistics.
(i)
Exact and near-exact matches
We assume a subset of four-tenths of sequence pairs with lengths of 16, 32, 64, and 128, respectively, to validate baseline correctness. The outcome is depicted in Table 2, with a mean accuracy of about 0.995 (±0.006).
In the regime of low mutation rates, alignment accuracy approaches unity, and performance differences are dominated by the ability of the seeding stage to maintain connectivity across indel-induced diagonal shifts.
Across 40 near-exact sequence pairs, the proposed hybrid aligner achieved a mean alignment accuracy of approximately 99.5%, with deviations primarily observed in indel-containing sequences, where seed fragmentation affects extension continuity.
(ii)
Controlled substitution regime (Hamming sweep)
This category is used to evaluate the sensitivity of seed detection under increasing mismatch rates. In this category, we actually run ~60 sequence pairs per mutation level. We consider sequence pairs of fixed length ( L = 64 ) under independent and identically distributed point mutations with rate p [ 0.0,0.05 , , 0.50 ] , without insertions or deletions. About 10 sequences per mutation level are considered, reaching a total of 110. Candidate seeds are of fixed length ( k = 4 –5). We assume that seed detection dominates performance, while the DP stage is near-optimal given a valid seed, with a small failure probability ( ϵ DP 1 –3%); the accuracy is estimated as A c c u r a c y     P d e t e c t ( 1 ϵ D P ) . In this category, alignment success is primarily governed by the probability of preserving at least one exact seed under the Hamming mutation model.
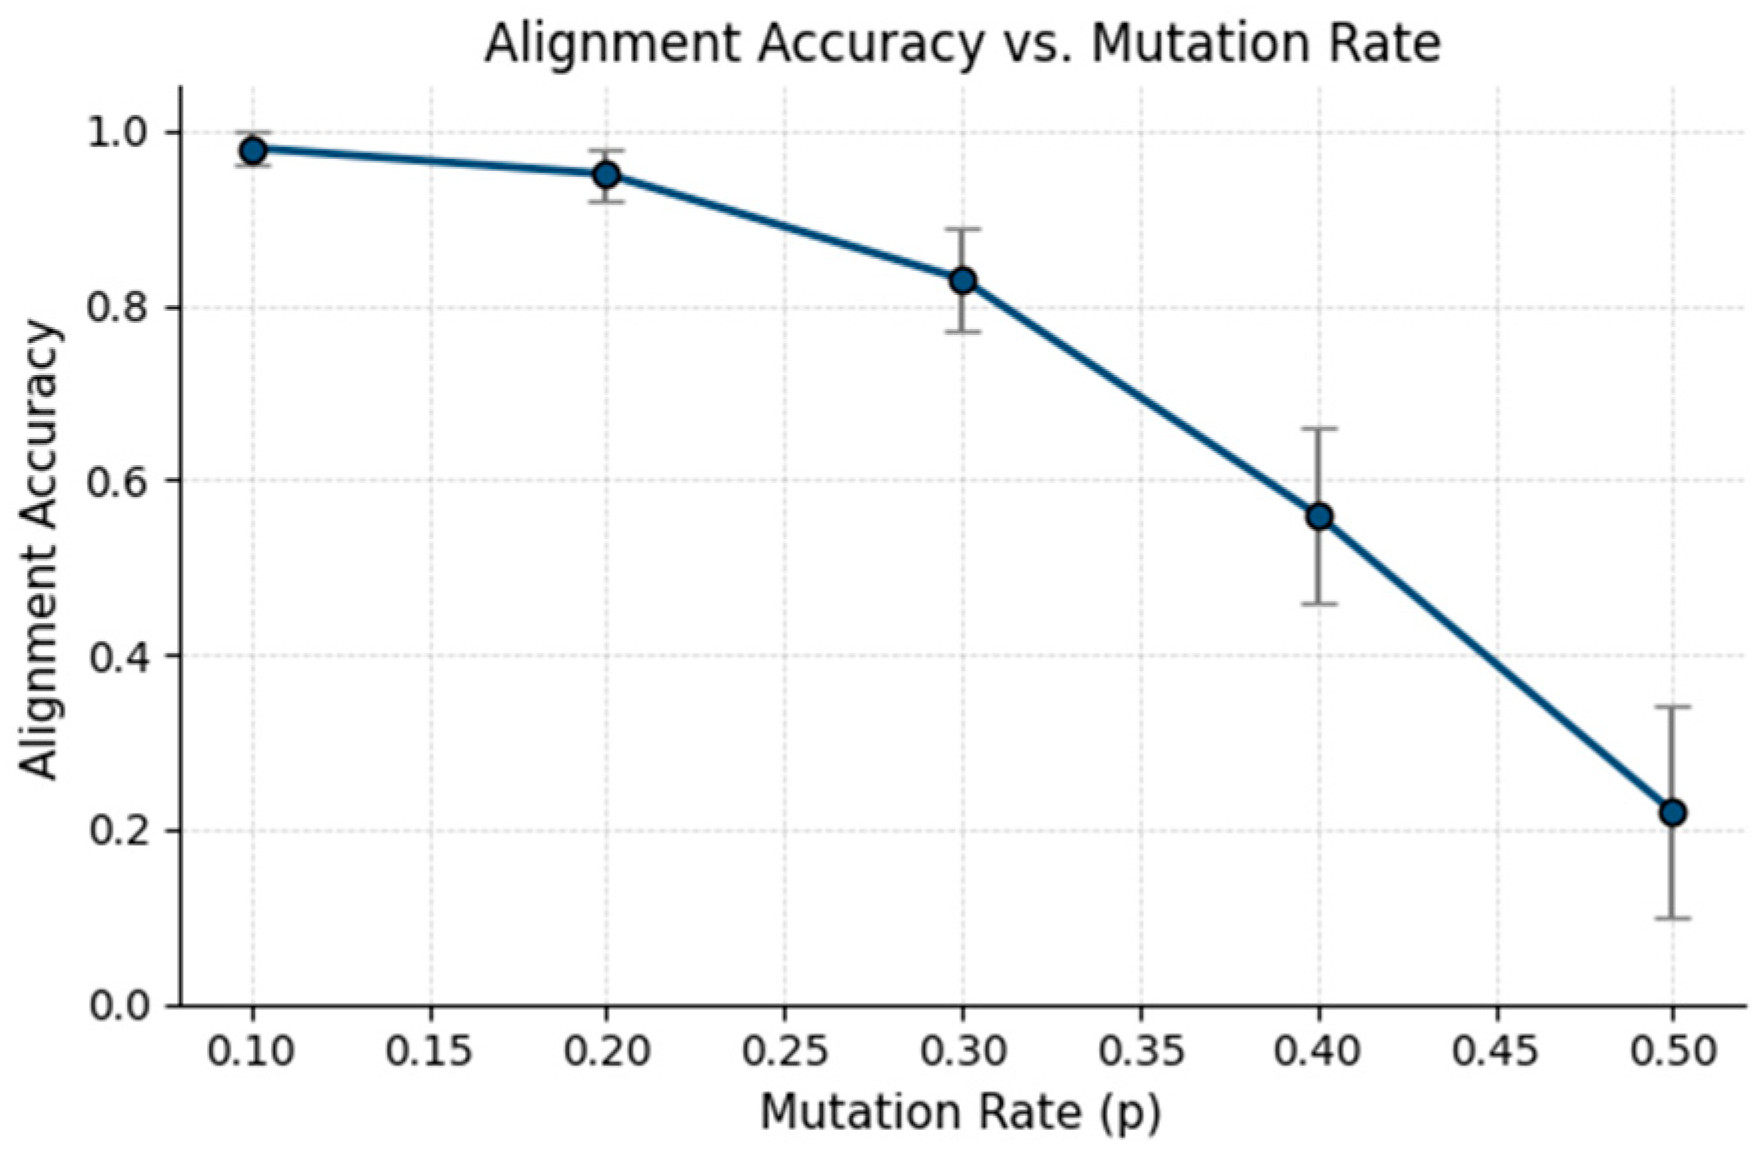
Figure 8 illustrates the dependence of alignment accuracy on the substitution rate under the controlled Hamming regime. The results exhibit a clear phase transition: accuracy remains near-optimal for mutation rates below 15–20%, followed by a gradual degradation and a sharp decline beyond 30%. This behavior is consistent with the exponential decay in seed survival probability, which governs the success of S&E strategies.
A Hamming distance-based seed detection strategy is sufficient for accurate alignment up to moderate mutation rates (~25–30%), beyond which the probability of contiguous seed preservation decays exponentially, leading to a phase transition in alignment performance.
Coverage becomes largely redundant with alignment accuracy, as the absence of indels implies that successful seed detection leads to near-complete reconstruction of the alignment. Consequently, coverage exhibits a threshold behavior mirroring seed detection probability. However, this metric becomes critical in more complex regimes involving indels or local similarities, where partial alignment recovery is possible.
(iii)
Indel perturbation set
The experimental setup is conducted on a controlled FASTA dataset of 40 sequence pairs. The dataset includes three subcategories: 25 pairs with single long indels (5–20 in length), 25 pairs with multiple short indels (1–3 in length), and 20 pairs with shifted alignments (5–30 positions), with sequence lengths ranging approximately from 64 to 80 nucleotides. The pipeline is executed under fixed parameter settings in two stages: a seed detection phase (quantum-assisted or classical dot-matrix-based) followed by dynamic programming-based extension.
The results in Table 3 indicate that indel-induced perturbations have a pronounced and non-uniform impact on alignment accuracy across subcategories. In particular, sequences containing a single long insertion or deletion exhibit the lowest performance (≈0.60), reflecting the strong disruption of diagonal continuity and the resulting degradation of seed detection. In contrast, multiple short indels are handled more effectively (≈0.77), as partial diagonal structures remain detectable and can still guide the extension phase. Shifted alignments fall in between (≈ 0.71), where seed detection is feasible but requires correct anchoring. Overall, the average accuracy of ≈0.70 highlights that the dominant limitation of the hybrid pipeline lies in the robustness of the seeding stage rather than in the dynamic programming refinement.
Completeness consistently exceeds strict alignment accuracy across all subcategories, indicating that the hybrid approach is generally able to recover substantial portions of the true alignment even when exact positioning is imperfect. In the presence of long indels, coverage remains relatively high (≈0.70–0.80), suggesting that fragmented seeds still capture significant alignment segments. Performance improves further for multiple short indels (≈0.85–0.92) and shifted alignments (≈0.80–0.88), where residual structural coherence supports more extensive reconstruction. These findings suggest that while indels primarily affect boundary precision and global consistency, the underlying similarity signal is still sufficiently preserved to enable meaningful partial recovery.
Indel perturbations reveal that hybrid S&E aligners are fundamentally seed-limited rather than extension-limited, with long insertions and deletions constituting the primary source of performance degradation due to their disruption of diagonal continuity in dot-matrix representations. While dynamic programming reliably reconstructs alignments given correct seeds, failures in seed detection propagate directly to reduced overall accuracy. Notably, Hamming distance-based similarity measures prove insufficient in this regime, as they do not capture indel-induced structural variation. Consequently, alignment errors predominantly arise from seed fragmentation, mis-chaining, and boundary inaccuracies, highlighting the need for more robust seed detection and aggregation strategies.
(iv)
Low-complexity and repetitive regions
This group was used to evaluate false positive seed generation. We consider a representative subset of 30 sequence pairs divided into 10 pairs of homopolymers, 10 pairs of tandem repeats, and 10 pairs of low-complexity protein regions (periodic motifs). Their lengths are 64–128, the mutation rate is 5–15%, and with short indels (1–3 bp/residues).
In low-complexity and repetitive regions, the proposed hybrid aligner maintains high alignment completeness (≈0.94) due to robust seed recall (true seed detected/total true seeds) but exhibits reduced alignment accuracy (≈0.85) because of substantial seed ambiguity. These findings are provided in Table 4. This behavior is consistent with the intrinsic limitations of Hamming distance-based similarity measures, which fail to sufficiently discriminate between repetitive patterns according to seed precision (false positive seed rate). Nevertheless, the downstream dynamic programming stage mitigates these effects, enabling recovery of the correct alignment in the majority of cases. Moreover, incorporating additional techniques. such as seed filtering (entropy-based), k -mer uniqueness weighting or diagonal consistency pruning, can further improve accuracy.
More specifically, alignment ambiguity can be handled explicitly rather than suppressed. A structural consistency scoring layer, which evaluates diagonal coherence and fragmentation, filtering out geometrically inconsistent alignments even when their scores are similar, may effectively reduce ambiguity.
(v)
Orientation variants
A compact orientation-variant benchmark consisting of reverse, reverse-complement, and segment-permuted sequence pairs was used to estimate the robustness of the hybrid alignment framework under geometric transformations of the similarity matrix. A total of about 20 pairs were used. Approximate experimental analysis indicates that orientation-aware seed detection preserves high alignment quality, achieving an estimated mean alignment accuracy between 88% and 94% across all transformation classes, as seen in Table 5. Reverse and reverse-complement cases maintain strong performance due to preserving diagonal coherence under transformed coordinate systems. In contrast, segment permutations introduce seed fragmentation and reduce alignment completeness. These observations suggest that orientation sensitivity primarily affects the seed extraction stage. The dynamic programming refinement stage remains relatively stable once sufficient seed localization is achieved.
(vi)
Local similarity embedding
We constructred a benchmark dataset consisting of 40 synthetic nucleotide sequence pairs designed to evaluate local sequence alignment. Each pair contains a conserved subsequence of 20–50 nucleotides, embedded within random background regions of 128–256 nucleotides. Four similarity regimes (95%, 90%, 80%, and 70% identity) are included to systematically assess the degradation of seed detection and alignment reconstruction as sequence divergence increases. The dataset provides exact ground-truth coordinates for the embedded homologous regions, enabling quantitative evaluation of seed recall, alignment accuracy, and reconstruction completeness in both classical and quantum-assisted alignment pipelines. The results are presented in Table 6.
(vii)
Protein substitution models
We constructed a benchmark dataset consisting of 30 curated protein sequence pairs, organized into three substitution regimes: conservative, mixed, and non-conservative mutations. The dataset is designed to evaluate hybrid sequence aligners that combine quantum-assisted seed detection with classical dynamic programming refinement in a seed-and-extend framework. Each pair represents a controlled evolutionary divergence scenario, enabling systematic assessment of alignment accuracy, seed sensitivity, reconstruction completeness, and robustness under varying levels of local similarity degradation (see Table 7). Conservative substitution pairs preserve strong diagonal continuity and simulate closely related homologs, whereas mixed and non-conservative substitutions progressively increase alignment difficulty by fragmenting local similarity patterns.
This benchmark indicates that the proposed hybrid alignment framework maintains high alignment fidelity under moderate evolutionary divergence. Conservative amino acid substitutions preserve local similarity patterns, allowing reliable seed extraction and near-optimal downstream refinement. Experimental estimations suggest alignment accuracies exceeding 95% for low-divergence homologs and remaining above 90% for medium-divergence cases. Performance degrades more significantly under highly non-conservative substitution, where diagonal continuity in the similarity matrix becomes fragmented, reducing seed recall and increasing dependence on the dynamic programming extension stage. Nevertheless, the framework retains acceptable reconstruction completeness even in high-divergence scenarios, demonstrating the robustness of the combined seeding and refinement architecture.

5.2. Complexity Analysis

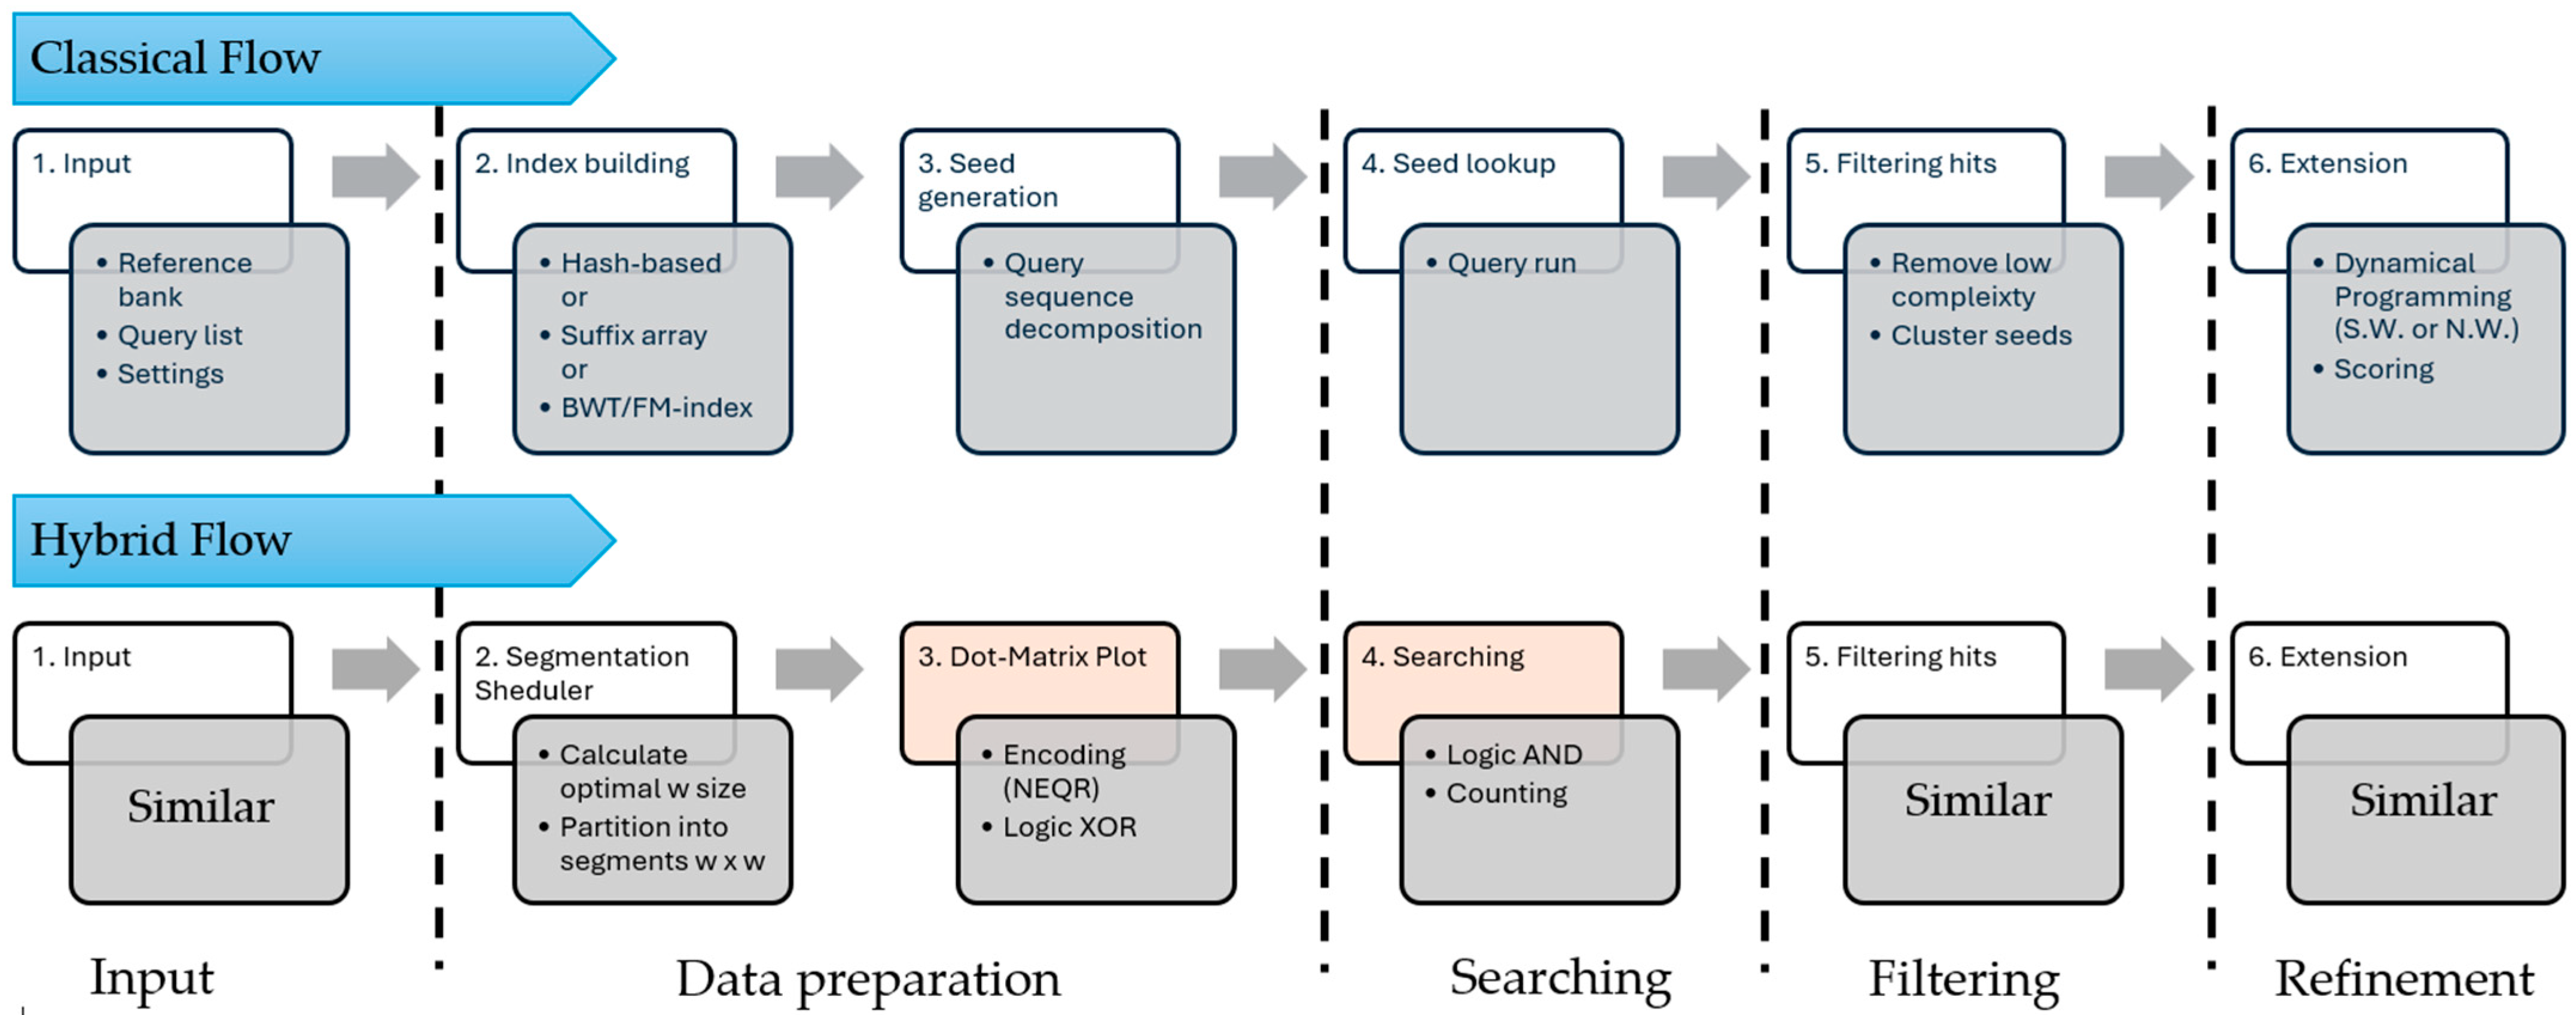
We evaluate the overall complexity of the proposed hybrid system by comparing it with a classical equivalent. For a reliable estimation, we consider discrete steps of a typical baseline S&E process. Both pipeline flows are presented and compiled under the same staging in Figure 9 to facilitate our complexity analysis. Although direct comparison between two different hardware systems is not strictly valid, our approximate mapping between discrete pipeline steps enables a consistent evaluation. Running a comparative study directly with its exact classical analog would not be so challenging, as the generation of the QDP is superior due to quantum parallelism [9]. So, the most competitive components of modern S&E tools are selected and compared in Table 6.
We mainly focus on “Data preparation” and “Searching” stages, as the others are almost similar between the two pipeline flows. Further information about “Filtering” or “Refinement” stages can be found in our Supplementary Materials.
Most classical S&E aligners rely on compressed full-text indexing to balance speed, sensitivity, and memory efficiency. At the core of this paradigm are the Burrows–Wheeler Transform (BWT) and the FM-index tools, which enable efficient substring search over a reference genome of length L r . Instead of explicitly storing all possible seeds, as in hash-based methods, these techniques reorganize the reference into a structure that supports backward search, allowing query patterns (reads) of length L q to be matched in O ( L q ) time. During the preprocessing phase, the construction of the BWT/FM-index incurs a one-time memory cost of O ( L r ) , which is then reduced to a compressed representation that still scales linearly with L r . Once the index is built, query processing for reads of length L q requires only constant auxiliary memory, O ( 1 ) , as the backward search maintains a small set of interval pointers regardless of L q . Consequently, the memory footprint remains stable even when processing large volumes of reads, with only the output size depending on the number of matches rather than directly on L q .
An additional parameter to modify query complexity is the lookup factor (or sampling) k of the suffix array. This parameter determines the trade-off between memory usage O ( L r / k ) and the cost of locating occurrences, leading to a query complexity of O ( L q + k ) . Furthermore, when approximate matching is considered (e.g., allowing mismatches), the effective complexity may increase depending on the search strategy and branching factor.
In the following, the complexity of the hybrid pipeline is analyzed for the same stages:
A.
Complexity of Subcircuit_A
Encoding: In the NEQR encoding framework, information values are loaded into data qubits through multi-controlled-NOT (MCX) operations conditioned on position registers. Consider an alphabet Σ of cardinality | Σ | , where each symbol is represented using w = log 2 | Σ | qubits. Let L denote the sequence length and n = l o g 2 L the number of positional qubits. During state preparation, each sequence position requires controlled writing of the corresponding symbol into the w -qubit data register. In the worst case, every symbol bit may require a controlled flip operation, yielding at most w L MCX gates. Since each MCX gate is conditioned on the positional register, the number of controls equals n . When ancillary qubits are available, an n -controlled NOT gate can be decomposed into elementary quantum gates with linear cost O ( n ) . Consequently, the overall NEQR encoding complexity becomes O ( w L n ) , or equivalently, O L l o g 2 | Σ | l o g 2 L . Thus, the gate complexity scales linearly with the sequence length and logarithmically with both the alphabet size and positional space. For fixed alphabets, such as DNA, where | Σ | = 4 and therefore w = 2 , the alphabet-dependent term becomes constant, and the complexity reduces to O ( L l o g L ) . This represents the typical asymptotic gate complexity of ancilla-assisted NEQR state preparation.
The Espresso logic minimization algorithm [26] reduces this cost by compressing the Boolean function into a minimized sum of implicants (logical cubes). Instead of implementing one gate per pixel, the circuit implements one gate per implicant K , not the total number of pixels M . If Espresso produces K implicants, and each implicant depends on k i address variables with l i negations, the exact gate count becomes
G t o t a l = i = 1 K [ ( 2 k i 3 ) + 2 l i ]
Since typically K M , especially for structured images, this produces significant compression in both gate count and circuit depth.
In terms of scaling with input size, the Espresso-compressed implementation scales as O ( K ) , where empirically K = O ( M α ) with 0.3 α 0.8 . There is no proven bound.
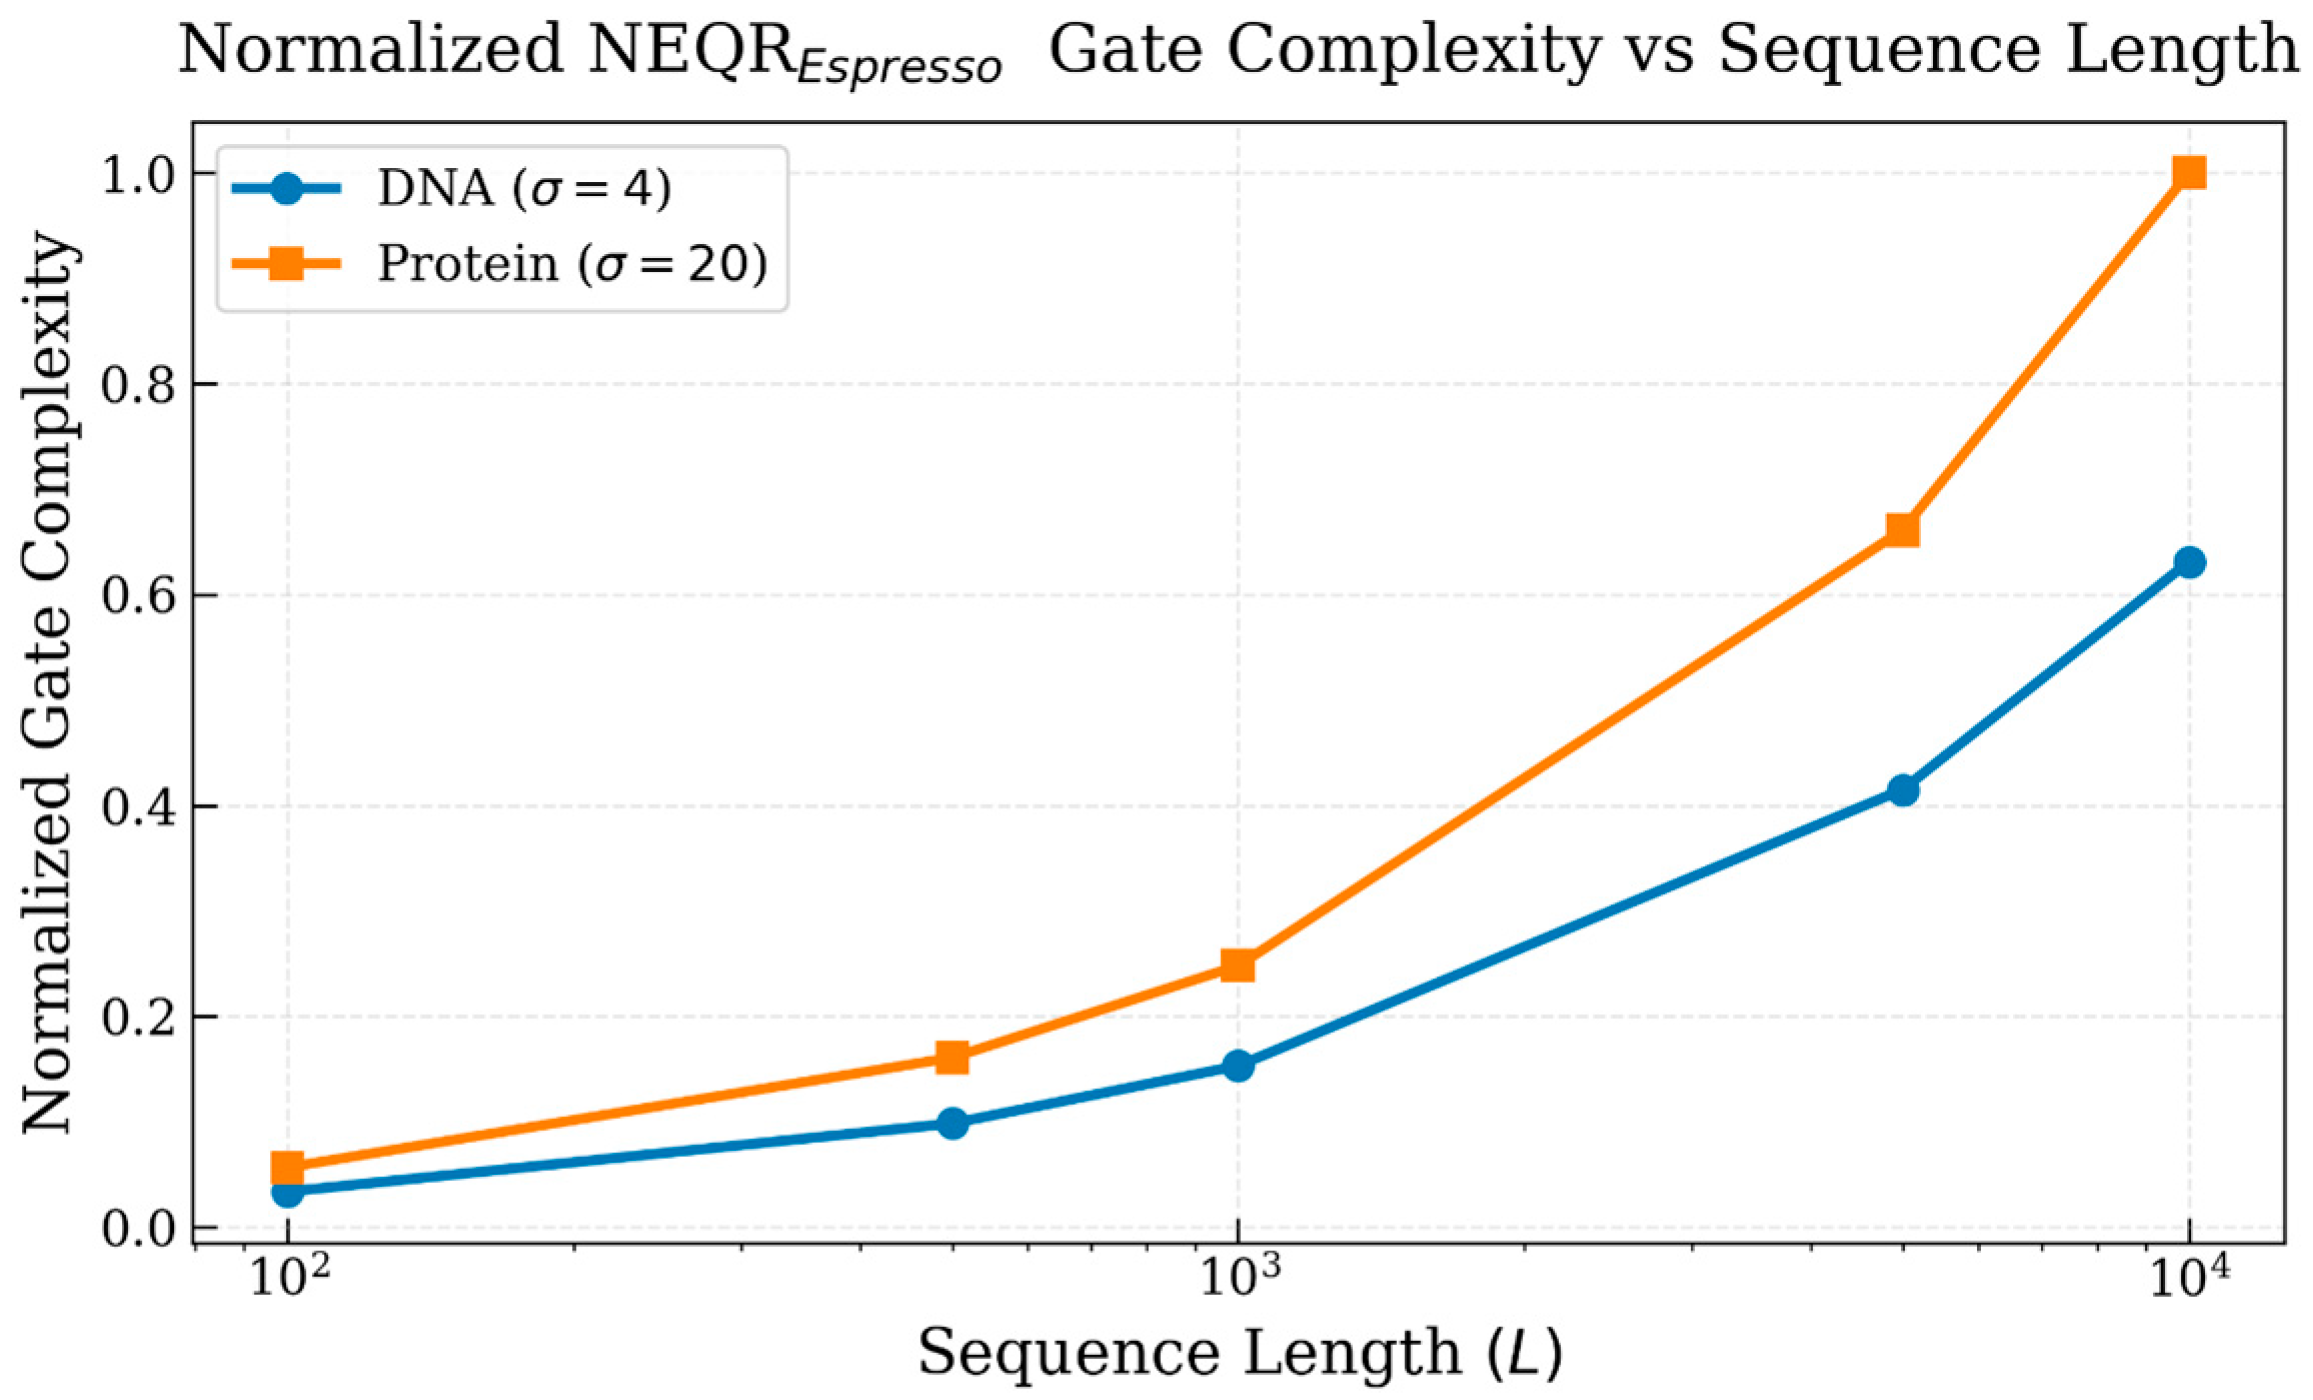
To analyze the impact of alphabet size on the NEQR–Espresso encoding cost, the gate-count evolution was evaluated as a function of sequence length for DNA ( σ = 4 ) and protein ( σ = 20 ) datasets. The proposed model assumes that the compressed gate complexity scales according to
G ( L , σ ) ( L l o g 2 σ ) α l o g ( L l o g 2 σ )
where L denotes sequence length, σ is the alphabet size, and α represents the empirical compression factor introduced by Espresso minimization. A representative value α = 0.5 was adopted to model practical sublinear compression behavior. Since larger alphabets require additional symbol-encoding qubits, protein datasets incur a higher gate count than DNA datasets for identical sequence lengths. The resulting curves in Figure 10 demonstrate that Espresso preserves sublinear growth while revealing the dependence of quantum encoding cost on biological alphabet complexity.
Quantum logic XOR: Dot-matrix plot generation requires a logarithmic number of controlled-Not gates with respect to the data size | σ | , without being affected by any input sequence length. For the majority of applications, this approach incurs a minimal fixed overhead, ranging from 20 to 34 gates for 2-qubit data (e.g., DNA), contingent upon the chosen architecture.
B.
Complexity of Subcircuit_B
Mask preparation: It is encoded with the NEQR scheme, as well. Due to its simple construction, the encoding cost is always low. Its runtime cost is always absorbed by QDP construction; thus, it is ignored in the overall analysis in the end. ESPRESSO optimization can be applied, too.
Quantum logic AND: The same regime is considered with multi-controlled-Not gates of the NEQR encoding scheme. ESPRESSO optimization can be applied too.
Quantum Counting: In the dot-matrix framework, the known quantum counting algorithm as proposed by [27] does not yield an asymptotic speedup in gate complexity over classical counting O ( w 2 ) . The overhead introduced by phase estimation results in an additional logarithmic factor, leading to an overall complexity of O ( w 2 l o g w ) , which deteriorates the overall complexity of the QMap algorithm.
Replacing phase-estimation-based quantum counting with the Aaronson–Rall approximate counting procedure [28] removes the inverse QFT and controlled Grover power construction while preserving the same asymptotic query complexity. For a binary NEQR dot-matrix of size w × w , the resulting gate complexity becomes O w M log w ε , where M denotes the number of matching cells and ε the target relative error. This yields a significant reduction compared to the O ( w 2 l o g w ) complexity of the standard quantum counting implementation.
Finally, Table 8 summarizes complexities for all steps of both classical and hybrid pipelines.

5.2.1. Logical-Level Asymptotic Computing Analysis

In this section, the computational behavior of our quantum circuit is approximated in terms of gate counts, time and memory, only for its core part (Subcircuit_A). The rest of the circuit (Subcircuit_B) depends highly on Subcircuit_A, and its evolution depends on pattern encoding combined with the scanning policy selection. So, Subcircuit_B can have a high degree of variability, being translated as many different computing fixed overheads to be added to the overall complexity cost, which is escalated according to the input size. This current analysis is a qualitative approximation based on the logical design of the circuit and not any transpiled version of a particular hardware backend.
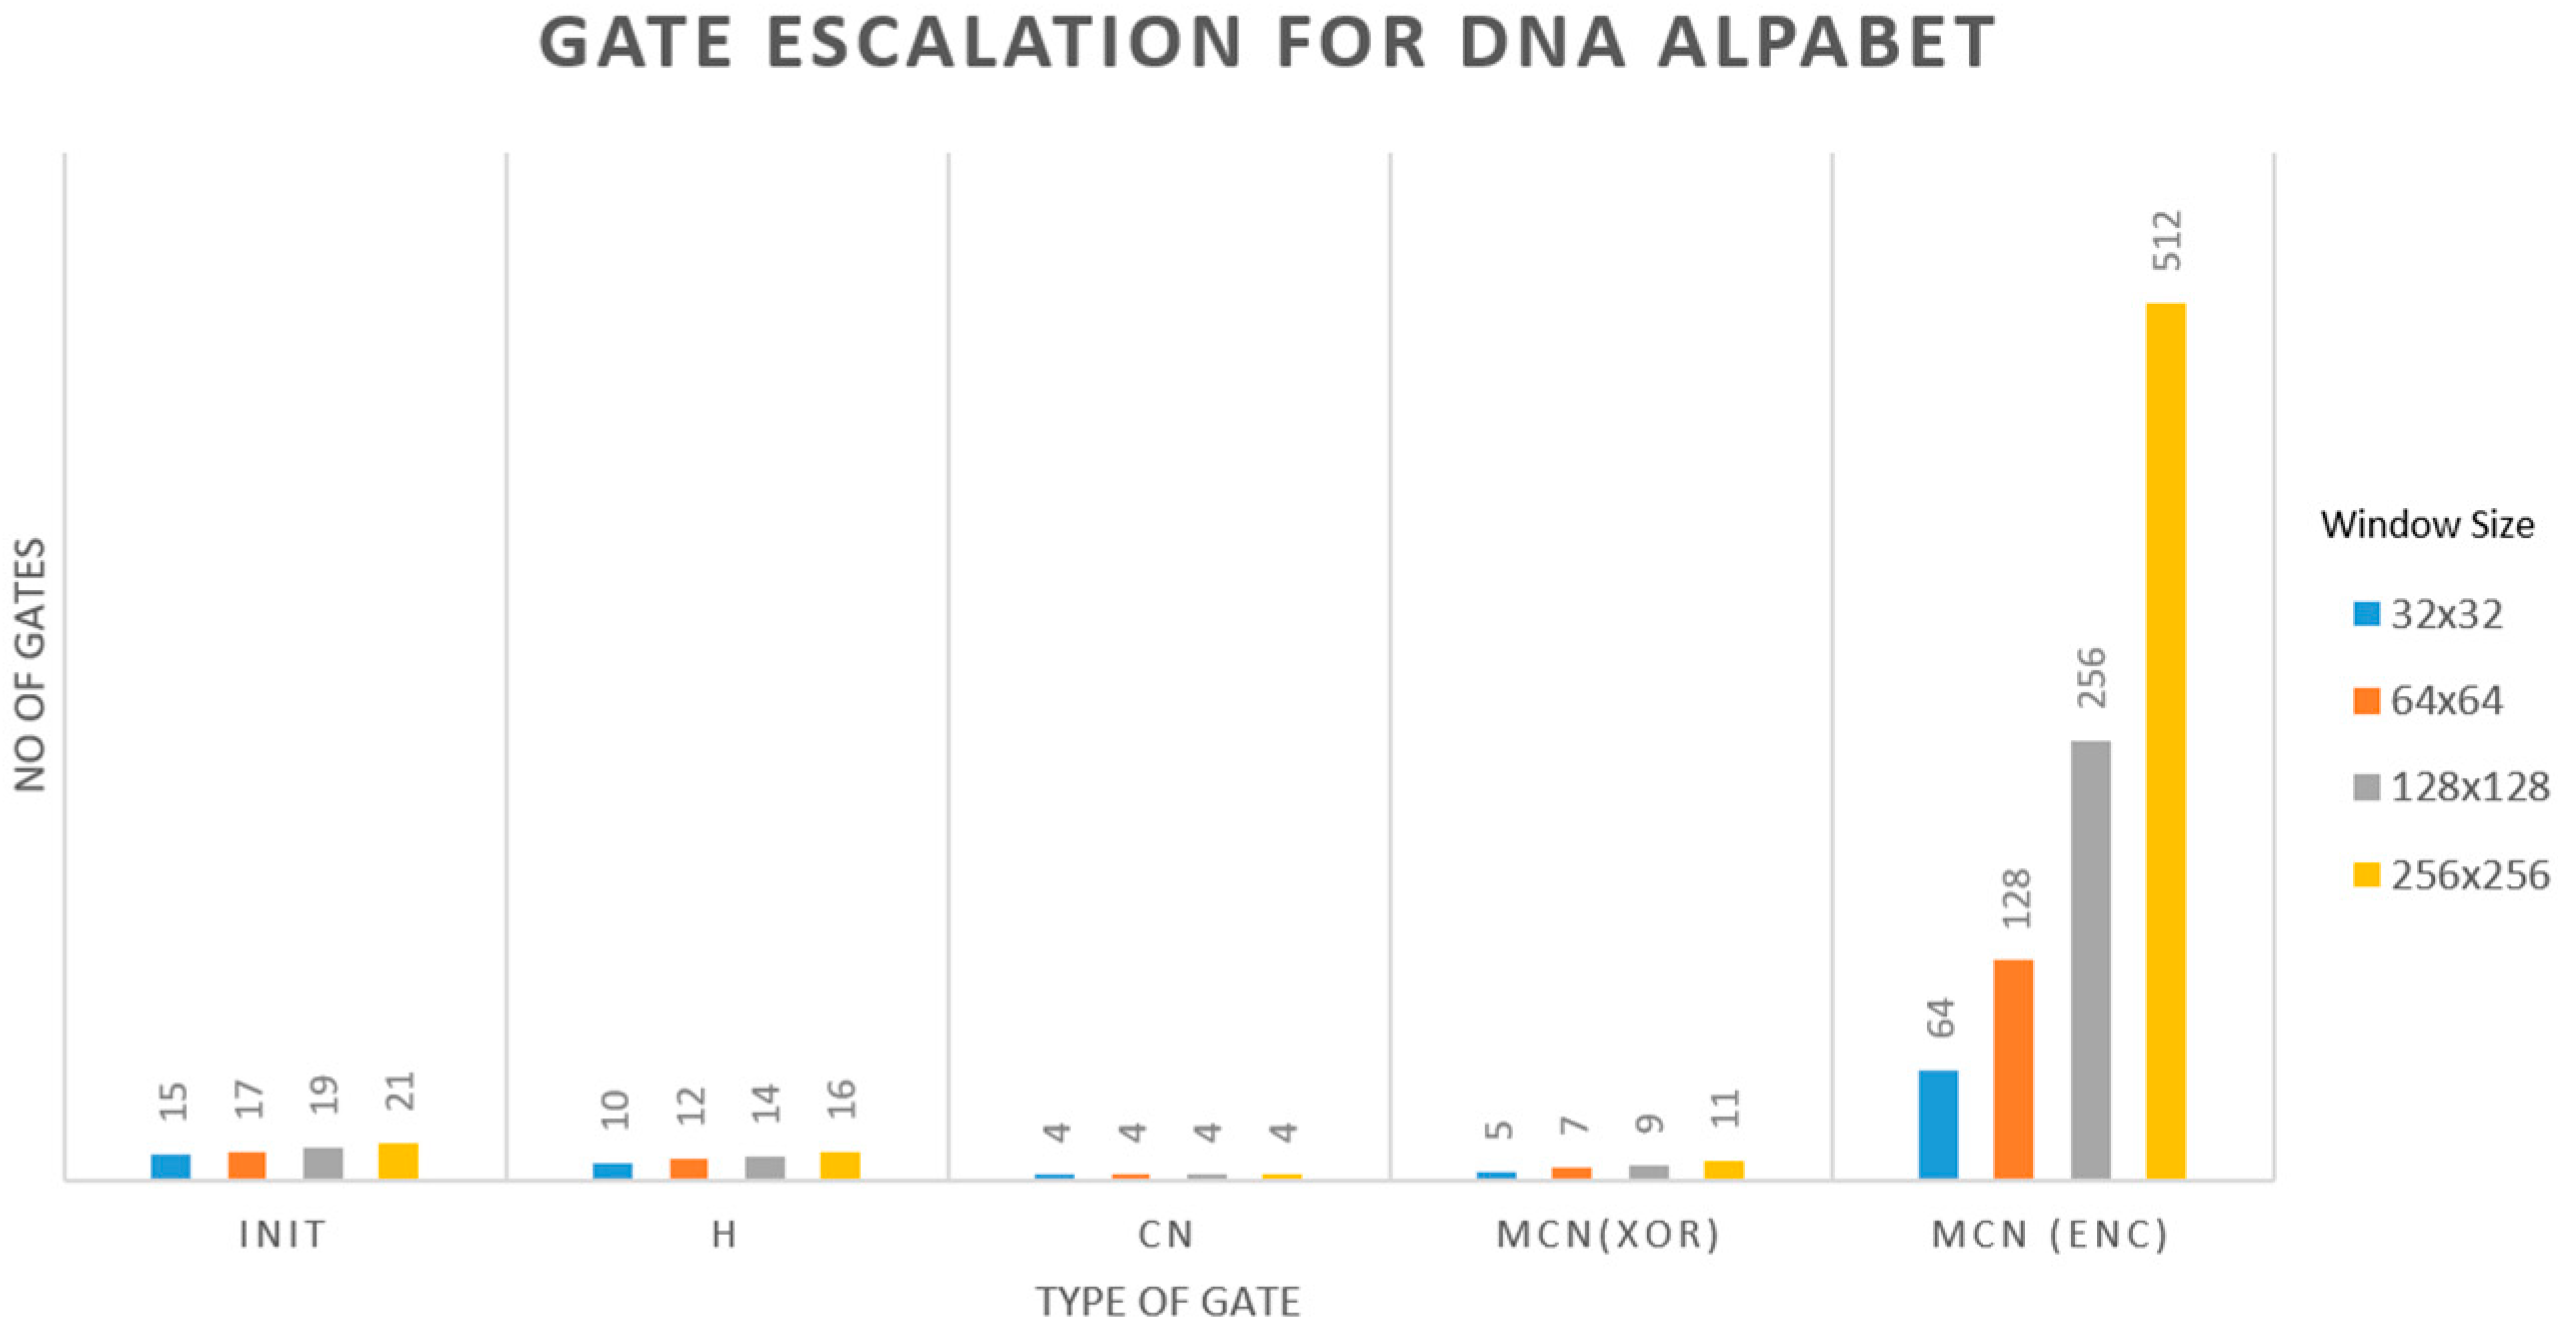
In Figure 11, the gate cost is estimated in terms of qubit preparation (INIT), Hadamard transformations (H), controlled-Not (CN), or multi-controlled-Not (MCN) operations. The alphabet size is a four-character length set, and the overall gate consumption is estimated for four different sizes of sliding windows. The cost for each MCN can furtherly be expressed in terms of CN gates by adopting the advanced single-ancilla [29] or the basic controlled- controlled-Not (CCN) chain [30] technique which are described in the Supplementary material with their pros and cons.
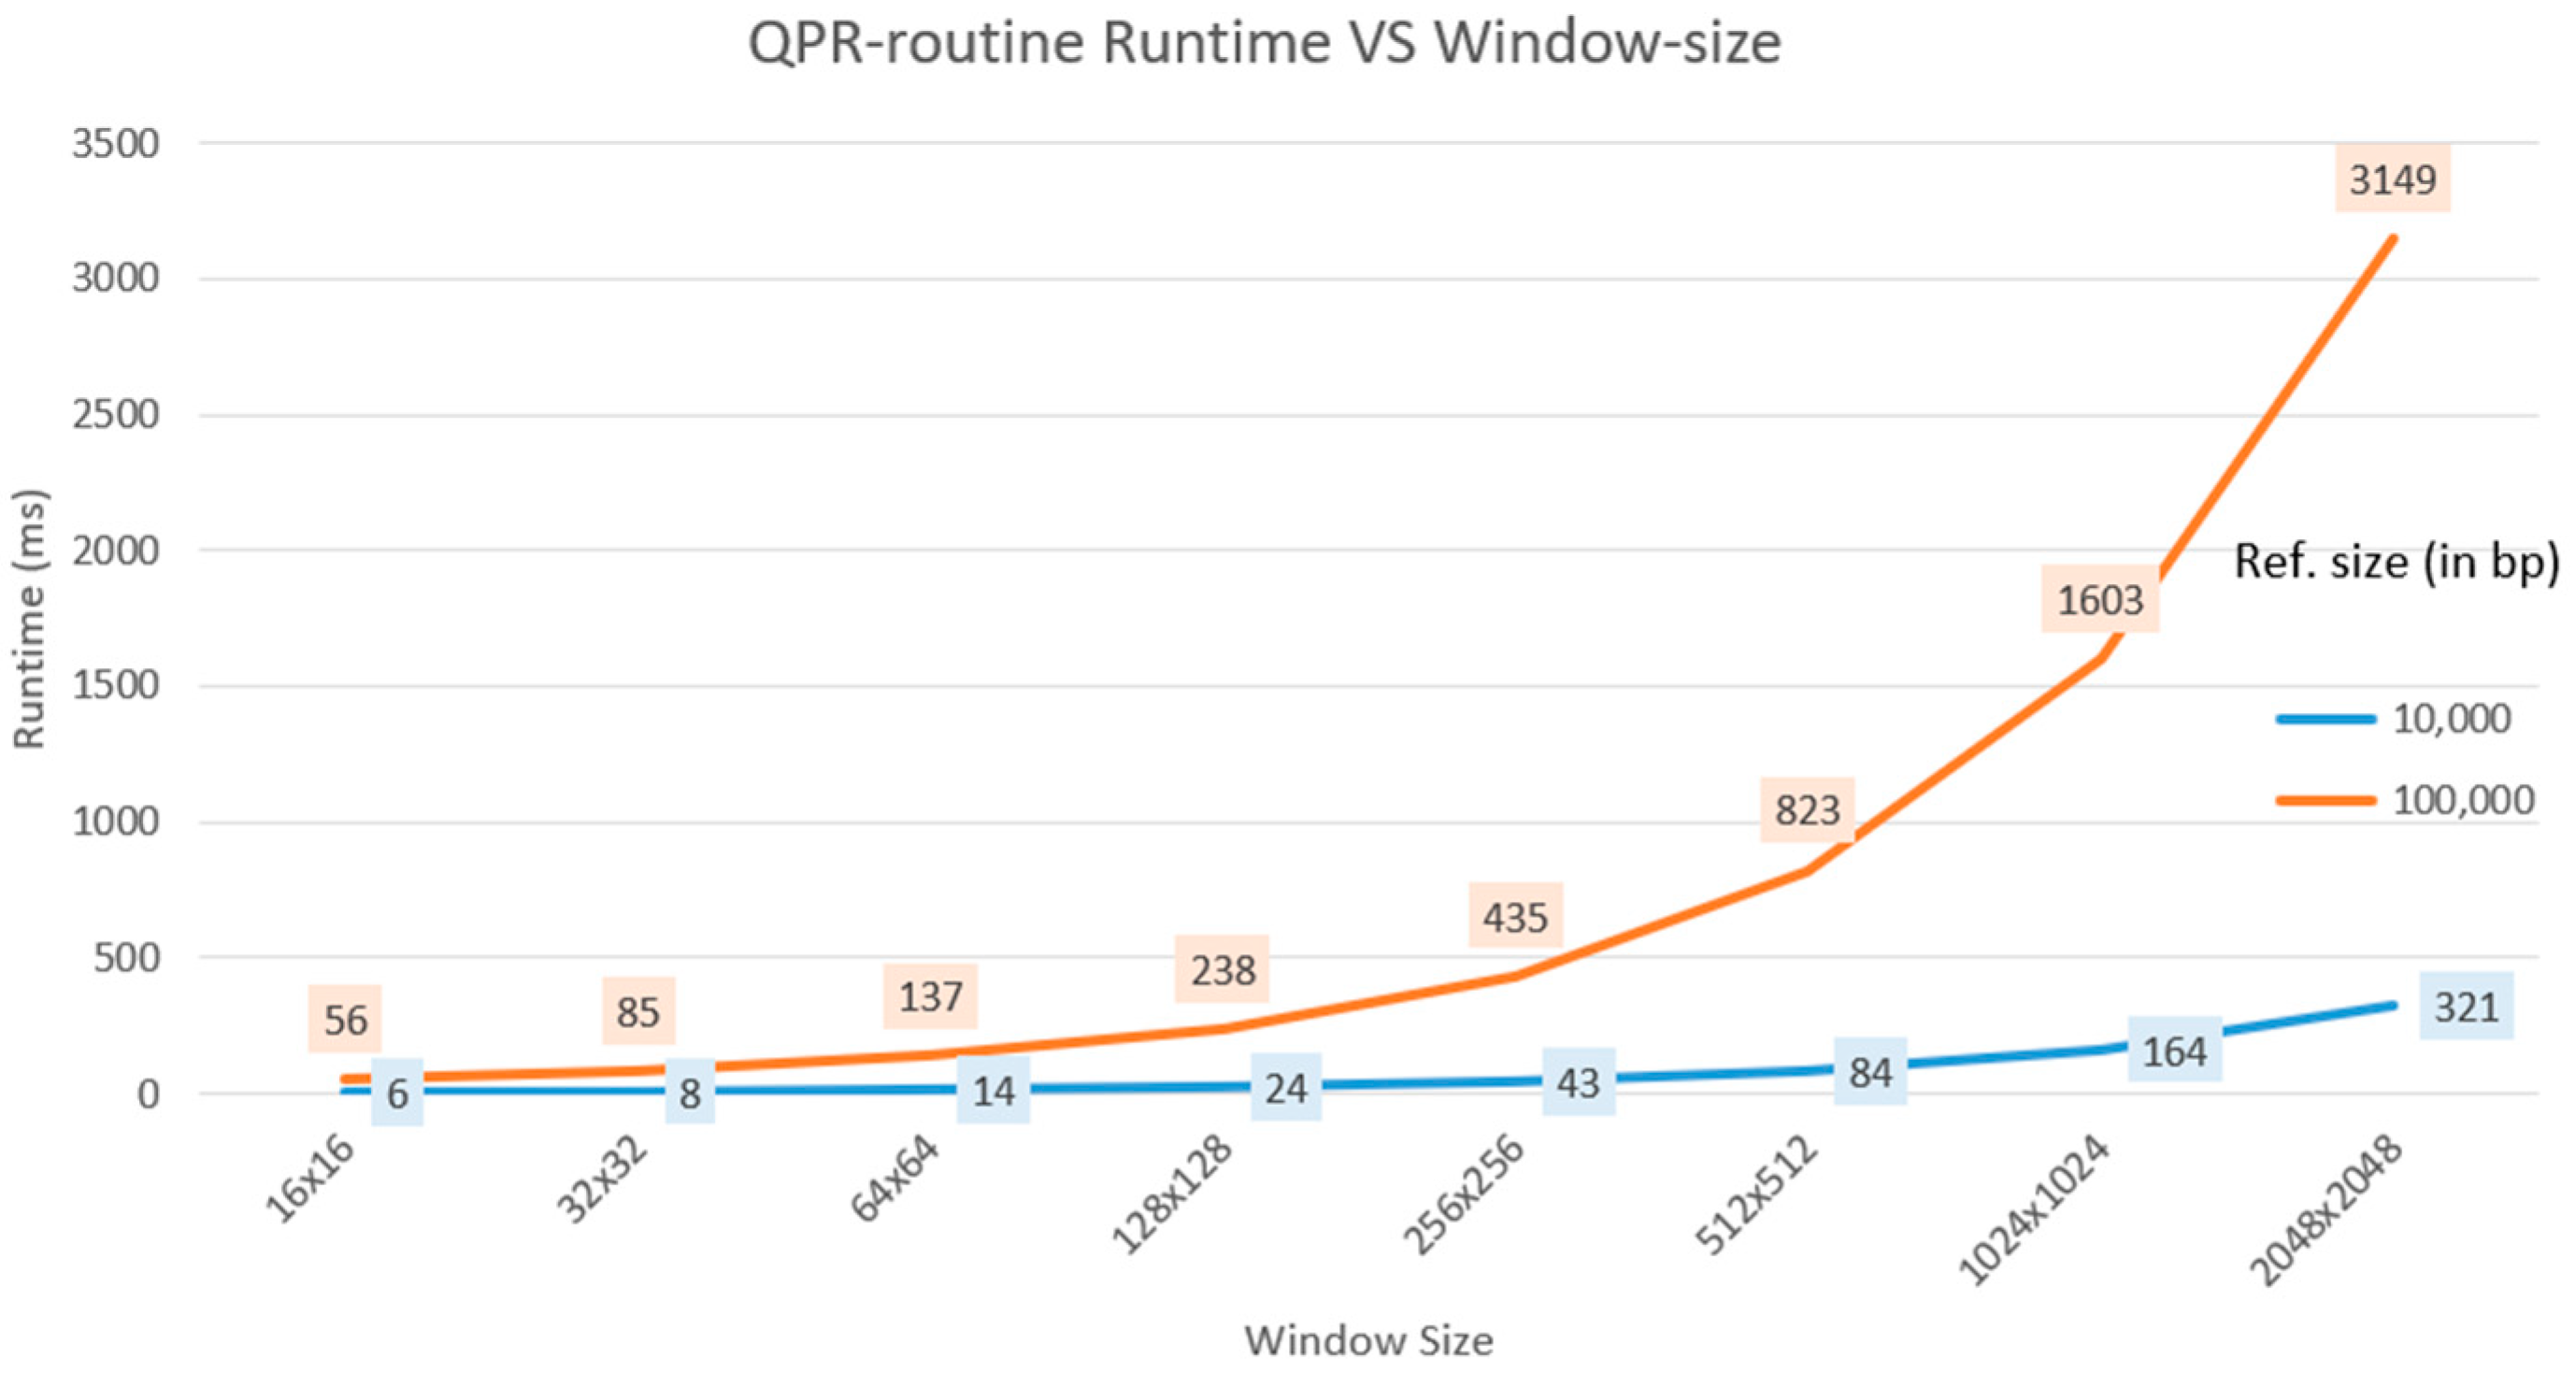
Figure 12 presents an estimation of execution time growth as a function of increasing window size. Virtual gate execution times, defined on a nanosecond scale and motivated by realistic experimental quantum computing platforms, are assumed for each gate type. Additionally, the simulation considers two reference sequence lengths, whose differences may affect the encoding process and overall computational cost.
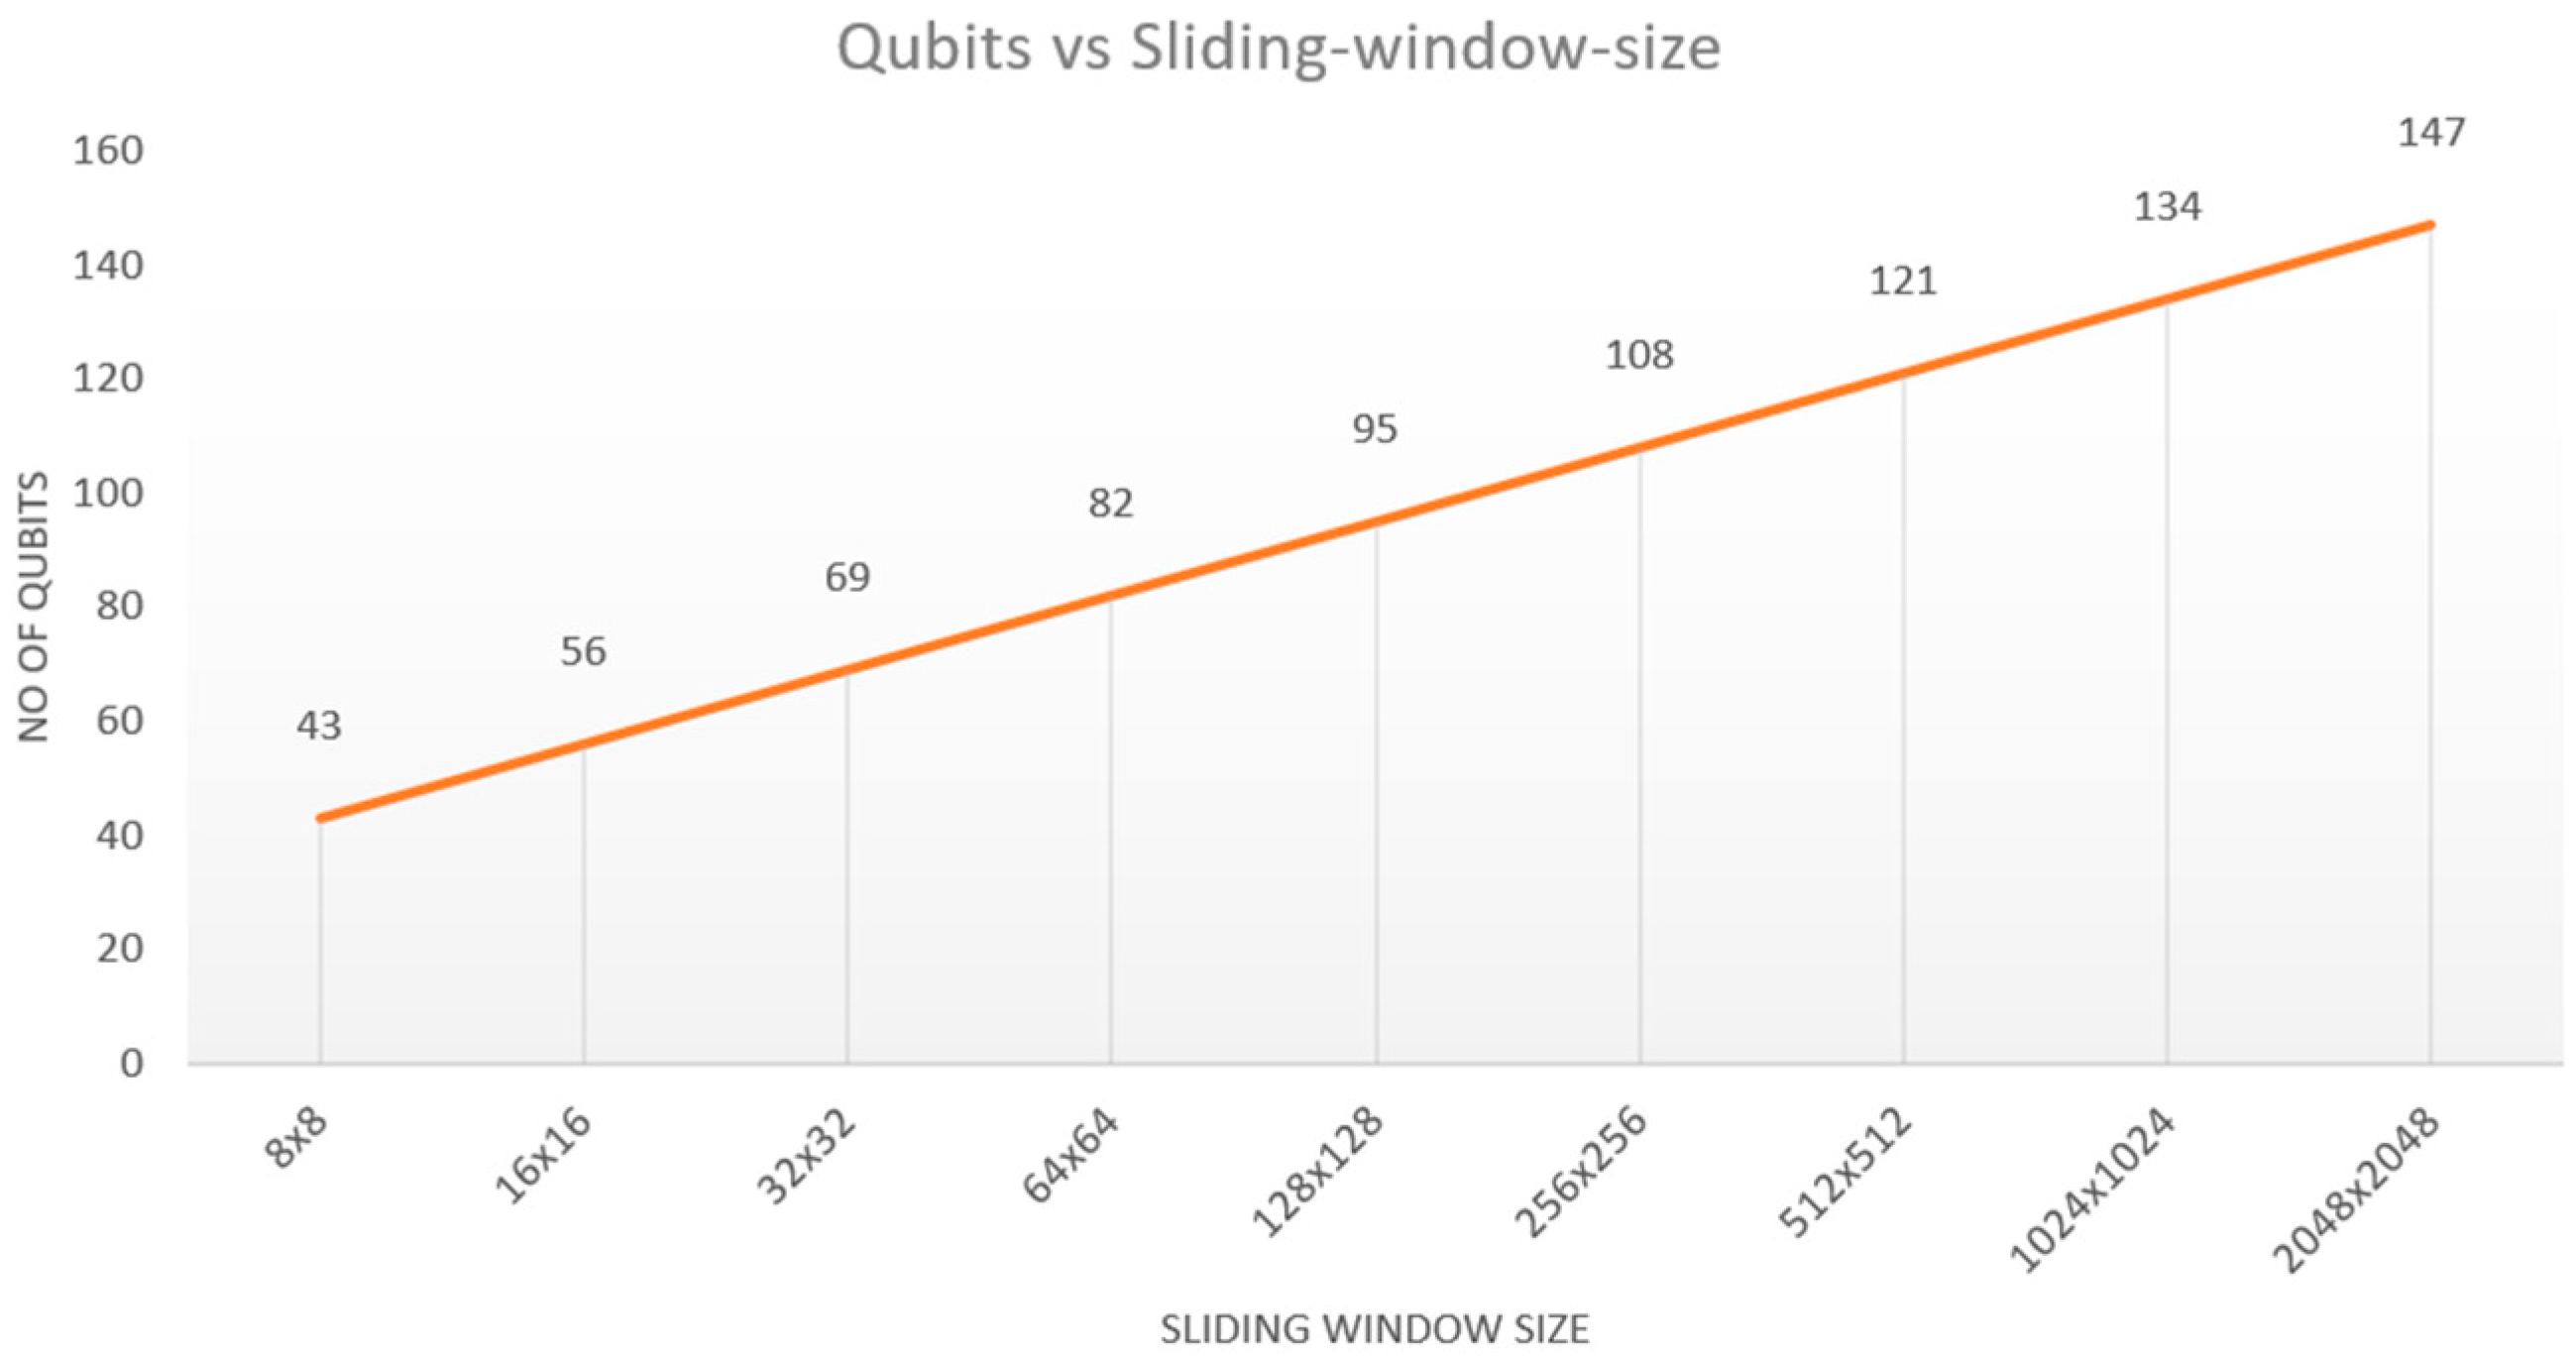
The cost of memory in logical qubits is also evaluated as a function of the sliding window size in Figure 13. The ancilla qubits for the multi-controlled-Not gates are also included in calculations.
For the calculations on the plots in Figure 11, Figure 12 and Figure 13, more information can be found in the Supplementary Materials.

5.2.2. Trade-Offs Between QMap Repetition Rate and Window Size

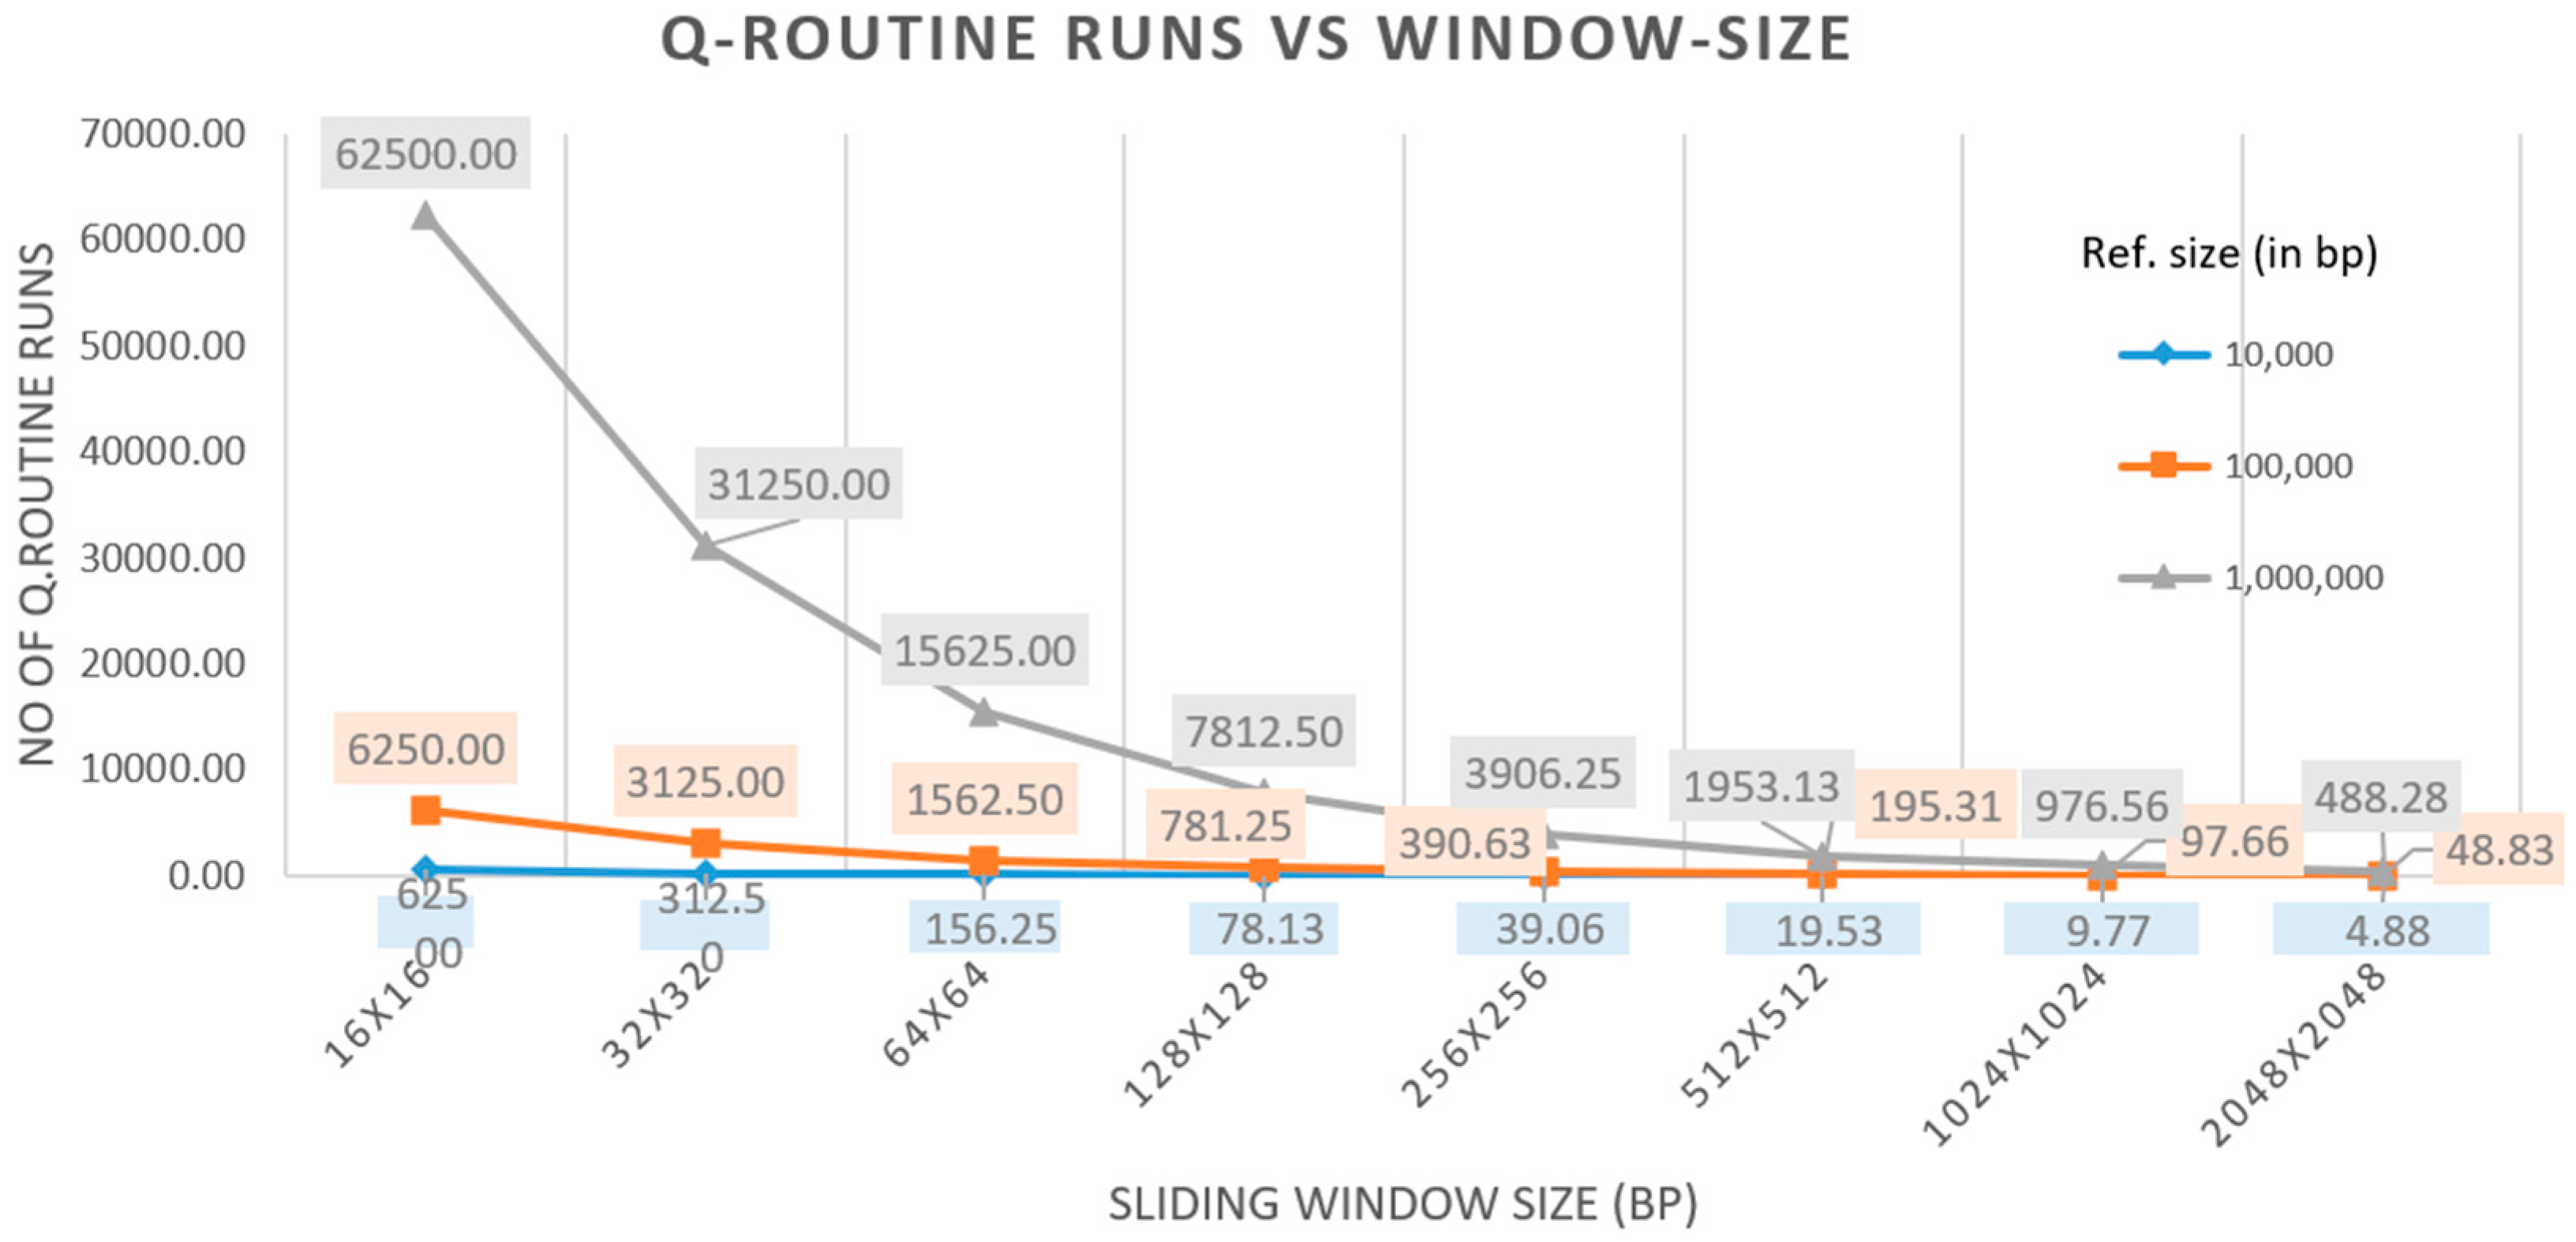
Given a short query and a large reference sequence, the actual dot-plot can be realized as a horizontally long rectangle. Large sliding windows can suppress the scanning time of the circuit, making just a few applications of the circuit. The relationship between the sliding window size and the execution times of the QMap circuit is depicted in Figure 14. Obviously, it is not affordable to adopt a small sliding window as the runtime of the QMap is increased exponentially, and the overhead of the generation of the dot-plot (Subcircuit A) is repeated for no reason. On the other side, large windows increase the diagonals to be tested (Subcircuit B), but it is more beneficial to save the repetition of Subcircuit A. The optimal choice of the window size depends on three parameters: the type of data under alignment, the size of the read sequence, and the similarity threshold percentage. Run tests have shown that large windows have a better performance, especially when performed with long reads.

6. Discussion and Conclusions

To summarize, the analysis of the proposed quantum seed-and-extend (S&E) system suggests that the implementation of the QMap accelerator and its integration within a classical S&E framework is a plausible direction for future development. The current circuit model relies on basis encoding; however, the encoding stage remains an open challenge that may benefit from further optimization. Alternative approaches, such as amplitude encoding or emerging AI-assisted techniques, represent promising avenues for future investigation. Although current quantum technologies remain in relatively early stages of development, the proposed framework indicates potential advantages in terms of memory utilization and gate requirements. Possible improvements in execution speed may also emerge, but will requires further validation using more advanced quantum hardware and experimental platforms. Furthermore, preliminary evaluations on small-scale datasets suggest that mapping performance can achieve high levels of completeness and accuracy, yielding results comparable to established classical and Multiple Sequence Alignment (MSA)-based approaches.
The proposed Hamming distance-based diagonal evaluation framework demonstrates strong robustness in alignment scenarios where geometric coherence is preserved within the similarity matrix, particularly for exact matches, moderate substitution regimes, and orientation-consistent local similarities. Although segment permutations, repetitive low-complexity regions, and mixed noisy orientation variants constitute more challenging cases due to diagonal fragmentation and geometric ambiguity, these limitations are not fundamental barriers to the approach. Several mitigation strategies can substantially improve performance in such scenarios. For example, adaptive multi-scale windowing and local diagonal clustering can help reconnect fragmented seed structures arising from permutations and large indels. Similarly, entropy-aware filtering and repeat masking techniques can reduce false positive diagonal proliferation in low-complexity regions. Orientation-related ambiguities may be alleviated through bidirectional or anti-diagonal scanning, reverse-complement-aware matching oracles, and probabilistic diagonal scoring mechanisms. Furthermore, the integration of dynamic programming refinement after seed localization provides an additional recovery layer capable of reconstructing biologically meaningful alignments even when the initial geometric structures are partially degraded. These observations suggest that the proposed framework is highly extensible, with several viable pathways for improving robustness against structurally complex alignment patterns while preserving the computational advantages of geometric seed evaluation.
When the logically designed circuits are transpiled onto real quantum hardware platforms, the resulting physical implementation may differ substantially from the original design. Transpilers must remap logical qubits onto physical qubits, decompose logical gates into native operations, and introduce additional routing procedures such as SWAP networks to satisfy connectivity requirements. These transformations often increase circuit depth, gate count, and accumulated noise, potentially altering both the practical complexity and the observable performance of the logically estimated computing cost.
Contemporary sequence aligners frequently employ heuristic strategies to improve computational efficiency, often trading exhaustive exploration for practical execution time. Consequently, processing speed can directly affect the depth and granularity of the search procedure, particularly in hierarchical or multi-stage alignment frameworks. This dependency becomes increasingly important in large-scale database applications, where early filtering and candidate selection stages substantially influence overall performance. Similar heuristic considerations could be investigated, too, for our proposed hybrid system. The combination of the dot-matrix technique and our computer vision approach constitutes a multiparametric system allowing many degrees of optimization according to the nature of the problem.

Supplementary Materials

The following supporting information can be downloaded at: https://www.mdpi.com/article/10.3390/quantum8020051/s1. Table S1: Two examples for local and global alignment between a query and a reference sequence; Table S2: Gate count for the transpiled encoding circuit in the iBM Guadalupe backend; Table S3: Results of transpilation for the IBM Sherbrooke backend; Table S4: Results of transpilation for the IBM Sherbrooke backend; Figure S1: Dataflow of the Seed-and-Extend strategy for the alignment of a read onto a reference genome; Figure S2: Possible formations of patterns using dot-matrix method between query and reference sequences of equal length. (a) perfect match, (b) repeats, (c) palindrom, (d) partial palindrom, (e) microsatellites, (f) minisatellites, (g) homologous, (h) indel; Figure S3: The full QMap circuit algorithm with the two component sub-circuits. The Hamming distance estimator (upper-right framed blue) Subcircuit-B is absolutely based on the output of the dot-plot generator (lower-left framed by a dull shape) Subcircuit-A. The arrow cycles symbolize the repetition of its part of the circuit. The outer green concerns the overall circuit while the inner blue only the upper-right framed; Figure S4: This circuit implementation version makes the calculation of the start-end points when a diagonal line is detected; Figure S5: Example representation of the dot-matrix generator Subcircuit-A. (a) Compact form. (b) Analytical form using the virtual MCMX gate; Figure S6: Example of a dot plot generator for comparing two sequences of size 16; Figure S7: Topology and error map of the Guadalupe backend of IBM Quantum Platform; Figure S8: Example of transpiled encoding circuit; Figure S9: Random dot plots of size 8, 16, 32, 64, 128 and 256. Letter G is weighted at 50% to produce more dense matrices; Figure S10: Subcircuit-B of Hamming distance estimation; Figure S11: Example representation of AND operation between two input matrices. The resultant matrix carries the output results for each corresponding cell; Figure S12: Implementation of example AND circuit for 16x16 dot-matrix plot. It takes as input two dot-plot matrices and outputs the resultant; Figure S13: Sample circuit implementing the counting algorithm produced using Qiskit; Figure S14: Decomposition of the 3-CNOT gate according to the advanced single-ancillae technique; Figure S15: Decomposition of the 5-CNOT gate according to the CCNot chain method; Figure S16: Example dot-plots maps displaying (a) different possible window sizes and (b) the result of a specific fragmentation policy. The fully dotted diagonal points out similarity along these two sequences; Figure S17: Stitching technique for successive windows; Figure S18: Re-composed dot-plot and extracted alignment; Figure S19: Matching Thresholds showcased in the comparison of references to reads. High percentages are showcased; Figure S20: Distribution of matching thresholds; Figure S21: Stability Testing of matching algorithm. Standard deviation presents no noticeable outliers; Figure S22: Execution times of described algorithm per batches of read strings; Figure S23: Above: Heatmap for large reference with selected reads with a matching threshold of 20% and a 64 sliding window. Below: Same matching setup for different reference string; Figure S24: Above: Heatmap for large reference with selected reads with a matching threshold of 20% and a 64 sliding window. Below: Same matching setup for different reference string; Figure S25: Calculation of the critical time length according to the implementation of the quantum circuit.

Author Contributions

Conceptualization, K.P. and N.K.; methodology, K.P. and D.N.; software, K.G.; validation, A.K., K.G. and T.G.S.; formal analysis, T.K.; investigation, C.P.; resources, C.P.; data curation, A.K.; writing—original draft preparation, K.P.; writing—review and editing, K.P., D.N., K.G., A.K., T.G.S., T.K., C.P., L.A. and N.K.; supervision, L.A.; project administration, N.K. All authors have read and agreed to the published version of the manuscript.

Funding

This research was conducted as a collaboration between the Aristotle University of Thessaloniki and Pfizer. Pfizer is the research sponsor. Pfizer Center for Digital Innovation’s purpose is to assist the Global Digital organization in focusing on the delivery of impactful and sustainable technology solutions that are under direct control and consistent with the strategies of Pfizer Inc.

Data Availability Statement

The original contributions presented in this study are included in the article/Supplementary Materials. Further inquiries can be directed to the corresponding author.

Acknowledgments

The authors would like to acknowledge Daniel Katzel, Maria Antonara, and Vassilios Pantazopoulos for their ongoing support in the research.

Conflicts of Interest

This research was conducted as a collaboration between the Aristotle University of Thessaloniki and Pfizer. Pfizer is the research sponsor. T.K., T.G.S. and C.P. are full-time employees of Pfizer. All other authors report no competing interests. The paper reflects the views of the scientists and not the company.

References

  1. Smith, T.F.; Waterman, M.S. Identification of common molecular subsequences. J. Mol. Biol. 1981, 147, 195–197. [Google Scholar] [CrossRef] [Scilit] [PubMed]
  2. Rognes, T. Faster Smith-Waterman database searches with inter-sequence SIMD parallelisation. BMC Bioinform. 2011, 12, 221. [Google Scholar] [CrossRef] [Scilit] [PubMed]
  3. Needleman, S.B.; Wunsch, C.D. A general method applicable to the search for similarities in the amino acid sequence of two proteins. J. Mol. Biol. 1970, 48, 443–453. [Google Scholar] [CrossRef] [Scilit]
  4. Lipman, D.J.; Pearson, W.R. Rapid and sensitive protein similarity searches. Science 1985, 227, 1435–1441. [Google Scholar] [CrossRef] [Scilit]
  5. Altschul, S.F.; Gish, W.; Miller, W.; Myers, E.W.; Lipman, D.J. Basic local alignment search tool. J. Mol. Biol. 1990, 215, 403–410. [Google Scholar] [CrossRef]
  6. Li, H.; Durbin, R. Fast and accurate short read alignment with Burrows–Wheeler transform. Bioinformatics 2009, 25, 1754–1760. [Google Scholar] [CrossRef] [Scilit]
  7. Kim, D.; Langmead, B.; Salzberg, S.L. HISAT: A fast spliced aligner with low memory requirements. Nat. Methods 2015, 12, 357–360. [Google Scholar] [CrossRef] [Scilit] [PubMed]
  8. Marçais, G.; Delcher, A.L.; Phillippy, A.M.; Coston, R.; Salzberg, S.L.; Zimin, A. MUMmer4: A fast and versatile genome alignment system. PLoS Comput. Biol. 2018, 14, e1005944. [Google Scholar] [CrossRef] [Scilit]
  9. Maleki, E.; Babashah, H.; Koohi, S.; Kavehvash, Z. High-speed all-optical DNA local sequence alignment based on a three-dimensional artificial neural network. J. Opt. Soc. Am. A 2017, 34, 1173–1186. [Google Scholar] [CrossRef] [Scilit]
  10. Maleki, E.; Koohi, S.; Kavehvash, Z.; Mashaghi, A. OptCAM: An ultra-fast all-optical architecture for DNA variantdiscovery. J. Biophotonics 2019, 13, e201900227. [Google Scholar] [CrossRef] [Scilit]
  11. Prousalis, K.; Konofaos, N. Improving the Sequence Alignment Method by Quantum Multi-Pattern Recognition. In Proceedings of the 10th Hellenic Conference on Artificial Intelligence (SETN’18); ACM: Patra, Greece, 2018. [Google Scholar]
  12. Prousalis, K.; Konofaos, N. A Quantum Pattern Recognition Method for Improving Pairwise Sequence Alignment. Sci. Rep. 2019, 9, 7226. [Google Scholar] [CrossRef] [Scilit]
  13. Schützhold, R. Pattern recognition on a quantum computer. Phys. Rev. A. 2002, 67, 062311. [Google Scholar] [CrossRef] [Scilit]
  14. Cross, A.W.; Bishop, L.S.; Smolin, J.A.; Gambetta, J.M. Open quantum assembly language. arXiv 2017, arXiv:1707.03429. [Google Scholar] [CrossRef] [Scilit]
  15. Qiskit Contributors: Qiskit: An Open-Source Framework for Quantum Computing (2023). Available online: https://oamonitor.ireland.openaire.eu/national/search/software?pid=10.5281%2Fzenodo.2562110 (accessed on 1 January 2024).
  16. Clapis, J. A Quantum Dot Plot Generation Algorithm for Pairwise Sequence Alignment. arXiv 2021, arXiv:2107.11346v1. [Google Scholar] [CrossRef] [Scilit]
  17. Zhang, Y.; Lu, K.; Gao, Y.; Wang, M. NEQR: A novel enhanced quantum representation of digital images. Quantum Inf. Process. 2013, 12, 2833–2860. [Google Scholar] [CrossRef] [Scilit]
  18. Le, P.Q.; Dong, F.; Hirota, K. A flexible representation of quantum images for polynomial preparation, image compression, and processing operations. Quantum Inf. Process. 2011, 10, 63–84. [Google Scholar] [CrossRef] [Scilit]
  19. Yao, X.-W.; Wang, H.; Liao, Z.; Chen, M.-C.; Pan, J.; Li, J.; Zhang, K.; Lin, X.; Wang, Z.; Luo, Z.; et al. Quantum Image Processing and Its Application to Edge Detection: Theory and Experiment. Phys. Rev. X 2017, 7, 031041. [Google Scholar] [CrossRef] [Scilit]
  20. Havlíček, V.; Córcoles, A.D.; Temme, K.; Harrow, A.W.; Kandala, A.; Chow, J.M.; Gambetta, J.M. Supervised learning with quantum-enhanced feature spaces. Nature 2019, 567, 209–212. [Google Scholar] [CrossRef] [Scilit] [PubMed]
  21. Kremenetski, V.; Apte, A.; Hogg, T.; Hadfield, S.; Tubman, N.M. Quantum Alternating Operator Ansatz (QAOA) beyond low depth with gradually changing unitaries. arXiv 2023, arXiv:2305.04455. [Google Scholar] [CrossRef] [Scilit]
  22. Xie, Z.; Qiu, D.; Cai, G. Quantum algorithms on Walsh transform and Hamming distance for Boolean functions. Quantum Inf. Process. 2018, 17, 139. [Google Scholar] [CrossRef] [Scilit]
  23. Kathuria, K.; Ratan, A.; McConnell, M.; Bekiranov, S. Implementation of a Hamming distance–like genomic quantum classifier using inner products on ibmqx2 and ibmq_16_melbourne. Quantum Mach. Intell. 2020, 2, 7. [Google Scholar] [CrossRef] [Scilit]
  24. Li, J.; Lin, S.; Yu, K.; Guo, G. Quantum K-nearest neighbor classification algorithm based on Hamming distance. Quantum Inf. Process. 2022, 21, 18. [Google Scholar] [CrossRef] [Scilit]
  25. Anderson, T.W.; Darling, D.A. Asymptotic theory of certain “goodness of fit” criteria based on stochastic processes. Ann. Math. Statist. 1952, 23, 193–212. [Google Scholar] [CrossRef] [Scilit]
  26. Rudell, R.; Sangiovanni-Vincentelli, A. Multiple-valued minimization for PLA optimization. IEEE Trans. Comput.-Aided Des. Integr. Circuits Syst. 2004, 6, 727–750. [Google Scholar] [CrossRef] [Scilit]
  27. Brassard, G.; Høyer, P.; Tapp, A. Quantum counting. In International Colloquium on Automata, Languages, and Programming; Springer: Berlin/Heidelberg, Germany, 1998. [Google Scholar]
  28. Aaronson, S.; Rall, P. Quantum approximate counting, simplified. In Symposium on Simplicity in Algorithms; Society for Industrial and Applied Mathematics: Philadelphia, PA, USA, 2020. [Google Scholar]
  29. Barenco, A.; Bennett, C.H.; Cleve, R.; DiVincenzo, D.P.; Margolus, N.; Shor, P.; Sleator, T.; Smolin, J.A.; Weinfurter, H. Elementary gates for quantum computation. Phys. Rev. A 1995, 52, 3457–3467. [Google Scholar] [CrossRef] [Scilit]
  30. Nielsen, M.A.; Chuang, I.L. Quantum Computation and Quantum Information, 10th ed.; Cambridge University: Cambridge, UK, 2011. [Google Scholar]
Figure 1. Hybrid system architecture for the proposed pairwise sequence alignment protocol. QMap represents the quantum part, which is a sequence mapping algorithm.
Quantumrep 08 00051 g001
Figure 2. Pipeline flow chart of the proposed sequence alignment hybrid system. The quantum part is implemented in the QMap step.
Quantumrep 08 00051 g002
Figure 3. Explanations on how logic AND operation isolates a single diagonal in a QDP. The shadow area indicates the diagonal being processed for this example.
Quantumrep 08 00051 g003
Figure 4. Circuit model of the proposed quantum accelerator for the mapping stage. It comprises two subcircuits: the dot-matrix generator and the scanning Hamming distance. The scanning is applied from diagonal d[−i] to d[i], where i is the index of the diagonal in a single sliding window.
Quantumrep 08 00051 g004
Figure 5. Subcircuit A: Circuit model of the quantum dot-matrix generator.
Quantumrep 08 00051 g005
Figure 6. Subcircuit B: Circuit model of the quantum Hamming distance estimator at d[i] diagonal line upon the dot-matrix.
Quantumrep 08 00051 g006
Figure 7. Illustrative example demonstrating both scanning policies A and B upon a dot-plot window. The arrows depict the scanning direction according to the selected policy.
Quantumrep 08 00051 g007
Figure 8. Approximate estimation of alignment accuracy vs. mutation rate based on Hamming Sweep dataset category.
Quantumrep 08 00051 g008
Figure 9. An approximate comparative correspondence between typical steps of a baseline classical S&E pipeline and our hybrid counterpart. The quantum part is marked with a slightly reddish color. A common staging is imposed on both pipeline flows to facilitate our comparative study.
Quantumrep 08 00051 g009
Figure 10. Normalized NEQR + Espresso gate complexity as a function of sequence length for DNA ( σ = 4 ) and protein ( σ = 20 ) alphabets.
Quantumrep 08 00051 g010
Figure 11. Gate count escalation for Subcircuit_A with alphabet | Σ | = 4 .
Quantumrep 08 00051 g011
Figure 12. Approximate estimation of execution time growth as a function of increasing window size. Runtime estimations include all the repetitions required to cover two example input sizes.
Quantumrep 08 00051 g012
Figure 13. Memory cost in logical qubits as a function of the sliding window size.
Quantumrep 08 00051 g013
Figure 14. Quantum routine (QMap) required runs per 2 size.
Quantumrep 08 00051 g014
Table 1. Common embedding techniques. L q is the length of the query sequence and L r is the length of the reference. Symbol d is the color depth.
Embedding Schemes
BasisAngleAmplitude *Inst. Q. Polynomial *
Qubit resource d + 2 L r 1 + 2 L r 2 L r 2 L r
Pixel-value qubit d 100
Pixel-value encodingBasis of qubitsAngle of qubitsProbability amplitudeFeature mapping
Complexity O ( 2 L q 2 L r ) O ( log 2 L q L r ) O ( log 2 L q L r ) O ( 2 L q 2 L r )
* supports non-squared dot-plots.
Table 2. Mean accuracy for exact and near-exact dataset categories.
Category#PairsMean AccuracyStd DevMin
Exact101.0000.0001.000
1 substitution100.9980.0020.995
2 substitutions100.9960.0030.990
Small indels100.9850.0100.965
Table 3. Aggregate alignment accuracy and completeness across indel perturbation scenarios in the hybrid S&E framework.
SubcategoryAccuracy (Mean)Std (Approx)Completeness
Long indel0.60±0.070.70–0.80
Short indels0.77±0.050.85–0.92
Shifted0.71±0.060.80–0.88
Table 4. Approximate evaluation results for low-complexity and repetitive sequence datasets, reporting seed detection metrics (recall and precision), alignment accuracy, and completeness for homopolymer, tandem-repeat, and protein low-complexity cases under the proposed hybrid seed-and-extend framework.
SubcategorySeed RecallSeed PrecisionAccuracyCompleteness
Homopolymers~0.98–1.00~0.10–0.25~0.75–0.88~0.90–1.00
Tandem repeats~0.95–0.98~0.20–0.40~0.80–0.92~0.92–0.98
Protein low-complexity~0.90–0.95~0.30–0.50~0.85–0.93~0.90–0.96
Table 5. Approximate performance estimates of the proposed hybrid S&E aligner on the orientation-variant benchmark subset. Different dataset categories include pairs designed to evaluate robustness against geometric transformations of the similarity matrix. Reported values correspond to estimated ranges of alignment accuracy, reconstruction completeness, and seed recall for small controlled datasets with sequence lengths between 32 and 128 residues/bases.
CategoryAccuracyCompletenessSeed Recall
Forward identical99–100%99–100%99–100%
Reverse92–97%90–96%88–95%
Reverse complement90–96%88–95%85–93%
Segment permutation75–88%65–80%70–85%
Mixed noisy variants78–90%72–86%70–82%
Table 6. Estimated performance of the proposed hybrid S&E aligner on the local similarity embedding benchmark category for varying conserved-region identity levels. Reported ranges represent approximate expected behavior on a compact dataset of approximately 40 sequence pairs containing embedded homologous subsequences of length 20–50 residues within random background regions. Metrics evaluate seed recovery efficiency, final alignment correctness, and reconstruction completeness under progressively increasing mutation rates.
Local IdentitySeed RecallAlignment AccuracyCompleteness
95%0.99–1.000.98–0.990.98–1.00
90%0.97–0.990.95–0.980.95–0.99
80%0.90–0.960.88–0.950.87–0.94
70%0.75–0.880.72–0.860.70–0.84
60%0.45–0.700.40–0.680.38–0.65
Table 7. Estimated performance of the proposed hybrid quantum–classical seed-and-extend aligner under protein substitution models with varying evolutionary divergence levels. (a) Overall alignment performance, including seed recall, extension success rate, and final alignment accuracy across low-, medium-, and high-divergence regimes. (b) Estimated reconstruction completeness, measured as the fraction of recovered homologous residues relative to the ground-truth homologous regions. Results illustrate the progressive degradation of seed coherence and alignment reconstruction as substitution severity increases.
Divergence LevelSeed RecallExtension SuccessFinal Alignment AccuracyCompleteness
Low divergence0.98–1.000.9997–99%98–100%
Medium divergence0.88–0.950.9490–95%90–96%
High divergence0.65–0.820.8575–88%78–90%
Table 8. Summary of time and space complexity requirements of all included algorithmic techniques for both S&E classical and hybrid pipelines. Complexities are expressed with respect to the input size n = log 2 w of the sliding window, alphabet size | σ | , k the lookup factor of suffix array, and L the sequence input length.
Complexities
Data PreparationSearching (Query)Example Aligner
ComponentTimeSpaceTimeSpace
ClassicalBWT (build) O L r O ( L r log 2 | σ | ) O ( L q ) O ( 1 ) O ( L r ) BWA, Bowtie 2
FM-index
(locate)
O L r O ( n + n / k ) O ( m + k ) n/a
QuantumNEQRESP ( L l o g 2 σ ) α l o g ( L l o g 2 σ ) (0.3 ≤ α ≤ 0.8) 2 log 2 | w | n/an/an/a
Logic XOR O ( 2 log 2 | σ | ) log 2 | σ | n/an/a
Logic AND ( L l o g 2 σ ) α l o g ( L l o g 2 σ ) log 2 | σ | n/an/a
Counting
(improved)
n/an/a O w M log w ε O ( log 2 w )
Disclaimer/Publisher’s Note: The statements, opinions and data contained in all publications are solely those of the individual author(s) and contributor(s) and not of MDPI and/or the editor(s). MDPI and/or the editor(s) disclaim responsibility for any injury to people or property resulting from any ideas, methods, instructions or products referred to in the content.