1. Introduction
Autonomous driving systems have undergone rapid development, with trajectory tracking control serving as a core module that executes reference paths generated by the planning layer and generates corresponding steering and speed commands to ensure precise vehicle navigation along the intended route. Unlike trajectory tracking, which requires reaching specific positions at specific times, path tracking only demands that the vehicle converges to a geometric path while maintaining a target speed profile. This spatiotemporal decoupling makes path tracking highly dependent on structured environments, and the control logic for safety and comfort exhibits significant differences from human driving systems.
A common observation in real-world autonomous driving experiences is that even when high tracking accuracy is achieved, passengers frequently perceive the vehicle’s behavior as “stiff,” “rigid,” or “unnatural.” For instance, vehicles often exhibit frequent minor steering corrections during straight-line driving, and deceleration maneuvers manifest as a distinct three-stage braking pattern—“hard braking–soft braking–full stop”—rather than the smooth, continuous deceleration characteristic of human drivers. Recent studies have also noted that passengers in autonomous vehicles report lower ride comfort compared to human-driven vehicles, even when objective safety metrics are comparable [
1]. To systematically describe the behavioral characteristics exhibited by algorithm-driven systems during trajectory tracking tasks, this paper adopts the term “mechanicalness” to characterize these behaviors. In the context of autonomous trajectory tracking, mechanicalness manifests as a lack of smoothness in control actions, excessive rigid adherence to geometric path configurations, and an inability to flexibly adjust strategies in response to changing scenarios.
Despite considerable research efforts in trajectory tracking control algorithms, Autoware platform performance evaluation, and human driver behavior modeling, these three lines of inquiry remain fragmented. A notable gap exists in direct comparative studies between algorithmic control behavior and human driving behavior under identical real-vehicle conditions, particularly lacking quantitative frameworks to describe and evaluate the mechanicalness characteristics of autonomous systems [
2].
This study is guided by two specific research questions. First, what are the quantitative differences in trajectory tracking behavior between an Autoware-based autonomous driving system and human drivers under identical real-vehicle conditions? Second, what are the technical origins of the observed behavioral differences, and what implications do they have for human-like control design? The central hypothesis is that Autoware exhibits systematically higher tracking precision but lower control naturalness compared to human drivers, and that this trade-off is rooted in fundamental algorithmic design choices. Specifically, we hypothesize that Autoware will demonstrate higher lateral tracking accuracy (lower mean error and variance) than human drivers, but at the cost of higher steering correction frequency and jerk; that human drivers will exhibit anticipatory control behaviors (e.g., pre-steering at curve entry, speed modulation) that are absent in Autoware’s reactive, error-driven control; and that the observed behavioral differences can be attributed to four algorithmic paradigms: geometric tracking, decoupled control, error-driven logic, and limited prediction horizon.
To test these hypotheses, this study takes the open-source Autoware platform as its research vehicle, collects human driving and Autoware automatic tracking trajectories under unified real-vehicle test conditions, conducts comparative analysis from multiple dimensions, constructs a five-dimensional evaluation framework to systematically characterize and quantify mechanicalness, and reveals the behavioral manifestations and technical roots of this phenomenon. A comprehensive literature review is presented in
Section 2.
Section 3 details the experimental platform, the five-dimensional evaluation framework, and the data collection methodology, with explicit justification of the comparative design.
Section 4 presents the comparative analysis results with statistical testing.
Section 5 discusses the technical origins of mechanicalness and the associated safety–comfort trade-offs, directly addressing the research questions stated above.
Section 6 concludes the study and outlines future research directions.
2. Literature Review
This section reviews the relevant literature from three interconnected research areas: trajectory tracking control algorithms for autonomous vehicles, performance evaluation of the Autoware platform, and human driver behavior modeling. The review identifies the strengths and limitations of existing studies and culminates in a clear statement of the research gap that this paper addresses.
2.1. Trajectory Tracking Control for Autonomous Vehicles
Path tracking control has a long history in autonomous driving research. Coulter proposed the Pure Pursuit algorithm, which selects a forward-looking reference point on the desired path and computes the steering angle using geometric relationships [
3]. This algorithm is simple and effective at low speeds, but it produces steady-state errors during cornering and lacks systematic parameter calibration mechanisms. Studies have shown that the selection of the look-ahead distance directly affects tracking performance and involves an inherent trade-off: an excessively large look-ahead distance causes “cutting corners,” while an overly small distance induces steering oscillations [
4]. This trade-off becomes particularly pronounced under large-curvature or high-speed conditions, where the limitations of forward-looking geometry become apparent.
The Stanley controller, developed by Stanford University for the 2005 DARPA Grand Challenge, considers both lateral and heading errors and theoretically eliminates steady-state errors [
5]. However, its parameter tuning process is complex and it is sensitive to sensor noise. Linear Quadratic Regulator (LQR) methods obtain optimal feedback gains through the Riccati equation [
6], but their applicability is limited to linear models. Model Predictive Control (MPC) can solve finite-horizon optimization problems online and explicitly handle constraints, offering strong robustness [
7]. However, both LQR and MPC have high computational complexity, posing challenges for real-time implementation on embedded platforms. MPC performance also heavily depends on model accuracy; when the actual vehicle deviates from the model, control accuracy degrades significantly.
Despite extensive research on these controllers, most evaluations remain confined to simulation environments. Krajewski et al. pointed out that simulation inevitably simplifies vehicle dynamics, sensor characteristics, and environmental interactions [
8]. Raffo et al. acknowledged that their MPC validation was limited to simulation and called for experimental verification [
7]. The extent to which simulation results generalize to real-world deployment scenarios remains systematically unexamined. A recent systematic review similarly noted the persistent gap between theoretical advancements and real-world applicability, particularly the lack of systematic evaluation frameworks [
9]. Existing studies focus primarily on whether the system can track accurately, while the qualitative characteristics of control behavior—such as smoothness and naturalness—are largely overlooked.
2.2. Autoware Platform: Architecture and Performance Evaluation
Autoware has become the de facto open-source platform for autonomous driving research, with deployments ranging from 1:14 scale test platforms to full-size commercial vehicles [
10]. This subsection first describes the control architecture of Autoware and then reviews empirical performance evaluations.
2.2.1. Control Architecture
The control module of Autoware is implemented by the
trajectory_follower_node, with lateral and longitudinal control designed separately. In the default configuration, lateral control employs the Pure Pursuit algorithm to compute steering angles, while longitudinal control uses a PID controller to regulate speed; the two operate independently without coupling [
11]. This architectural choice stems from the classical vehicle engineering assumption that lateral and longitudinal motions can be approximately decoupled under normal driving conditions. An optional MPC module provides higher tracking accuracy but incurs greater computational cost, requiring a trade-off between prediction precision and real-time performance in practical deployment.
2.2.2. Empirical Performance Evaluations
Ganesan et al. [
2] conducted real-vehicle testing of an Autoware-based autonomous vehicle on a campus test track, reporting a longitudinal RMSE of 0.839 m and a lateral RMSE of 0.104 m, demonstrating reasonable tracking accuracy under well-calibrated sensor conditions. In a more recent and comprehensive study, the same research group systematically investigated the sim-to-real gap in Autoware-based motion planning, highlighting that actuator constraints and road conditions introduce systematic deviations between simulated and real-world performance, and emphasizing that this gap remains a core challenge for real-world Autoware deployment [
12]. These studies provide valuable quantitative assessments of Autoware’s tracking accuracy and reliability, but do not analyze the behavioral characteristics of its control actions, nor do they compare Autoware’s driving style with that of human drivers under identical conditions.
Tran et al. conducted a simulation-based safety analysis of autonomous driving systems, identifying critical failure modes in highway and cut-in scenarios [
13]. While this study identified specific algorithmic vulnerabilities, its simulation conditions assumed perfect state information and idealized actuator responses, failing to capture the uncertainties and complex interactions of real-world driving environments.
Ganesan et al. compared simulation and real-world trajectory planning on a campus test track using Autoware, reporting a longitudinal RMSE of 0.839 m and a lateral RMSE of 0.104 m, indicating that Autoware achieves reasonable tracking accuracy under well-calibrated sensor conditions [
2]. In a more recent and comprehensive study, the same research group systematically investigated the sim-to-real gap in Autoware-based motion planning, highlighting that actuator constraints and road conditions introduce systematic deviations between simulated and real-world performance, and emphasizing that this gap remains a core challenge for real-world Autoware deployment [
12].
Ongoing developments within the Autoware community are actively addressing the limitations identified above. The Autoware Foundation Centre of Excellence at RMIT University is developing real-time tire cornering stiffness estimation modules and Safe Information-Theoretic MPC (SIT-LMPC) controllers, aiming to extend Autoware’s applicability to high-speed and extreme driving scenarios such as autonomous racing and off-road navigation [
14]. These efforts indicate that the community is proactively working to overcome the geometric tracking paradigm limitations that this paper identifies.
In summary, while these studies evaluated Autoware from different perspectives, they all focus on quantifiable metrics such as success rate, failure rate, and tracking accuracy. The central concern is whether the system functions correctly, rather than how it operates—specifically, the smoothness, naturalness, and adaptability of its control behavior. A systematic description and quantitative analysis of the mechanicalness characteristics of Autoware trajectory tracking remain absent.
2.3. Human Driver Behavior Modeling and Driving Style Analysis
Human driver behavior modeling provides the theoretical foundation for understanding behavioral differences and improving the human-likeness of autonomous systems. Research has shown that driver control behavior is influenced by multiple factors, including individual characteristics, driving experience, cognitive load, emotional state, and external environment, resulting in significant inter-individual variability and contextual dependence [
1].
To capture the personalized features of driving behavior, researchers have constructed multi-modal driving behavior datasets under naturalistic driving conditions. In terms of driving style clustering, motion parameters such as speed, acceleration, and steering angle, along with their statistical properties, are used to construct feature vectors that effectively distinguish different driving behavior patterns, such as aggressive, moderate, and conservative styles [
15].
Unlike algorithm-driven trajectory tracking systems, human drivers have developed distinctive organic control characteristics through years of driving practice. Studies indicate that human driver control behavior exhibits common features such as nonlinearity, adaptability, and forward-looking anticipation at the statistical level [
1]. Specifically:
Discrete correction strategy: Human drivers do not pursue extreme geometric path accuracy. Instead, they adopt a “discrete correction” approach, making adjustments only when trajectory deviation exceeds a reasonable threshold, with smooth and gradual correction actions.
Elastic path tolerance: During straight-line driving, human drivers tolerate small deviations to maintain driving smoothness.
Anticipatory coordination:When negotiating curves, human drivers adjust steering and braking in advance based on curvature and speed variations, achieving lateral–longitudinal coordination.
Forward-looking anticipation: Research in cognitive psychology has shown that experienced drivers exhibit superior lateral control stability, with visual fixation patterns significantly influencing control performance; skilled drivers adjust their control strategies in advance based on upcoming road geometry [
16].
Recent theoretical advances provide deeper insights into the cognitive mechanisms underlying human driving behavior. Engström et al. proposed an active inference framework to model adaptive driving behavior, demonstrating that human drivers naturally balance goal-directed and information-seeking behaviors by minimizing expected free energy—a computational principle that explains the forward-looking and adaptive nature of human driving [
17]. Siebinga et al. developed a Communication-Enabled Interaction (CEI) model that explains human merging behavior across three levels: control inputs, safety margins, and high-level decisions. Their findings explicitly challenge the notion that human driving can be reduced to rational utility maximization, highlighting instead the roles of implicit communication and risk perception [
18]. Mohammad et al. further demonstrated, through an overtaking decision model based on drift-diffusion dynamics, that human driver responses to oncoming automated vehicles exhibit statistically regular patterns that can be captured by cognitive models [
19]. These findings collectively support the view that human driving is not a simple error-driven feedback loop but an intention-driven, adaptive control process.
Of particular note is the adaptability that human drivers demonstrate in emergencies. Studies have shown that drivers can rapidly assess risks and execute stable control responses when confronted with sudden lateral disturbances, exhibiting a level of adaptability that algorithm-driven systems struggle to replicate. This organic control paradigm—from perception to cognition to action—differs fundamentally from the algorithmic paradigm of Autoware, which relies on geometric tracking, decoupled control, and error-driven logic.
2.4. Research Gap and Contributions
The preceding review reveals a clear fragmentation across three research domains:
Trajectory tracking control research focuses on tracking accuracy, primarily validated through simulation, with limited attention to real-vehicle behavioral characteristics. While recent work has begun to address the sim-to-real gap, objective evaluation frameworks remain scarce.
Autoware performance evaluation centers on system reliability and accuracy metrics, overlooking the naturalness and adaptability of control behavior.
Human driver behavior modeling analyzes how humans drive, but does not systematically compare human behavior with algorithmic control.
These three lines of inquiry operate in isolation. There is a notable absence of studies that directly compare algorithmic control behavior with human driving behavior under identical real-vehicle conditions. Specifically, the following gaps persist:
Lack of a comparative dataset collected from the same vehicle platform under identical test conditions for both autonomous and human driving.
Absence of a multi-dimensional evaluation framework to quantitatively describe the “mechanicalness” of autonomous trajectory tracking.
Limited mechanistic analysis of the technical origins of mechanicalness.
Lack of human-like optimization pathways grounded in human-vehicle comparative results.
To address these gaps, this paper presents the following contributions:
A real-vehicle comparative dataset collected from the same Autoware-equipped platform under unified test conditions.
A five-dimensional evaluation framework—encompassing control continuity, prediction horizon, error response, style adaptability, and interaction friendliness—to systematically characterize and quantify mechanicalness.
A mechanistic analysis identifying the technical roots of mechanicalness in the algorithmic paradigm of geometric tracking, decoupled control, and error-driven logic.
Optimization directions for human-like control strategies, including active dead zones, extended prediction horizons, lateral–longitudinal coupling, and reinforcement learning-based adaptive control.
3. Experimental Design and Methodology
This study is guided by two research questions: (RQ1) what are the quantitative differences in trajectory tracking behavior between an Autoware-based autonomous driving system and human drivers under identical real-vehicle conditions? and (RQ2) what are the technical origins of the observed behavioral differences? The central hypothesis is that Autoware exhibits higher tracking precision but lower control naturalness than human drivers, and that this trade-off is rooted in fundamental algorithmic design choices. To answer these questions, a five-dimensional evaluation framework is established. This section first presents the framework, then describes the experimental design and procedures for measuring these dimensions.
3.1. Five-Dimensional Evaluation Framework
The selection of the five dimensions is grounded in two foundations: (1) the technical characteristics of Autoware’s control architecture, and (2) the distinctive features of human driving behavior identified in the literature review.
From the algorithmic side, the analysis of Autoware’s control architecture reveals three fundamental characteristics. First, as documented in the Autoware control component design [
11], the
trajectory_follower module employs a Pure Pursuit-based lateral controller that generates continuous steering commands at every control cycle, resulting in persistent micro-corrections even when path deviations are minimal. Second, the lateral and longitudinal controllers operate independently without coupling mechanisms, and the default MPC implementation employs a prediction horizon of only 1–3 s. Third, the control logic operates on an error-driven principle: detect deviation, compute error, issue correction. These features translate into three behavioral manifestations: continuous steering corrections (Dimension 1: Control Continuity), limited anticipatory capability (Dimension 2: Prediction Horizon), and zero-tolerance error response (Dimension 3: Error Response Mode).
From the human driver side, the literature reveals contrasting organic characteristics: discrete, dead-zone-based corrections, long-range anticipatory control, and intent-driven regulation. Studies on driving style classification have demonstrated that human drivers flexibly adjust their behavior across scenarios [
15]. Recent work on driving intelligence evaluation has further emphasized that human-likeness should be assessed not only by precision metrics but also by behavioral naturalness and adaptability [
20], highlighting the importance of style adaptability (Dimension 4) and interaction friendliness (Dimension 5).
Thus, the five dimensions directly mirror the fundamental paradigm differences between algorithmic control and human driving: geometric tracking vs. behavioral tracking, decoupled control vs. holistic coordination, and error-driven vs. intent-driven. Each dimension is defined with specific quantitative metrics:
Dimension 1: Control Continuity. Quantified by heading rate variance
(derived from GPS trajectory as a proxy for steering correction frequency) and jerk peak
. Abrupt steering and heading changes correlate with passenger discomfort [
1].
Dimension 2: Prediction Horizon. Measured by effective prediction horizon
and turn entry lead time
. Experienced drivers fixate on upcoming road geometry 3–5 s in advance [
16].
Dimension 3: Error Response Mode. Key metrics include response dead zone
and error–control gain linearity. Humans exhibit a threshold below which no corrective action is taken [
1].
Dimension 4: Style Adaptability. Quantified by lateral acceleration distribution variance
and strategy diversity index. Lateral acceleration variance differentiates conservative and aggressive styles [
15].
Dimension 5: Interaction Friendliness. Measured by behavioral predictability and ride comfort score (ISO 2631-1:1997) [
21].
3.2. Experimental Design for Framework Measurement
The experimental design is structured to capture behavioral differences across the five dimensions. Two core test scenarios were designed: a straight-road scenario (relevant to Control Continuity and Error Response Mode) and a curved-road scenario (relevant to Prediction Horizon, Style Adaptability, and Interaction Friendliness). The test route comprised a straight section (approximately 120 m) followed by a 90° left turn with a radius of approximately 15 m. The target speed was set to 10 km/h for all runs.
The comparison is between two conditions: (a) trajectories generated by Autoware using its default Pure Pursuit + PID configuration (4 valid runs retained after quality screening), and (b) trajectories recorded from human drivers navigating the same route. Human drivers are defined as experienced drivers with normal proficiency (mean experience: 8.2 years, range: 5–12 years); a total of 5 drivers each completed 4 runs, yielding 20 trajectories, with 19 valid runs retained after quality screening. All errors are computed against a reference path derived from the aggregated valid human trajectories. In total, 23 data files (4 Autoware + 19 human) were used for analysis. The rationale for this design is threefold: human driving represents the benchmark for natural performance; using the same vehicle and route eliminates confounds; and multiple drivers with repeated runs mitigates individual variability.
The experiment was carried out using a steer-by-wire modified vehicle equipped with the Autoware open-source autonomous driving software stack. The vehicle features fully functional electronic throttle, electronic braking, and steer-by-wire systems. For positioning and perception, the vehicle is equipped with a differential GPS module (horizontal accuracy
m) combined with an IMU (sampling at 100 Hz), a LIDAR, and a standard CAN bus system. The software environment is built upon Ubuntu with ROS and Autoware. For the Autoware control configuration, the Pure Pursuit lateral controller was configured with a speed-dependent look-ahead distance ranging from 2.0 to 6.0 m. The longitudinal PID controller gains were set to
,
, and
. The optional MPC controller was not used. Hardware specifications are summarized in
Table 1.
3.3. Reproducibility and Data Preprocessing
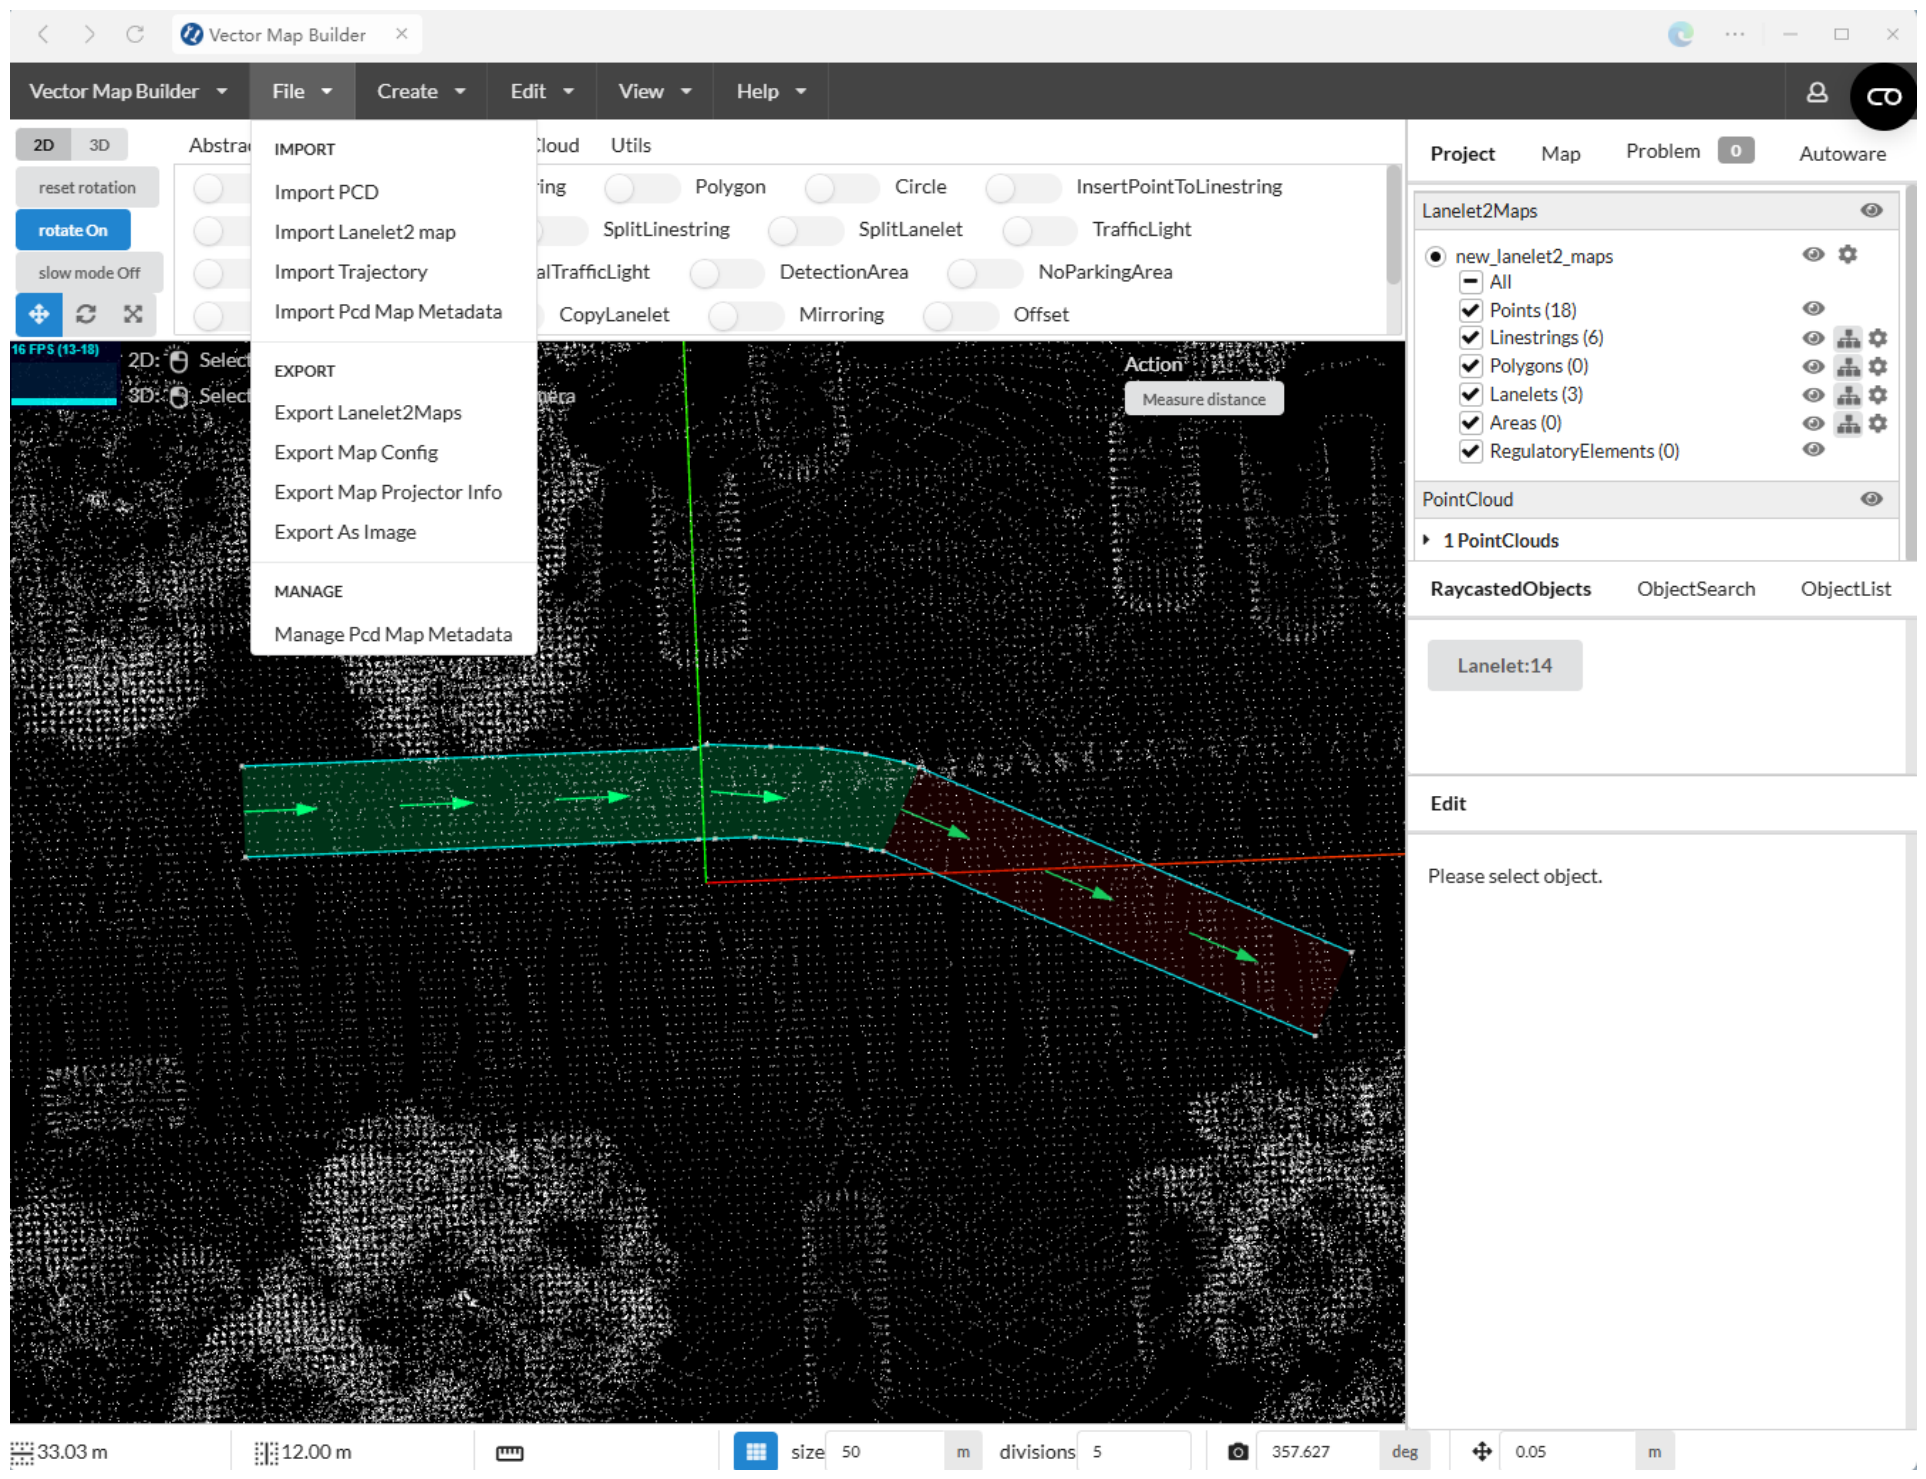
The experimental procedure consisted of four phases: (1) point cloud recording via LIDAR; (2) Lanelet2 map drawing using the TIER IV Vector Map Builder; (3) autonomous driving tests (4 runs); and (4) human driver tests (5 drivers × 4 runs). Data including vehicle position, trajectory, velocity, acceleration, steering angle, control outputs, and tracking errors were synchronously recorded via CAN bus, GPS/IMU, and system logs.
A total of 23 data files were collected (4 Autoware runs + 19 valid human runs). Each run recorded approximately 120–150 sampling points at 1-s intervals. The positional data were analyzed at 1 Hz, which is sufficient to capture the trajectory-level lateral error and heading rate patterns reported in this study. The high-frequency steering commands themselves are not the subject of our quantitative evaluation. Raw data were processed through time alignment, outlier removal (GPS altitude > 200 m excluded), and low-pass filtering (4th-order Butterworth, 5 Hz cutoff). Pairwise t-tests and ANOVA were employed for subsequent comparative analysis.
Figure 1 shows the Rviz visualization interface during autonomous driving, and
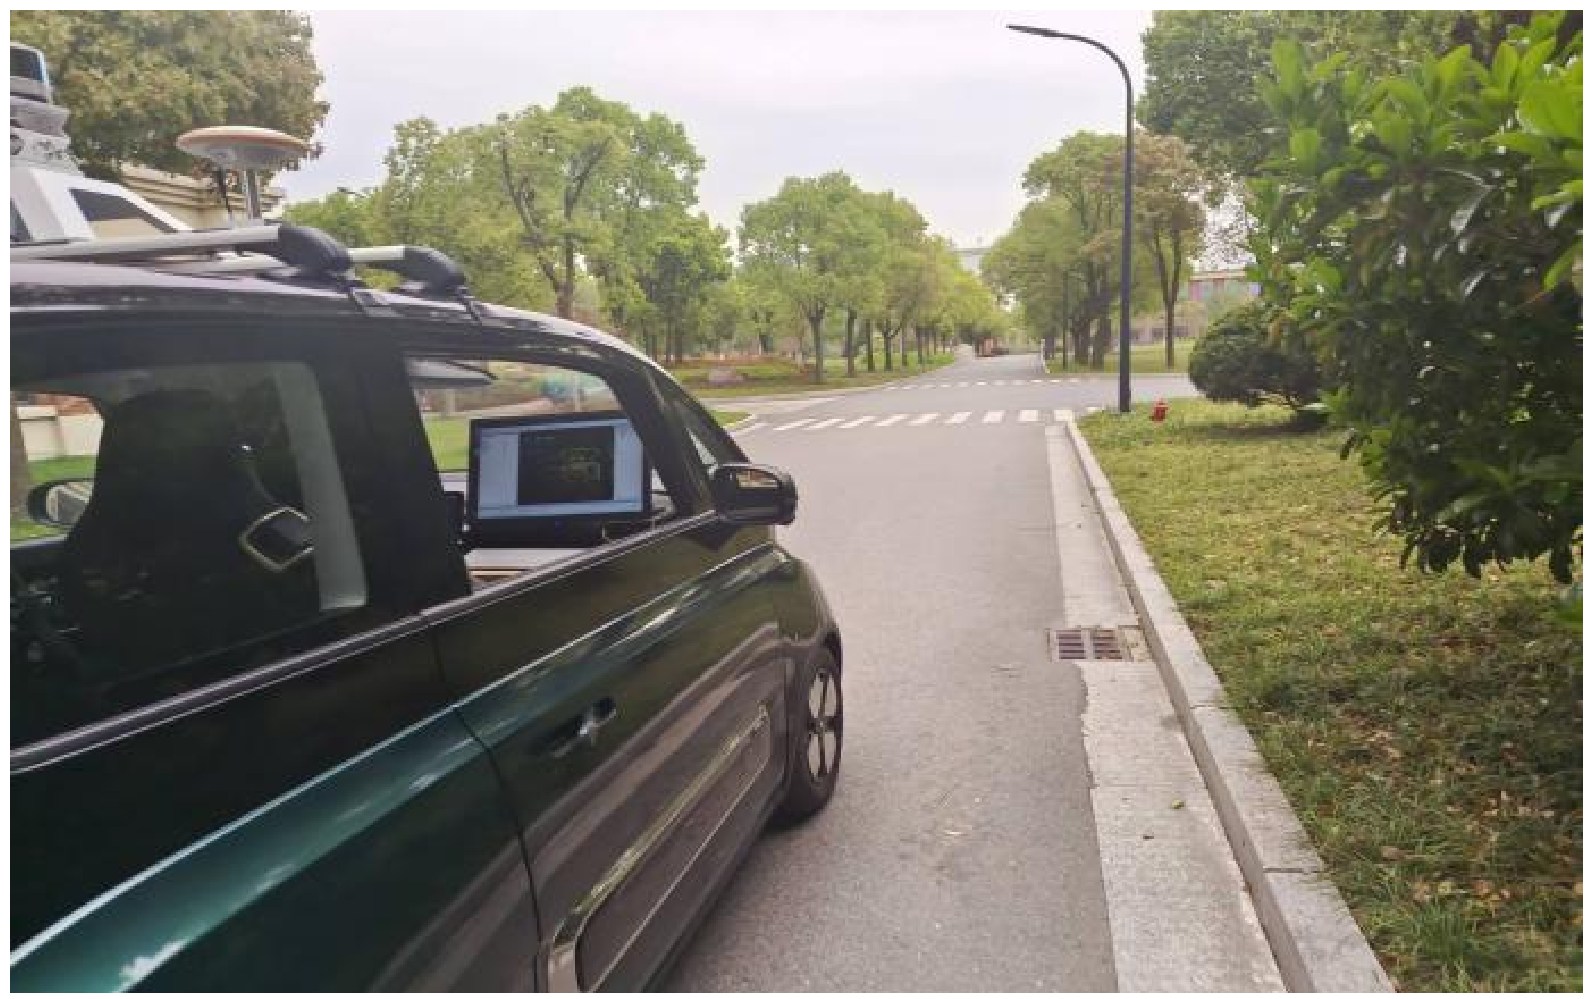
Figure 2 shows the experimental vehicle during testing.
Statistical tests are performed at two levels. Trajectory-level comparisons (e.g., turn entry lead time, jerk peak) treat each valid run as an independent sample (
n = 23: 4 Autoware + 19 human runs), with degrees of freedom reported accordingly (e.g., t(21)). Variance-based comparisons (e.g., heading rate, lateral error) use the full set of sampled data points (
N = 3480: approximately 150 points per run × 23 runs) to capture distributional characteristics, with degrees of freedom reported as (1, 3478). Both approaches are clearly distinguished by their respective degrees of freedom throughout
Section 4.
4. Results
The experimental results are organized according to the five-dimensional framework established in
Section 3.1. For each dimension, the quantitative metrics are presented and compared between Autoware and human drivers. All errors are computed against a reference path derived from aggregated human driver trajectories (see
Section 3.2). A total of 5 human drivers participated, each completing 4 valid runs (20 human trajectories); Autoware completed 4 repeated runs. After quality screening, 23 files were retained (see
Section 3.3).
4.1. Dimension 1: Control Continuity
This dimension is quantified by heading rate variance (derived from GPS trajectory as a proxy for steering correction frequency) and jerk peak
. Abrupt steering and acceleration changes directly correlate with passenger discomfort [
1].
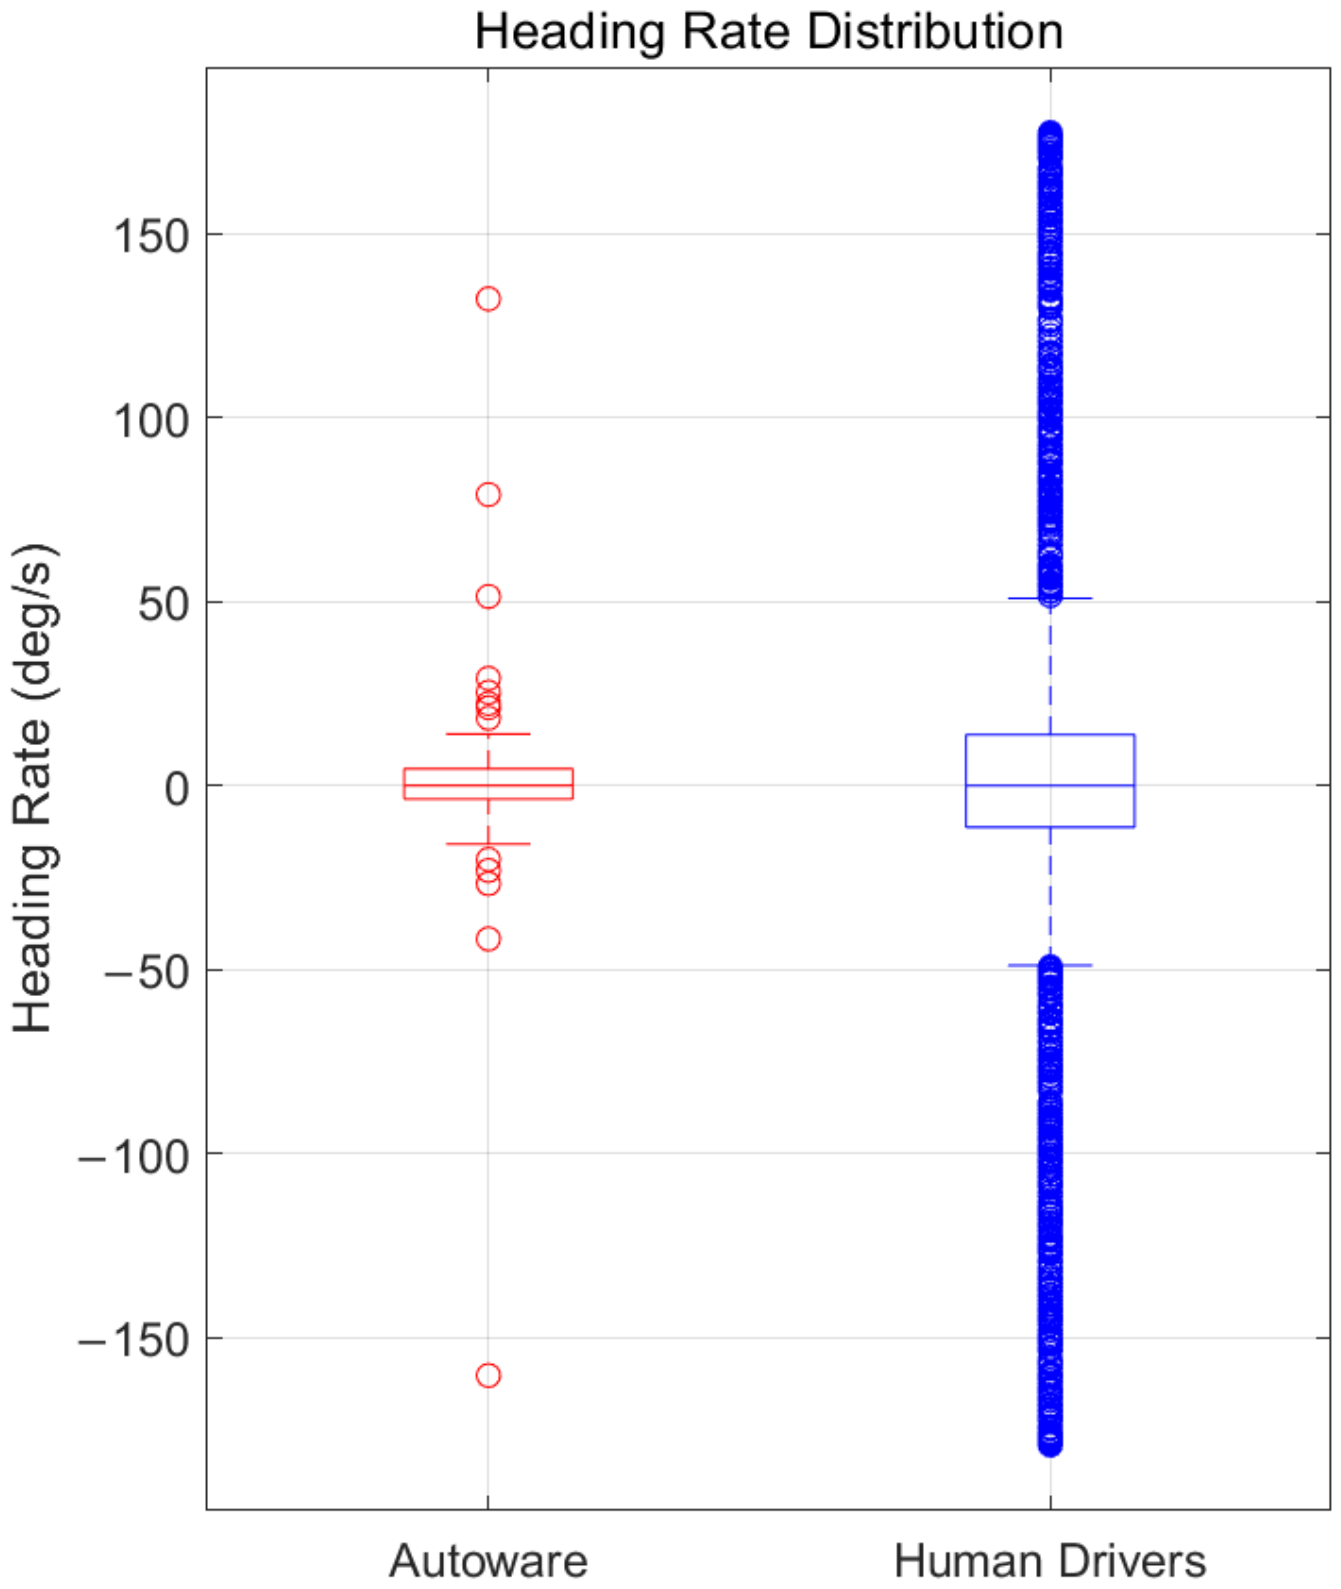
Figure 3 presents the heading rate distribution for Autoware and human drivers. Autoware (red) is tightly concentrated around zero, with a narrow interquartile range and a few outliers approximately between −160 and 130 deg/s. Human drivers (blue) show a similar central tendency but a much longer spread/tail, extending to approximately
to 180 deg/s, indicating occasional larger directional-rate excursions. Although Autoware’s extreme outliers are notable, its heading rate body remains more compact, consistent with frequent but bounded directional micro-corrections as discussed in
Section 4.1. Levene’s test confirmed that the variance of Autoware’s heading rate was significantly lower than that of human drivers (statistic =
, df =
,
).
For longitudinal control, the jerk distribution shows that Autoware is concentrated near zero with outliers roughly between and m/s3, whereas human drivers exhibit a much heavier tail with outliers reaching approximately to m/s3. Thus, human driving involves larger occasional longitudinal transients, while Autoware produces more bounded acceleration changes; its repeated small-amplitude adjustments still contribute to a more mechanical longitudinal feel. The difference in jerk magnitude is statistically significant (, ).
4.2. Dimension 2: Prediction Horizon
Prediction horizon is quantified by the turn entry lead time , defined as the time difference between the initiation of steering and the curve entry point.
On curved sections, Autoware exhibits a reactive entry pattern: the steering angle increases proportionally to path curvature with no anticipatory pre-steering, resulting in a turn entry lead time near zero or slightly negative ( s). Human drivers demonstrate anticipatory entry: they begin steering before reaching the curve based on visual assessment of upcoming road geometry, producing a consistently positive turn entry lead time ( s). The difference in turn entry lead time between Autoware and human drivers was statistically significant (, ).
4.3. Dimension 3: Error Response Mode
Error response mode is quantified by the presence of a response dead zone and the linearity of the error–control relationship.
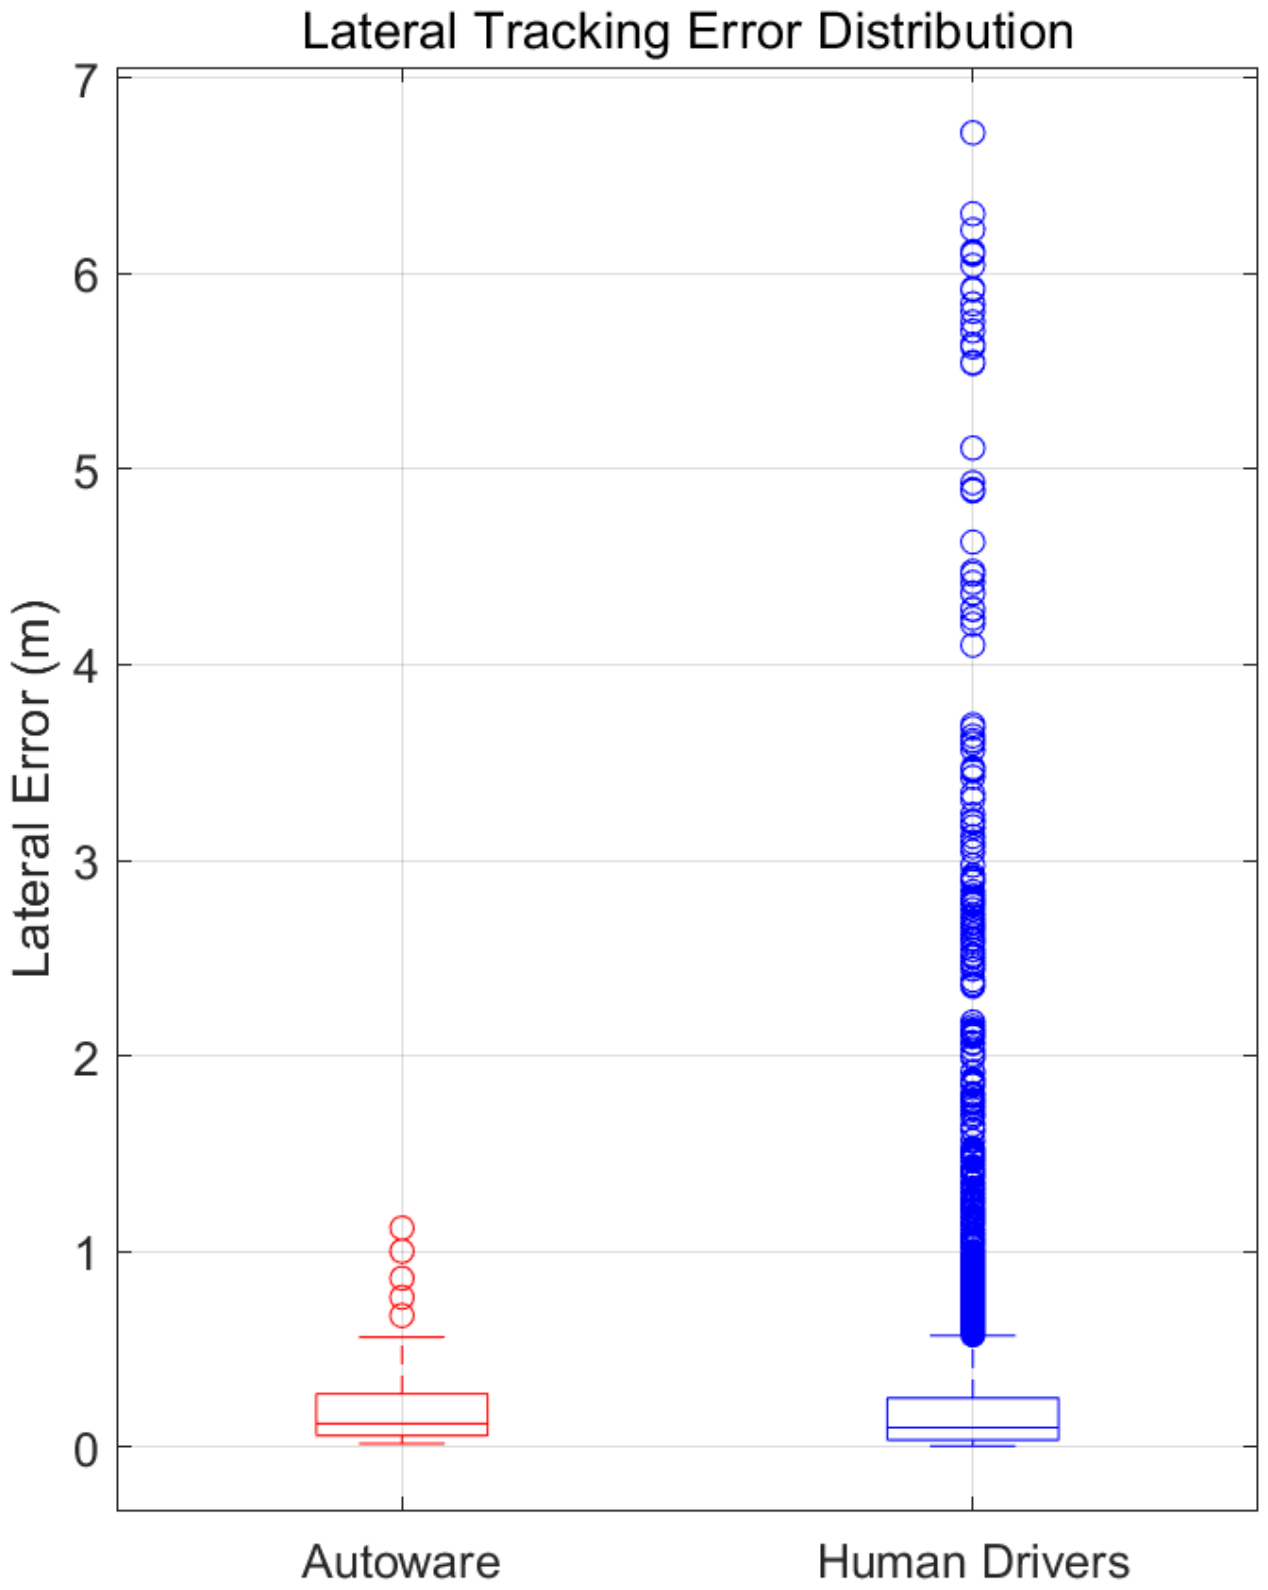
The lateral tracking error distribution, visualized in
Figure 4, presents the deviation of each trajectory from the reference path derived from aggregated human trajectories. Autoware exhibits a compact distribution with most values near 0–0.3 m and outliers up to approximately 1.1 m, reflecting its tight but micro-corrective tracking behavior. Human drivers show a similarly low median and box region but a pronounced upper tail, with outliers reaching nearly 6.7 m, indicating larger occasional lateral deviations.
Autoware responds to every deviation, however small, with a proportional correction, producing a linear error–control relationship with zero dead zone. Human drivers, by contrast, tolerate small errors (e.g., 0.1–0.2 m lateral deviation) without intervention and correct only when deviation accumulates, resulting in a nonlinear response with an effective dead zone. Levene’s test confirmed that the variance of Autoware’s lateral deviation was significantly larger than that of human drivers (, ), indicating that Autoware’s trajectory exhibits greater local fluctuation due to its micro-correction behavior.
4.4. Dimension 4: Style Adaptability
Style adaptability is quantified by the lateral acceleration distribution variance across different scenarios.
Autoware’s lateral acceleration shows low variance across scenarios, as the controller maintains fixed parameters regardless of road geometry. Human drivers demonstrate higher variance in lateral acceleration profiles, smoothly transitioning between conservative and aggressive styles depending on road conditions. This is most evident in curved sections, where human drivers modulate speed to reduce lateral acceleration demand, while Autoware maintains target speed independently of steering demands, resulting in higher and less variable lateral acceleration. Levene’s test confirmed that the variance of Autoware’s lateral acceleration was significantly smaller than that of human drivers (, ).
4.5. Dimension 5: Interaction Friendliness
Interaction friendliness is assessed through behavioral predictability and ride comfort.
Autoware’s high-frequency micro-corrections and segmented braking produce noticeable body motion perceived as “jerky” or “nervous.” The reactive curve entry further reduces predictability, as passengers cannot anticipate the vehicle’s behavior based on natural driving expectations. Human drivers produce smooth, fluid motions that passengers naturally anticipate, resulting in higher comfort and perceived safety.
4.6. Weighted Scoring and Composite Comparison
The scores in
Table 2 were derived by normalizing raw metrics (e.g., heading rate variance, jerk peak, turn entry lead time) to a 1–10 scale. Specifically, each raw metric was normalized against a predefined reference range based on the full observed data distribution across all experimental runs, with the minimum and maximum values observed across all trajectories mapped to 1 and 10, respectively. Intermediate values were then linearly interpolated. Higher scores indicate better performance in that dimension.
The dimension weights were assigned based on literature-informed prioritization. Recent work on human-like driving behavior evaluation has demonstrated that alignment with human driving styles and decision values is critical for autonomous vehicle acceptance, with interaction-related factors emerging as key determinants [
22]. This supports assigning the highest weight (0.35) to Interaction Friendliness. For safety-related dimensions, the relative importance of Error Response Mode and Control Continuity is supported by studies on traffic-flow evaluation criteria [
23]; these dimensions were assigned moderate weights (0.15 and 0.20, respectively), as our framework focuses on behavioral naturalness rather than macro-level traffic safety. The combined subjective-objective weighting approach is consistent with established evaluation practices for automated vehicles [
24]. We acknowledge that the current weights represent a literature-informed judgment rather than an empirically calibrated optimization; this limitation is addressed in
Section 6.
The weighted composite scores are calculated as:
For Autoware:
For human drivers:
The composite scores of 5.46 for Autoware and 7.42 for human drivers indicate that the current Autoware implementation falls significantly short of human driving naturalness, particularly in the heavily weighted Interaction Friendliness dimension.
Table 2 reveals a clear complementary pattern: Autoware excels in dimensions requiring precision and consistency (Control Continuity, Error Response), while human drivers dominate in dimensions requiring anticipation, adaptation, and social intelligence (Prediction Horizon, Style Adaptability, Interaction Friendliness).
5. Discussion
Returning to the research questions posed in the Introduction, the results provide clear answers. RQ1 asked whether quantitative differences exist between Autoware and human drivers across the five behavioral dimensions. The results confirm that significant differences do exist: Autoware outperforms humans in precision-related dimensions (Control Continuity, Error Response), while humans dominate in anticipation-related dimensions (Prediction Horizon, Style Adaptability, Interaction Friendliness). RQ2 asked about the technical origins of these differences. The analysis reveals that these behavioral differences are rooted in four fundamental algorithmic paradigms: geometric tracking versus behavioral tracking, decoupled control versus holistic coordination, error-driven versus intent-driven control, and limited prediction horizon versus extended anticipation. The central hypothesis that Autoware exhibits higher precision but lower naturalness is therefore supported.
5.1. Technical Origins of Mechanicalness
The mechanicalness characteristics observed above are direct consequences of four fundamental algorithmic design choices.
Geometric tracking vs. behavioral tracking. Autoware’s Pure Pursuit-based lateral controller formulates path tracking as a geometric optimization problem: minimize instantaneous deviation from the reference path. This treats driving as a purely spatial task, responding to every deviation with proportional correction. Human drivers employ “behavioral tracking”: they interpret the reference path as a spatial corridor rather than a set of precise coordinates, tolerating small deviations and correcting only when necessary. This explains why Autoware achieves higher precision but lower smoothness.
Decoupled control vs. holistic coordination. The decoupled lateral–longitudinal control architecture treats steering and speed as independent problems. This fails to capture the inherent coupling between lateral and longitudinal dynamics, most evident in curved sections where Autoware maintains target speed through the curve while human drivers naturally reduce speed beforehand. The absence of coordination also explains the segmented braking pattern.
Error-driven vs. intent-driven control. Autoware’s control logic is error-driven: detect deviation, compute error, issue correction. This reactive paradigm ensures stability but produces lag at curve entry and overshoot at exit. Human drivers operate on an intent-driven paradigm, formulating driving intent and selecting actions using preview information, producing anticipatory behavior.
Limited prediction horizon. The prediction horizon of Autoware’s default MPC is limited to 1–3 s based on a simplified kinematic model. Human drivers utilize a 3–5 s horizon supported by visual fixation on upcoming road geometry, enabling smooth, anticipatory actions.
5.2. Safety–Comfort Trade-Off
The mechanicalness of Autoware reflects a systematic trade-off between safety and comfort. Under normal conditions, precision-oriented control maintains a narrow lateral error band (standard deviation approximately half that of human drivers) and prevents deviation accumulation—benefits particularly valuable in prolonged highway driving.
However, these same characteristics degrade ride comfort: continuous micro-corrections produce persistent lateral body motion, segmented braking generates uncomfortable jerk, and reactive curve entry increases lateral acceleration. This penalty is most pronounced in urban driving and has direct implications for user acceptance [
1,
22].
The optimal balance depends on driving context. Safety-critical scenarios (e.g., emergency avoidance) should prioritize precision; routine scenarios with ample margins should emphasize comfort and naturalness. Similar multi-objective trade-offs are addressed in vehicle dynamics and control research, where control strategies must simultaneously satisfy multiple performance criteria [
9,
20]. Future designs should adopt context-aware adaptation rather than a fixed precision-oriented policy.
5.3. Implications for Human-like Control Design
Based on these findings, four directions for human-like control design are proposed. First, introducing an adaptive dead-zone in error response would reduce micro-corrections during straight-line driving, calibrated to vehicle speed and road conditions. Second, extending the MPC prediction horizon and incorporating preview information would enable proactive speed adjustment and steering preparation, reducing reactive lag at curve entry. Third, developing lateral–longitudinal coordination mechanisms would enable speed modulation in response to upcoming steering demands. Fourth, implementing context-aware control adaptation would allow the system to switch between precision-oriented and comfort-oriented modes based on scenario criticality. Recent work on learning-based control for autonomous vehicles provides promising directions for such adaptation [
20].
6. Conclusions
This study systematically investigated the “mechanicalness” of autonomous trajectory tracking through a real-vehicle comparative experiment between the Autoware platform and human drivers. A five-dimensional evaluation framework—encompassing control continuity, prediction horizon, error response mode, style adaptability, and interaction friendliness—was established to quantify the behavioral differences.
The experimental results demonstrate that Autoware exhibits a “high-precision, low-smoothness, zero-tolerance” mechanical control style, characterized by high-frequency micro-corrections, reactive curve entry, and segmented braking. Human drivers, in contrast, employ an organic mode with discrete corrections, anticipatory coordination, and elastic path tolerance. The five-dimensional composite scores (5.46 for Autoware vs. 7.42 for human drivers) confirm that the current Autoware implementation falls significantly short of human driving naturalness, particularly in interaction friendliness.
The main contributions are threefold: (1) a five-dimensional evaluation framework for quantifying mechanicalness; (2) a real-vehicle comparative dataset addressing the gap between simulation and real-world behavioral analysis; and (3) the identification of four technical origins of mechanicalness—geometric tracking, decoupled control, error-driven logic, and limited prediction horizon. While these findings are based on Autoware’s default Pure Pursuit + PID configuration, the identified paradigm-level differences are expected to persist across alternative controllers.
Several limitations are acknowledged, including the single test site, limited driver sample size, and the focus on a single Autoware configuration (the optional MPC controller was not tested). Future work should extend the framework to diverse scenarios, multiple platforms, and empirically calibrated weighting schemes. By recognizing the technical origins of mechanicalness and incorporating human driving principles into algorithm design, autonomous systems can evolve from precise controllability toward natural intelligence.
Author Contributions
Conceptualization, M.C. and R.M.; methodology, M.C.; software, R.M.; validation, M.C., X.Y., Z.L. and Y.R.; formal analysis, R.M.; investigation, R.M.; resources, X.Y. and Z.L.; data curation, R.M.; writing—original draft preparation, M.C.; writing—review and editing, M.C.; visualization, R.M.; supervision, M.C.; project administration, M.C. All authors have read and agreed to the published version of the manuscript.
Funding
This research received no external funding.
Institutional Review Board Statement
Not applicable.
Informed Consent Statement
Not applicable.
Data Availability Statement
The data presented in this study are available on request from the corresponding author. The data are not publicly available due to privacy restrictions.
Acknowledgments
This work was carried out as part of an undergraduate thesis project at the School of Automotive Engineering, Nantong Institute of Technology. The authors would like to thank the school for providing the experimental vehicle and test facilities. Special thanks go to the students and technical staff who assisted in the data collection and vehicle preparation.
Conflicts of Interest
The authors declare no conflicts of interest.
References
- Peng, C.; Merat, N.; Romano, R.; Hajiseyedjavadi, F.; Paschalidis, E.; Wei, C.; Radhakrishnan, V.; Solernou, A.; Forster, D.; Boer, E. Drivers’ Evaluation of Different Automated Driving Styles: Is It Both Comfortable and Natural? Hum. Factors 2022, 66, 787–806. [Google Scholar] [CrossRef] [Scilit] [PubMed]
- Ganesan, S.; Sivakumar, P.; Kim, S. Trajectory tracking performance analysis of Autoware on a real-world test track. In Proceedings of the 2021 IEEE Intelligent Vehicles Symposium (IV); IEEE: Piscataway, NJ, USA, 2021; pp. 1–6. [Google Scholar]
- Coulter, R.C. Implementation of the Pure Pursuit Path Tracking Algorithm; Technical Report CMU-RI-TR-92-01; Carnegie Mellon University: Pittsburgh, PA, USA, 1992. [Google Scholar]
- Snider, J.M. Automatic Steering Methods for Autonomous Automobile Path Tracking; Robotics Institute, Carnegie Mellon University: Pittsburgh, PA, USA, 2009. [Google Scholar]
- Thrun, S.; Montemerlo, M.; Dahlkamp, H.; Stavens, D.; Aron, A.; Diebel, J.; Fong, P.; Gale, J.; Halpenny, M.; Hoffmann, G.; et al. Stanley: The robot that won the DARPA Grand Challenge. J. Field Robot. 2006, 23, 661–692. [Google Scholar] [CrossRef] [Scilit]
- Hu, J.; Zhong, X.; Chen, R.; Zhu, L.; Xu, W.; Zhang, M. Intelligent vehicle path tracking control based on fuzzy LQR. Automot. Eng. 2022, 44, 17–25+43. [Google Scholar] [CrossRef]
- Raffo, G.V.; Gomes, G.K.; Normey-Rico, J.E.; Kelber, C.R.; Becker, L.B. A predictive controller for autonomous vehicle path tracking. IEEE Trans. Intell. Transp. Syst. 2009, 10, 92–102. [Google Scholar] [CrossRef] [Scilit]
- Krajewski, R.; Bock, J.; Kloeker, L.; Eckstein, L. The highD dataset: A drone dataset of naturalistic vehicle trajectories on German highways for validation of highly automated driving systems. In Proceedings of the 2018 21st International Conference on Intelligent Transportation Systems (ITSC), Maui, HI, USA, 4–7 November 2018; IEEE: New York, NY, USA, 2018; pp. 2118–2125. [Google Scholar] [CrossRef] [Scilit]
- Albhaisi, M.S.; Prauzek, M.; Tran Huu Minh, T.; Ozana, S.; Konecny, J. Trajectory tracking control for autonomous vehicles: A systematic PRISMA review of models and strategies. Annu. Rev. Control 2026, 61, 101047. [Google Scholar] [CrossRef] [Scilit]
- Kato, S.; Tokunaga, S.; Maruyama, Y.; Maeda, S.; Hirabayashi, M.; Kitsukawa, Y.; Monrroy, A.; Ando, T.; Fujii, Y.; Azumi, T. Autoware on board: Enabling autonomous vehicles with embedded systems. In Proceedings of the 2018 ACM/IEEE 9th International Conference on Cyber-Physical Systems (ICCPS), Porto, Portugal, 11–13 April 2018; IEEE: New York, NY, USA, 2018; pp. 287–296. [Google Scholar] [CrossRef] [Scilit]
- Autoware Foundation. Autoware Documentation. Available online: https://autowarefoundation.github.io/autoware-documentation/ (accessed on 20 May 2026).
- Ganesan, M.; Chokkalingam, B.; Kandhasamy, S.; Verma, R.; Mihet-Popa, L. Bridging the Sim-to-Real Gap in Motion Planning for Autonomous Electric Vehicles Using Autoware: A Comparative Study of Simulation and Real-World Deployment. IEEE Access 2025, 13, 136210–136225. [Google Scholar] [CrossRef] [Scilit]
- Tran, D.D.; Tomita, T.; Aoki, T. Safety Analysis of Autonomous Driving Systems: A Simulation-based Runtime Verification Approach. IEEE Trans. Reliab. 2025, 74, 4574–4588. [Google Scholar] [CrossRef] [Scilit]
- RMIT University. Scalable Tire Dynamics Modelling and Learning-Based Control for High-Speed Autonomy; Autoware Foundation Centre of Excellence: Philadelphia, PA, USA, 2025. [Google Scholar]
- Li, X.; Wang, W.; Mo, Z.; Zhao, D. Driving style classification based on naturalistic driving data. In Proceedings of the 2018 IEEE Intelligent Vehicles Symposium (IV), Changshu, China, 26–30 June 2018; IEEE: New York, NY, USA, 2018; pp. 1354–1359. [Google Scholar] [CrossRef] [Scilit]
- Zhang, Y.; Wu, L.; Li, X. The role of visual fixation in lateral control stability: An empirical study of experienced and novice drivers. Transp. Res. Part F 2021, 78, 16–29. [Google Scholar] [CrossRef] [Scilit]
- Engström, J.; Wei, R.; McDonald, A.D.; Garcia, A.; O’Kelly, M.; Johnson, L. Resolving Uncertainty on the Fly: Modeling Adaptive Driving Behavior as Active Inference. Front. Neurorobot. 2024, 18, 1341750. [Google Scholar] [CrossRef] [Scilit] [PubMed]
- Siebinga, O.; Zgonnikov, A.; Abbink, D.A. A Model of Dyadic Merging Interactions Explains Human Drivers’ Behavior from Control Inputs to Decisions. PNAS Nexus 2024, 3, pgae420. [Google Scholar] [CrossRef] [Scilit] [PubMed]
- Mohammad, S.H.A.; Farah, H.; Zgonnikov, A. In the Driver’s Mind: Modeling the Dynamics of Human Overtaking Decisions in Interactions with Oncoming Automated Vehicles. Transp. Res. Part F 2024, 107, 562–577. [Google Scholar] [CrossRef] [Scilit]
- Gong, J.; You, S.; Luo, X.; Liang, X.; Yu, J.; Zheng, C. A Comprehensive LLM-powered Framework for Driving Intelligence Evaluation. arXiv 2025, arXiv:2503.05164. [Google Scholar]
- ISO 2631-1:1997; Mechanical Vibration and Shock—Evaluation of Human Exposure to Whole-Body Vibration—Part 1: General Requirements. International Organization for Standardization: Geneva, Switzerland, 1997.
- Wang, P.; Wu, G.; Zhao, Y.; Lin, Y.; Yang, H.F. LLM agents can partially mimic human driving behaviors and decision values but better align with aggressive profiles. Transp. Res. Part C 2026, 186, 105606. [Google Scholar] [CrossRef] [Scilit]
- Han, S.; Kang, J.; Chae, C. Analysis of relative importance of traffic-flow evaluation indicators in mixed autonomous vehicle environments using AHP method. Int. J. Highw. Eng. 2025, 27, 183–192. [Google Scholar] [CrossRef] [Scilit]
- Wang, W.; Wu, L.; Li, X.; Qu, F.; Li, W.; Ma, Y.; Ma, D. An evaluation method for automated vehicles combining subjective and objective factors. Machines 2023, 11, 589. [Google Scholar] [CrossRef] [Scilit]
| Disclaimer/Publisher’s Note: The statements, opinions and data contained in all publications are solely those of the individual author(s) and contributor(s) and not of MDPI and/or the editor(s). MDPI and/or the editor(s) disclaim responsibility for any injury to people or property resulting from any ideas, methods, instructions or products referred to in the content. |