Article

Influence of Sound Insulation Evolution on Interior Noise for Subway Rail Vehicle’s Carbody

1
CRRC Nanjing Puzhen Co., Ltd., Nanjing 210031, China
2
School of Mechanical, Electronic and Control Engineering, Beijing Jiaotong University, Beijing 100044, China
3
Tangshan Research Institute, Beijing Jiaotong University, Tangshan 063000, China
*
Authors to whom correspondence should be addressed.
Vehicles 2026, 8(6), 125; https://doi.org/10.3390/vehicles8060125
Submission received: 6 April 2026 / Revised: 22 May 2026 / Accepted: 26 May 2026 / Published: 4 June 2026
(This article belongs to the Special Issue Optimization and Management of Urban Rail Transit Network)

Abstract

As the operational service lifespan of subway rail vehicles increased, the sound insulation of the carbody inevitably deteriorated, leading to heightened noise levels inside the vehicles and significantly compromising passenger comfort. Therefore, the impact of the subway carbody’s sound insulation performance on interior noise throughout its service life was studied. The research of this paper was carried out by combining experimental and simulation methods. Through experimental testing, it examined the sound insulation levels of different vehicle components, including the door, side wall and underframe. The carbody sound insulation with different operational lifetimes was obtained. Subsequently, an acoustic simulation model for interior noise in subway vehicles was established via the statistical energy method, and measured data was used to ensure reliability. Finally, based on the simulation model, the interior noise values under different operational service lifespans were obtained. The influence patterns of varying sound insulation performance across different carbody components on interior noise levels were analyzed. The influence of the change in sound insulation over the operational lifespan on the interior noise was obtained. The findings of this paper hold practical engineering significance for developing noise control strategies and maintenance plans for subway rail vehicles.

1. Introduction

1.1. Background

Subways are an integral part of our daily transportation methods. However, as the operational service life of subway rail vehicles increases, their sound insulation inevitably deteriorates, leading to high noise levels inside the vehicles and significantly compromising passenger comfort.
The primary source of noise in subways originates outside the train. The side walls and underframes of the carbody experience structural and performance changes in their internal sound insulation materials as operational service life increases, leading to a decline in the sound insulation performance. Similarly, the frequent opening and closing of doors leads to structural wear and the formation of gaps, causing sound leakage. As the operational service life of the train increases, the sealing integrity of doors deteriorates, resulting in progressively greater sound leakage and declining sound insulation performance.
Therefore, this paper investigates the impact of the subway carbody’s sound insulation performance on interior noise throughout its service life, providing a theoretical basis for improving the vehicle’s sound insulation performance.

1.2. Research Status

Sound insulation is the primary characteristic for evaluating a component’s acoustic performance. Currently, it is primarily determined through theoretical calculations, numerical simulations, and experimental measurements [1,2]. Initial calculations for simple objects were based on wave acoustics. With advancements in software development and computing power, it has become feasible to mathematically calculate the sound insulation of specific sections or even entire objects [3,4]. Sound insulation values can be obtained through laboratory measurements. Laboratory measurements are performed by deploying sound sources within reverberation chambers. Numerous methods for measuring sound insulation values have been researched using currently available techniques [5,6]. However, it is impossible for subway vehicles to measure the sound insulation of the carbody in the reverberation chamber. Specialized methods need to be adopted to measure the sound insulation of each part of the carbody.
In wave acoustics, when calculating sound insulation, treating plate components as ideal materials without boundaries limits this method to significant measurement errors at low frequencies [7]. Building upon this, Kuo derived the transfer matrix method to calculate sound insulation for anisotropic materials [8]. Addressing the inaccuracies of the wave transmission method in low-frequency sound insulation calculations, Villot and Guigou proposed a spatial window function correction method based on panel dimensions, providing a theoretical foundation for improving low-frequency sound insulation performance analysis [9]. Coyette compared the simulation results of the finite element method and the boundary element method for the composite structure, confirming that the trends of the two methods are consistent, which provides a basis for the engineering applicability of the boundary element method [10]. Yang presents a hybrid wave and finite element and boundary element method for predicting the vibroacoustic characteristics of complex panels [11]. These findings demonstrated that structural sound insulation performance could be determined through simulation or theoretical calculation methods.
Current research methods for analyzing sound transmission loss in structural components include analytical method [12], finite element method [13], boundary element method [14], statistical energy method [15], and experimental method. Similar to calculating component sound insulation, each approach has its advantages and disadvantages. Research indicated that the impact of holes on sound insulation was primarily in the high-frequency range. As the area of the hole increased, high-frequency sound insulation continued to decrease while extending toward the middle and low-frequency ranges. Furthermore, studies showed that the presence of gaps could increase noise across the entire frequency spectrum, particularly in the high-frequency range.
The overall sound insulation performance of components was analyzed using the principle of energy superposition and impedance analysis [16]. When narrow gap impedance was considered in calculations, the component’s sound insulation performance was higher compared to calculations that ignore impedance. Increasing porosity or raising sound wave frequency further widened this difference. As structural sound insulation improved, the impact of gaps on overall component performance diminished [17]. Hongist derived a theoretical model for sound insulation of doors with narrow slits based on Gomperts’ rectangular aperture transmission coefficient theory [18,19]. Measurements conducted in a reverberation chamber compared experimental and theoretical values, revealing that theoretical calculations closely matched experimental results across the entire frequency range. Gap width was the primary factor influencing a component’s sound insulation performance. Due to gap resonance effects, a noticeable decrease in sound insulation occurs within a specific high-frequency band.
Door gaps primarily result from poor sealing between the door and carbody, structural limitations, and component aging or wear. Based on modal superposition analysis and reverberation chamber–anechoic chamber testing, the sound insulation performance of door seals was calculated under varying compression levels. Even minor gaps between the door and seal significantly degrade the seal’s sound insulation performance [20,21]. The influence of the traffic spectra characteristics on the indoor noise transmitted by windows could be evaluated by means of in-the-field measurements [22,23]. The above literature indicated that as train operating time increased, deteriorating door sealing performance weakened sound insulation, leading to elevated cabin noise levels. However, existing studies provided only qualitative conclusions, lacking quantitative analysis. Further research is needed to investigate the relationship between operating time and its impact on body sound insulation and interior noise levels.
This paper investigated the evolution of body sound insulation performance throughout service life. Through experimental testing, it examined how the sound insulation levels of different vehicle components changed over operational time in Section 2. Subsequently, an acoustic simulation model for interior noise in subway vehicles was established and validated against measured data to ensure reliability in Section 3. Finally, based on the simulation model, the paper investigated the influence patterns of varying sound insulation performance across different carbody components on interior noise levels in Section 4. It summarized the patterns of change in interior noise and ccarbodysound insulation throughout the service life of subway vehicles.
This study has the following contributions. Firstly, the carbody sound insulation with different operational lifetimes was obtained through experiments, and degradation patterns of carbody sound insulation performance were obtained. Secondly, the simulation model of the interior noise has been established. Thirdly, for different carbody components, including the door, side wall and underframe, the influence of the change in sound insulation over the operational lifespan on the interior noise was obtained. In comparison with previous studies, this paper obtained the prediction relationship between service life and the overall sound pressure level inside the vehicle, which achieved more accurate sound insulation performance evaluation for main components of carbody. The results of the SEA simulation model were corrected and verified via measured values. The measured sound insulation of the carbody components was used in the simulation analysis. The findings of this paper hold practical engineering significance for developing noise control strategies and maintenance plans for subway vehicles.

2. Sound Insulation Testing on Carbody at Different Service Life

The test subjects were identical subway vehicles operating at 80 km/h with varying service lifespans: 2 years, 3 years, and 6 years. Each vehicle featured identical structures and identical vibration and noise reduction solutions. Tests were conducted on the sound insulation performance of carbody components to provide the required acoustic parameters for noise simulation within the passenger compartment. These tests also supplied experimental data for validating the results of the interior noise simulations.

2.1. Sound Insulation Testing Theory and Method

Transmission loss (TL) is expressed by the following formula [24]:
T L = 10 log W t W i
where T L is the structural sound transmission loss; W t is the incident acoustic energy; and W i is the transmitted acoustic energy.
Using the sound intensity method to measure the sound insulation of components, the sound insulation quantity of R I measured by the sound intensity method is
R I = L P ¯ 6 + 10 lg S L I n ¯ + 10 lg S M = L P I ¯ L I n ¯ 6 + 10 lg S S M
where L I n ¯ is the average normal sound intensity level of the test surface; L P ¯ is the average sound pressure level in the reverberation chamber; and S M is the sum of the areas of each measurement sub-surface.
In Equation (1), the expression within the first set of parentheses represents the sound power level at the incident surface. For tests conducted on trains, this corresponds to the sound power level inside the vehicle. The expression within the second set of parentheses represents the sound power level at the transmission surface. For tests conducted on trains, this corresponds to the sound power level outside the vehicle.
The specific method for conducting sound insulation testing on trains using the sound intensity method is as follows: The interior of the tested carriage is configured as a reverberation chamber, with the exterior representing a free sound field. A sound source is placed inside the carriage to generate acoustic excitation, and the sound pressure levels at all sound source points within the carriage are measured. The average sound pressure level inside the carriage is then calculated. Sound intensity measurements are performed in distinct zones outside the carriage.
During exterior sound intensity testing, the area outside the vehicle can be considered a free-field environment serving as the receiving chamber. The exterior test surface of the vehicle body is divided into N grids, and the radiated sound intensity is measured at the center point of each grid.
The average sound pressure level in a reverberation chamber can be expressed as [25]
L P ¯ = 10 lg 1 N i = 1 N 10 0.1 L p i
where N is the number of sound pressure test points in the reverberation chamber, and L P i is the average sound pressure level measured over time in the i-th grid area.
The average normal sound intensity level on the test surface of the carbody outside is as follows [26]:
L I n ¯ = 10 lg 1 S M i = 1 N S M i × I n i I 0
where S M is the total area of the test surface; S M i is the cell area; I n i is the average normal sound intensity level measured over time in the i-th grid region; I 0 is the reference sound intensity; and I0 = 10−12 (W/m2).

2.2. Sound Insulation Testing Process

This test employed the sound intensity method to conduct sound insulation tests on the vehicle underframe, side walls, and doors, with the obtained results applied to the establishment of a simulation model.
The testing equipment included a high-precision data acquisition system from B&K Sound, an omnidirectional dodecahedral spherical sound source, a power amplifier, 1/2-inch sound sensors, and a sound intensity probe. During the field testing process, data acquisition was performed using a B&K high-precision data acquisition instrument with a sampling frequency range of 0 to 12.8 kHz. The omnidirectional 12-sided spherical sound source had a maximum sound power level of 120 dB across the frequency range of 100 Hz to 8 kHz.
Twelve spherical sound sources and 1/2-inch sound sensors are uniformly distributed throughout the vehicle interior, positioned as shown in Figure 1. Red hexagons indicate sphere positions, and yellow circles denote sound pressure measurement points inside the vehicle. The sound insulation test areas were the door, side wall, and underframe.
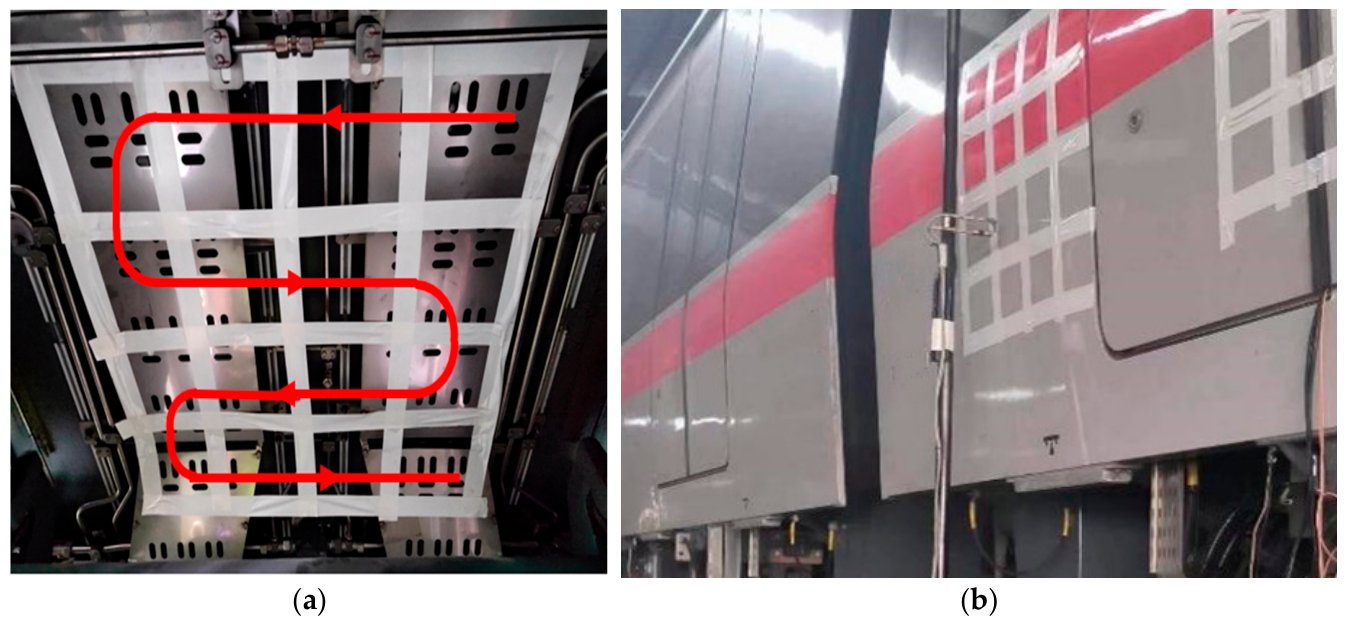
The sound intensity probe spacer used in this sound insulation experiment was 12 mm. During testing, the sound intensity probe was used to sequentially scan the center point of each grid location at the measurement points, as shown in Figure 2.
Regarding the grid division strategy, a uniform grid with a spacing of 0.9 m × 0.9 m was adopted for the underframe, and another uniform grid with a spacing of 0.7 m × 0.7 m was adopted for the door and sidewall. The number of scanning points was specified as 16.
The averaging time at each scanning point was set to 30 s, a duration sufficient to stabilize the sound intensity signal and reduce random measurement errors. Repeat measurements were conducted for each component, with two independent repeated tests performed under the same experimental conditions to verify the stability of the results.
For background noise treatment, background noise was measured before each test in the same environment. The background noise level did not exceed 45 dB. Measurement uncertainty evaluation was calculated, considering the main uncertainty sources, including instrument precision, environmental temperature fluctuation, and repeat measurement errors, with the expanded uncertainty (k = 2) determined to be ±0.3 dB.

2.3. Test Analysis of Body Structure Sound Insulation

Taking a subway vehicle with one of its testing lines operating for 3 years as an example, according to Equation (2), for sound insulation testing using the sound intensity method, taking the underframe structure of the vehicle body as an example, to obtain the sound insulation performance of this part, it is necessary to obtain the average sound pressure level L P ¯ of the reverberant sound field inside the vehicle and the average normal sound intensity level L I n ¯ of the test surface outside the vehicle. The difference between the two is the required sound insulation value of the underframe.
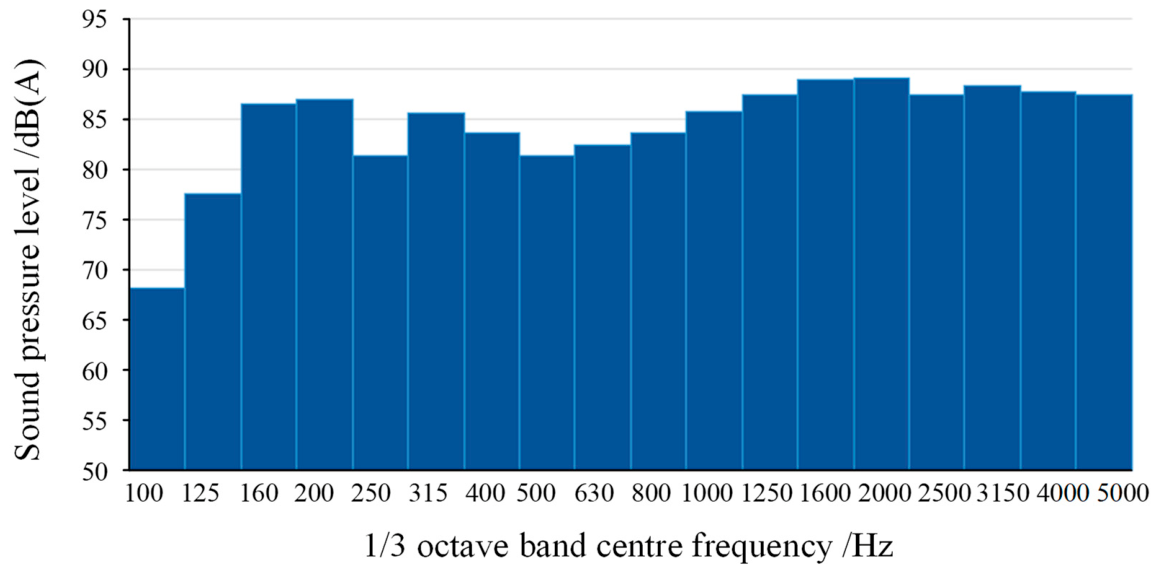
Firstly, data processing and analysis were performed on the interior sound pressure level results. The sound pressure level spectrum of the reverberant field inside the vehicle, obtained from Equation (3), is shown in Figure 3.
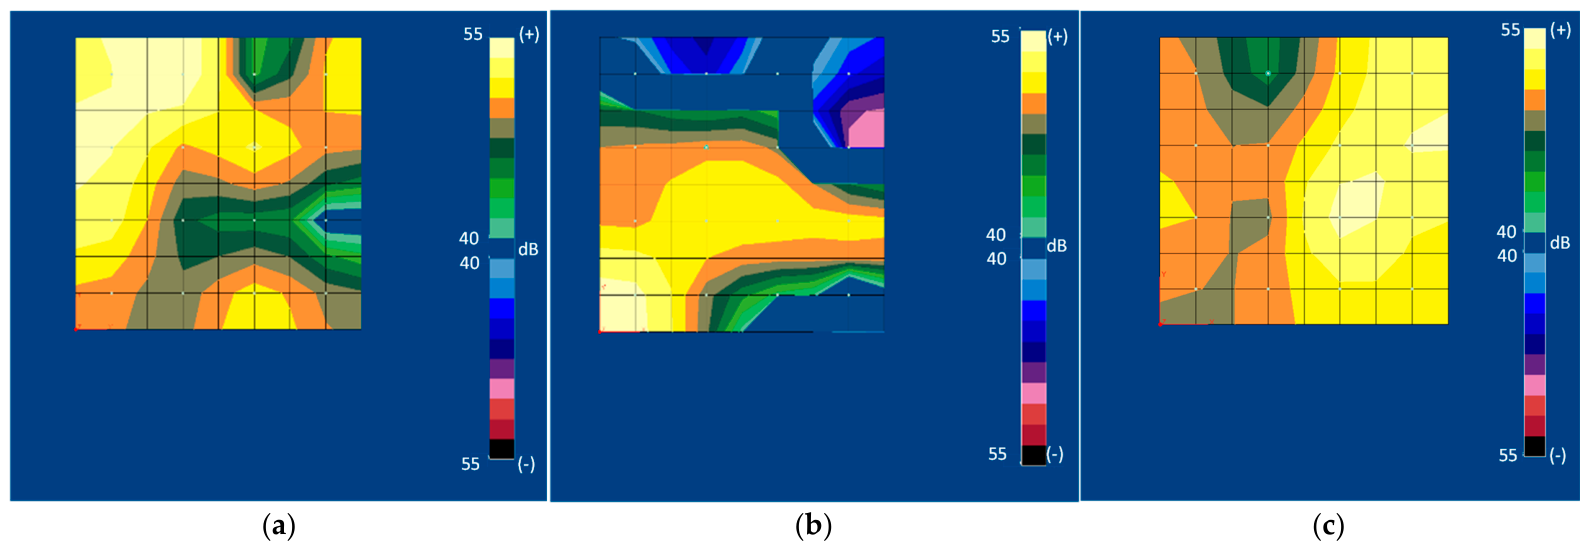
Secondly, data processing and analysis were conducted on the sound intensity test results obtained outside the vehicle. For each test point location, including the underframe, side wall, and door areas, the test sound intensity probes were used to process and analyze the measured sound intensity data. This ultimately yielded sound power level contour maps in third-octave bands for all tested exterior locations. The frequency range selected for this sound insulation test was 100 Hz to 5000 Hz. The sound power level contour maps at one frequency for each test point location are shown in Figure 4.
Figure 4 shows the sound power level contour map within the frequency range of 100 Hz to 5000 Hz. The contour map indicates that the sound power level outside the door exhibits a well-defined symmetrical relationship, with a higher sound power level on the right side. This is attributed to sound leakage occurring through the door gap on the right side.
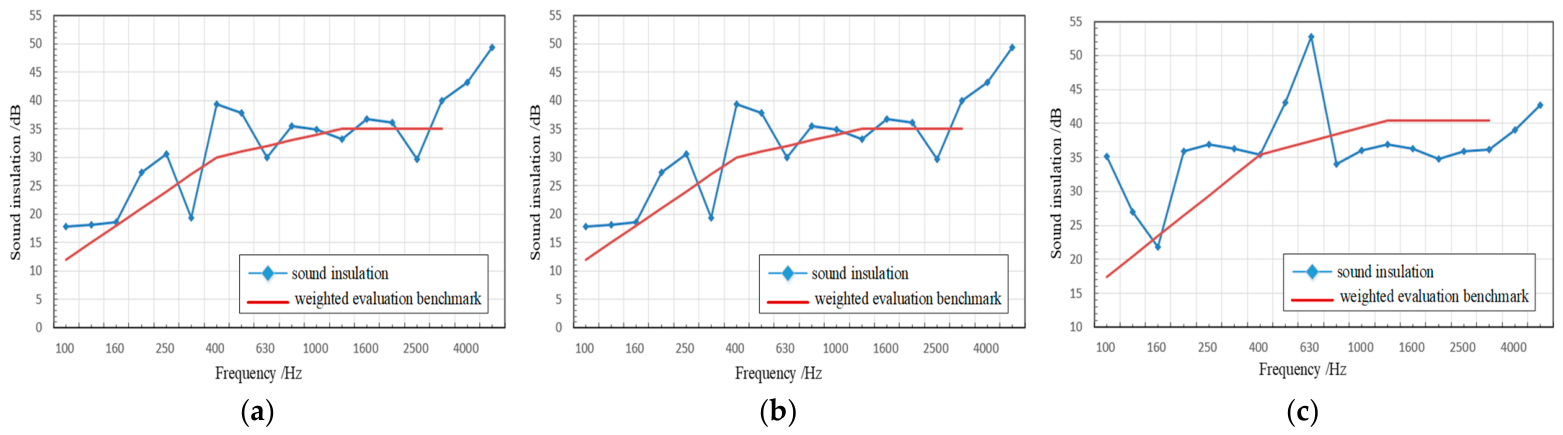
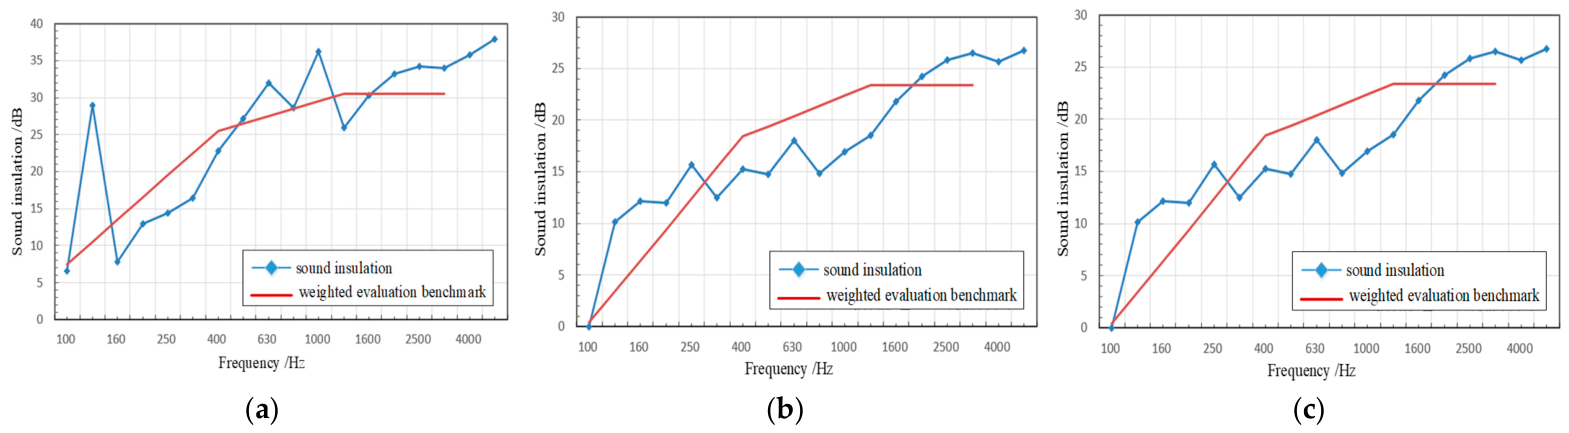
To obtain the sound insulation values for corresponding components, the overall test data for each sound insulation component was exported, yielding the sound power spectrum. Using the sound intensity method to calculate the sound insulation value Equation (4) and the relationship between sound intensity level and sound power level, the frequency spectrum of sound insulation values was computed. Plotting yielded the sound insulation values for each component as shown in Figure 5.
The measured sound insulation values varying with frequency were converted into weighted sound insulation values using the weighted evaluation benchmark. It indicated that the underframe’s weighted sound insulation was 31.4 dB; the side walls’ weighted sound insulation was 35.6 dB; and the doors’ weighted sound insulation was 36 dB.
The sound insulation of subway vehicles with the same structure and different service lives was tested.
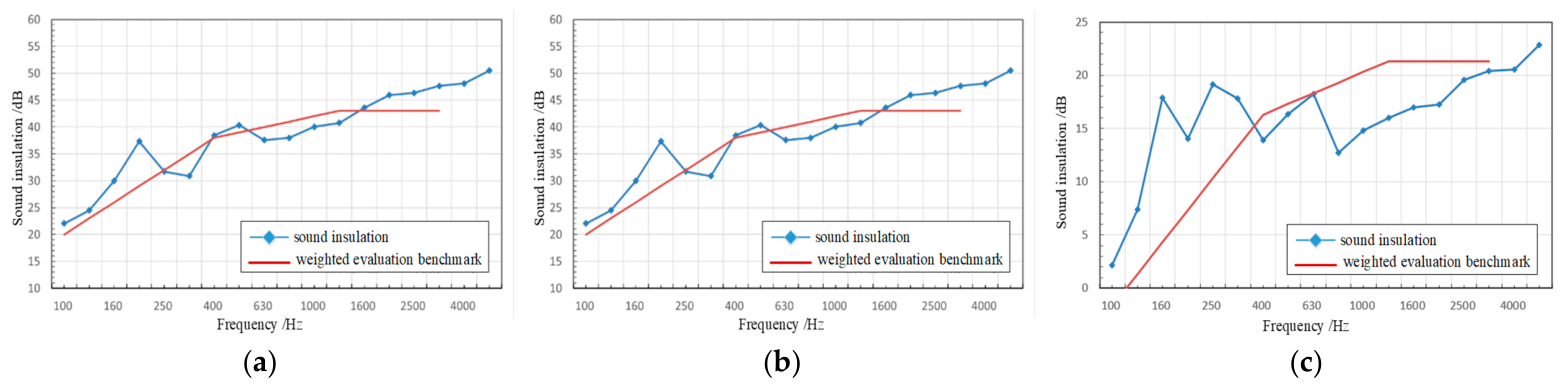
The measured sound insulation values for subway vehicles with 6 years of service life were calculated, with the weighted sound insulation values for each component shown in Figure 6.
The measured sound insulation values for subway vehicles with 2 years of service life were calculated, with the weighted sound insulation values for each component shown in Figure 7.

3. Interior Noise Simulation Analysis on Subway Vehicle

3.1. Establishment of Acoustic Models

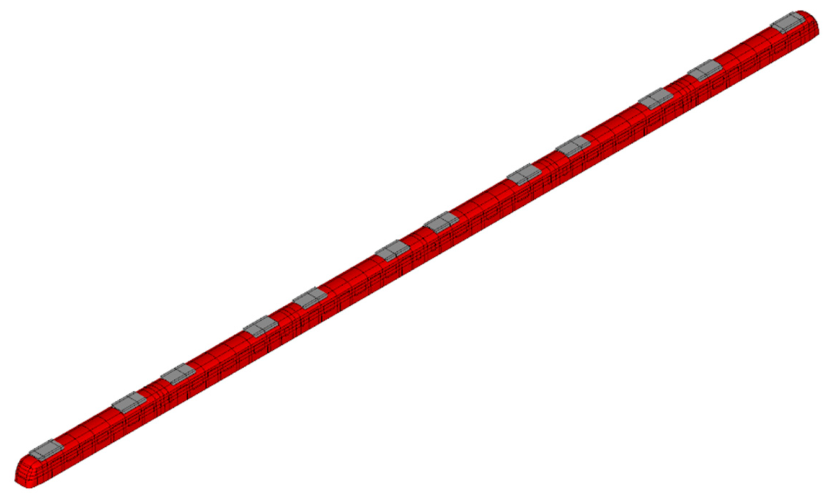
Based on the structural dimensions of subway vehicles, as shown in Figure 8, a simulation model was established for the interior noise.
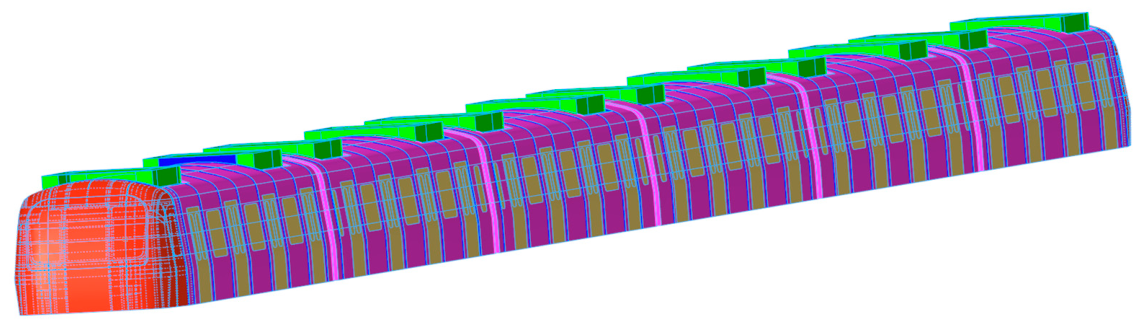
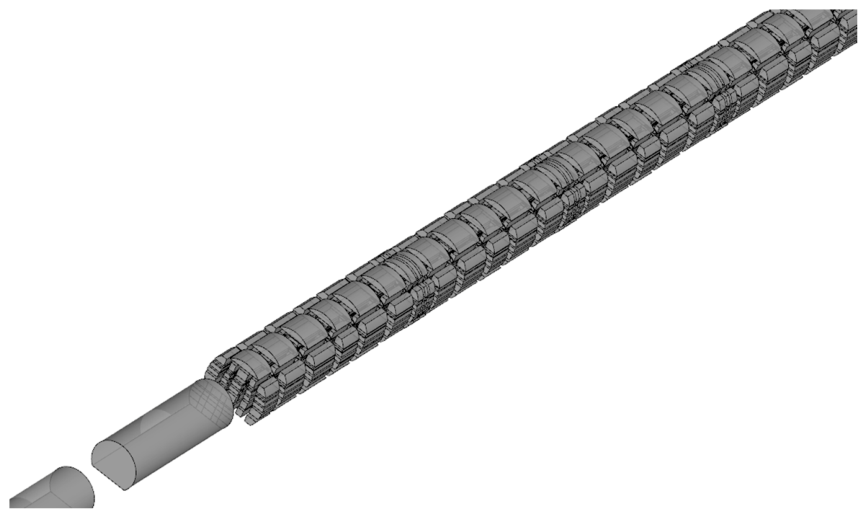
The structure model was imported into VA One 2021 software, and the Statistical Energy Analysis (SEA) model was generated as shown in Figure 9. The subsystem division was carried out according to the structural characteristics of the subway vehicle carbody. The underframe, side walls, roof, and doors were regarded as thin-walled plate structures, and the interior cavity was regarded as an acoustic cavity subsystem, ensuring that each subsystem has independent energy storage and transmission characteristics.
After completing the acoustic cavity model segmentation, parameter settings for the sound insulation of carbody sections must be configured. Based on the actual structure of the subway vehicle, sound insulation values are assigned to the underframe, side walls, roof, and doors. The sound insulation parameters of the vehicle body components were derived from the acoustic design parameters of the vehicle and the test results of the new components’ sound insulation. Under these parameters, the simulation results of the interior noise were the values for the new vehicle, that is, the values for a service life of 0 year.
The coupling loss factor was realized through the sound transmission loss parameter, reflecting the energy transfer from the external structure to the interior cavity. The definition of tunnel excitation was determined based on the tunnel noise measurement data, which was consistent with the test in Section 3.3. The introduction of measured sound insulation data into the SEA model was the frequency-dependent transmission loss data (1/3 octave band) of each component.
The acoustic simulation model under the tunnel operating condition is shown in Figure 10.
The limitation of the SEA method at low frequencies stems from its fundamental assumption that each subsystem involved was in a state of statistical energy equilibrium, which required the subsystem to have a sufficient number of resonant modes. Its limitations at low frequencies (100–300 Hz) need to be taken into account when comparing the study results.

3.2. Analysis of Interior Noise

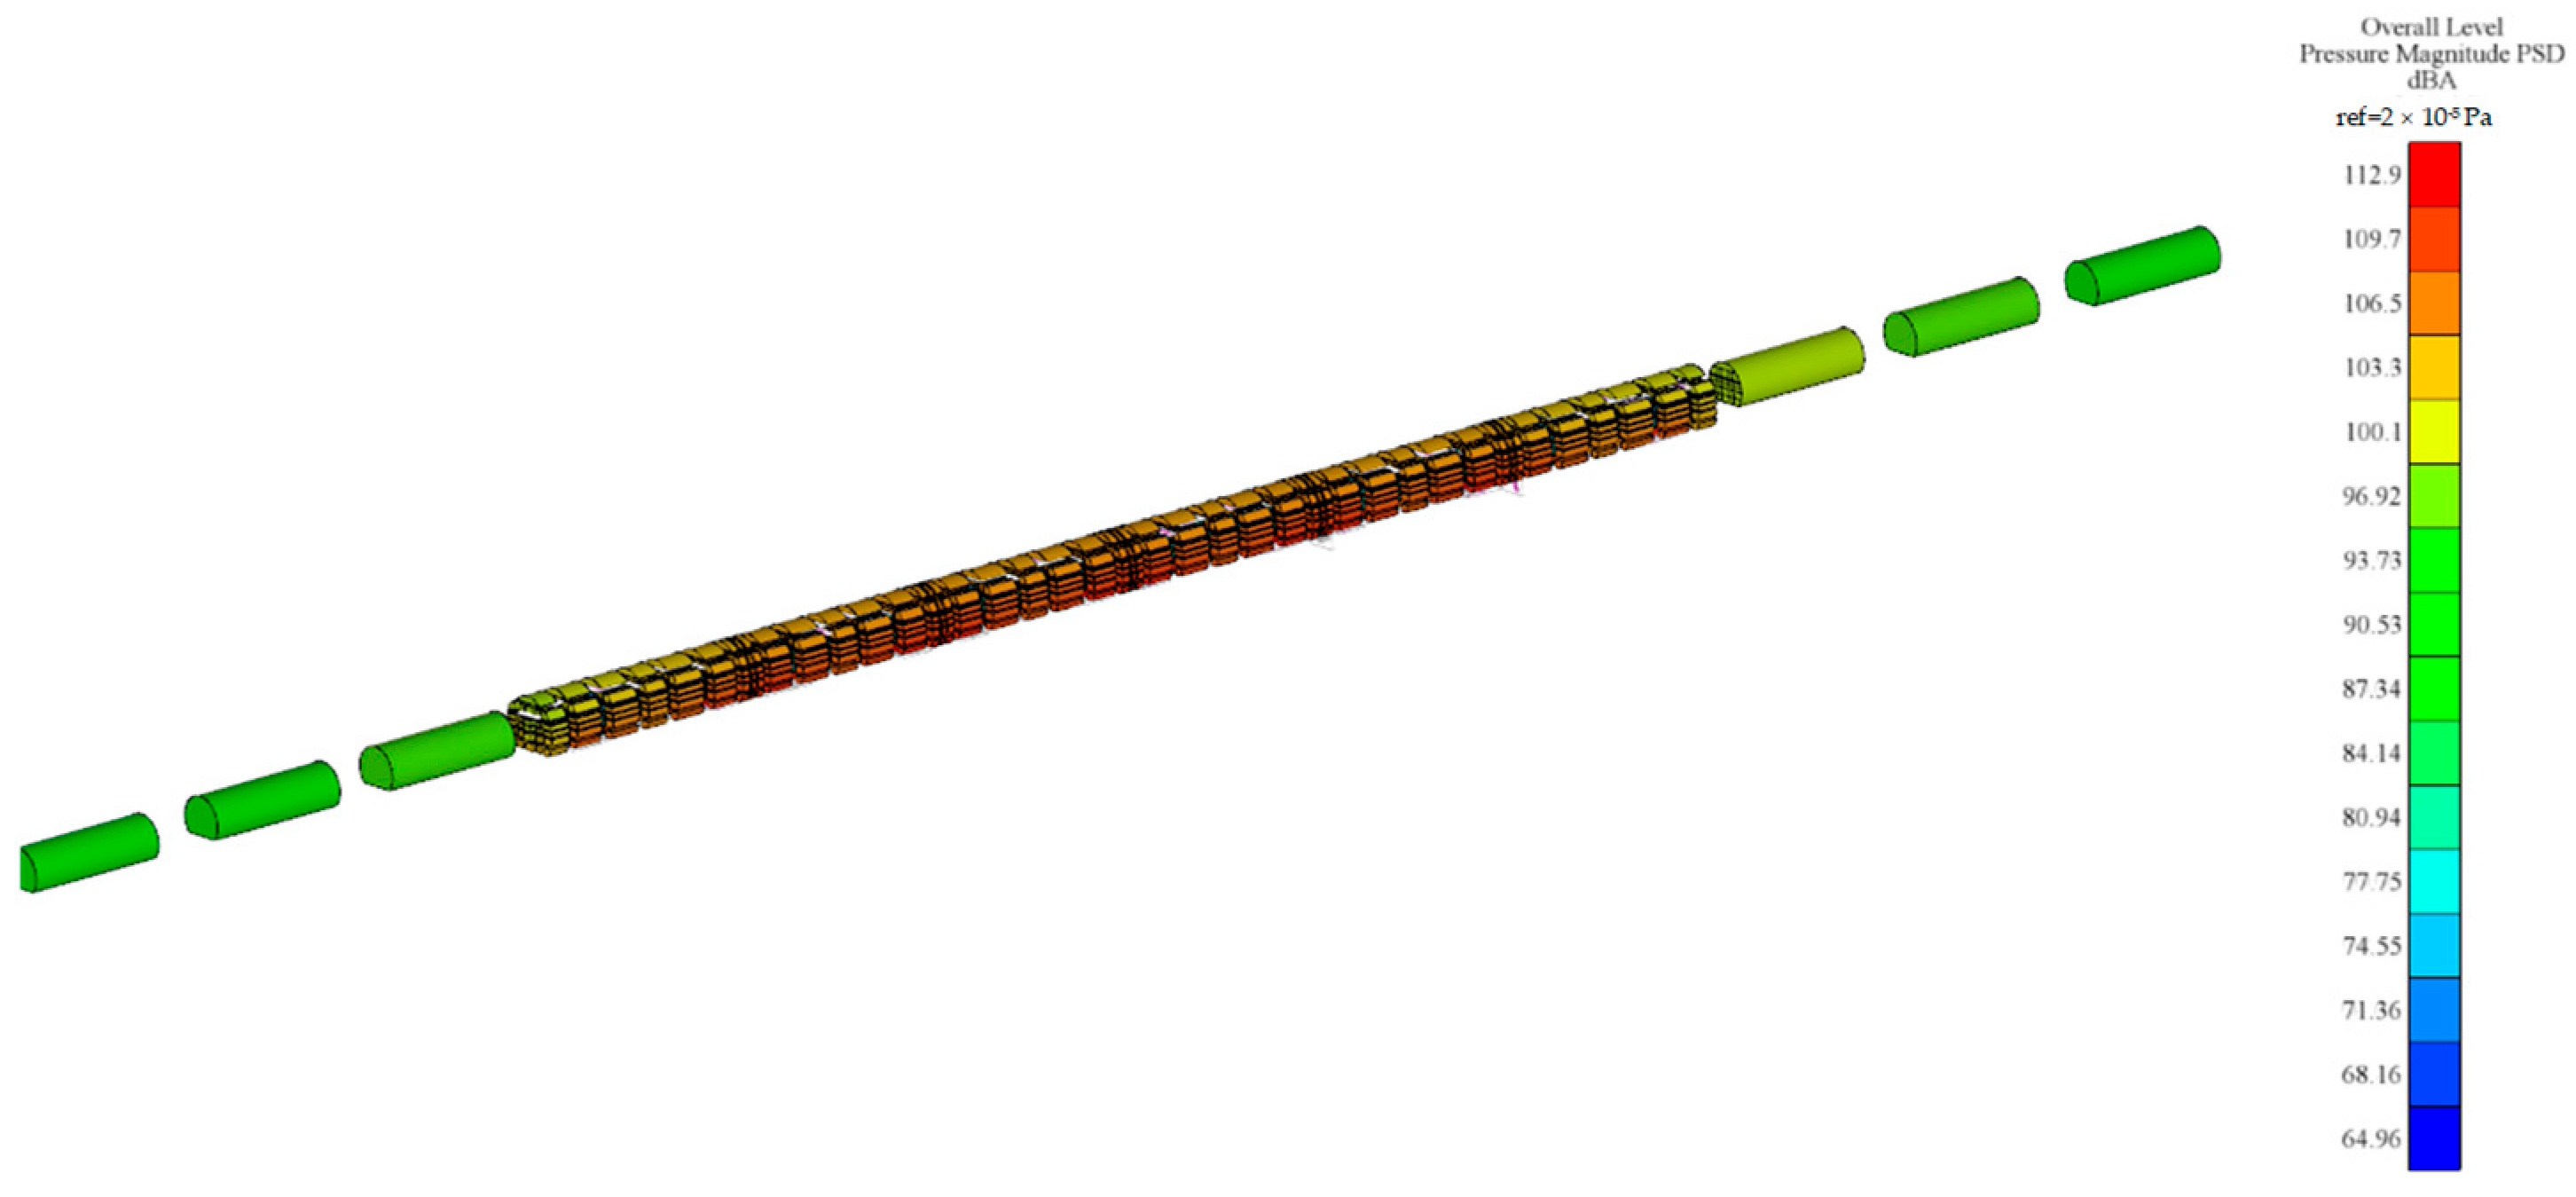
When the train runs at a constant speed of 80 km/h in the tunnel, the simulation calculation results are shown in Figure 11.
At Car A and Car B, two points were selected: the end and center of the passenger compartment. Each point was positioned at 1.2 and 1.6 m above the underframe surface, separately. The simulation results are listed in Table 1. This result represented the interior noise corresponding to the 0-year service life.

3.3. Validation of Simulation Results with Experimental Data

Sound sensors were positioned at 1.2 m and 1.6 m inside the vehicle. The locations of measurement points 1 to 6 are shown in Figure 12. Measurement points 1 and 3 were located above the center of two bogies in Car A, and they measured the noise at the end of Car A. Measurement point 2 was located in the center of Car A, and it measured the noise at the center of Car A. Measurement points 4 and 6 were located above the center of two bogies in Car B, and they measured the noise at the end of Car B. Measurement point 2 was located in the center of Car B, and it measured the noise at the center of Car B.
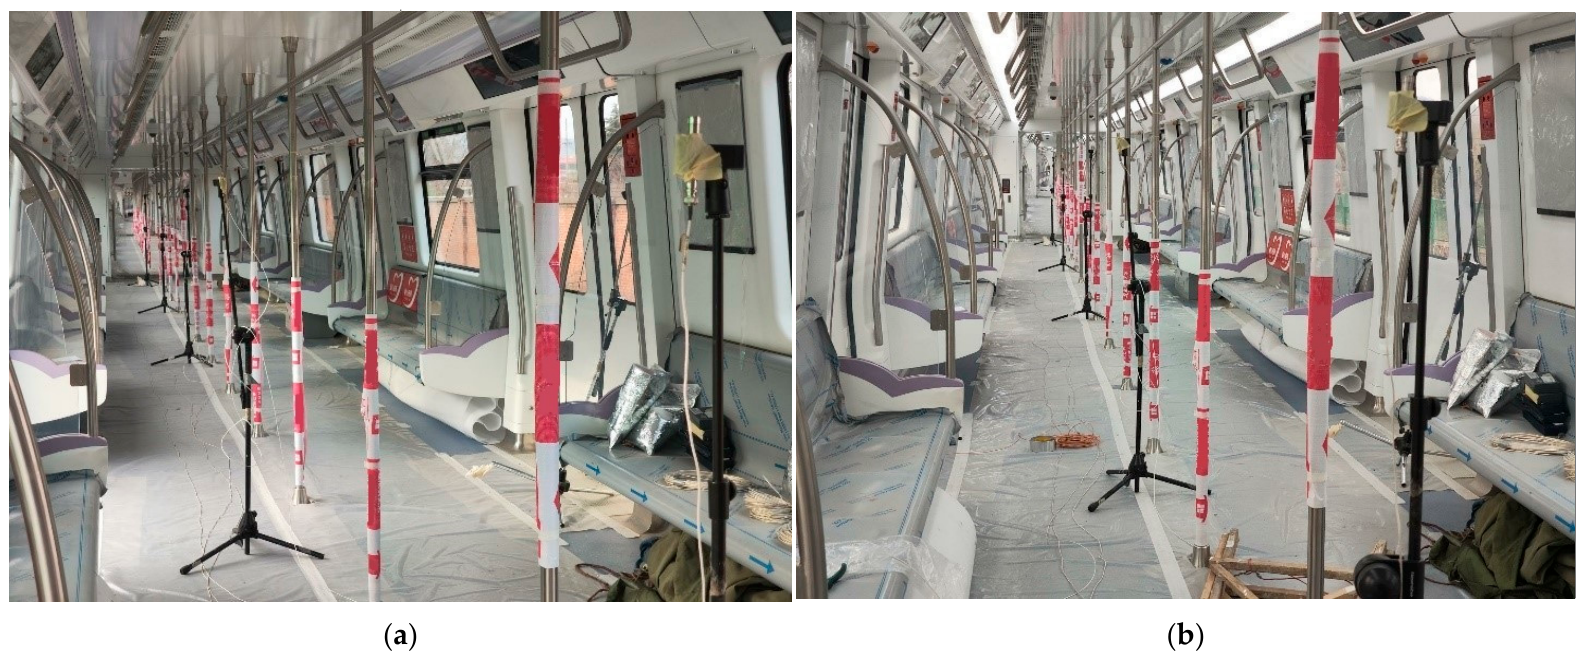
The 1/2-inch sound sensors were used to test the interior noise inside the vehicle. The installation of the sound sensors is illustrated in Figure 13.
The interior noise test follows the standard of ISO 3381-2021 Railway applications—Acoustics—Noise measurement inside railbound vehicles [27]. The noise limit for subway vehicles in tunnel conditions is 83 dB(A). The vehicle’s interior noise testing was conducted at many measurement points: the end and center of the passenger compartment. Each measurement point was positioned at 1.2 and 1.6 m above the underframe surface. The position was the same as the selected points in the simulation model.
The data acquisition device was the same as the equipment used for the sound pressure level test in Section 2.2. The data acquisition software was B&K Time Data Recorder 21. The data analysis is conducted using Pluse Reflex 21. During the processing of data analysis, the averaging time used was 0.125 s. The frequency bandwidth was 1/3 octave, and the spectral analysis range was set to be 20–20 kHz. The results were processed using A-weighted.
The comparison between the measured noise values and simulated noise values at the interior points of the similar vehicle is listed in Table 2. The measured and simulated noise levels all complied with the recommended thresholds.
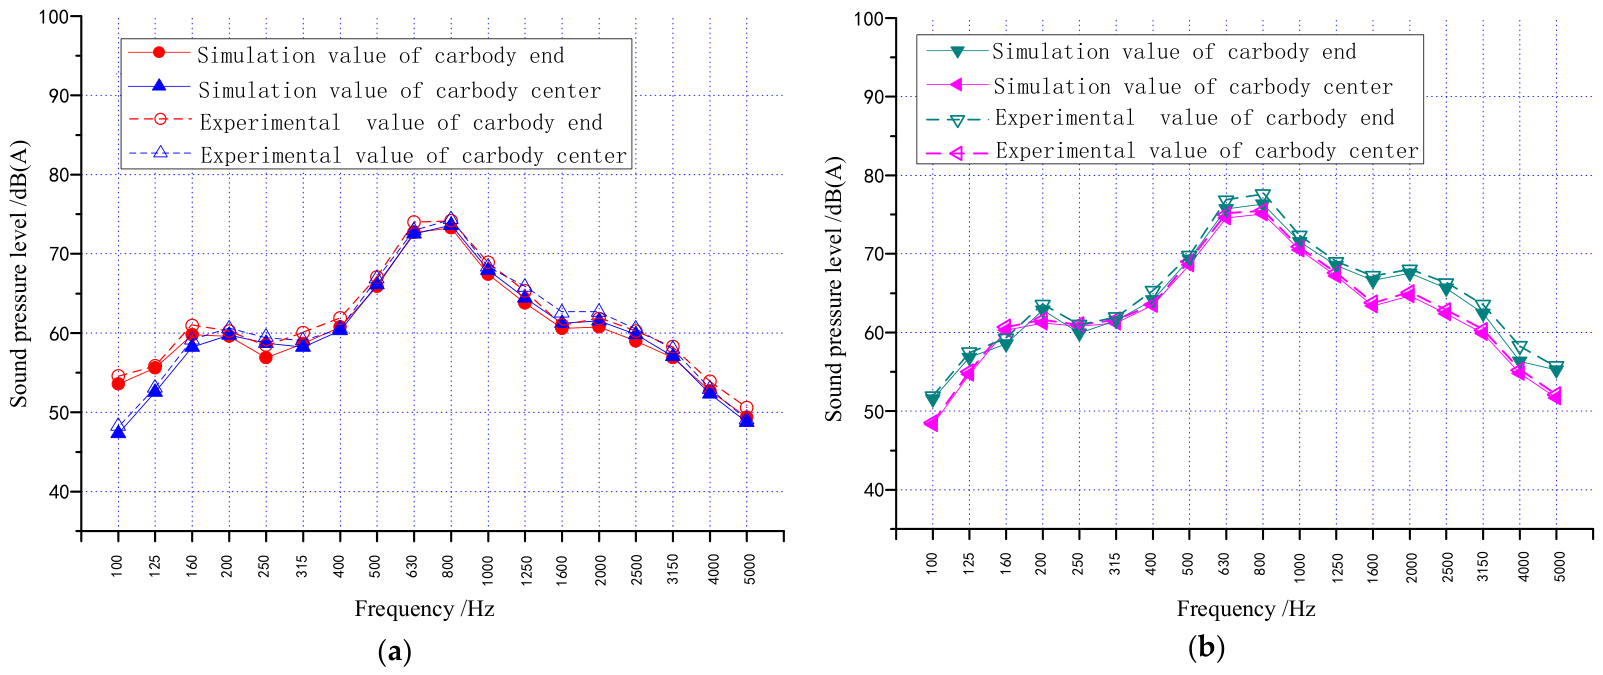
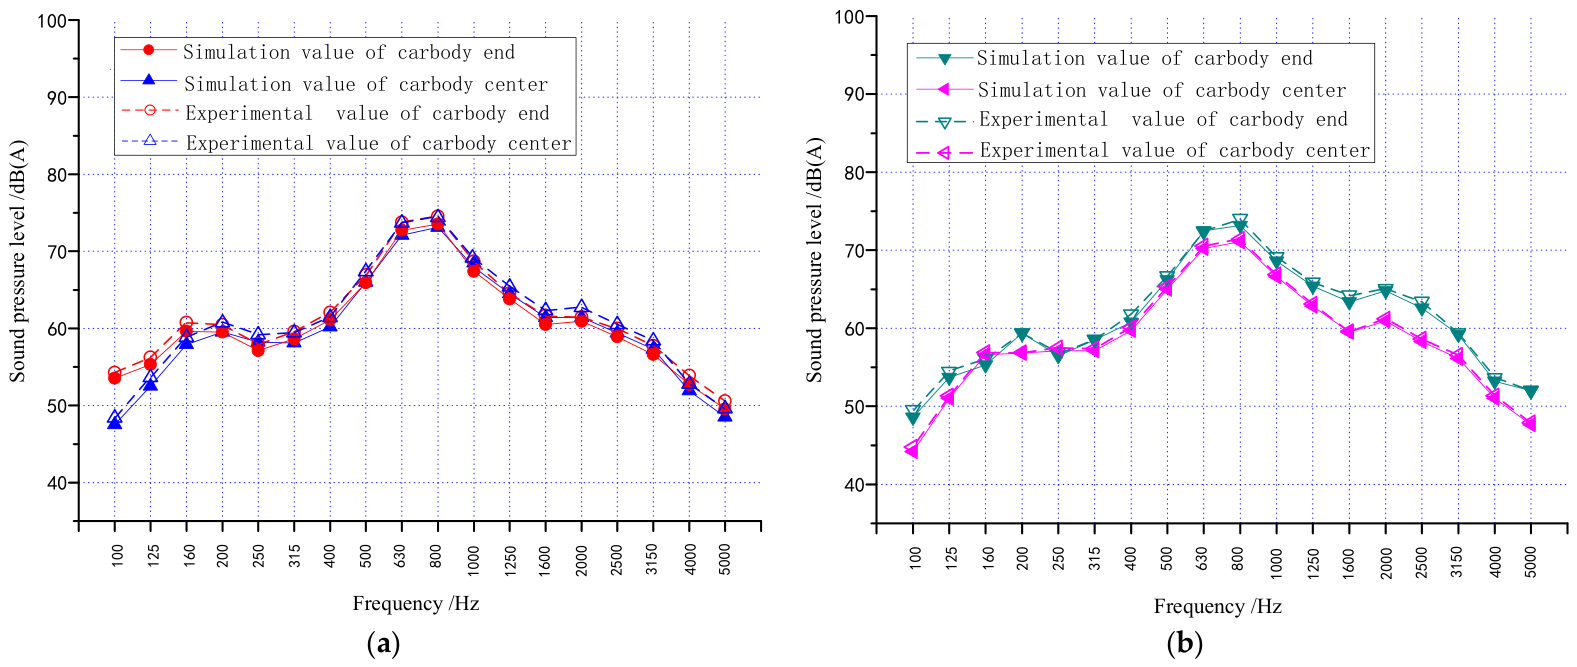
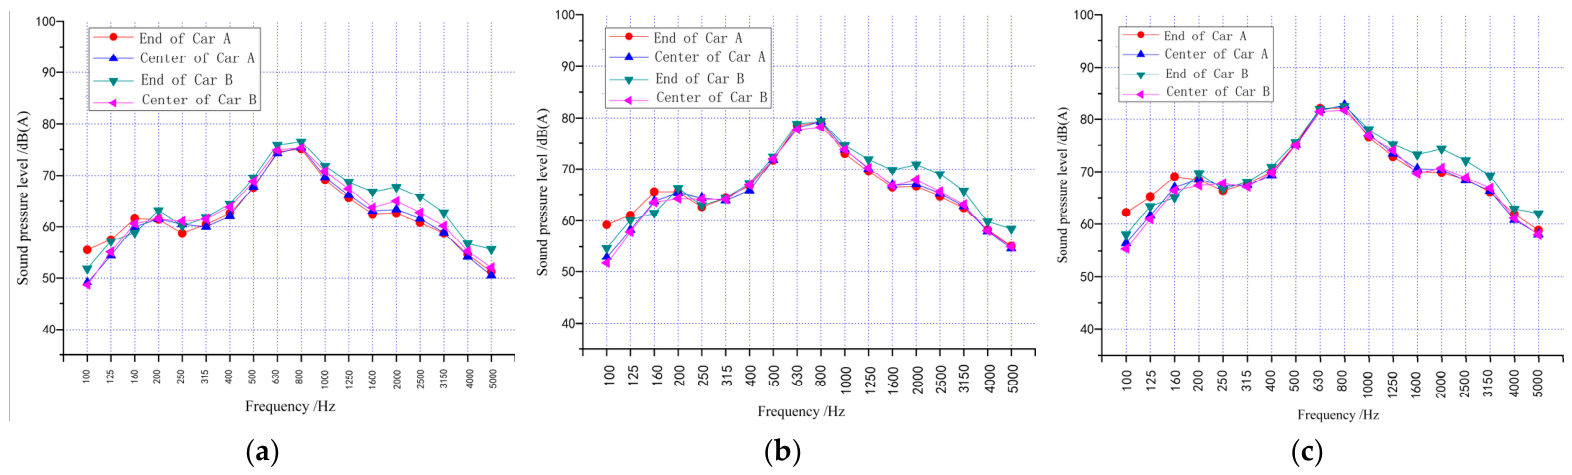
The 1/3-octave band frequency spectrum of experimental and simulated results at 1.2 m inside the carbody were compared, as shown in Figure 14.
The 1/3-octave bands frequency spectrum of experimental and simulated results at 1.6 m inside the carbody were compared, as shown in Figure 15.
Furthermore, to verify the accuracy of the established simulation model, the comparative analysis of measured and simulated results in the 1/3-octave band was carried out. Noticeable deviations are mainly concentrated in the high-frequency ranges. The discrepancies in these frequency bands are primarily attributed to the different roughness of the wheel-rail lines and the air noise sources caused by tunnel reverberation, as well as the influence of actual environmental noise and measurement installation errors in the experimental test. While the trends align closely, demonstrating the reliability of the established simulation model.

4. Vehicle Noise Analysis at Different Service Life

4.1. Analysis of Noise for Different Sound Insulation of Underframe

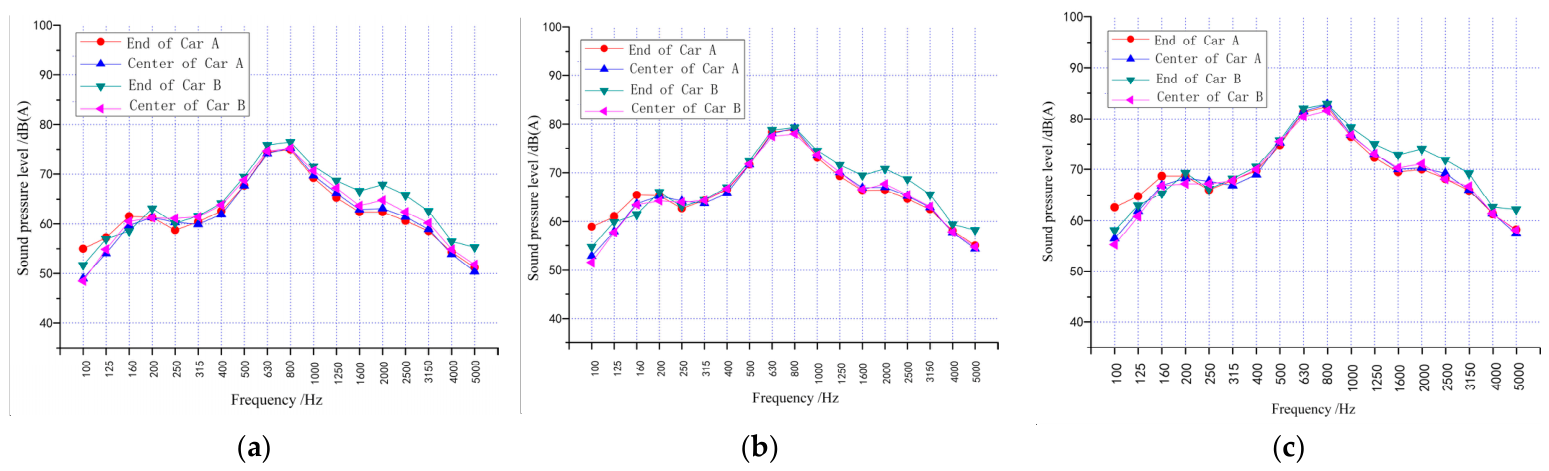
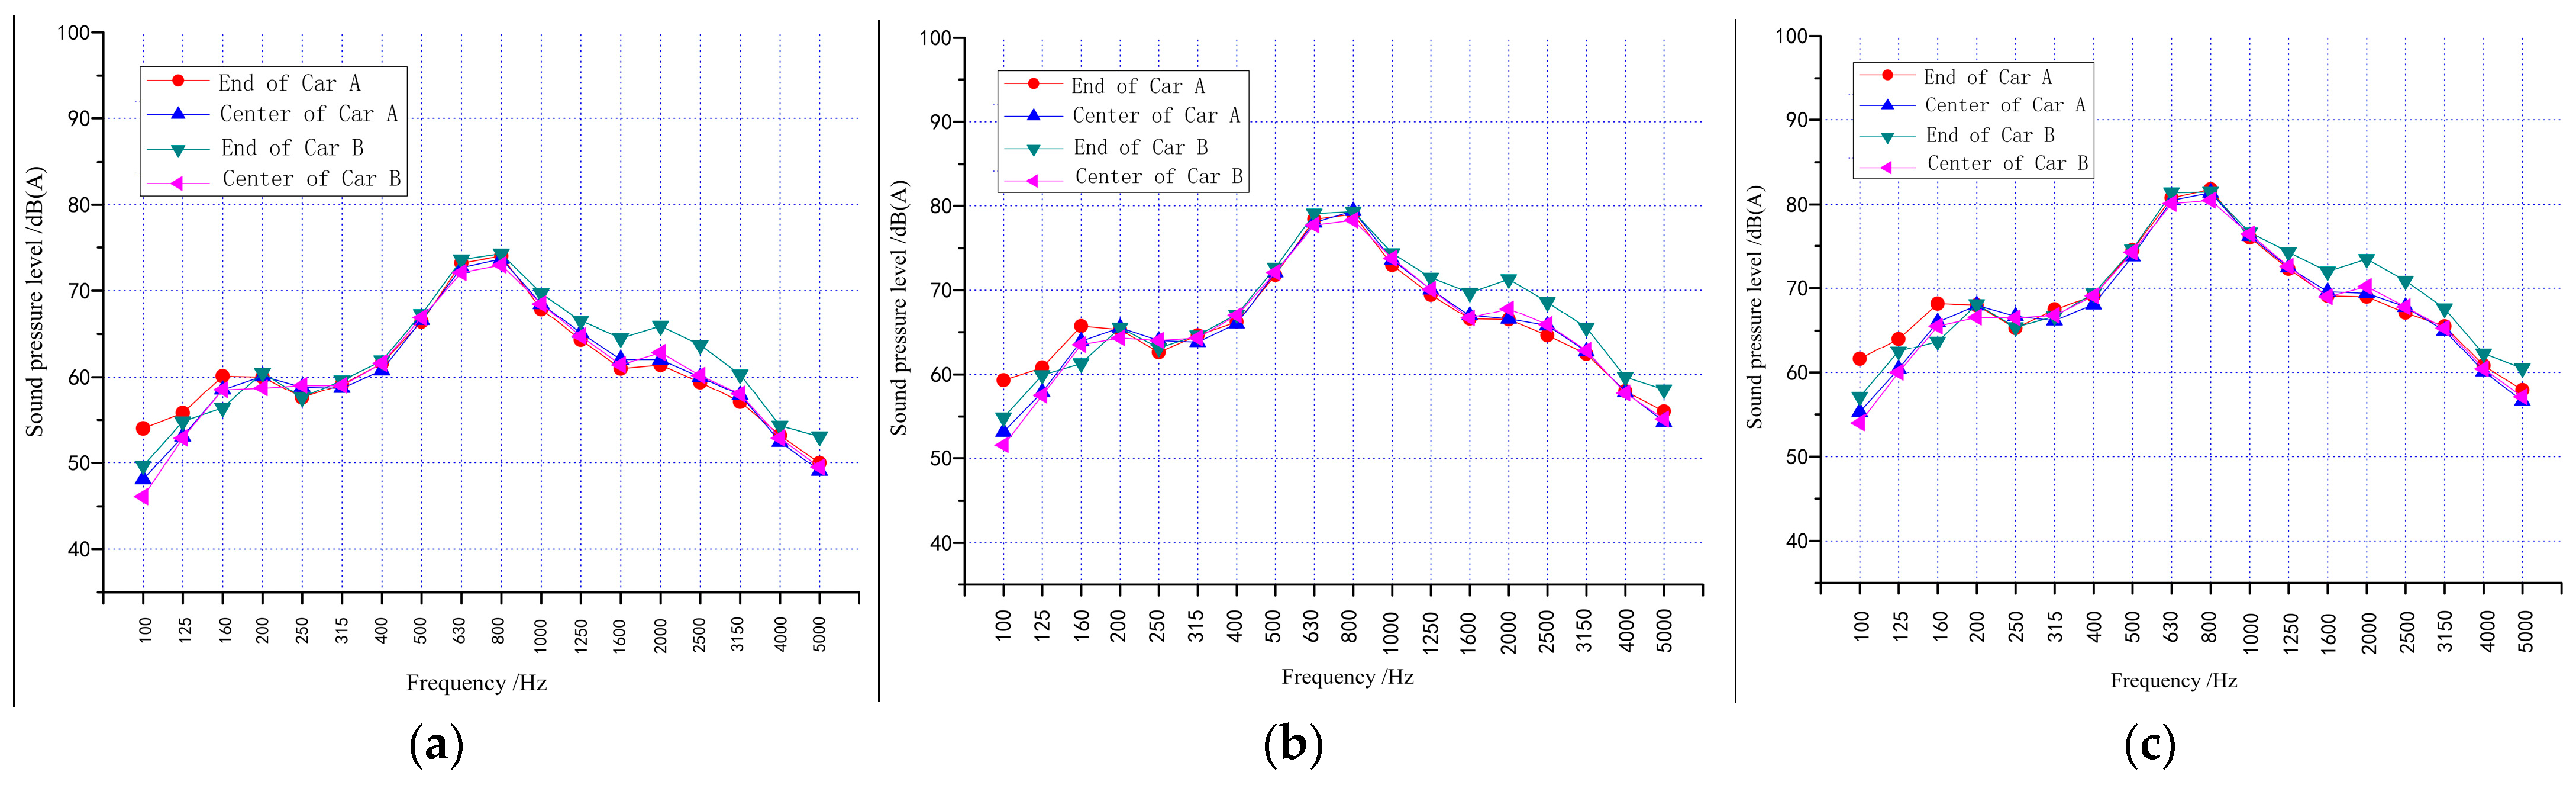
Vehicles with service lives of 6 years, 3 years, and 2 years were analyzed separately. The sound insulation values of the underframe with different service lives were set in the simulation model. Through simulation calculations, the impact of varying sound insulation parameters of underframes on interior noise levels was compared.
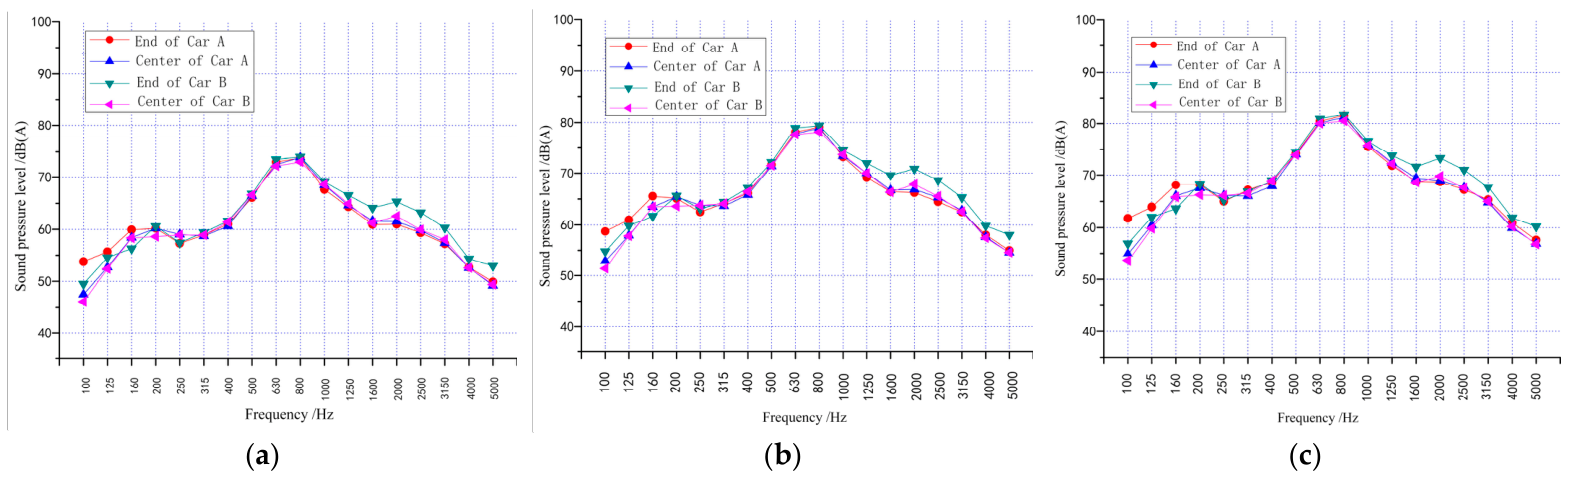
Frequency spectra of sound pressure levels at the 1.2 m point for vehicles with 2, 3, and 6 years of service life under the 80 km/h tunnel condition are shown in Figure 16.
Frequency spectra of sound pressure levels at the 1.6 m point for vehicles with 2, 3, and 6 years of service life under the 80 km/h tunnel condition are shown in Figure 17.
Based on the changes in the frequency spectrum of sound pressure level under different service lives, it can be observed that as the service life increased, the sound insulation of the vehicle’s underframe decreased, leading to a continuous increase in interior noise.
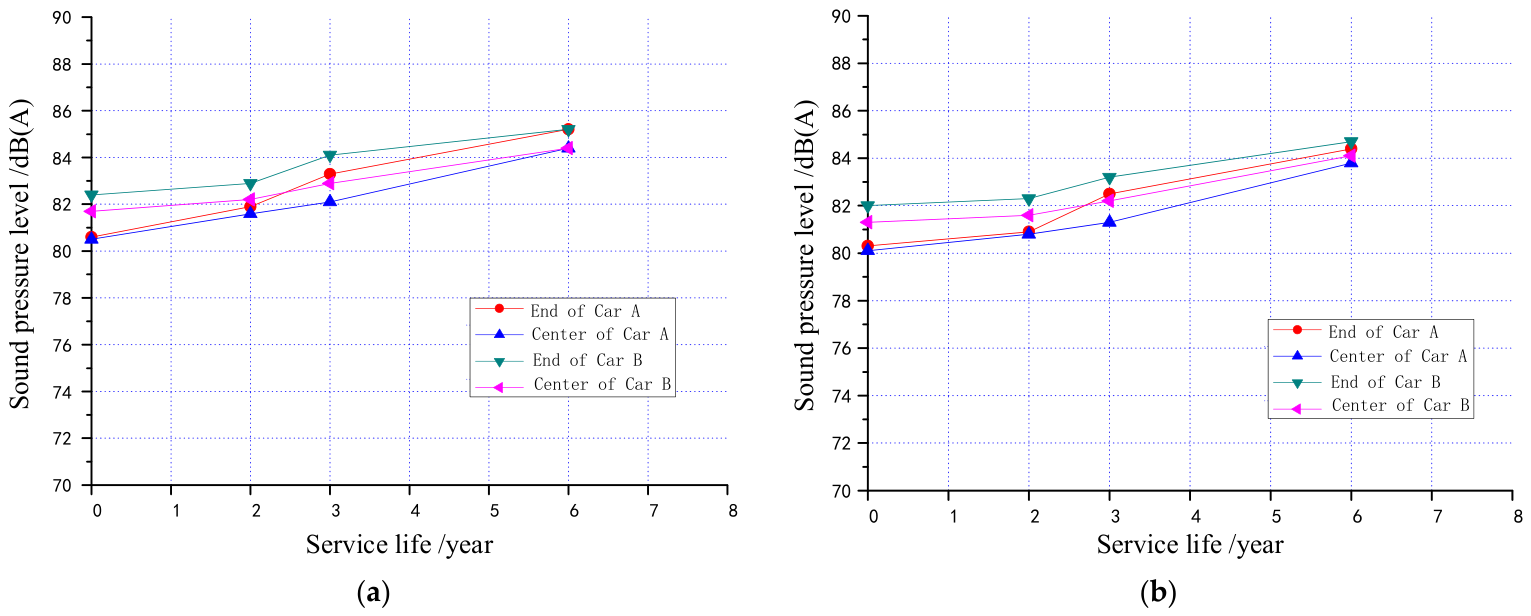
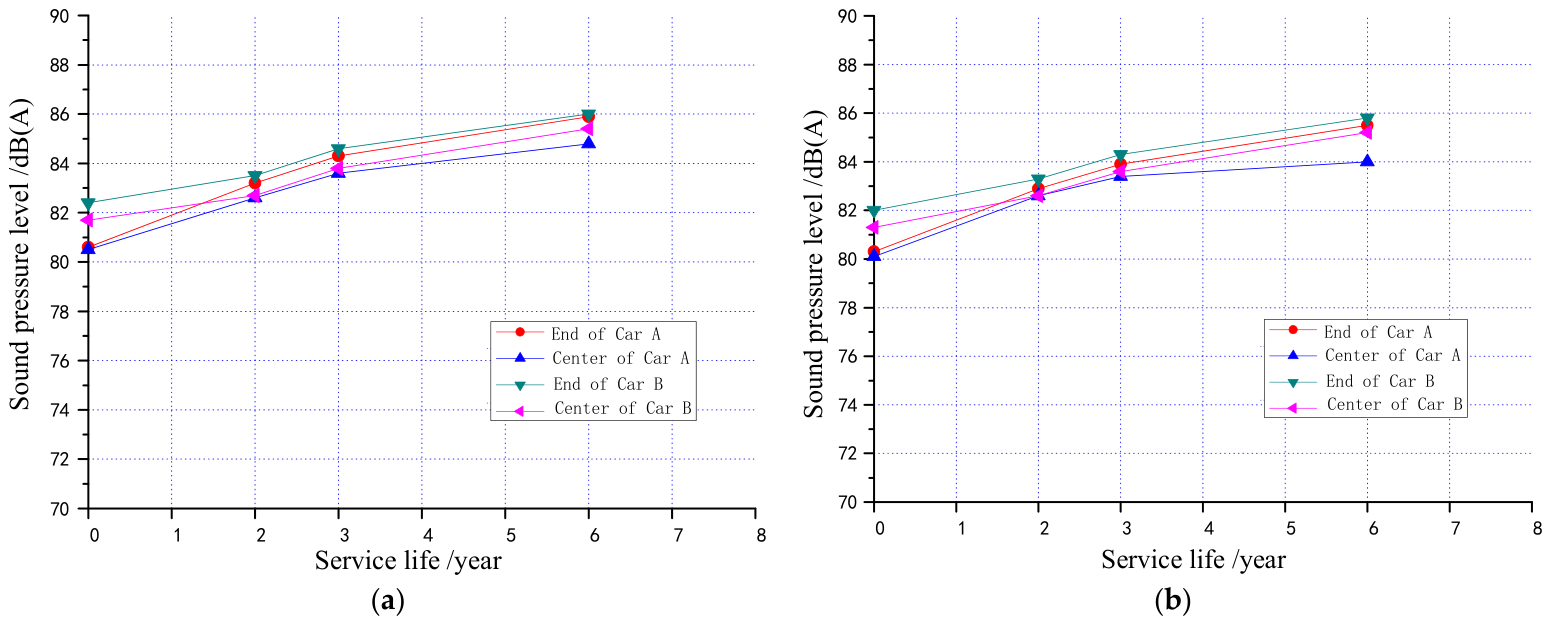
The total noise levels at 1.2 m and 1.6 m points inside vehicles with service lives of 6 years, 3 years, 2 years, and 0 years, respectively, under different sound insulations of the underframe, are shown in Figure 18.
As shown in the figure above, the sound insulation of the underframe decreased with increasing service life, while the total value of sound pressure level inside the vehicle increased. Starting from the second year, the rate of increase in the total value of sound pressure level inside the vehicle gradually accelerated.
The linear regression fitting was conducted on the overall noise at the end of the Car A, resulting in a fitting function for the overall noise value with the variation in side wall sound insulation.
The fitting functions for 1.2 m point and 1.6 m point were expressed, respectively, as follows:
y 1 . 2 m = 0.865 x + 80.65 y 1 . 6 m = 0.831 x + 80.09
where y represented the overall sound pressure level; and x represented the service life.
The goodness-of-fit indicators of the fitting functions for the underframe are listed in Table 3.

4.2. Analysis of Noise for Different Sound Insulation of Door

Vehicles with service lives of 6 years, 3 years, and 2 years were analyzed separately. The sound insulation parameters of doors with different service lives were introduced into the simulation model. Through simulation calculations, the impact of varying sound insulation parameters of doors on interior noise levels was compared.
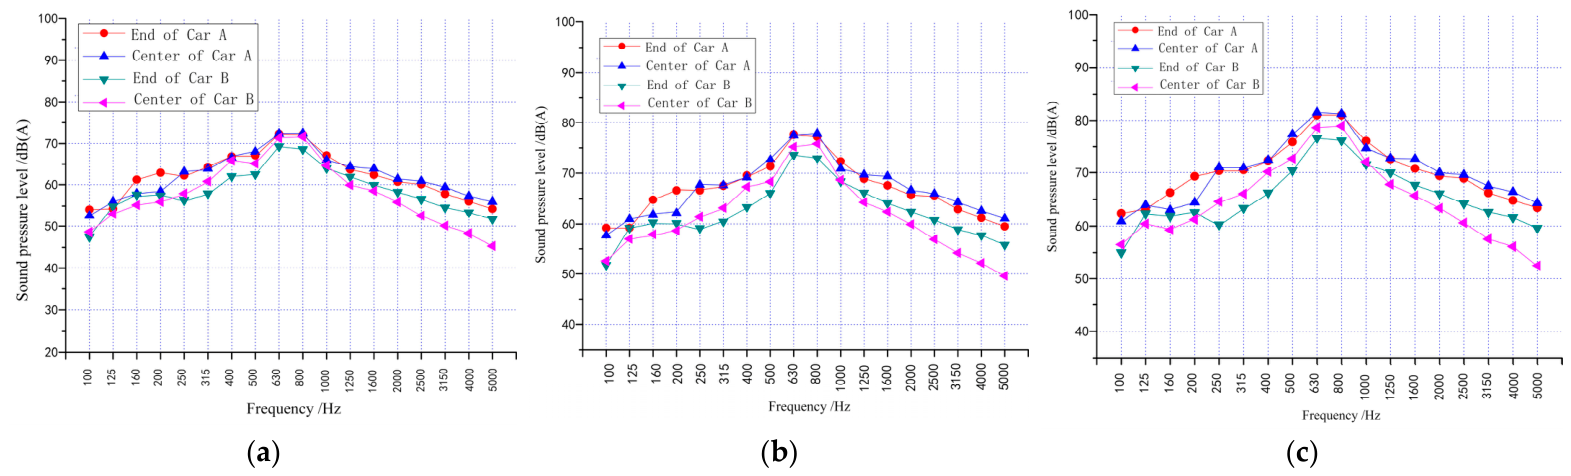
Frequency spectra of sound pressure levels at the 1.2 m point for vehicles with 2, 3, and 6 years of service life under the 80 km/h tunnel condition are shown in Figure 19.
Frequency spectra of sound pressure level at the 1.6 m point for vehicles with 2, 3, and 6 years of service lives under the 80 km/h tunnel condition are shown in Figure 20.
Based on the changes in the frequency spectrum of sound pressure level under different service lives, it can be observed that as the service life increased, the sound insulation of the vehicle’s door decreased, leading to a continuous increase in interior noise.
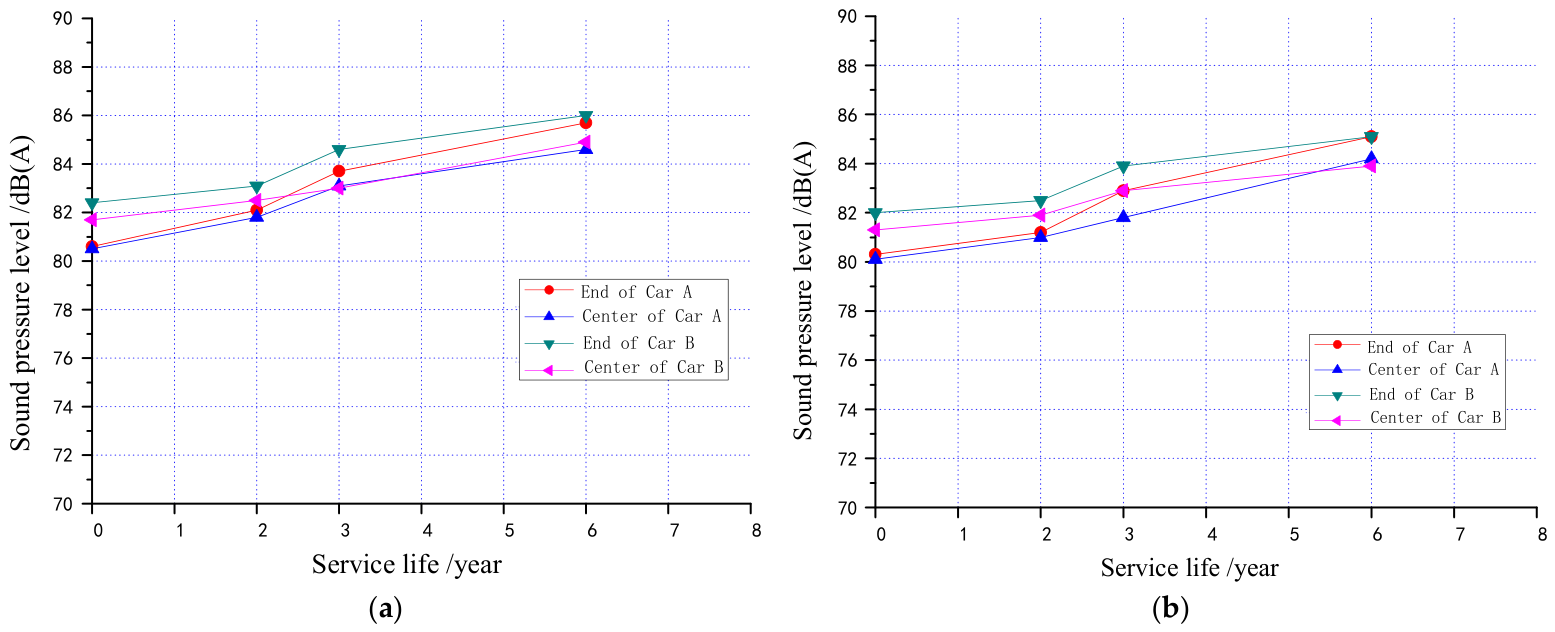
The total noise levels at 1.2 m and 1.6 m points inside vehicles with service lives of 6 years, 3 years, 2 years, and 0 years, respectively, under different sound insulations of the door, are shown in Figure 21.
As shown in the figure above, the sound insulation of the door decreased with increasing service life, and the total value of sound pressure level inside the vehicle continued to rise over a six-year period.
The fitting function for the overall noise value was obtained with the variation in door sound insulation. The fitting functions for the 1.2 m point and 1.6 m point were expressed, respectively, as follows:
y 1 . 2 m = 0.964 x + 81.12 y 1 . 6 m = 0.945 x + 80.83
The goodness-of-fit indicators of the fitting functions for the door are listed in Table 4.

4.3. Analysis of Noise for Different Sound Insulation of Sidewall

Vehicles with service lives of 6 years, 3 years, and 2 years were analyzed separately. The sound insulation parameters of sidewalls with different service lives were introduced into the simulation model. Through simulation calculations, the impact of varying sound insulation parameters of sidewalls on interior noise levels was compared.
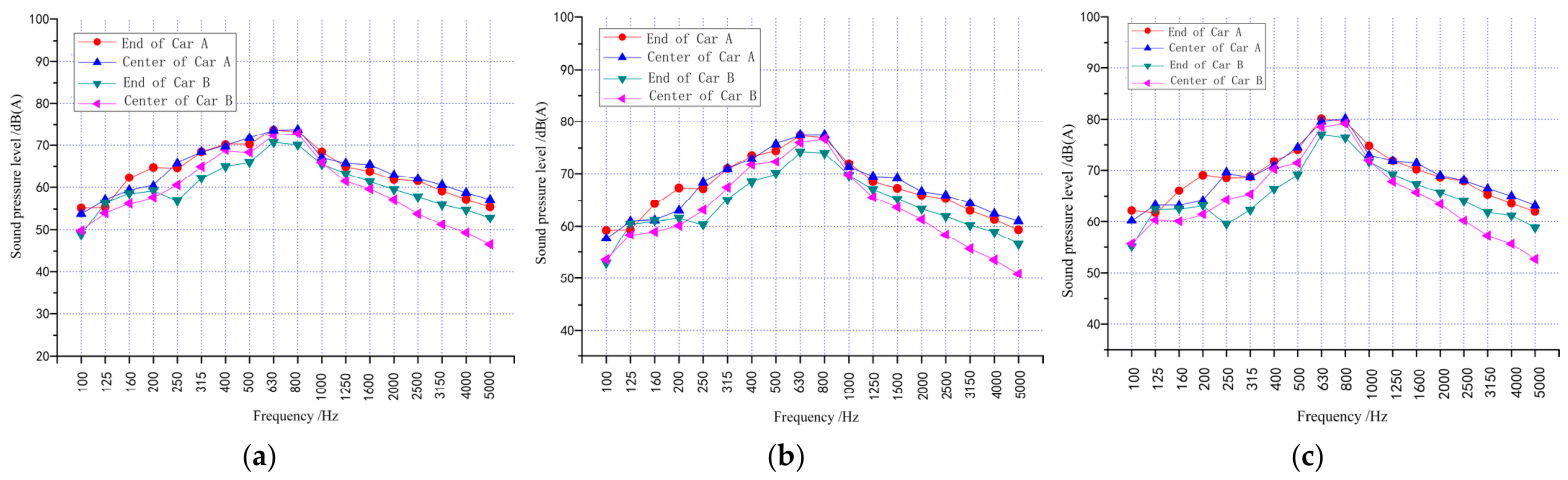
Frequency spectra of sound pressure levels at the 1.2 m point for vehicles with 2, 3, and 6 years of service life under the 80 km/h tunnel condition are shown in Figure 22.
Frequency spectra of sound pressure levels at the 1.6 m point for vehicles with 2, 3, and 6 years of service life under the 80 km/h tunnel condition are shown in Figure 23.
Based on the changes in the frequency spectrum of sound pressure level under different service lives, it can be observed that as the service life increased, the sound insulation of the vehicle’s sidewall decreased, leading to a continuous increase in interior noise.
The total noise levels at 1.2 m and 1.6 m points inside vehicles with service lives of 6 years, 3 years, 2 years, and 0 years, respectively, under different sound insulations of the sidewall, are shown in Figure 24.
As shown in the figures above, the sound insulation of the sidewall decreased with increasing service life. Over a six-year period, the total value of sound pressure level inside the vehicle gradually increased.
The fitting function for the overall noise value was obtained with the variation in sidewall sound insulation. The fitting functions for the 1.2 m point and 1.6 m point were expressed, respectively, as follows:
y 1 . 2 m = 0.781 x + 80.6 y 1 . 6 m = 0.716 x + 80.06
The goodness-of-fit indicators of the fitting functions for the sidewall are listed in Table 5.
By comparing the fitting functions of the side wall, door and underframe, it can be seen that the slope of the door was nearly 1. It indicated that the door had a great impact on the interior noise as sound insulation changed over time. This is because as the door seals wear out, their sealing performance declines. The impact on the vehicle’s underside was less than on the sidewall. Because the reduction in the sound insulation of the underframe was mainly due to structural fatigue. The influence of structural fatigue was relatively minor over a period of 6 years.
The fitting functions established the relationship between service life and the overall sound pressure level inside the vehicle. The prediction of interior noise value as sound insulation changed over time provides reliable guidance for main carbody maintenance. It enables engineers to effectively facilitate timely targeted maintenance and avoid unnecessary over-maintenance. Furthermore, this model supports lifecycle management of vehicle noise. It can track noise degradation in long-term service and help formulate lifecycle maintenance plans, which greatly improves the economic efficiency of railway vehicles.

5. Conclusions

This study systematically investigates the degradation patterns of subway carbody sound insulation performance throughout its entire lifecycle and its impact on interior noise levels. Through experimental testing and simulation modeling, the following key conclusions were obtained:
(1) Degradation patterns of carbody sound insulation performance. Experimental measurements of sound insulation levels in carbody components revealed that as operational mileage increased, the sound insulation performance of primary components, including doors, side walls, and underframes, gradually declined. This variation pattern of the sound insulation of the key components with respect to the operational service lifespan was obtained via experiments. The results were used as parameters for the noise simulation model.
Identifying the degradation patterns of sound insulation could help operators focus their efforts on high-impact components, significantly improving the efficiency of noise control measures. It can also help to optimize inspection intervals.
(2) Development of a simulation model for interior noise analysis. The simulation model replicated a tunnel operation at a constant speed of 80 km/h. The model’s computational accuracy is validated by comparing its results with measurement data. The reliability of the simulation model has been verified. By modifying the sound insulation parameters of the simulation model, the interior noise values under different operational service lifespans were obtained.
The limitations of the SEA method at low frequencies are further elaborated. The SEA model was constrained by its assumptions, which failed to hold at low frequencies. The simulation model in this paper was corrected based on the experimental data, and results were close to the measured values in both spectrum and total value. The simulation model of this paper ensured the simulation accuracy for the entire frequency range. The simulation model provided a reliable basis for operational noise prediction. It enabled accurate forecasting of interior noise level in actual operational conditions. It could be used to detect and address potential noise problems.
(3) Analysis of sound insulation performance’s impact on interior noise. The results of different sound insulation values for the doors, side walls and underframe of the carbody were analyzed. It indicated that reduced sound insulation in doors, side walls, and underframes affected interior noise levels. Deterioration in the sound insulation of the door significantly influenced mid-high frequency noise while having a lesser effect on low-frequency noise. The findings indicate that different structural elements exert significant impacts on different frequency ranges of noise. This differentiation provides clear guidance for targeted noise control design based on the dominant noise frequency in specific conditions. Additionally, the concept of diverse noise transmission pathways, including doors, side walls, and underframes, is integrated to clarify how each pathway contributes to overall noise propagation. Recognizing these pathways enables the practical value of comprehensive control strategies, such as optimizing structural connections and sealing gaps.
For repair planning, the clarification of noise transmission pathways facilitates targeted maintenance strategies: prioritizing the repair of structural components or sealing gaps, thereby optimizing the allocation of maintenance resources.
For future research or practical implementation, limitations of this study need to be considered. Due to the limitations of the current service vehicle age and quantity, the experiment on vehicle sound insulation has been conducted for a period of 6 years. In the future, it will be possible to test the sound insulation levels of vehicle components over a longer service life and to predict the noise levels inside the vehicle for a longer duration. In the future, we can further develop the prediction model for the attenuation of interior noise, which will be beneficial to support maintenance strategy, lifecycle study and design improvement of subway vehicles.

Author Contributions

Conceptualization, J.X., M.P., H.L. and L.S.; methodology, M.P., X.H. and H.L.; software, J.X. and K.Z.; validation, J.X., M.P. and H.L.; formal analysis, H.L. and L.S.; investigation, H.L. and K.Z.; writing—original draft preparation, J.X., M.P., H.L. and L.S.; writing—review and editing, J.X., K.Z. and H.L.; project administration, J.X., L.S. and H.L.; funding acquisition, J.X., X.H. and H.L. All authors have read and agreed to the published version of the manuscript.

Funding

This research was funded by the Hebei Natural Science Foundation (No: E2024105047), and the Talent Fund of Beijing Jiaotong University (No. 2025JBRC011 and No. 2024XKRC061).

Data Availability Statement

The data presented in this study are available.

Acknowledgments

The comments from the reviewers are appreciated as they helped to improve this manuscript.

Conflicts of Interest

Authors Jiankun Xie, Minkai Pan, Kunhao Zhao were employed by CRRC Nanjing Puzhen Co., Ltd. The remaining authors declare that the research was conducted in the absence of any commercial or financial relationships that could be construed as a potential conflict of interest.

References

  1. Liu, X.; Yang, Y.; Le, V. Airborne sound insulation of aluminum extrusion structural walls of an urban rail train. Noise Control. Eng. J. 2014, 62, 47–53. [Google Scholar] [CrossRef] [Scilit]
  2. Kim, T.; Kim, J. Comparison Study of Sound Transmission Loss in High Speed Train. Int. J. Railw. 2011, 4, 19–27. [Google Scholar] [CrossRef] [Scilit]
  3. Wang, R.; Yao, D.; Zhang, J.; Xiao, X.; Jin, X. Effect of the Laying Order of Core Layer Materials on the Sound-Insulation Performance of High-Speed Train Carbody. Materials 2023, 16, 3862. [Google Scholar] [CrossRef] [Scilit]
  4. Xie, S.; Yang, S.; Yang, C. Sound absorption performance of a filled honeycomb composite structure. Appl. Acoust. 2020, 162, 107202. [Google Scholar] [CrossRef] [Scilit]
  5. Chen, J.H.; Liu, P.S.; Sun, J.X. Sound absorption performance of a lightweight ceramic foam. Ceram. Int. 2020, 46, 22699–22708. [Google Scholar] [CrossRef] [Scilit]
  6. Li, Y.; Zhang, Y.; Wang, R.; Tang, Z. Acoustic and vibration characteristics of finite-sized corrugated–core sandwich plate under flow-induced vibration. Wave Motion 2024, 130, 103376. [Google Scholar] [CrossRef] [Scilit]
  7. Song, C.; Wang, X.; Xu, S.; Zhao, C.; Huang, Z. Inverse design of laminated plate-type acoustic metamaterials for sound insulation based on deep learning. Appl. Acoust. 2024, 218, 109906. [Google Scholar] [CrossRef] [Scilit]
  8. Kuo, Y.; Lin, H.; Wang, C. Sound transmission across orthotropic laminates with a 3D model. Appl. Acoust. 2008, 69, 951–959. [Google Scholar] [CrossRef] [Scilit]
  9. Villot, M.; Guigou, C.; Gagliardini, L. Predicting the acoustical radiation of finite size multi-layered structures by applying spatial windowing on infinite structures. J. Sound Vib. 2001, 245, 433–455. [Google Scholar] [CrossRef] [Scilit]
  10. Coyette, J.; Cremers, L. Comparative study of boundary element and finite element formulations for evaluating sound radiation from plates. In Proceedings of the Fifth International Congress on Sound and Vibration, Adelaide, Australia, 15–18 December 1997. [Google Scholar]
  11. Yang, Y.; Kingan, M. A hybrid wave and finite element/boundary element method for predicting the vibroacoustic characteristics of finite–width complex structures. J. Sound Vib. 2024, 582, 118402. [Google Scholar] [CrossRef] [Scilit]
  12. Xin, F.X.; Lu, T.J. Effects of core topology on sound insulation performance of lightweight all-metallic sandwich panels. Adv. Manuf. Process. 2011, 26, 1213–1221. [Google Scholar] [CrossRef] [Scilit]
  13. Usacheva, I.A.; V’yushkina, I.A.; Korotin, P.I.; Salin, M.B. Investigation of Sound Reflection and Transmission through an Elastic Layer with Inclusions Using the Finite Element Method. Acoust. Phys. 2025, 71, 180–189. [Google Scholar] [CrossRef] [Scilit]
  14. Elwin, V.W. The boundary element method for acoustic transmission with nonconforming grids. J. Comput. Appl. Math. 2024, 445, 115838. [Google Scholar] [CrossRef] [Scilit]
  15. Gupta, P.; Parey, A. Prediction of sound transmission loss of hemispherical shell using statistical energy analysis and its experimental validation. Measurement 2022, 204, 112089. [Google Scholar] [CrossRef] [Scilit]
  16. Griffin, D.J. Impact sound insulation predictions for light weight floors: Potential modal response of the floor and its effect on impedance. J. Acoust. Soc. Am. 2011, 129, 61–67. [Google Scholar] [CrossRef] [Scilit]
  17. Westerberg, G. On the sealing of circular holes in a thick wall for the purpose of sound insulation. Appl. Acoust. 1971, 4, 115–129. [Google Scholar] [CrossRef] [Scilit]
  18. Hongisto, V. Sound insulation of doors—part 1: Prediction models for structural and leak transmission. J. Sound Vib. 2000, 230, 133–148. [Google Scholar] [CrossRef] [Scilit]
  19. Hongisto, V.; Keranen, J.; Lindgren, M. Sound insulation of doors—part 2: Comparison between measurement results and predictions. J. Sound Vib. 2000, 230, 149–170. [Google Scholar] [CrossRef] [Scilit]
  20. Qi, L. Transmission loss of vehicle seals. Engineering 2008, 230, 149–170. [Google Scholar]
  21. Andro, B.; Sebastien Diallo, A.; Mermet, M. Prediction of sound transmission through automotive door seal systems. J. Acoust. Soc. Am. 2008, 123, 3534. [Google Scholar] [CrossRef] [Scilit]
  22. Buratti, C.; Moretti, E.; Vergoni, M. Sound Insulation Performances of Windows: Evaluation of The Influence of Different Traffic Noise Spectra in Laboratory and Field Measurement. In Proceedings of the 17th International Congress on Sound and Vibration, Cairo, Egypt, 18–22 July 2010. [Google Scholar]
  23. Dong, J.; Ma, F.; Gu, C.; Hao, Y. Highly Efficient Robust Optimization Design Method for Improving Automotive Acoustic Package Performance. SAE Int. J. Veh. Dyn. Stab. NVH 2020, 4, 291–304. [Google Scholar] [CrossRef] [Scilit]
  24. Zhang, Z.; Ye, R.; Ji, M.; Zhu, G. A convergence formula for sound transmission loss of composite laminates based on three different shear deformation theories. Acta Acust. 2025, 9, 1. [Google Scholar] [CrossRef] [Scilit]
  25. Misono, L.; Muto, K. Frequency characteristics of the a-weighted sound pressure level of robust cicada climax sound. Acoust. Sci. Technol. 2024, 45, 289–292. [Google Scholar] [CrossRef] [Scilit]
  26. Sturm, S.; Salgado, C.; Via, M.; Sanmiguel, I. Auditory self-generation effects depend on sound intensity both at the neural and perceptual level. Int. J. Psychophysiol. 2025, 213, 112635. [Google Scholar] [CrossRef] [Scilit]
  27. ISO 3381:2021; Railway Applications—Acoustics—Noise Measurement Inside Railbound Vehicles. International Organization for Standardization: Geneva, Switzerland, 2021.
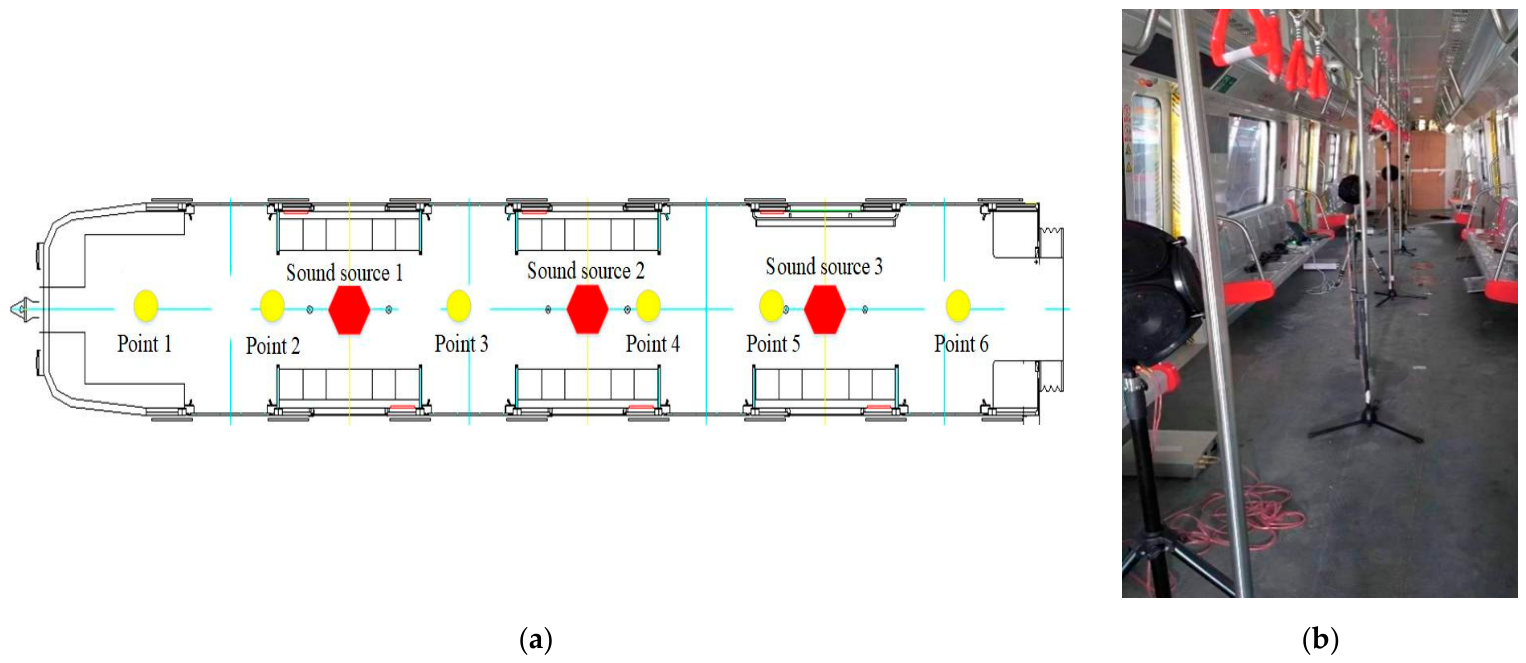
Figure 1. Distribution of sound sources and sound sensors: (a) sound source and measuring point’s layout; (b) testing layout inside the vehicle. The blue and yellow lines are the symmetrical centerlines of the car body structures. Red hexagons are positions of spherical sound source, and yellow circles are sound pressure measurement points.
Vehicles 08 00125 g001
Figure 2. Sound insulation test process on the carbody: (a) sound insulation test area of the underframe; (b) sound insulation test area of the side wall and door. The arrow indicates the movement sequence of probe’s test position.
Vehicles 08 00125 g002
Figure 3. Frequency spectrum diagram of sound pressure level in 1/3 octave bands.
Vehicles 08 00125 g003
Figure 4. Cloud map of sound power level at each measuring point: (a) underframe; (b) side wall; (c) door.
Vehicles 08 00125 g004
Figure 5. Calculation curve of weighted sound insulation in 3 years of service life: (a) underframe; (b) side wall; (c) door.
Vehicles 08 00125 g005
Figure 6. Calculation curve of weighted sound insulation in 6 years of service life: (a) underframe; (b) side wall; (c) door.
Vehicles 08 00125 g006
Figure 7. Calculation curve of weighted sound insulation in 2 years of service life: (a) underframe; (b) side wall; (c) door.
Vehicles 08 00125 g007
Figure 8. Structural modeling of train. The different colors represent the different structural components of the car body.
Vehicles 08 00125 g008
Figure 9. SEA simulation model of subway vehicle.
Vehicles 08 00125 g009
Figure 10. Simulation model of a subway vehicle under tunnel condition.
Vehicles 08 00125 g010
Figure 11. Noise simulation result of a subway vehicle running at the speed of 80 km/h under tunnel condition.
Vehicles 08 00125 g011
Figure 12. Layout of interior noise measurement points: (a) Car A; (b) Car B. The points 1–6 are the locations of measurement points; The blue and yellow lines are the symmetrical centerlines of the car body structures.
Vehicles 08 00125 g012
Figure 13. Layout of interior sound sensors: (a) At 1.2 m inside the vehicle; (b) At 1.6 m inside the vehicle.
Vehicles 08 00125 g013
Figure 14. Frequency spectrum comparisons between simulation and experimental noise results at 1.2 m: (a) Car A; (b) Car B.
Vehicles 08 00125 g014
Figure 15. Frequency spectrum comparisons between simulation and experimental noise results at 1.6 m: (a) Car A; (b) Car B.
Vehicles 08 00125 g015
Figure 16. Frequency spectrum at 1.2 m with different sound insulation of the underframe: (a) service life of 2 years; (b) service life of 3 years; (c) service life of 6 years.
Vehicles 08 00125 g016
Figure 17. Frequency spectrum at 1.6 m with different sound insulation of the underframe: (a) service life of 2 years; (b) service life of 3 years; (c) service life of 6 years.
Vehicles 08 00125 g017
Figure 18. Total value of sound pressure level for different sound insulation of the underframe: (a) at 1.2 m point inside the vehicle; (b) at 1.6 m point inside the vehicle.
Vehicles 08 00125 g018
Figure 19. Frequency spectrum at 1.2 m with different sound insulation of the door: (a) service life of 2 years; (b) service life of 3 years; (c) service life of 6 years.
Vehicles 08 00125 g019
Figure 20. Frequency spectrum at 1.6 m with different sound insulation of the door: (a) service life of 2 years; (b) service life of 3 years; (c) service life of 6 years.
Vehicles 08 00125 g020
Figure 21. Total value of sound pressure level for different sound insulations of the door: (a) at 1.2 m point inside the vehicle; (b) at 1.6 m point inside the vehicle.
Vehicles 08 00125 g021
Figure 22. Frequency spectrum at 1.2 m with different sound insulations of the sidewall: (a) service life of 2 years; (b) service life of 3 years; (c) service life of 6 years.
Vehicles 08 00125 g022
Figure 23. Frequency spectrum at 1.6 m with different sound insulations of the sidewall: (a) service life of 2 years; (b) service life of 3 years; (c) service life of 6 years.
Vehicles 08 00125 g023
Figure 24. Total value of sound pressure level for different sound insulations of the sidewall: (a) at 1.2 m point inside the vehicle; (b) at 1.6 m point inside the vehicle.
Vehicles 08 00125 g024
Table 1. Noise inside the vehicle at the speed of 80 km/h (dB(A)).
PositionCar ACar B
EndCenterEndCenter
1.2 m sound pressure level LpA/dB(A)81.480.582.481.7
1.6 m sound pressure level LpA/dB(A)80.980.181.981.3
Table 2. Comparison between simulation and experimental noise values.
1.2 m at the Center of the Vehicle1.2 m at the End of the Vehicle1.6 m at the Center of the Vehicle1.6 m at the End of the Vehicle
Experimental value in Car A 81.0 dB(A)81.8 dB(A)80.9 dB(A)81.5 dB(A)
Simulation value in Car A80.5 dB(A)81.4 dB(A)80.1 dB(A)80.9 dB(A)
Error in Car A0.5 dB(A)0.4 dB(A)0.8 dB(A)0.6 dB(A)
Experimental value in Car B 81.9 dB(A)82.5 dB(A)81.6 dB(A)82.1 dB(A)
Simulation value in Car B81.7 dB(A)82.4 dB(A)81.3 dB(A)81.9 dB(A)
Error in Car B0.2 dB(A)0.1 dB(A)0.3 dB(A)0.2 dB(A)
Data indicated that overall noise simulation results were slightly lower than experimental results, but the difference was less than 1 dB(A), falling within the permissible error range for calibration verification.
Table 3. The goodness-of-fit indicators of the fitting functions for underframe.
Pearson’s r CoefficientR2 CoefficientAdjusted R2 Coefficient
1.2 m 0.9910.9830.974
1.6 m0.9750.9510.927
Table 4. The goodness-of-fit indicators of the fitting functions for the door.
Pearson’s r CoefficientR2 CoefficientAdjusted R2 Coefficient
1.2 m 0.9690.9390.909
1.6 m0.9630.9300.9
Table 5. The goodness-of-fit indicators of the fitting functions for the sidewall.
Pearson’s r CoefficientR2 CoefficientAdjusted R2 Coefficient
1.2 m 0.9890.9790.968
1.6 m0.9830.9660.95
Disclaimer/Publisher’s Note: The statements, opinions and data contained in all publications are solely those of the individual author(s) and contributor(s) and not of MDPI and/or the editor(s). MDPI and/or the editor(s) disclaim responsibility for any injury to people or property resulting from any ideas, methods, instructions or products referred to in the content.