Article

Unsupervised Domain Adaptation with Multimodal Fusion for Monocular 3D Object Detection

1
Xiamen King Long United Automotive Industry Co., Ltd., Xiamen 361023, China
2
Pen-Tung Sah Institute of Micro-Nano Science and Technology, Xiamen University, Xiamen 361102, China
3
School of Artificial Intelligence, Quanzhou Vocational College of Economics and Business, Quanzhou 362000, China
*
Author to whom correspondence should be addressed.
Vehicles 2026, 8(5), 98; https://doi.org/10.3390/vehicles8050098
Submission received: 7 March 2026 / Revised: 22 April 2026 / Accepted: 25 April 2026 / Published: 1 May 2026
(This article belongs to the Section Intelligent and Connected Mobility)

Abstract

This paper presents UM3D, an end-to-end unsupervised domain adaptation framework for monocular 3D object detection. Monocular 3D object detection is appealing due to its low cost, yet it suffers from limited depth cues and poor cross-domain generalization when labeled data are scarce. Existing Pseudo-LiDAR methods require supervised training and propagate depth estimation errors to downstream detection, while current unsupervised domain adaptation (UDA) approaches exploit only a single modality and lack effective pseudo-label quality control. UM3D addresses these limitations through two key designs: (1) a quality-aware pseudo-label generation strategy with object-level random scaling and a memory bank refinement mechanism; and (2) an end-to-end differentiable pipeline that integrates multimodal fusion of image and Pseudo-LiDAR features with a multi-network consistency loss, which jointly optimizes depth estimation and 3D detection via backpropagation. Notably, the entire pipeline requires only a single monocular camera at inference; the Pseudo-LiDAR representation is generated internally from the same image, and thus the multimodal fusion integrates image and Pseudo-LiDAR features without requiring additional sensors. Extensive experiments across KITTI, nuScenes, Waymo, and Lyft demonstrate that UM3D generally outperforms existing UDA methods. In particular, a 19.30% relative AP BEV improvement is achieved under easy conditions through end-to-end joint training compared to independent depth estimation, and up to 76.81% of the domain gap is closed on the WOD → KITTI benchmark.

1. Introduction

In autonomous driving systems, accurate 3D object detection is essential for vehicle safety, intelligent decision-making, and path planning [1,2]. Although LiDAR [3] provides precise depth information, its high cost and sparse point clouds limit its application in large-scale scenarios. Similarly, stereo or multi-view vision systems [4,5,6] recover depth using multi-view geometric relationships but involve higher system complexity and computational costs. In contrast, monocular 3D object detection relies solely on a single camera, offering significant advantages in terms of cost-effectiveness and ease of deployment [7], making it a promising research direction. However, recovering dense and accurate 3D information from a single 2D image is an inherently ill-posed problem due to the loss of depth information. Achieving robust and reliable 3D perception in the absence of direct depth measurements remains the central challenge in this field.
Recent rapid advances in deep learning have created new opportunities for monocular 3D object detection. The emergence of Convolutional Neural Networks (CNNs) made direct feature learning from images possible, significantly advancing the field. Some methods attempt to leverage mature 2D object detectors to obtain 2D bounding boxes in images, then estimate 3D object properties based on this 2D information [7,8,9]. However, this two-stage approach heavily depends on the accuracy of 2D detection and struggles to achieve end-to-end optimization. More recent approaches enhance monocular 3D detection by integrating learned depth representations into the detection pipeline [10,11,12]. To address the geometric information deficiency inherent in monocular images, and to leverage the mature algorithms developed for LiDAR-based 3D object detection, the Pseudo-LiDAR approach [13,14,15,16] has emerged as a powerful paradigm. These methods convert depth maps from monocular depth estimation networks into Pseudo-LiDAR point clouds, then directly employ existing point cloud detectors. This approach provides a new paradigm for monocular 3D object detection, enabling the use of existing point cloud processing algorithms. Building upon this foundation, Qian et al. [17] proposed an end-to-end Pseudo-LiDAR framework (E2E-PL) that integrates depth estimation and point cloud detection into a backpropagation-compatible unified system. Furthermore, Zhou et al. [18] introduced RSANet, a self-supervised monocular absolute depth estimation network that eliminates the need for ground truth depth supervision. However, this depth-to-Pseudo-LiDAR conversion introduces challenges: errors in the estimated depth inevitably propagate to the pseudo-point clouds, and the reliance on large-scale annotated data limits real-world applicability. Effectively addressing these challenges, particularly reducing dependence on annotated data, has become a research focus in this field.
To overcome data annotation bottlenecks and enhance model generalization in real-world scenarios, Unsupervised Domain Adaptation (UDA) [19,20] has attracted growing interest in 3D object detection. Some UDA methods focus on reducing feature distribution differences between source and target domains through adversarial alignment [21,22,23]. Others adopt self-training strategies, generating pseudo-labels in the target domain for model fine-tuning [24,25,26,27]. However, many existing methods either focus solely on a single modality, such as Pseudo-LiDAR point clouds or images, or lack effective quality control for pseudo-labels, resulting in insufficient information utilization or noise introduction that affects final detection performance. In particular, adapting monocular 3D detectors across driving environments without target-domain 3D annotations or LiDAR hardware, while retaining the 3D geometric advantages of Pseudo-LiDAR representations, remains an open problem.
Our main contributions are as follows:
  • We propose a quality-aware pseudo-label generation strategy that combines an object-level random scaling strategy to mitigate cross-domain object-size bias with a three-interval memory bank using IoU-based scoring to iteratively refine pseudo-labels in the target domain.
  • We construct UM3D, an end-to-end unsupervised domain adaptation framework that unifies self-supervised depth estimation, Pseudo-LiDAR generation with density-based interval sampling, quality-aware pseudo-label generation, and multimodal fusion-based 3D detection into a single differentiable pipeline, jointly optimized through a multi-network consistency loss. The entire pipeline requires only a single monocular camera at inference, as the Pseudo-LiDAR representation is derived from the same input image rather than from an additional sensor.

2. Related Works

2.1. Supervised Learning-Based Monocular 3D Object Detection

Due to the lack of direct depth information, early deep learning-based monocular 3D object detection methods primarily relied on supervised learning. Some approaches utilized results from 2D object detectors to assist with 3D object detection [7,8,9]. While these methods benefited from mature 2D object detection technology, their performance was severely limited by 2D detection accuracy and they struggled with end-to-end joint optimization. Unlike 2D detection-based methods, Pseudo-LiDAR approaches [13] convert depth maps from monocular depth estimation networks into Pseudo-LiDAR point clouds, then employ LiDAR-based 3D object detectors. Subsequent research [12,28,29] continued to advance monocular 3D detection through diverse depth-aware feature representation strategies. Qian et al. [17] proposed an end-to-end Pseudo-LiDAR framework that integrates depth estimation and point cloud detection into a backpropagation-compatible pipeline, reducing discrepancies between depth estimation and point cloud detection. Li et al. [30] introduced LoGoNet, achieving accurate 3D object detection through local-to-global cross-modal fusion of LiDAR and camera features. Additionally, some researchers attempted to avoid intermediate steps by extracting 3D features directly from images for 3D object detection [31,32]. These approaches eliminate intermediate step errors but impose higher requirements on network structure design. Although supervised learning-based methods have achieved significant performance improvements, their effectiveness remains constrained by Pseudo-LiDAR point cloud quality, and most methods still depend on large-scale annotated datasets.

2.2. Unsupervised Learning-Based Monocular 3D Object Detection

To reduce dependence on annotated data, unsupervised learning-based monocular 3D object detection methods, especially unsupervised domain adaptation methods, have received increasing attention in recent years. Unsupervised domain adaptation aims to transfer models trained on labeled source domains, such as synthetic datasets or easily annotated scenarios, to unlabeled target domains [19,20]. In monocular 3D object detection, this typically means transferring models trained on one dataset to another dataset, or from simulated environments to real-world environments.
Some methods attempt to reduce feature distribution differences between source and target domains through adversarial learning. These methods introduce a domain discriminator to distinguish features from source and target domains, and train feature extractors to deceive the domain discriminator, thereby reducing feature distribution differences between domains. For example, Zhang et al. [21] proposed an adversarial learning-based domain adaptation framework for 3D object detection. In contrast, our UM3D does not employ adversarial components; it instead falls within the self-training paradigm described next, with a focus on pseudo-label quality control. Another category of methods focuses on utilizing self-training strategies, fine-tuning models by generating pseudo-labels in the target domain. ST3D [25] proposed a self-training method that learns feature representations using unlabeled source domain data and applies this representation to label transfer in the target domain. Li et al. [26] proposed using instance-aware proxy generation for cross-domain 3D detection. DALI [27] leverages pseudo label denoising at distribution and instance levels to achieve unsupervised domain adaptation. Wozniak et al. [23] proposed using adversarial feature alignment for domain adaptation. Tsai et al. [24] further extended adversarial/self-training paradigms through an ensemble-of-experts framework for multi-source domain adaptation, aggregating predictions across multiple source-domain detectors via Kernel-Density-Estimation Box Fusion. However, the quality of pseudo-labels generated by these methods varies significantly, and unreliable pseudo-labels can harm model training. Addressing this issue, other pseudo-label-based methods [33,34,35] improve model performance in target domains by iteratively generating and optimizing pseudo-labels, such as [35] which proposed a pseudo-label refinement framework to enhance pseudo-label reliability by removing or replacing unreliable pseudo 3D boxes.
Despite this progress, existing UDA methods for monocular 3D detection either require real LiDAR input or forgo the geometric advantages of Pseudo-LiDAR representations, and generally lack robust pseudo-label quality control under domain shift. Table 1 summarises representative monocular 3D detection methods along the supervised and UDA lines, contrasting their key advantages and limitations.

3. Method

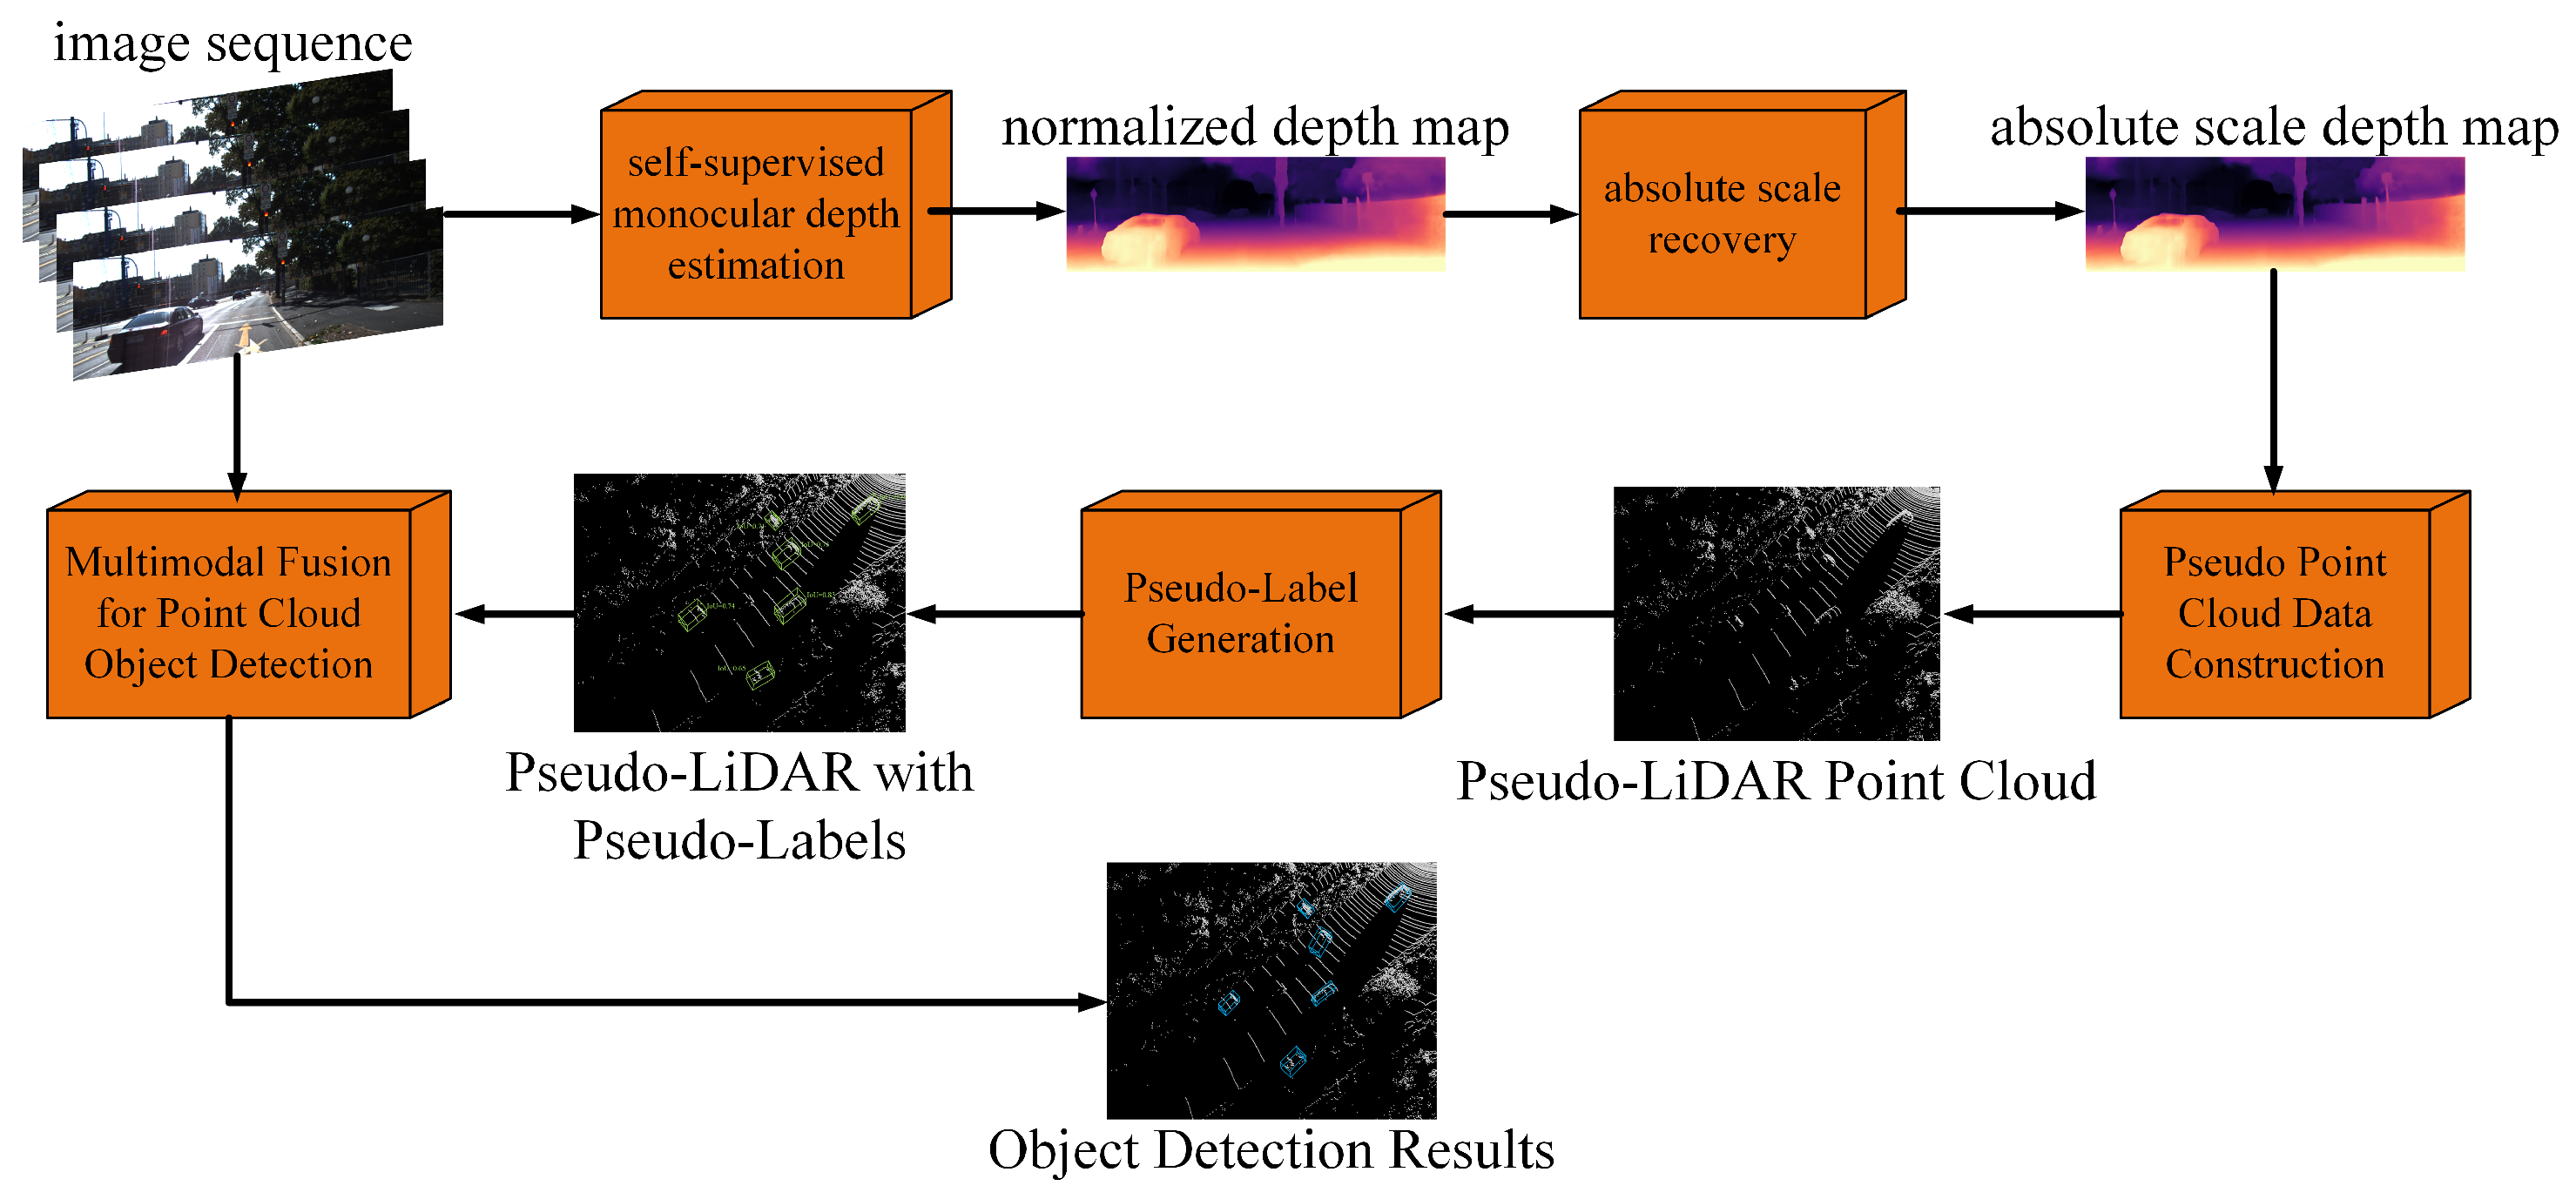
We introduce the main structure of UM3D in detail, whose framework is shown in Figure 1.

3.1. Pseudo-LiDAR Point Cloud Generation

High-quality Pseudo-LiDAR point clouds enable accurate monocular 3D object detection. We detail the Pseudo-LiDAR generation process in UM3D, comprising depth map to Pseudo-LiDAR conversion and density-based point cloud sampling.

3.1.1. Depth Map to Pseudo-LiDAR Conversion

The construction of Pseudo-LiDAR point clouds begins with an absolute-scale depth map output from a depth estimation network. In this work, we adopt the self-supervised depth estimation network RSANet [18] for this purpose. Compared to relative depth maps, absolute depth maps do not require normalization, reducing information loss. Given an image and its corresponding depth map D, using the projection principle of the pinhole camera model, each point ( i , j ) on the image plane and its depth value D ( i , j ) correspond to Pseudo-LiDAR point cloud coordinates:
x = ( i c i ) × D ( i , j ) f x , y = ( j c j ) × D ( i , j ) f y , z = D ( i , j )
where f x and f y are the camera’s horizontal and vertical focal lengths, and c i and c j are the principal point coordinates. Subsequently, through coordinate axis transformation, the camera coordinate system is converted to the vehicle-mounted LiDAR coordinate system:
x = z , y = x , z = y
To match existing LiDAR point cloud detectors, we simulate 64-line LiDAR acquisition by computing the vertical angle ϑ ( n ) and range l ( n ) of each point:
ϑ ( n ) = arctan z ( n ) x ( n ) 2 + y ( n ) 2 , l ( n ) = x ( n ) 2 + y ( n ) 2 + z ( n ) 2
Points are assigned to scan lines by vertical angle and sorted by range within each line; points within each line are further partitioned by azimuth into angular bins, and the nearest point to the sensor is retained in each (line, azimuth) cell, simulating single-return ranging of 64-beam LiDAR. Points above 1 m from the sensor origin are removed, and all reflection intensities are set to 1.

3.1.2. Density-Based Interval Sampling

Standard uniform sampling destroys geometric structure in Pseudo-LiDAR point clouds generated from high-density monocular depth maps. Since Pseudo-LiDAR lacks the reflection intensity cues used in traditional LiDAR sampling, we introduce density-based interval sampling that assigns inverse-density weights to spatial regions, prioritizing sparse areas to ensure uniform coverage. The three-dimensional space is partitioned into n cubic intervals:
Ω = { ω 1 , ω 2 , , ω n }
The number of points m i in each interval ω i is counted, and an inverse-density sampling weight is assigned:
k i = 1 m i + σ
where σ is a small positive number to prevent division by zero. Points are then uniformly sampled within each interval according to k i , yielding the per-interval sampled set:
P i = { p i 1 , p i 2 , , p i j }
where j is determined by the weight k i , so that sparser intervals contribute proportionally more points. The final sampled point cloud is the union of all per-interval sets:
Γ = i = 1 n P i
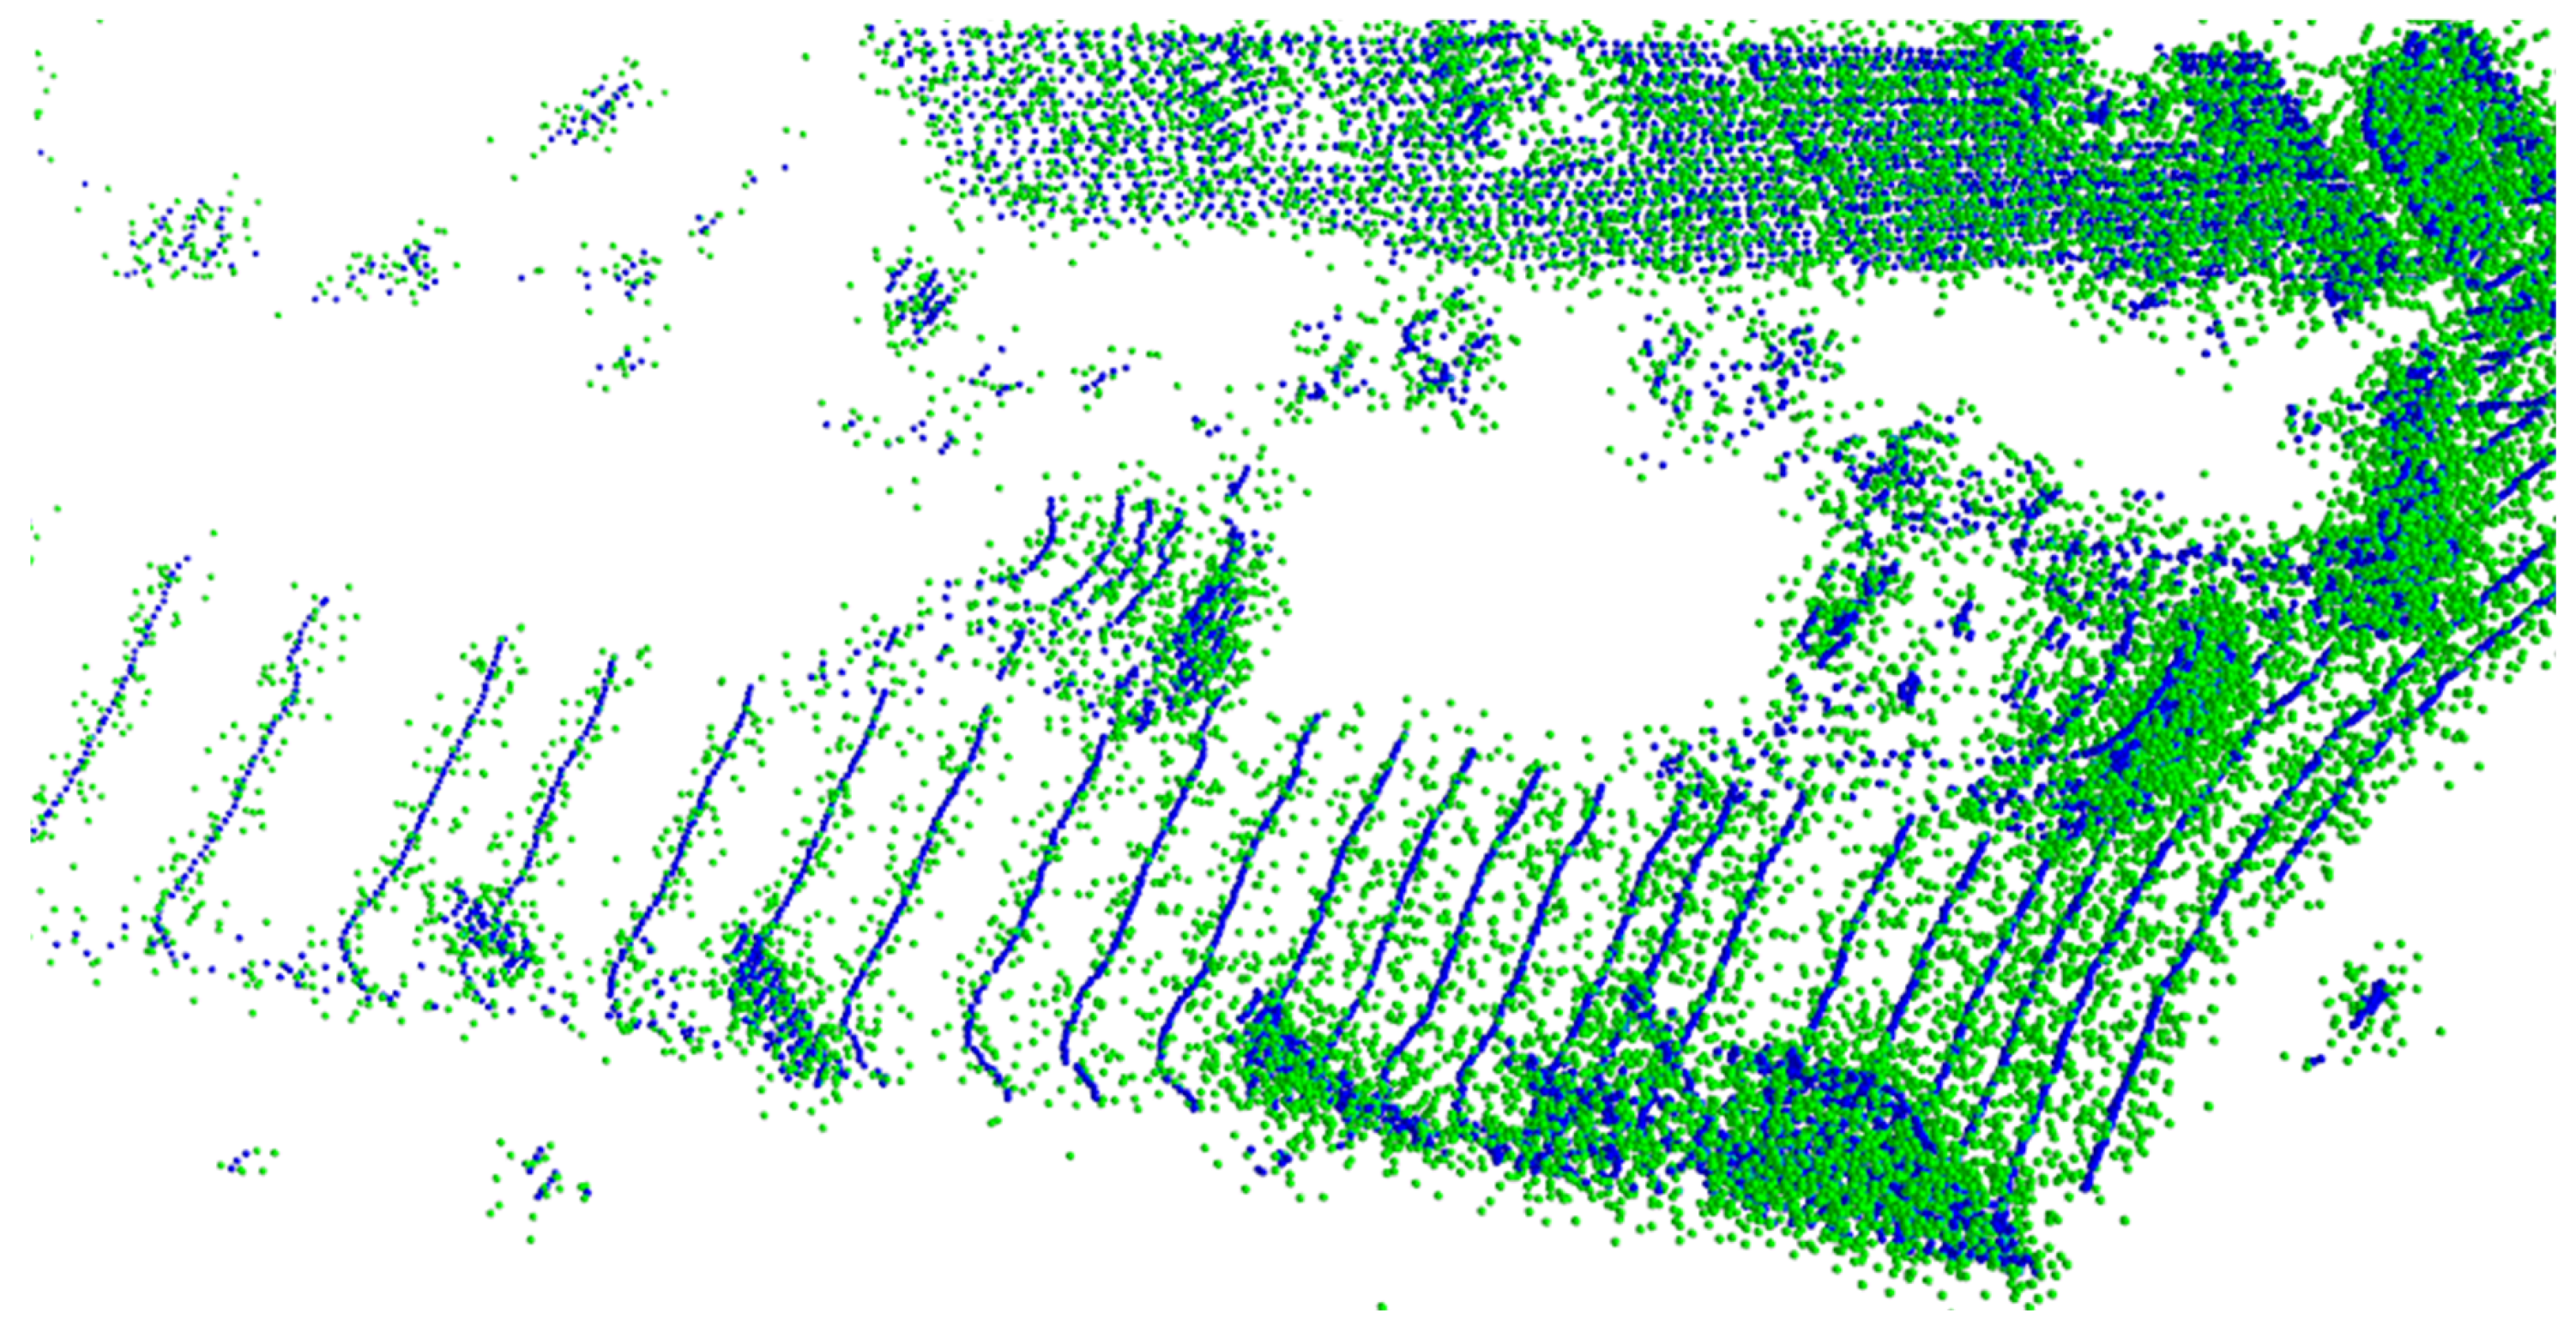
This method ensures uniform spatial distribution of sampled points, avoiding over-sparsity or over-density, which is crucial for Pseudo-LiDAR point cloud algorithms and directly affects monocular 3D object detection performance. As shown in Figure 2, the Pseudo-LiDAR point cloud produced by the above conversion and density-based sampling closely resembles actual LiDAR data at close range.

3.2. Quality-Aware Pseudo-Label Generation

When a 3D detector trained on the source domain is directly applied to the target domain, systematic biases arise: objects in the two domains often differ in physical size and point cloud density, causing the detector to produce inaccurate bounding boxes. In conventional self-training pipelines, these inaccurate detections are adopted as pseudo-labels and fed back to the detector, amplifying the initial errors over successive iterations. Breaking this vicious cycle requires intervention at two stages. During source domain pre-training, unlike prior methods that overlook object size discrepancies, we introduce an object-level random scaling strategy that exposes the detector to a wide range of object sizes, yielding higher-quality initial pseudo-labels in the target domain, as described in Section 3.2.1. Building on this improved starting point, we further replace conventional confidence-based filtering with a quality-aware three-interval memory bank that uses an IoU regression head to score and iteratively refine pseudo-labels during self-training, as detailed in Section 3.2.2.

3.2.1. Object-Level Random Scaling Strategy for Source Domain Pre-Training

To mitigate the impact of source domain biases, such as object size and target position, on pseudo-label generation, we pre-train the 3D detector on point cloud data with real labels in the source domain. The pre-trained model learns basic discriminative methods for object detection in the source domain, and its weights are used to initialize unlabeled data in the target domain. However, even with precise source domain annotations, the pre-trained model may produce biases, such as inconsistent target sizes and point cloud densities. Target size bias directly affects 3D detection accuracy, leading to incorrect bounding box sizes in target domain pseudo-labels. To address this, we introduce an object-level random scaling strategy to simulate objects of different sizes.
Specifically, for an annotated 3D bounding box with size ( l , w , h ) , center coordinates ( u , v , d ) , and orientation angle ω , we first transform points from the global coordinate system to the local coordinate system of the bounding box:
( p l i , p w i , p h i ) = ( p x i u , p y i v , p z i d ) · cos ω sin ω 0 sin ω cos ω 0 0 0 1
where ( p l i , p w i , p h i ) represents the coordinates of the i-th point within the bounding box of size ( l , w , h ) . Then, through random scaling factors ( f l , f w , f h ) , the coordinates of points within the box are scaled by ( f l , f w , f h ) , yielding ( p l i f l , p w i f w , p h i f h ) . Finally, the scaled point coordinates are transformed back to the global point cloud coordinate system:
( p x i , p y i , p z i ) = ( p l i f l , p w i f w , p h i f h ) · cos ω sin ω 0 sin ω cos ω 0 0 0 1 + ( u , v , d )
Through object-level random scaling, objects of various sizes are effectively simulated, addressing size bias issues in pre-training and contributing to the subsequent generation of more robust and accurate pseudo-labels for object sizes.

3.2.2. Pseudo-Label Generation Module

Inspired by ST3D [25], we introduce a quality-aware three-interval memory bank to guide target domain pseudo-label generation. The module extracts information from predicted bounding boxes generated by the object detector and mainly includes three parts: Intersection over Union (IoU) quality-based scoring criteria, three-interval bounding box division, and memory bank update and pseudo-label generation.
IoU Quality-Based Scoring Criteria: We extend the original 3D object detection model by adding an IoU regression head. Given RoI pooling features, two fully connected layers are used to predict the IoU between 3D bounding boxes and ground truth boxes/pseudo-labels. Additionally, a binary cross-entropy loss function L q u a l i t y is introduced to measure the IoU discrepancy:
L q u a l i t y = ( 1 s ^ ) log ( 1 s ) s ^ log ( s )
where s is the IoU of the predicted bounding box, and s ^ is the IoU between the ground truth box/pseudo-label and the predicted box.
Three-Interval Bounding Box Division: To avoid assigning labels to uncertain predictions, we introduce a bounding box division scheme. Given the IoU quality score s i of the i-th predicted box, a threshold interval [ T h r n , T h r p ] is created. If s i > T h r p , the box and label category are cached in the memory bank as positive samples; if T h r n < s i < T h r p , the box is ignored but cached in the memory bank to guide regions that should be ignored during training; if s i < T h r n , the box is discarded.
Memory Bank Update and Pseudo-Label Generation: To generate consistent and high-quality pseudo-labels, we design a pseudo-label self-update correction strategy that relies on the fusion of current pseudo-labels and historical pseudo-labels. This process is divided into label fusion and label voting. Label fusion aims to integrate current pseudo-labels with historical pseudo-labels to produce more consistent pseudo-labels. For all detection boxes in the current pseudo-label set and historical pseudo-label set, their 3D intersection-over-union matrix is calculated to match detection boxes with similar positions, sizes, and orientations, and then fused to produce new pseudo-label boxes:
IoU ( H , C ) = H , C H , C
where H represents historical pseudo-labels, and C represents current pseudo-labels. For each historical pseudo-label bounding box, we iterate to find the best match (highest IoU) with the current pseudo-target bounding box:
o p t i m u m ( H , C ) = argmax C , | IoU ( H , C ) |
We fuse matched bounding boxes, updating confidence scores and bounding box attributes. For pseudo-label bounding boxes that do not successfully match, we adopt a label voting method. Unmatched boxes may contain correctly detected targets or falsely detected non-target objects. Label voting utilizes historical information to determine the final status of unmatched boxes—cache, discard, or ignore. For each unmatched box, its unmatched counter c o u n t e r is updated. If the best match is not found between a historical pseudo-label H and a current pseudo-label C, then c o u n t e r ( H ) = c o u n t e r ( H ) + 1 . The final status of the box is decided based on predefined thresholds, where T h r i denotes the ignore threshold and T h r r denotes the removal threshold:
s t a t e = 1 , c o u n t e r ( H ) < T h r i 0 , T h r i c o u n t e r ( H ) < T h r r 1 , c o u n t e r ( H ) T h r r
If s t a t e = 1 , the historical pseudo-label box H is cached; if s t a t e = 0 , it is ignored; if s t a t e = 1 , it is discarded. Through label voting, more stable and consistent pseudo-labels are obtained, and individual unmatched boxes are cached in the memory bank for long-term accumulation and learning.

3.3. Multimodal Fusion for 3D Object Detection

As shown in Figure 3, our multimodal fusion detector builds on the LoGoNet [30] architecture. The input point cloud is voxelized and processed by a 3D backbone and Region Proposal Network to generate candidate regions, while a pre-trained 2D detector extracts image features from the monocular image. LoGoNet fuses the two modalities in two stages: candidate region outside fusion captures global geometric layout by projecting voxel centroids onto the image plane, and candidate region inside fusion refines local details within each proposal via cross-attention. We retain both fusion stages but replace the subsequent concatenation-based feature aggregation with a self-attention-based feature-weighted aggregation module, as described below.
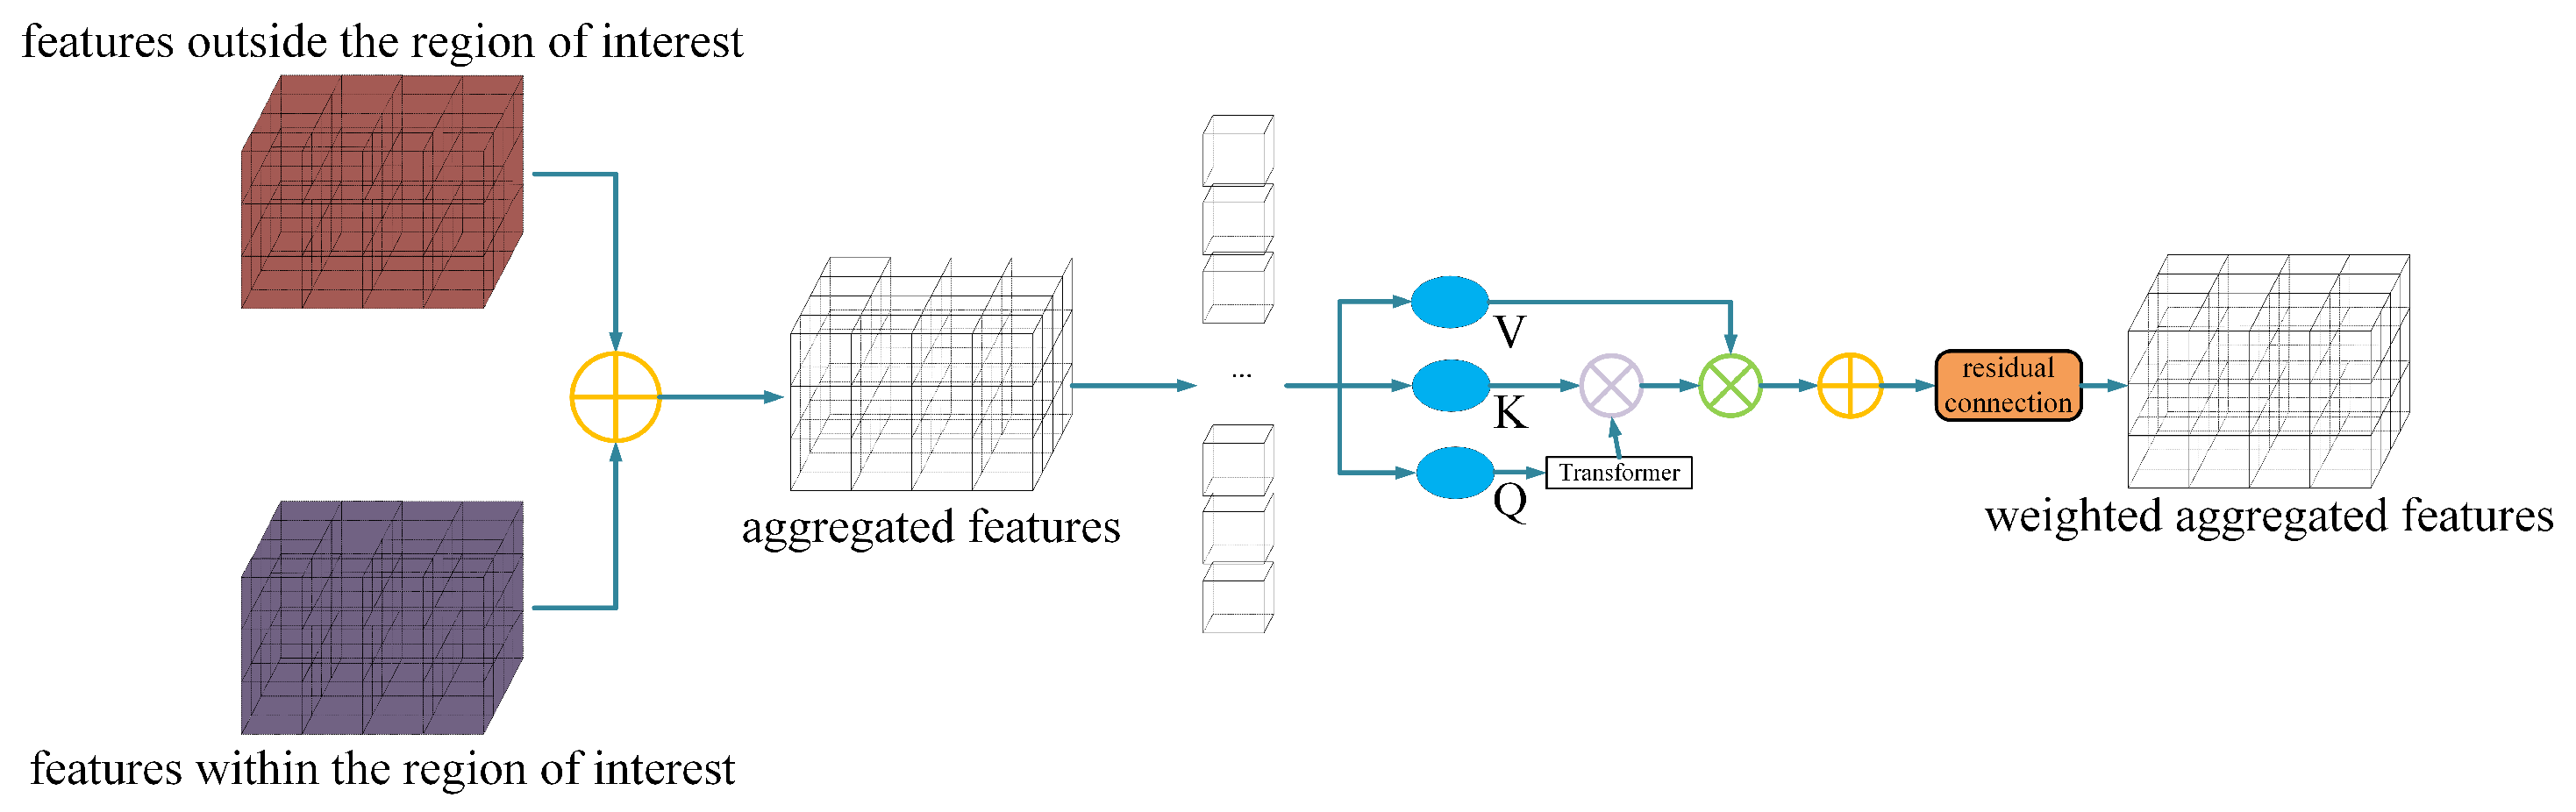
As shown in Figure 4, we replace LoGoNet’s original concatenation-based feature aggregation with a self-attention-based feature-weighted aggregation module. The module receives the outside-fusion feature F o u t and inside-fusion feature F i n , and computes query, key, and value projections on the concatenated input F = [ F o u t ; F i n ] :
Q = W Q F , K = W K F , V = W V F
where W Q , W K , W V are learnable projection matrices. Attention weights are then computed via scaled dot-product attention:
Attention ( Q , K , V ) = softmax Q K d k V
where d k is the key dimension. This mechanism allows each feature position to attend to all other positions, dynamically emphasizing task-relevant features and suppressing irrelevant ones. The attention output is fused to form the final feature representation for subsequent classification and regression.

3.4. End-to-End Network Implementation

To fully exploit the potential of depth estimation and multimodal fusion and achieve optimal 3D object detection performance, we adopt an end-to-end training strategy. In particular, the depth estimation network and the 3D detector are first initialized with pre-trained weights; they are then connected through the differentiable CoR module and jointly optimized under a single total loss, so that detection gradients propagate back into the depth network within the same forward–backward pass. This section introduces the differentiable change of representation module and multi-network consistency loss function that enable end-to-end training.

3.4.1. Differentiable Change of Representation

To achieve end-to-end training and connect the depth estimation network with the point cloud detection network, we introduce the differentiable Change of Representation (CoR) module from E2E-PL [17]. The CoR module enables information transfer between the two networks, allowing the entire model to be jointly optimized through backpropagation. The core of the CoR module consists of sampling and soft quantization. We improve the CoR module and replace the original downsampling with the Density-Based Interval Sampling proposed in Section 3.1.2.
Soft quantization enables gradient flow through the voxelization step. Traditional point cloud quantization assigns binary 0/1 occupancy values, creating non-differentiable discontinuities that block backpropagation. Given a point cloud P = { p 1 , p 2 , , p N } , the goal is to generate a 3D occupancy tensor T q u a n t i z a t i o n , where each cell u is associated with a fixed center position p c . The traditional quantization rule is: if point p falls outside cell u, T q u a n t i z a t i o n ( u ) = 0 ; if point p falls inside cell u, T q u a n t i z a t i o n ( u ) = 1 .
We introduce soft quantization to make the quantization process differentiable. Soft quantization uses radial basis function (RBF) weighting: if point p falls outside cell u, T s o f t q u a n t i z a t i o n ( u ) = 0 ; if point p falls inside cell u:
W ( u ) = 1 | P u | p P u e p p c 2 2 / δ 2
T s o f t q u a n t i z a t i o n ( u ) = W ( u ) + 1 | Υ u | u ¯ Υ u W ( u ¯ )
where W ( u ) is the radial basis function weight, δ is a very small positive value, u ¯ represents a neighboring cell in the neighborhood Υ u of cell u. When δ is far greater than 0 and Υ u is an empty set, soft quantization reverts to the original binary definition. Through this change of representation method, the point cloud occupancy tensor can be differentiated, thereby jointly optimizing the depth estimation network and point cloud detection network through backpropagation.

3.4.2. Loss Function: Multi-Network Consistency Loss

To achieve collaborative training across multiple networks, we adopt a multi-network consistency loss. The goal of this method is to maintain consistency among the results of multiple networks even under separate optimization. The consistency is enforced implicitly through end-to-end gradient flow via the differentiable CoR module: detection gradients propagate back into the depth network, driving depth estimates toward values that benefit downstream detection rather than optimizing depth in isolation. The total loss function is as follows:
L = α L d e p t h + β L d e t e c t i o n
Depth Estimation Loss: The self-supervised depth estimation network RSANet [18] introduced in Section 3 is trained with the loss from Monodepth2 [36]:
L d e p t h = min t p e ( I t , I t t ) L p + μ L s m o o t h
where L p is the photometric consistency loss, L s m o o t h is the depth smoothness loss, and μ is a weight coefficient. p e is the photometric reconstruction error, and min t p e ( I t , I t t ) is the adaptive masking loss. L p and L s m o o t h are:
L p = t ( I t , I t t )
L s m o o t h = | x d t * | e | x I t | + | y d t * | e | y I t |
where d t * is the normalized inverse depth, and x and y represent horizontal and vertical direction gradients, respectively.
Detection Loss: The point cloud detection network loss function mainly consists of the multimodal fusion point cloud detector:
L d e t e c t i o n = L R P N + L c o n f + λ L r e g
where L R P N is the RPN loss, L c o n f is the confidence prediction loss, L r e g is the bounding box regression loss, and λ is a hyperparameter balancing different losses.
By combining all the loss functions discussed above, we derive the overall loss function for the end-to-end point cloud model. By minimizing the total loss function L, joint optimization of depth estimation and 3D object detection can be achieved, thereby improving overall performance.
The complete training procedure is summarized in Algorithm 1, comprising a three-phase scheme: source-domain pre-training with ORSS, target-domain self-training with the quality-aware memory bank, and end-to-end joint optimization of depth estimation and multimodal 3D detection.
Algorithm 1: UM3D Training Procedure.
Vehicles 08 00098 i001 

4. Experimental Results

To comprehensively evaluate the effectiveness of the proposed UM3D method, we designed multiple comparative experiments. In standard benchmark tests, UM3D demonstrated superior performance compared to several previous well-known methods.

4.1. Implementation Details

Comparison methods: We compared UM3D with current mainstream unsupervised domain adaptation models SN [37] and ST3D [25]. Specifically, we combined the pseudo-label generation modules of SN, ST3D, and UM3D with the improved SECOND [38] and LoGoNet [30] point cloud detectors. For SECOND, we added an IoU scoring module in our experiments. Subsequently, we selected the monocular 3D object detection network FCOS3D [29] as the baseline model; both Source Only and Oracle results were produced by FCOS3D. We compared performance with STMono3D [34]. STMono3D was chosen because, like UM3D, it is an end-to-end unsupervised domain adaptation monocular 3D object detection method with FCOS3D as the backbone network, making it more suitable for demonstrating UM3D’s detection effectiveness.
Pre-training: Before comparative experiments, we pre-trained the pseudo-label generation model on the source domain using an object-level random scaling strategy. During the target domain self-training stage, we used the Adam [39] optimizer with a learning rate of 0.0015, training for 40 epochs, updating the pseudo-labels in the memory bank once per epoch.
End-to-end training: Network input and output resolution was set to 1024 × 320. All experiments were implemented based on PyTorch 1.10.0. The optimizer used was Adam, with an initial learning rate of 0.001, decaying by a factor of 0.1 every 10 training epochs, for a total of 30 training epochs.
Hyperparameters: Following E2E-PL [17], the total loss is L = α L d e p t h + β L d e t e c t i o n , where α = 1 and β = 0.01 . In the depth estimation loss, the smoothness weight is μ = 0.001 following Monodepth2 [36]. In the detection loss, the bounding box regression weight is λ = 2.0 . For soft quantization, the RBF bandwidth is δ 2 = 0.01 with a 26-neighbor ( 3 × 3 × 3 ) smoothing kernel. For the pseudo-label generation module following ST3D [25], the positive score threshold is T h r p = 0.5 and the negative threshold is T h r n = 0.2 ; the memory bank IoU matching threshold is 0.1, and pseudo-labels are updated every epoch during self-training.

4.2. Experimental Setup

Datasets: We used four autonomous driving datasets: KITTI [40] (7481 training/7518 test samples, Easy/Moderate/Hard evaluation), Waymo Open Dataset (WOD) [41] (798 training/202 validation/150 test sequences), nuScenes [42] (1000 scenes from Boston and Singapore), and Lyft [43] (55,000+ annotated frames). These four benchmarks span diverse domain shift factors—geographic environment (Germany, multi-city United States, Boston and Singapore), sensor configuration (e.g., 64-beam versus 32-beam LiDAR), and annotation protocol—enabling evaluation under realistic distributional differences. We evaluate UM3D on six unique source-to-target domain pairs across both point cloud and end-to-end monocular UDA settings (Table 2, Table 3, Table 4, Table 5 and Table 6), ensuring that the method is validated under varied domain shift conditions. For all datasets, the detection range was set to X/Y ∈ [−75.2, 75.2] m, Z ∈ [−2, 4] m; the voxel size for SECOND [38] and LoGoNet [30] was (0.1, 0.1, 0.15) m. Data augmentation included random global scaling, rotation, flipping, and per-object scaling and rotation.
Evaluation Metrics: For the domain adaptation multimodal fusion module, we followed the standard dataset splitting scheme in [8]: First, performing adaptive learning on the original domain with rich labels to enable prediction in the target domain without real labels; Second, conducting cross-domain adaptation experiments between two datasets using different numbers of LiDAR beams. The comparative experiments used two evaluation metrics: one is KITTI dataset’s AP BEV / AP 3 D (car category, bird’s-eye view (BEV)/3D view, IoU threshold 0.7, Moderate difficulty level), and the other is Closed Gap proposed by ST3D [25], which indicates the percentage of performance gap closed by different methods in domain adaptation, expressed as:
Closed Gap = AP model AP source only AP oracle AP source only × 100 %
For the overall object detection network, one part used KITTI’s AP metric (AP11, 11 recall level points) with BEV/3D IoU threshold of 0.5 to evaluate cross-domain object detection performance from source domains nuScenes, WOD, and Lyft to the KITTI target domain. Another part adopted nuScenes standard metrics including mean Average Translation Error (mATE), mean Average Scale Error (mASE), mean Average Orientation Error (mAOE), and mean Average Precision (mAP) to evaluate cross-domain object detection performance from source domains WOD and Lyft to the nuScenes target domain. The experimental results mainly focused on the car category.

4.3. Main Results

Experimental results are analyzed through three aspects: quantitative comparison, qualitative comparison, and ablation experiments. Source Only and Oracle serve as reference baselines: Source Only indicates using the source domain-trained model directly tested on the target domain without domain adaptation, while Oracle indicates fully supervised training and testing on the target domain. Ours denotes the proposed UM3D method.

4.3.1. Quantitative Results

Unsupervised domain adaptation results are shown in Table 2, Table 3 and Table 4. Table 2 reports experiments on the KITTI target domain. In the nuScenes → KITTI task, UM3D with LoGoNet improved by 1.91%/0.79% on AP BEV / AP 3 D over ST3D, while UM3D with SECOND improved by 0.31%/0.25%. In the WOD → KITTI task, the corresponding improvements are 1.04%/2.05% and 0.77%/0.92%. These results indicate that our multimodal UDA method can effectively transfer to the target domain. In particular, the LoGoNet variant consistently scored nearly 2 percentage points higher on AP BEV than SECOND, reflecting its advantage in multimodal feature extraction. Table 3 shows the WOD → nuScenes transfer task, where UM3D with LoGoNet improved by 1.52%/1.43% on AP BEV / AP 3 D over ST3D, and UM3D with SECOND by 0.92%/3.43%. This further demonstrates the adaptability of our method across different data distributions. Table 4 shows the WOD → Lyft transfer task. The LoGoNet variant improved by 0.92%/1.35% over ST3D, while for SECOND, ST3D achieved slightly better results, 76.32 vs. 76.14 on AP BEV , though the difference is marginal. Overall, UM3D outperforms Source Only on all metrics and demonstrates consistent cross-dataset transfer performance.
For end-to-end monocular 3D object detection, we compared UM3D against existing UDA methods using KITTI and nuScenes as target domains. Results are shown in Table 5 and Table 6. In Table 5, Source Only AP drops to nearly zero due to domain gaps, whereas UM3D recovers strong performance and in several settings even surpasses the Oracle baseline trained directly on the target domain. This counter-intuitive result arises from three complementary factors. First, the Oracle baseline is the image-only monocular detector FCOS3D [29], whereas UM3D internally generates Pseudo-LiDAR from the same monocular image and fuses image features with 3D geometric features; UM3D therefore operates on a structurally richer feature representation than the Oracle, even though both use only a camera at inference. Second, source-domain pre-training exposes UM3D to a considerably larger and more diverse training distribution than the target-domain training set alone, providing a regularization effect that mitigates overfitting to the limited target distribution. Third, this crossover is observed only in the end-to-end monocular UDA setting (Table 5); UM3D does not surpass the Oracle in the point-cloud UDA setting (Table 2, Table 3 and Table 4), where both the Oracle and UM3D operate on real LiDAR. This asymmetry indicates that the crossover is not due to a weak Oracle baseline but reflects a genuine advantage of multimodal fusion in the image-only detection regime, where the additional 3D geometric cue compensates for the well-known ill-posedness of monocular depth. In the WOD → KITTI task, UM3D outperforms STMono3D across all difficulty levels, with relative AP BEV gains of 1.1%/2.7%/1.3% and relative AP 3 D gains of 2.6%/3.5%/4.5% at Easy/Moderate/Hard. At the Hard level on some source domains, the margin over STMono3D is smaller, likely due to increased task complexity. In Table 6 with nuScenes as target, UM3D outperforms STMono3D on all four metrics in the WOD → nuScenes task, with mAP and mATE gaps to Oracle both below 10%. Across the majority of transfer settings, UM3D yields consistent improvements over comparison methods across different source domains, target domains, detection paradigms, and backbone detectors, suggesting that the observed gains are systematic rather than tied to a single experimental configuration.

4.3.2. Qualitative Results

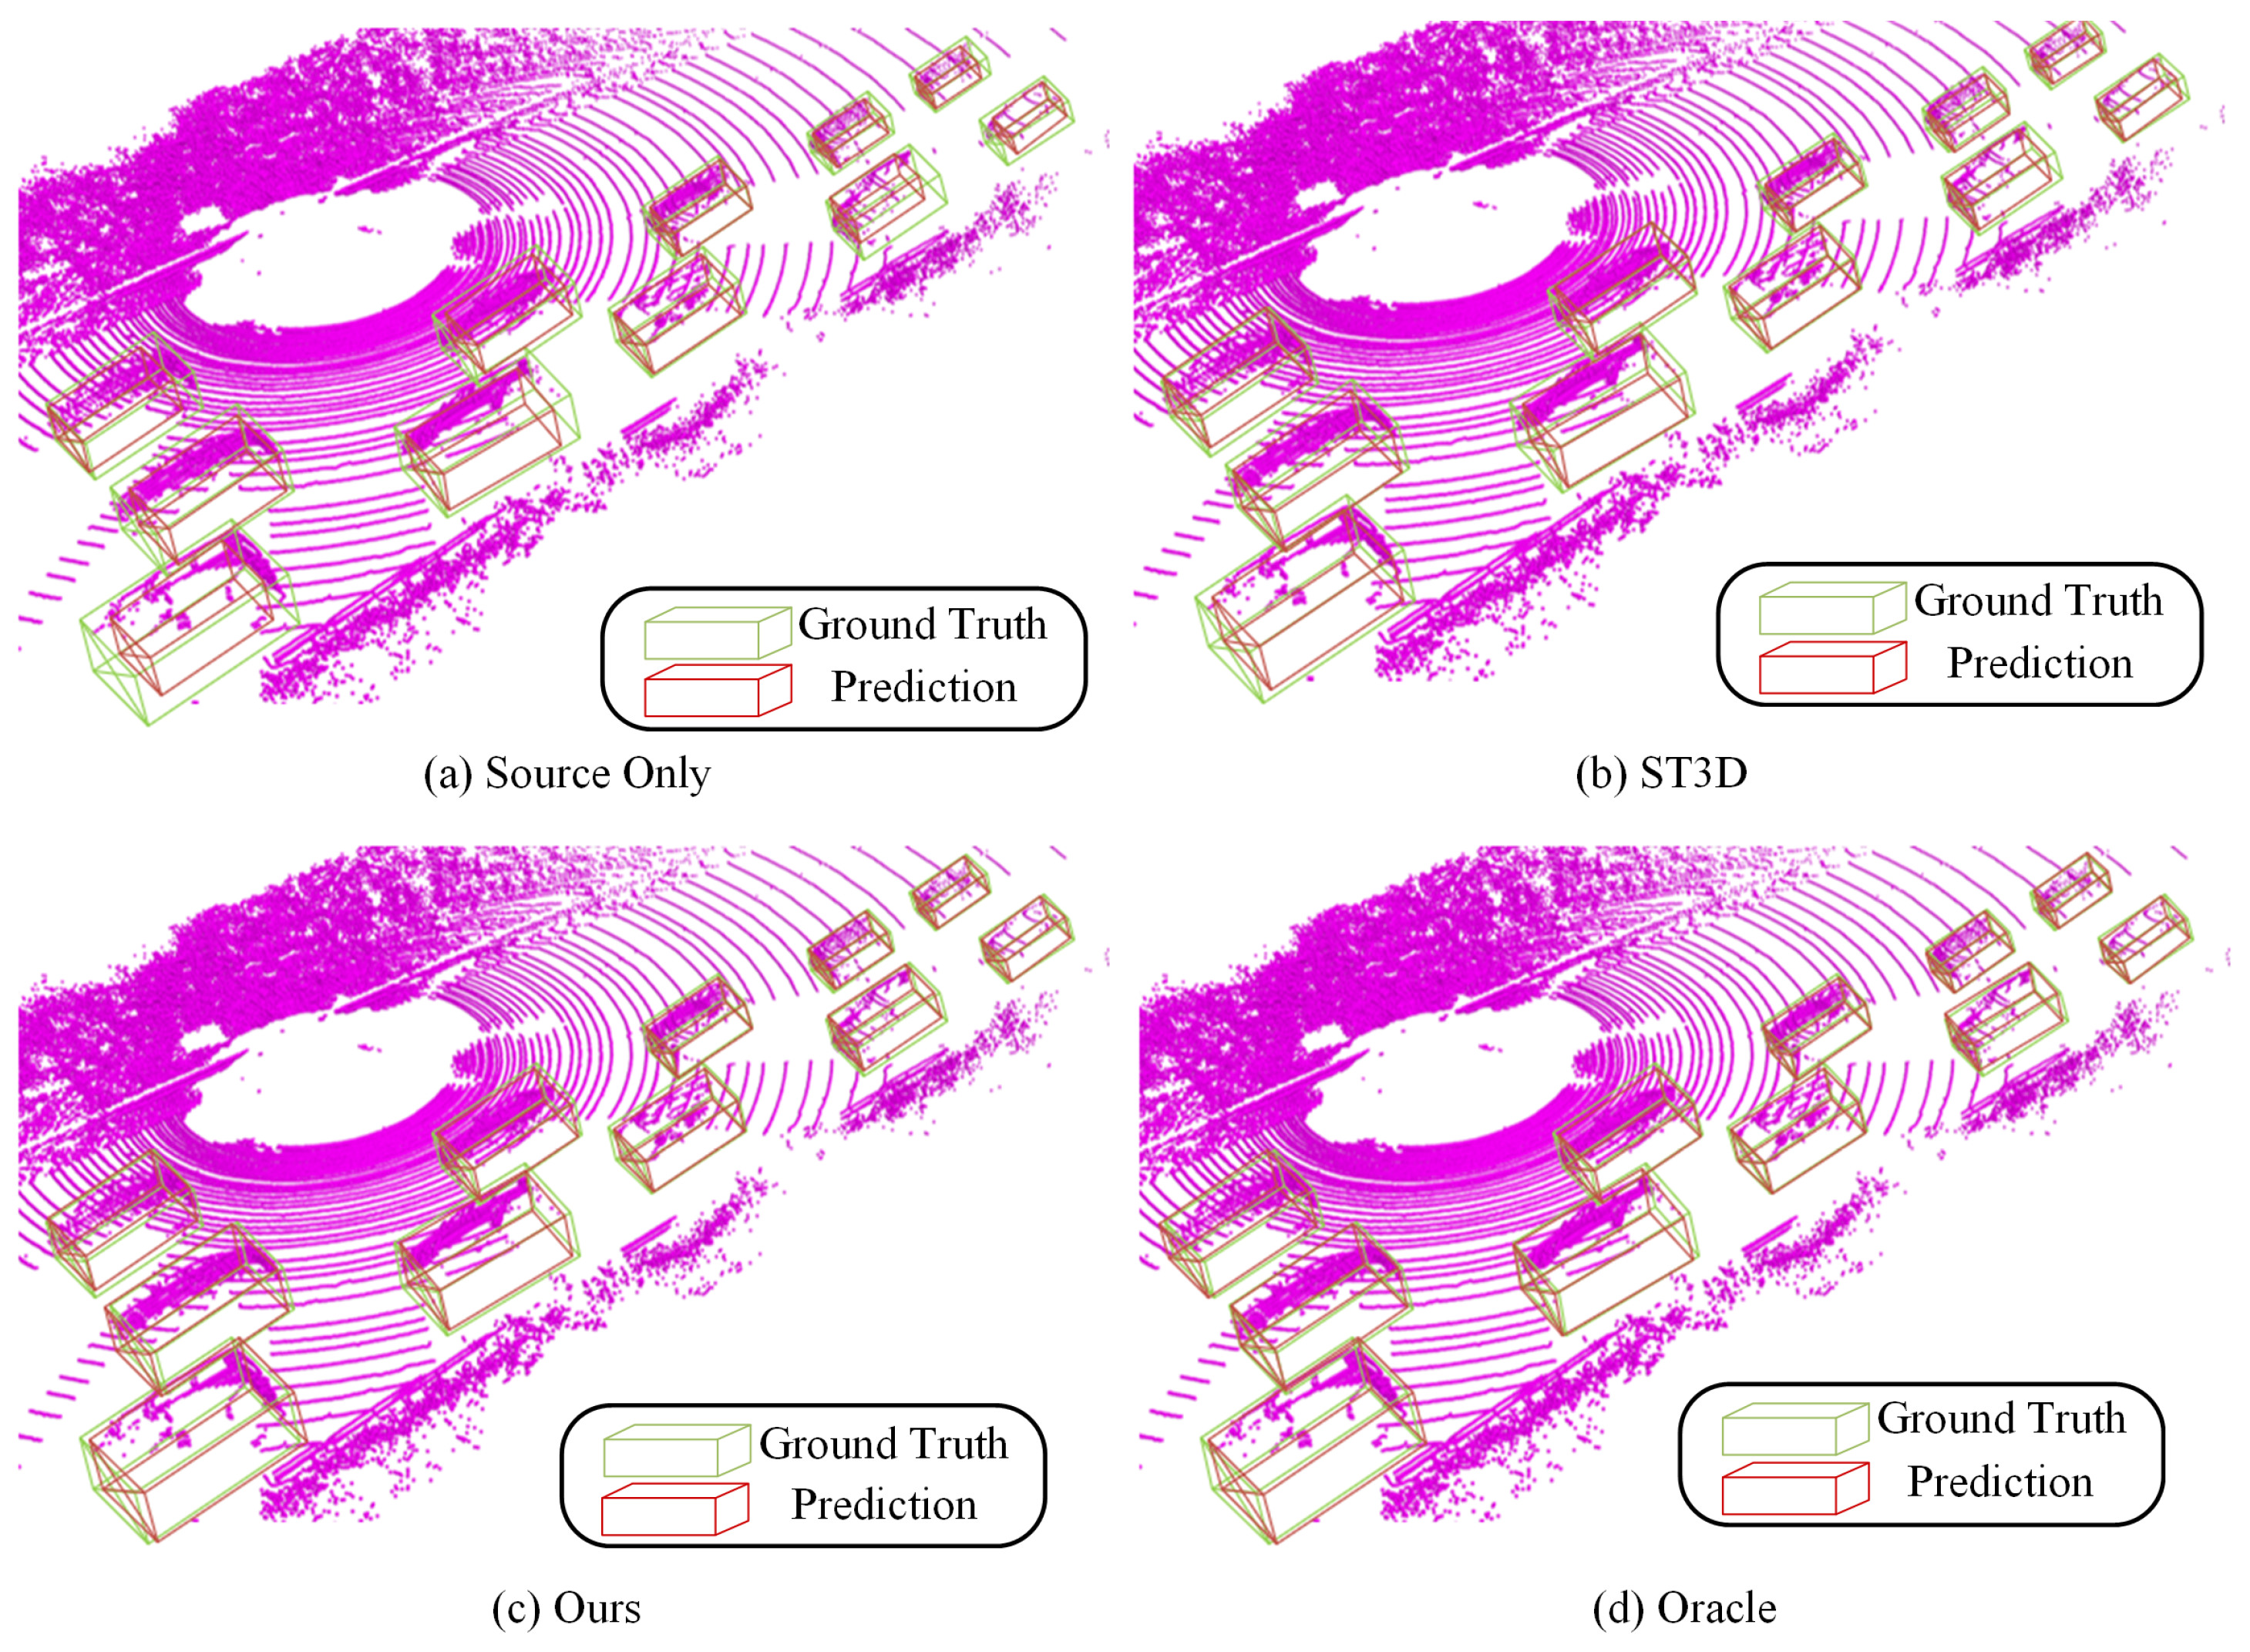
Figure 5 visualizes point cloud detection results for the WOD → KITTI task, where green boxes denote ground truth and red boxes denote predictions. The Source Only model (a) produces noticeably undersized bounding boxes due to geometric mismatches across domains. ST3D (b) improves substantially but still falls short of the Oracle (d). Our method (c) predicts more accurate bounding box positions than ST3D, closely approaching the Oracle.
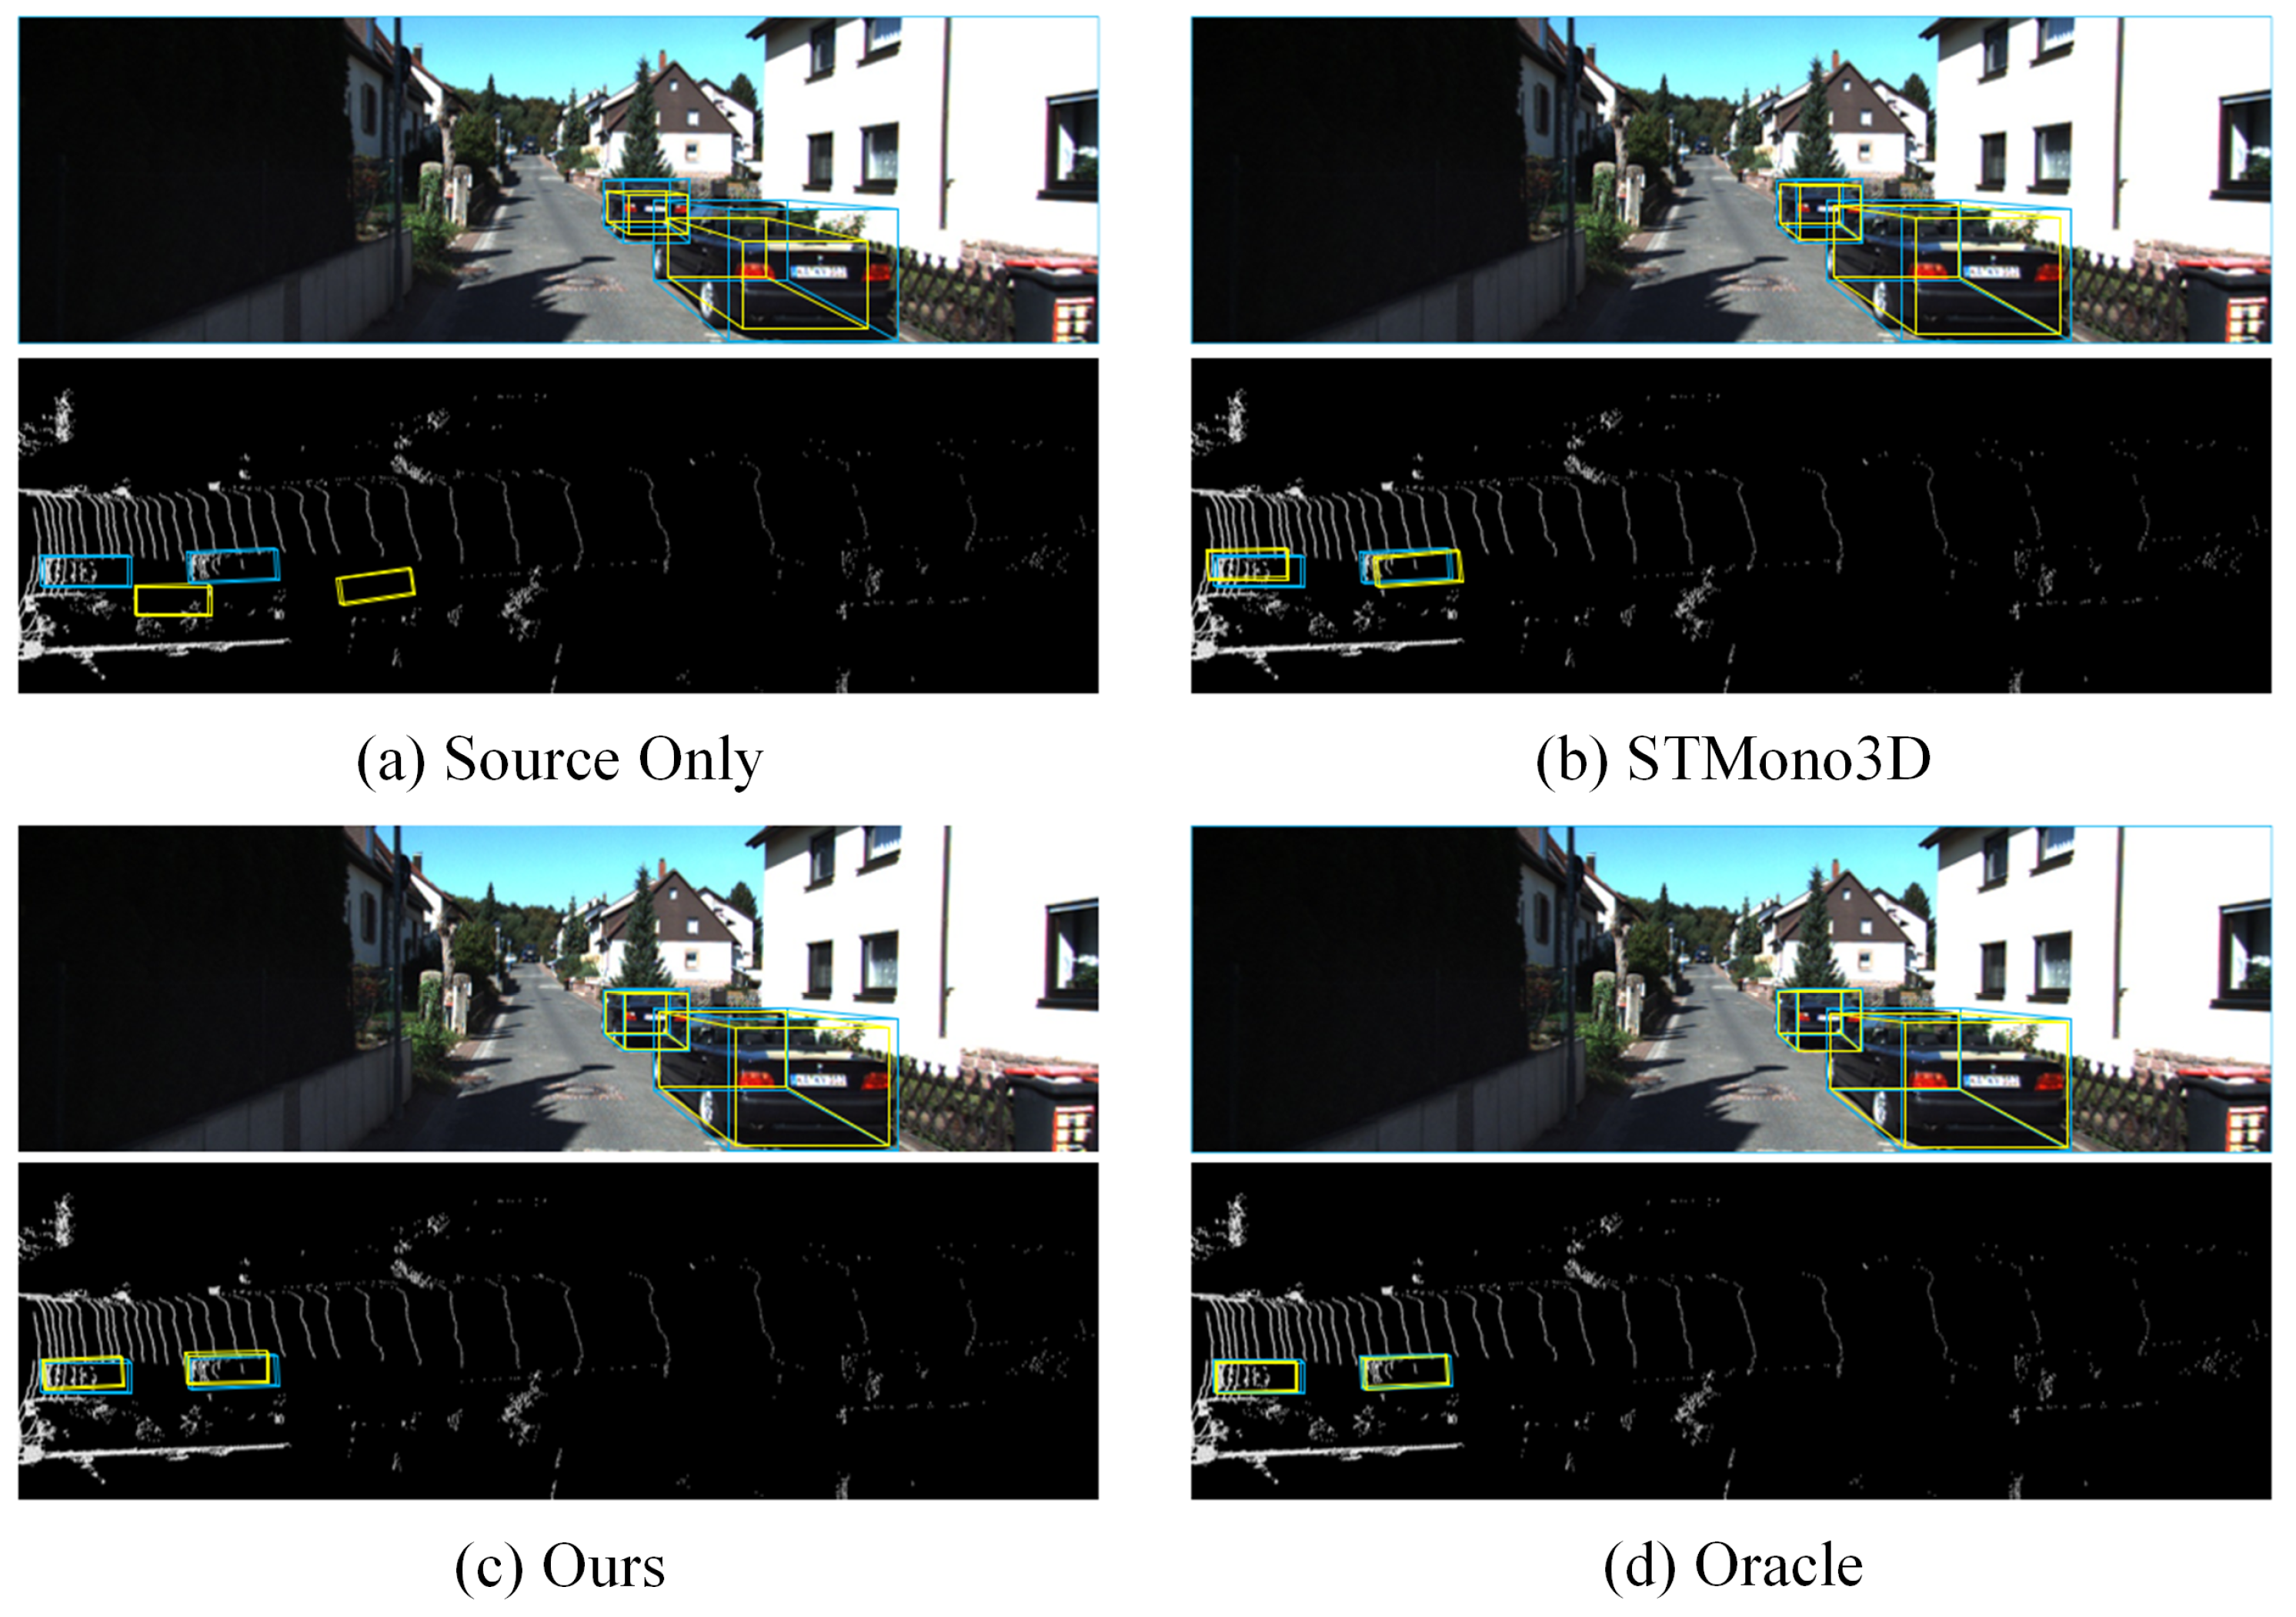
Figure 6 presents monocular 3D detection results for the WOD → KITTI task, with blue boxes indicating ground truth and yellow boxes indicating predictions. The Source Only baseline (a) locates objects in 2D but exhibits severe depth estimation errors, yielding near-zero 3D AP. STMono3D (b) reduces the depth error but retains a notable gap to the Oracle (d). Our method (c) predicts bounding boxes that are substantially more accurate than STMono3D and closely approach Oracle performance, demonstrating that UM3D can achieve near-supervised 3D detection under unsupervised domain adaptation.

4.4. Ablation Studies

We conduct ablation studies to validate the contributions of the Object-Level Random Scaling Strategy (ORSS) and the Pseudo-Label Generation Module (PLGM), as well as the effectiveness of each subnetwork in end-to-end joint training.
As shown in Table 7, both PLGM and ORSS contribute meaningfully to overall performance on the WOD → KITTI task. Adding ORSS alone to the LoGoNet baseline raises AP BEV / AP 3 D by 10.34/24.49 points, confirming that mitigating cross-domain object-size bias during pre-training significantly improves initial predictions. PLGM alone yields even larger gains of 14.13/30.32 points with LoGoNet, demonstrating that iterative pseudo-label refinement via the memory bank is the dominant factor. Combining both modules achieves the best results across both detectors, with relative improvements of 24.0% on AP BEV and 113.4% on AP 3 D over Source Only with LoGoNet, confirming that the two strategies are complementary.
Table 8 further evaluates the contribution of each subnetwork to end-to-end joint training. Depth denotes the self-supervised depth estimation network, RPN denotes the Region Proposal Network, and RCNN denotes the second-stage Region-based Convolutional Neural Network refinement head, which performs classification and bounding box regression; each row indicates which subnetwork losses are included in joint optimization.
Table 8 reveals a consistent pattern across three levels of training jointness. Among single-network training, Depth, RCNN, and RPN alone yield Moderate AP BEV values of 20.71, 22.56, and 22.87, respectively, indicating that isolating any single stage provides limited gain. Among two-network combinations, the two that include the depth network (Depth + RPN: 26.36; Depth + RCNN: 26.73) outperform the combination that excludes it (RCNN + RPN: 23.42) by approximately 3 points, isolating the specific contribution of detection gradients flowing back into the depth estimation network.
When only the RCNN and RPN subnetworks are jointly trained, AP BEV at Moderate difficulty reaches 23.42. Further incorporating the depth estimation loss raises this to 27.67, a gain of 4.25 points, demonstrating that aligning depth estimation with detection objectives through backpropagation is the primary driver of performance improvement. The full three-subnetwork combination attains the best AP BEV at all three difficulty levels and the best AP 3 D at Moderate and Hard—top on five of the six reported metric–difficulty cells, with the only exception being AP 3 D at Easy where Depth + RCNN attains a marginally higher 29.32 vs. 29.08, confirming that the depth, proposal, and refinement stages provide complementary benefits under end-to-end optimization.
All inference timing was measured on a single NVIDIA RTX 3080 GPU for a single deployment-time forward pass; training-time processes such as memory bank updates and self-training are excluded. UM3D processes each frame in approximately 127 ms (7.9 FPS), of which the depth estimation stage (RSANet [18]) accounts for 15.5 ms with 14.5 M parameters, pseudo-LiDAR generation via CoR and density-based interval sampling adds 8.1 ms, and the multimodal fusion detector accounts for 103.7 ms. The CoR module has time complexity O ( N ) with N 3 × 10 5 points per scene and is fully GPU-parallelizable, so its cost scales linearly with point-cloud resolution. The detector—comprising a 3D voxel backbone, region proposal network, 2D image feature extractor, and two-stage cross-modal fusion—constitutes the dominant computational cost, while the depth estimation stage is already lightweight. The total model contains approximately 60.5 M parameters.

5. Conclusions

An end-to-end unsupervised domain adaptation framework, UM3D, is presented in this paper for monocular 3D object detection, integrating self-supervised depth estimation, quality-aware pseudo-label generation, and multimodal fusion into a single differentiable pipeline. Through the joint optimization of depth estimation and 3D detection via backpropagation, cross-domain generalization is substantially improved: on the WOD → KITTI benchmark, up to 76.81% of the AP BEV domain gap is closed, and in several end-to-end monocular adaptation settings the fully-supervised target-domain Oracle is even surpassed. These gains are attributed to end-to-end backpropagation, through which depth estimates are aligned with detection objectives rather than with photometric reconstruction alone, and to the multimodal fusion module, through which complementary image features are reintroduced and the detector’s reliance on Pseudo-LiDAR alone is reduced. For practical deployment on electric-vehicle platforms, a compelling trade-off is offered by UM3D: robust 3D perception is obtained from a single low-cost monocular camera at inference, without inference-time LiDAR hardware or target-domain 3D annotations—a particularly valuable property, given that 3D bounding-box labels are costly and difficult to obtain in new driving environments.
Detection accuracy is bounded by the quality of self-supervised depth estimation, particularly at long range, and the current evaluation is focused predominantly on the car category. In future work, stronger depth priors will be incorporated, the evaluation will be extended to more object classes, and model compression and inference acceleration will be explored to reduce detection-stage latency toward real-time deployment.

Author Contributions

Conceptualization, J.J. and C.Z.; methodology, J.J. and W.L.; software, J.D.; validation, J.D. and Y.Z.; formal analysis, J.D. and J.Z.; investigation, J.J., W.L. and M.Y.; resources, W.L. and M.Y.; data curation, J.D. and Y.Z.; writing—original draft preparation, J.J.; writing—review and editing, J.Z. and C.Z.; visualization, J.D. and Y.Z.; supervision, J.J., J.Z. and C.Z.; project administration, C.Z.; funding acquisition, J.J. and C.Z. All authors have read and agreed to the published version of the manuscript.

Funding

This research was funded by Major Science and Technology Special Project of Fujian Province (Grant No. 2024HZ022013) and Applied Technology Engineering Center of Fujian Provincial Higher Education for Visual Perception and Intelligent Analysis (Grant No. SJGZ202501).

Institutional Review Board Statement

Not applicable.

Informed Consent Statement

Not applicable.

Data Availability Statement

The original contributions presented in this study are included in the article; further inquiries can be directed to the corresponding author.

Conflicts of Interest

Authors Jin Jiang and Wei Li were employed by Xiamen King Long United Automotive Industry Co., Ltd. The remaining authors declare that the research was conducted in the absence of any commercial or financial relationships that could be construed as a potential conflict of interest.

Abbreviations

The following abbreviations are used in this manuscript:
APAverage Precision
BEVBird’s Eye View
CNNConvolutional Neural Network
CoRChange of Representation
IoUIntersection over Union
mAOEmean Average Orientation Error
mAPmean Average Precision
mASEmean Average Scale Error
mATEmean Average Translation Error
ORSSObject-Level Random Scaling Strategy
PLGMPseudo-Label Generation Module
RBFRadial Basis Function
RCNNRegion-based Convolutional Neural Network
RoIRegion of Interest
RPNRegion Proposal Network
UDAUnsupervised Domain Adaptation
UM3DUnsupervised Monocular 3D Detection
WODWaymo Open Dataset

References

  1. Simeonov, G.; Bayer, P.; Simoudis, E. Real-Time 3D Scene Understanding and Object Detection for Autonomous Vehicle Awareness. Vehicles 2026, 8, 28. [Google Scholar] [CrossRef] [Scilit]
  2. Fawole, O.A.; Rawat, D.B. Recent advances in 3D object detection for self-driving vehicles: A survey. AI 2024, 5, 1255–1285. [Google Scholar] [CrossRef] [Scilit]
  3. Gupta, A.; Jain, S.; Choudhary, P.; Parida, M. Dynamic object detection using sparse LiDAR data for autonomous machine driving and road safety applications. Expert Syst. Appl. 2024, 255, 124636. [Google Scholar] [CrossRef] [Scilit]
  4. Zhang, S.; Yang, J.; Hao, T.; Wu, S.; Li, M. Temporal feature fusion with deformable attention for multi-view 3D object detection. Digit. Signal Process. 2026, 168, 105518. [Google Scholar] [CrossRef] [Scilit]
  5. Li, Z.; Wang, W.; Li, H.; Xie, E.; Sima, C.; Lu, T.; Yu, Q.; Dai, J. BEVFormer: Learning bird’s-eye-view representation from LiDAR-camera via spatiotemporal transformers. IEEE Trans. Pattern Anal. Mach. Intell. 2025, 47, 2020–2036. [Google Scholar] [CrossRef] [Scilit] [PubMed]
  6. Philion, J.; Fidler, S. Lift, splat, shoot: Encoding images from arbitrary camera rigs by implicitly unprojecting to 3D. In Proceedings of the European Conference on Computer Vision (ECCV), Glasgow, UK, 23–28 August 2020; pp. 194–210. [Google Scholar] [CrossRef] [Scilit]
  7. Chen, X.; Kundu, K.; Zhang, Z.; Ma, H.; Fidler, S.; Urtasun, R. Monocular 3D object detection for autonomous driving. In Proceedings of the IEEE/CVF Conference on Computer Vision and Pattern Recognition (CVPR), Las Vegas, NV, USA, 27–30 June 2016; pp. 2147–2156. [Google Scholar] [CrossRef] [Scilit]
  8. Chen, X.; Kundu, K.; Zhu, Y.; Berneshawi, A.G.; Ma, H.; Fidler, S.; Urtasun, R. 3D object proposals for accurate object class detection. In Proceedings of the Advances in Neural Information Processing Systems (NeurIPS), Montreal, QC, Canada, 7–12 December 2015; Volume 28, pp. 424–432. [Google Scholar]
  9. Mousavian, A.; Anguelov, D.; Flynn, J.; Kosecka, J. 3D bounding box estimation using deep learning and geometry. In Proceedings of the IEEE/CVF Conference on Computer Vision and Pattern Recognition (CVPR), Honolulu, HI, USA, 21–26 July 2017; pp. 5632–5640. [Google Scholar] [CrossRef] [Scilit]
  10. Gao, Y.; Wang, P.; Li, X.; Sun, M.; Di, R.; Li, L.; Hong, W. MonoDFNet: Monocular 3D object detection with depth fusion and adaptive optimization. Sensors 2025, 25, 760. [Google Scholar] [CrossRef] [Scilit] [PubMed]
  11. Wang, C.; Aouf, N. Depth-enhanced deep learning approach for monocular camera based 3D object detection. J. Intell. Robot. Syst. 2024, 110, 101. [Google Scholar] [CrossRef] [Scilit]
  12. Pan, C.; Peng, J.; Zhang, Z. Depth-guided vision transformer with normalizing flows for monocular 3D object detection. IEEE/CAA J. Autom. Sin. 2024, 11, 673–689. [Google Scholar] [CrossRef] [Scilit]
  13. Wang, Y.; Chao, W.L.; Garg, D.; Hariharan, B.; Campbell, M.; Weinberger, K.Q. Pseudo-LiDAR from visual depth estimation: Bridging the gap in 3D object detection for autonomous driving. In Proceedings of the IEEE/CVF Conference on Computer Vision and Pattern Recognition (CVPR), Long Beach, CA, USA, 16–20 June 2019; pp. 8437–8445. [Google Scholar] [CrossRef] [Scilit]
  14. Chen, Y.N.; Dai, H.; Ding, Y. Pseudo-stereo for monocular 3D object detection in autonomous driving. In Proceedings of the IEEE/CVF Conference on Computer Vision and Pattern Recognition (CVPR), New Orleans, LA, USA, 18–24 June 2022; pp. 877–887. [Google Scholar] [CrossRef] [Scilit]
  15. Meng, H.; Li, C.; Chen, G.; Chen, L.; Knoll, A. Efficient 3D object detection based on pseudo-LiDAR representation. IEEE Trans. Intell. Veh. 2024, 9, 1953–1964. [Google Scholar] [CrossRef] [Scilit]
  16. Yang, R.; You, Z.; Luo, R. MSFNet3D: Monocular 3D object detection via dual-branch depth-consistent fusion and semantic-guided point cloud refinement. World Electr. Veh. J. 2025, 16, 173. [Google Scholar] [CrossRef] [Scilit]
  17. Qian, R.; Garg, D.; Wang, Y.; You, Y.; Belongie, S.; Hariharan, B.; Campbell, M.; Weinberger, K.Q.; Chao, W.L. End-to-end pseudo-LiDAR for image-based 3D object detection. In Proceedings of the IEEE/CVF Conference on Computer Vision and Pattern Recognition (CVPR), Seattle, WA, USA, 13–19 June 2020; pp. 5880–5889. [Google Scholar] [CrossRef] [Scilit]
  18. Zhou, Y.; Zhang, C.; Deng, L.; Fu, J.; Li, H.; Xu, Z.; Zhang, J. Resolution-sensitive self-supervised monocular absolute depth estimation. Appl. Intell. 2024, 54, 4781–4793. [Google Scholar] [CrossRef] [Scilit]
  19. Ganin, Y.; Lempitsky, V. Unsupervised domain adaptation by backpropagation. In Proceedings of the International Conference on Machine Learning (ICML), Lille, France, 6–11 July 2015; Volume 37, pp. 1180–1189. [Google Scholar]
  20. Ben-David, S.; Blitzer, J.; Crammer, K.; Kulesza, A.; Pereira, F.; Vaughan, J.W. A theory of learning from different domains. Mach. Learn. 2010, 79, 151–175. [Google Scholar] [CrossRef] [Scilit]
  21. Zhang, Y.; Zhou, C.; Huang, D. STAL3D: Unsupervised domain adaptation for 3D object detection via collaborating self-training and adversarial learning. IEEE Trans. Intell. Veh. 2024, 9, 4753–4764. [Google Scholar] [CrossRef] [Scilit]
  22. Luo, Y.; Liu, P.; Zheng, L.; Guan, T.; Yu, J.; Yang, Y. Category-level adversarial adaptation for semantic segmentation using purified features. IEEE Trans. Pattern Anal. Mach. Intell. 2022, 44, 3940–3956. [Google Scholar] [CrossRef] [Scilit] [PubMed]
  23. Wozniak, M.K.; Hansson, M.; Thiel, M.; Jensfelt, P. UADA3D: Unsupervised adversarial domain adaptation for 3D object detection with sparse LiDAR and large domain gaps. IEEE Robot. Autom. Lett. 2024, 9, 11450–11457. [Google Scholar] [CrossRef] [Scilit]
  24. Tsai, D.; Berrio, J.S.; Shan, M.; Nebot, E.; Worrall, S. MS3D++: Ensemble of experts for multi-source unsupervised domain adaptation in 3D object detection. IEEE Trans. Intell. Veh. 2025, 10, 1999–2014. [Google Scholar] [CrossRef] [Scilit]
  25. Yang, J.; Shi, S.; Wang, Z.; Li, H.; Qi, X. ST3D: Self-training for unsupervised domain adaptation on 3D object detection. In Proceedings of the IEEE/CVF Conference on Computer Vision and Pattern Recognition (CVPR), Nashville, TN, USA, 19–25 June 2021; pp. 10363–10373. [Google Scholar] [CrossRef] [Scilit]
  26. Li, Z.; Yao, Y.; Quan, Z.; Qi, L.; Feng, Z.H.; Yang, W. Adaptation via proxy: Building instance-aware proxy for unsupervised domain adaptive 3D object detection. IEEE Trans. Intell. Veh. 2024, 9, 3478–3492. [Google Scholar] [CrossRef] [Scilit]
  27. Lu, X.; Radha, H. DALI: Domain adaptive LiDAR object detection via distribution-level and instance-level pseudo label denoising. IEEE Trans. Robot. 2024, 40, 4498–4514. [Google Scholar] [CrossRef] [Scilit]
  28. Reading, C.; Harakeh, A.; Chae, J.; Waslander, S.L. Categorical depth distribution network for monocular 3D object detection. In Proceedings of the IEEE/CVF Conference on Computer Vision and Pattern Recognition (CVPR), Nashville, TN, USA, 19–25 June 2021; pp. 8551–8560. [Google Scholar] [CrossRef] [Scilit]
  29. Wang, T.; Zhu, X.; Pang, J.; Lin, D. FCOS3D: Fully convolutional one-stage monocular 3D object detection. In Proceedings of the IEEE/CVF International Conference on Computer Vision Workshops, Montreal, QC, Canada, 11–17 October 2021; pp. 913–922. [Google Scholar] [CrossRef] [Scilit]
  30. Li, X.; Ma, T.; Hou, Y.; Shi, B.; Yang, Y.; Liu, Y.; Wu, X.; Chen, Q.; Li, Y.; Qiao, Y.; et al. LogoNet: Towards accurate 3D object detection with local-to-global cross-modal fusion. In Proceedings of the IEEE/CVF Conference on Computer Vision and Pattern Recognition (CVPR), Vancouver, BC, Canada, 17–24 June 2023; pp. 17524–17534. [Google Scholar] [CrossRef] [Scilit]
  31. Brazil, G.; Liu, X. M3D-RPN: Monocular 3D region proposal network for object detection. In Proceedings of the IEEE/CVF International Conference on Computer Vision (ICCV), Seoul, Republic of Korea, 27 October–2 November 2019; pp. 9286–9295. [Google Scholar] [CrossRef] [Scilit]
  32. Liu, Z.; Wu, Z.; Tóth, R. SMOKE: Single-stage monocular 3D object detection via keypoint estimation. In Proceedings of the IEEE/CVF Conference on Computer Vision and Pattern Recognition Workshops, Seattle, WA, USA, 13–19 June 2020; pp. 4289–4298. [Google Scholar] [CrossRef] [Scilit]
  33. Wang, K.; Zhou, P.; Hu, M.; Lu, J. Unsupervised 3D object detection domain adaptation based on pseudo-label variance regularization. IEEE Trans. Circuits Syst. Video Technol. 2025, 35, 6273–6285. [Google Scholar] [CrossRef] [Scilit]
  34. Li, Z.; Chen, Z.; Li, A.; Fang, L.; Jiang, Q.; Liu, X.; Jiang, J. Unsupervised domain adaptation for monocular 3D object detection via self-training. In Proceedings of the European Conference on Computer Vision (ECCV), Tel Aviv, Israel, 23–27 October 2022; pp. 245–262. [Google Scholar] [CrossRef] [Scilit]
  35. Zhang, Z.; Chen, M.; Xiao, S.; Peng, L.; Li, H.; Lin, B.; Li, P.; Wang, W.; Wu, B.; Cai, D. Pseudo-label refinery for unsupervised domain adaptation on cross-dataset 3D object detection. In Proceedings of the IEEE/CVF Conference on Computer Vision and Pattern Recognition (CVPR), Seattle, WA, USA, 17–21 June 2024; pp. 15291–15300. [Google Scholar] [CrossRef] [Scilit]
  36. Godard, C.; Mac Aodha, O.; Firman, M.; Brostow, G.J. Digging into self-supervised monocular depth estimation. In Proceedings of the IEEE/CVF International Conference on Computer Vision (ICCV), Seoul, Republic of Korea, 27 October–2 November 2019; pp. 3828–3838. [Google Scholar] [CrossRef] [Scilit]
  37. Wang, Y.; Chen, X.; You, Y.; Li, L.E.; Hariharan, B.; Campbell, M.; Weinberger, K.Q.; Chao, W.L. Train in Germany, test in the USA: Making 3D object detectors generalize. In Proceedings of the IEEE/CVF Conference on Computer Vision and Pattern Recognition (CVPR), Seattle, WA, USA, 13–19 June 2020; pp. 11710–11720. [Google Scholar] [CrossRef] [Scilit]
  38. Yan, Y.; Mao, Y.; Li, B. SECOND: Sparsely embedded convolutional detection. Sensors 2018, 18, 3337. [Google Scholar] [CrossRef] [Scilit] [PubMed]
  39. Kingma, D.P.; Ba, J. Adam: A method for stochastic optimization. In Proceedings of the International Conference on Learning Representations (ICLR), San Diego, CA, USA, 7–9 May 2015. [Google Scholar]
  40. Geiger, A.; Lenz, P.; Urtasun, R. Are we ready for autonomous driving? The KITTI vision benchmark suite. In Proceedings of the IEEE/CVF Conference on Computer Vision and Pattern Recognition (CVPR), Providence, RI, USA, 16–21 June 2012; pp. 3354–3361. [Google Scholar] [CrossRef] [Scilit]
  41. Sun, P.; Kretzschmar, H.; Dotiwalla, X.; Chouard, A.; Patnaik, V.; Tsui, P.; Guo, J.; Zhou, Y.; Chai, Y.; Caine, B.; et al. Scalability in perception for autonomous driving: Waymo Open Dataset. In Proceedings of the IEEE/CVF Conference on Computer Vision and Pattern Recognition (CVPR), Seattle, WA, USA, 13–19 June 2020; pp. 2443–2451. [Google Scholar] [CrossRef] [Scilit]
  42. Caesar, H.; Bankiti, V.; Lang, A.H.; Vora, S.; Liong, V.E.; Xu, Q.; Krishnan, A.; Pan, Y.; Baldan, G.; Beijbom, O. nuScenes: A multimodal dataset for autonomous driving. In Proceedings of the IEEE/CVF Conference on Computer Vision and Pattern Recognition (CVPR), Seattle, WA, USA, 13–19 June 2020; pp. 11618–11628. [Google Scholar] [CrossRef] [Scilit]
  43. Kesten, R.; Usman, M.; Houston, J.; Pandya, T.; Nadhamuni, K.; Ferreira, A.; Yuan, M.; Low, B.; Jain, A.; Ondruska, P.; et al. Lyft Level 5 AV Dataset 2019. 2019. Available online: https://github.com/lyft/nuscenes-devkit (accessed on 15 March 2024).
Figure 1. Overall pipeline of UM3D. Monocular depth maps are transformed into Pseudo-LiDAR point clouds, followed by quality-aware pseudo-label generation, and processed by a multimodal fusion detector that jointly leverages image and point cloud features in an end-to-end framework.
Vehicles 08 00098 g001
Figure 2. Comparison of Pseudo-LiDAR and actual LiDAR point clouds after depth-to-point-cloud conversion and density-based interval sampling. Blue points represent actual LiDAR measurements, and green points represent the generated Pseudo-LiDAR point cloud.
Vehicles 08 00098 g002
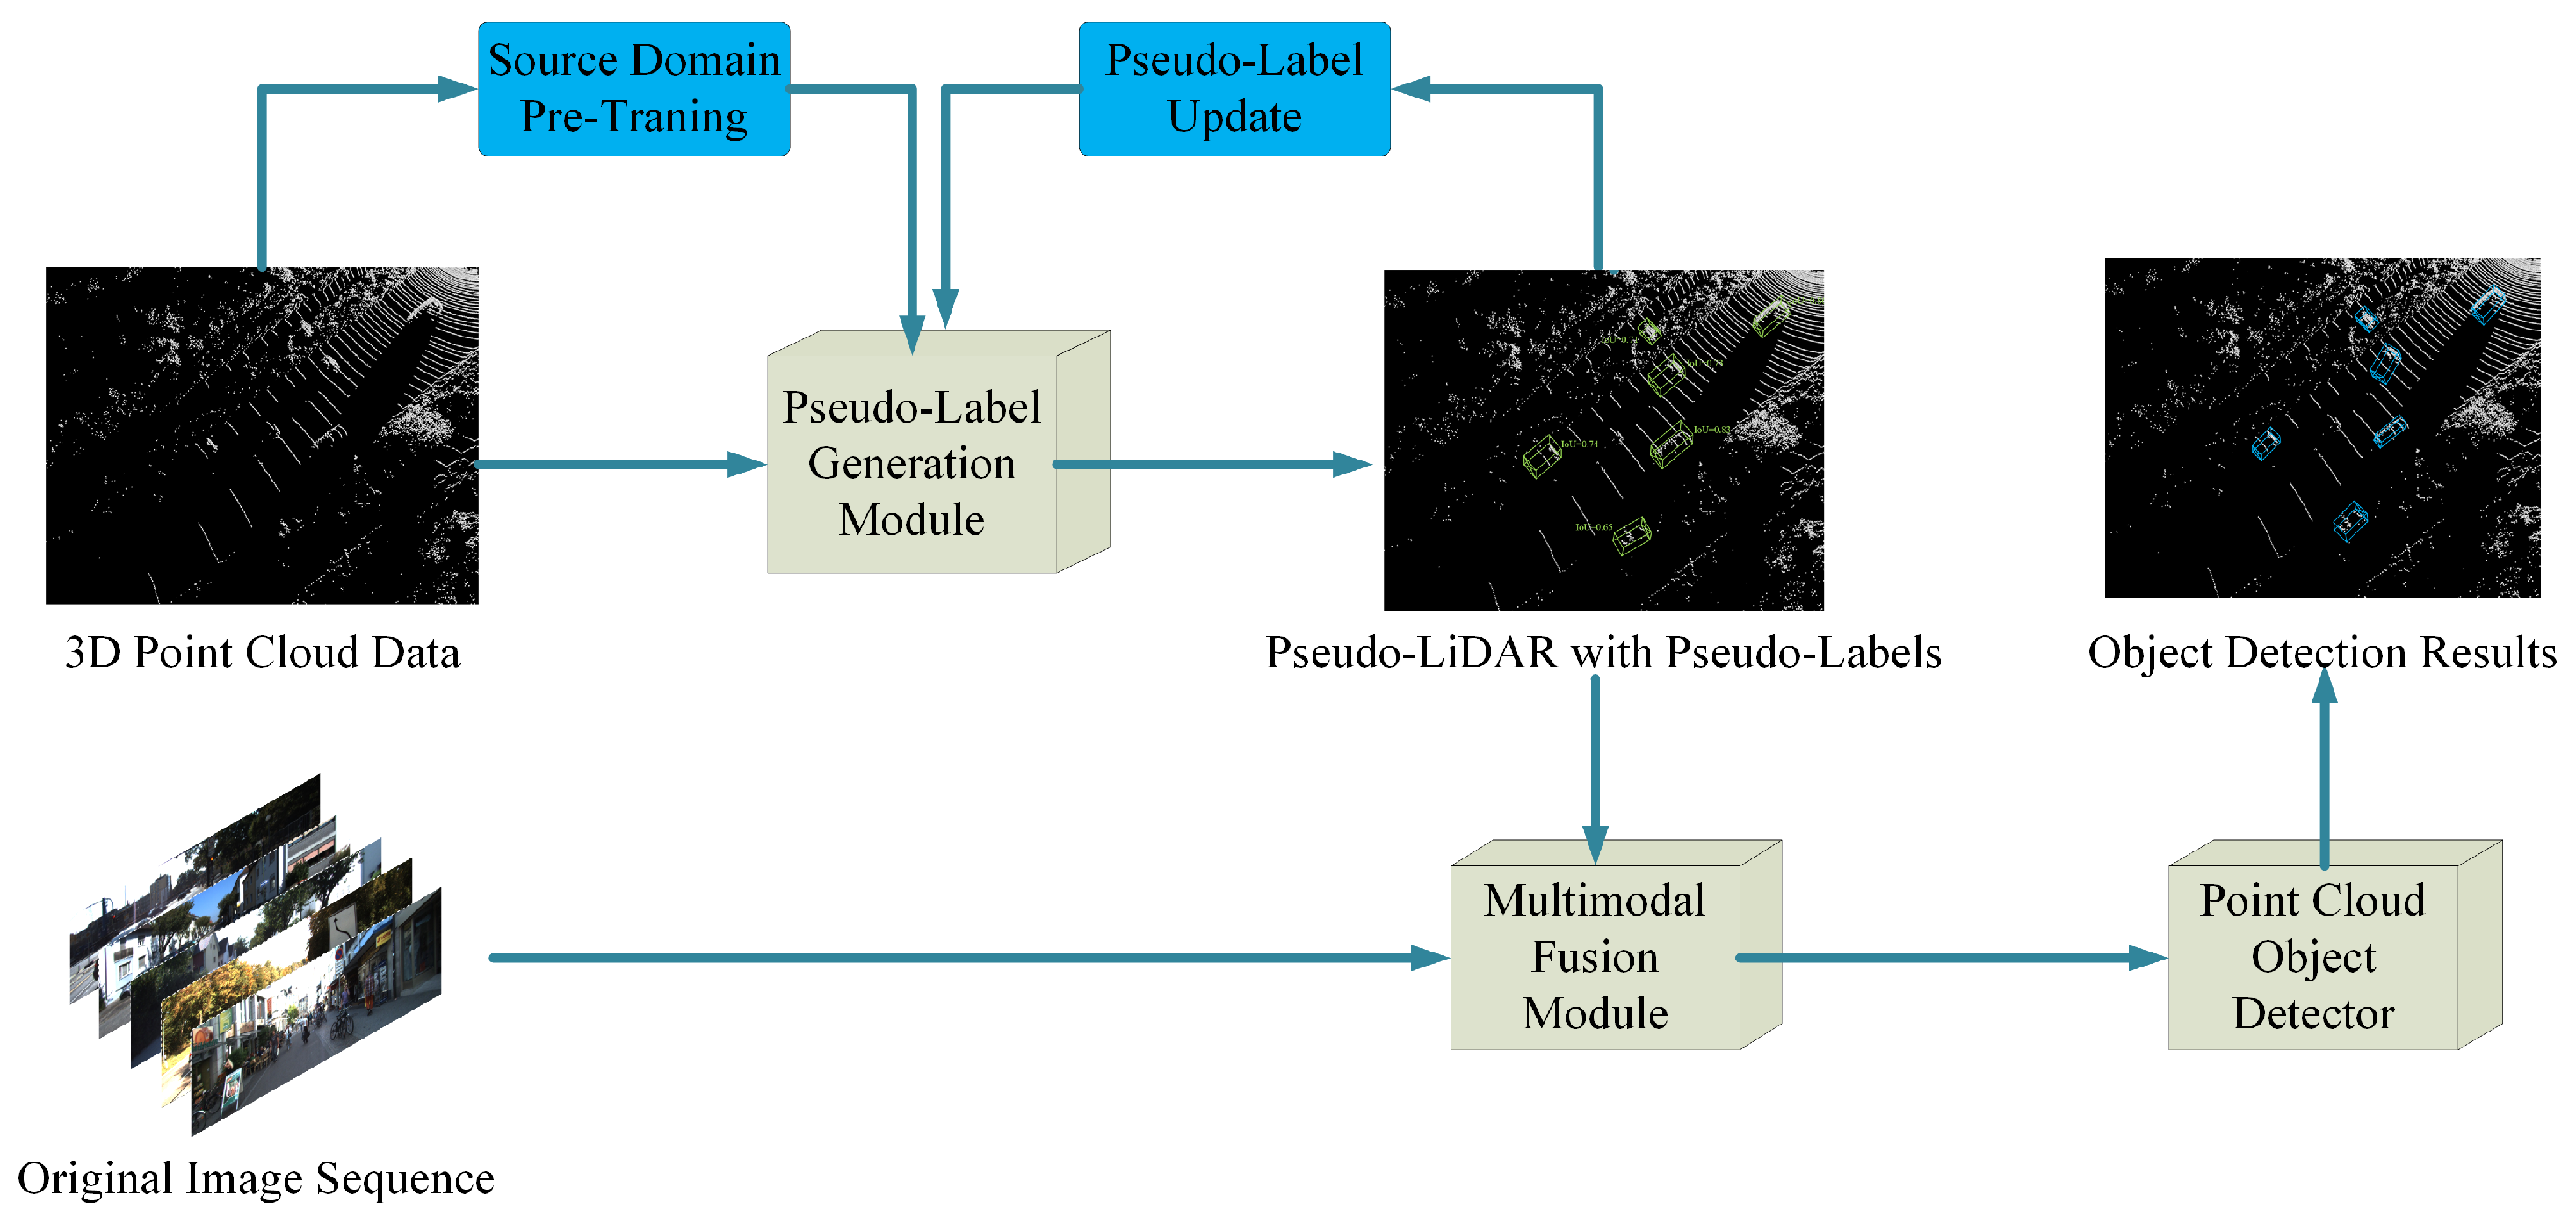
Figure 3. Multimodal UDA framework for 3D object detection, including source domain pre-training, pseudo-label generation and update, multimodal fusion, and point cloud-based object detection.
Vehicles 08 00098 g003
Figure 4. Feature-weighted aggregation module. This module aggregates multimodal features from inside and outside the RoI, computing weights via a self-attention mechanism to generate a weighted feature representation.
Vehicles 08 00098 g004
Figure 5. Qualitative point cloud detection results for the WOD → KITTI domain adaptation task. Green boxes indicate ground truth annotations, and red boxes indicate model predictions. (a) Source Only (b) ST3D (c) Ours (d) Oracle.
Vehicles 08 00098 g005
Figure 6. Qualitative results of monocular 3D object detection for the WOD → KITTI task in 3D view (top) and BEV (bottom). Blue boxes indicate ground truth, and yellow boxes indicate predictions. (a) Source Only (FCOS3D) (b) STMono3D (c) Ours (d) Oracle.
Vehicles 08 00098 g006
Table 1. Summary of representative supervised and UDA monocular 3D object detection methods, grouped by paradigm, with key advantages and limitations.
MethodYearCategoryKey AdvantageKey Limitation
Supervised line (target-domain labels required)
Pseudo-LiDAR [13]2019Monocular → PLEnables LiDAR detectors on image inputSupervised depth; error propagation
E2E-PL [17]2020End-to-end PLJoint depth and detection optimizationTarget-domain 3D labels required
FCOS3D [29]2021Direct monocular 3DEnd-to-end, no intermediate stepNo 3D geometric cues
LoGoNet [30]2023Multimodal LiDAR+imageLocal–global cross-modal fusionReal LiDAR hardware; full target supervision
MSFNet3D [16]2025Monocular + depth fusionDual-branch depth-consistent fusion with semantic refinementSupervised; no domain adaptation
UDA line (no target-domain 3D labels)
ST3D [25]2021Self-training (LiDAR)Pioneered pseudo-label self-trainingSingle modality; unreliable confidence filter
STMono3D [34]2022End-to-end UDA monocular 3DFirst end-to-end UDA for monocular 3DImage-only; no Pseudo-LiDAR geometry
DALI [27]2024Pseudo-label denoisingDistribution + instance-level denoisingSingle modality
PseudoVariance [33]2025Variance-regularised UDAPseudo-label variance regularisation for 3DSingle modality (LiDAR)
UM3D (Ours)End-to-end UDA multimodal + quality PLMultimodal fusion, quality-aware PL, end-to-end joint optimizationBounded by depth estimation quality at long range
Table 2. Quantitative results on the KITTI object domain. Unsupervised domain adaptation for point cloud object detection. Negative Closed Gap values indicate performance below Source Only.
TaskMethodLoGoNetSECOND
AP BEV / AP 3 D Closed Gap AP BEV / AP 3 D Closed Gap
nuScenes

KITTI
Source Only54.56/23.15-51.84/17.92-
SN [37]47.69/32.38−18.99%/+14.95%40.03/21.23−37.55%/+5.96%
ST3D [25]78.26/57.41+65.51%/+55.50%75.94/54.13+76.63%/+65.20%
Ours80.17/58.20+70.84%/+56.79%76.25/54.38+77.62%/+65.66%
Oracle90.72/84.87-83.29/73.45-
WOD

KITTI
Source Only69.12/31.59-67.64/27.48-
SN79.95/62.25+50.14%/+57.55%78.96/59.20+72.33%/+69.00%
ST3D84.67/65.39+71.99%/+63.44%82.19/61.83+92.97%/+74.72%
Ours85.71/67.44+76.81%/+67.27%82.96/62.75+97.89%/+76.73%
Oracle90.72/84.87-83.29/73.45-
Table 3. Quantitative results on the nuScenes object domain. Unsupervised domain adaptation for point cloud object detection.
TaskMethodLoGoNetSECOND
AP BEV / AP 3 D Closed Gap AP BEV / AP 3 D Closed Gap
WOD

nuScenes
Source Only39.28/24.65-32.91/17.24-
SN40.15/26.36+5.32%/+11.76%33.23/18.57+1.69%/+7.54%
ST3D42.58/28.14+20.19%/+24.20%35.92/20.19+15.87%/+16.73%
Ours44.10/29.57+29.49%/+33.86%36.84/23.62+20.72%/+36.18%
Oracle55.62/39.18-51.88/34.87-
Table 4. Quantitative results on the Lyft object domain. Unsupervised domain adaptation for point cloud object detection.
TaskMethodLoGoNetSECOND
AP BEV / AP 3 D Closed Gap AP BEV / AP 3 D Closed Gap
WOD → LyftSource Only74.87/57.61-72.92/54.34-
SN74.93/57.89+0.57%/+2.01%72.33/54.34−5.11%/+0.00%
ST3D78.14/59.93+31.26%/+16.68%76.32/59.24+29.44%/+33.93%
Ours79.06/61.28+40.05%/+26.38%76.14/59.19+27.88%/+33.59%
Oracle85.33/71.52-84.47/68.78-
Table 5. Monocular 3D UDA results with KITTI as target domain. Unsupervised domain adaptation for monocular 3D object detection (AP at IoU ≥ 0.5).
TaskMethod AP BEV IoU ≥ 0.5 AP 3 D IoU ≥ 0.5
Easy Mod. Hard Easy Mod. Hard
nuScenes

KITTI
Source Only000000
STMono3D [34]35.6327.3723.9528.6521.8919.55
Ours36.8127.6022.9429.3722.1618.93
Oracle33.4623.6222.1829.0119.8817.17
Lyft

KITTI
Source Only000000
STMono3D26.4620.7117.6618.1413.3211.83
Ours28.2321.5917.9819.3213.3511.16
Oracle33.4623.6222.1829.0119.8817.17
WOD

KITTI
Source Only000000
STMono3D35.6926.9423.1928.3420.2118.03
Ours36.1027.6723.4829.0820.9218.84
Oracle33.4623.6222.1829.0119.8817.17
Table 6. Quantitative results on the nuScenes object domain. Unsupervised domain adaptation for monocular 3D object detection using nuScenes metrics.
TaskMethodmAPmATEmASEmAOE
WOD → nuScenesSource Only2.41.3020.1900.802
STMono3D23.50.8430.1710.349
Ours25.70.8200.1680.311
Oracle28.20.7980.1600.209
Lyft → nuScenesSource Only2.41.3020.1900.802
STMono3D21.30.9110.1700.355
Ours22.10.8980.1730.304
Oracle28.20.7980.1600.209
Table 7. Pseudo-label generation module ablation study results (WOD → KITTI, IoU≥0.7).
ModuleMethod AP BEV AP 3 D
Source OnlySECOND67.6427.48
LoGoNet69.1231.59
Baseline+ORSSSECOND78.2955.13
LoGoNet79.4656.08
Baseline+PLGMSECOND81.3059.42
LoGoNet83.2561.91
Baseline+PLGM+ORSSSECOND82.9662.75
LoGoNet85.7167.44
Table 8. End-to-end joint training subnetwork ablation (WOD → KITTI, AP at IoU≥0.5).
Method AP BEV IoU ≥ 0.5 AP 3 D IoU ≥ 0.5
Easy Mod. Hard Easy Mod. Hard
Depth30.2620.7117.3525.5116.0614.48
RCNN32.0122.5618.5526.7517.6915.41
RPN32.6422.8718.9426.1417.5214.34
RCNN + RPN33.8923.4219.8026.9917.1015.85
Depth + RPN35.6226.3621.1628.7419.2316.19
Depth + RCNN35.9826.7323.2029.3219.1517.41
Depth + RCNN + RPN36.1027.6723.4829.0820.9218.84
Disclaimer/Publisher’s Note: The statements, opinions and data contained in all publications are solely those of the individual author(s) and contributor(s) and not of MDPI and/or the editor(s). MDPI and/or the editor(s) disclaim responsibility for any injury to people or property resulting from any ideas, methods, instructions or products referred to in the content.