1. Introduction
The major concern of modern society about global warming is the rise in atmospheric carbon dioxide (CO
2) concentration above 410 parts per million (ppm), from below 300 ppm in the pre-industrial period. The continuous rise in Earth’s surface is strongly linked to atmospheric carbon dioxide concentrations, which are the main contributor to climate change [
1].
One of the main factors that increases global carbon dioxide concentrations is the use of internal combustion engines. Whether it is standard vehicles, transport vehicles, airplanes, trains, or maritime vessels, all use internal combustion engines for propulsion. That is why it is very important to develop as many filtration systems as possible to reduce the levels of these emissions, including carbon dioxide.
In this study, the authors propose an exhaust gas filtration system for a spark ignition engine from a 2009 vehicle to reduce emissions, including carbon dioxide levels. The purpose of creating such a system is to be implemented on vehicles older than 10 years to ensure compliance with pollution standards.
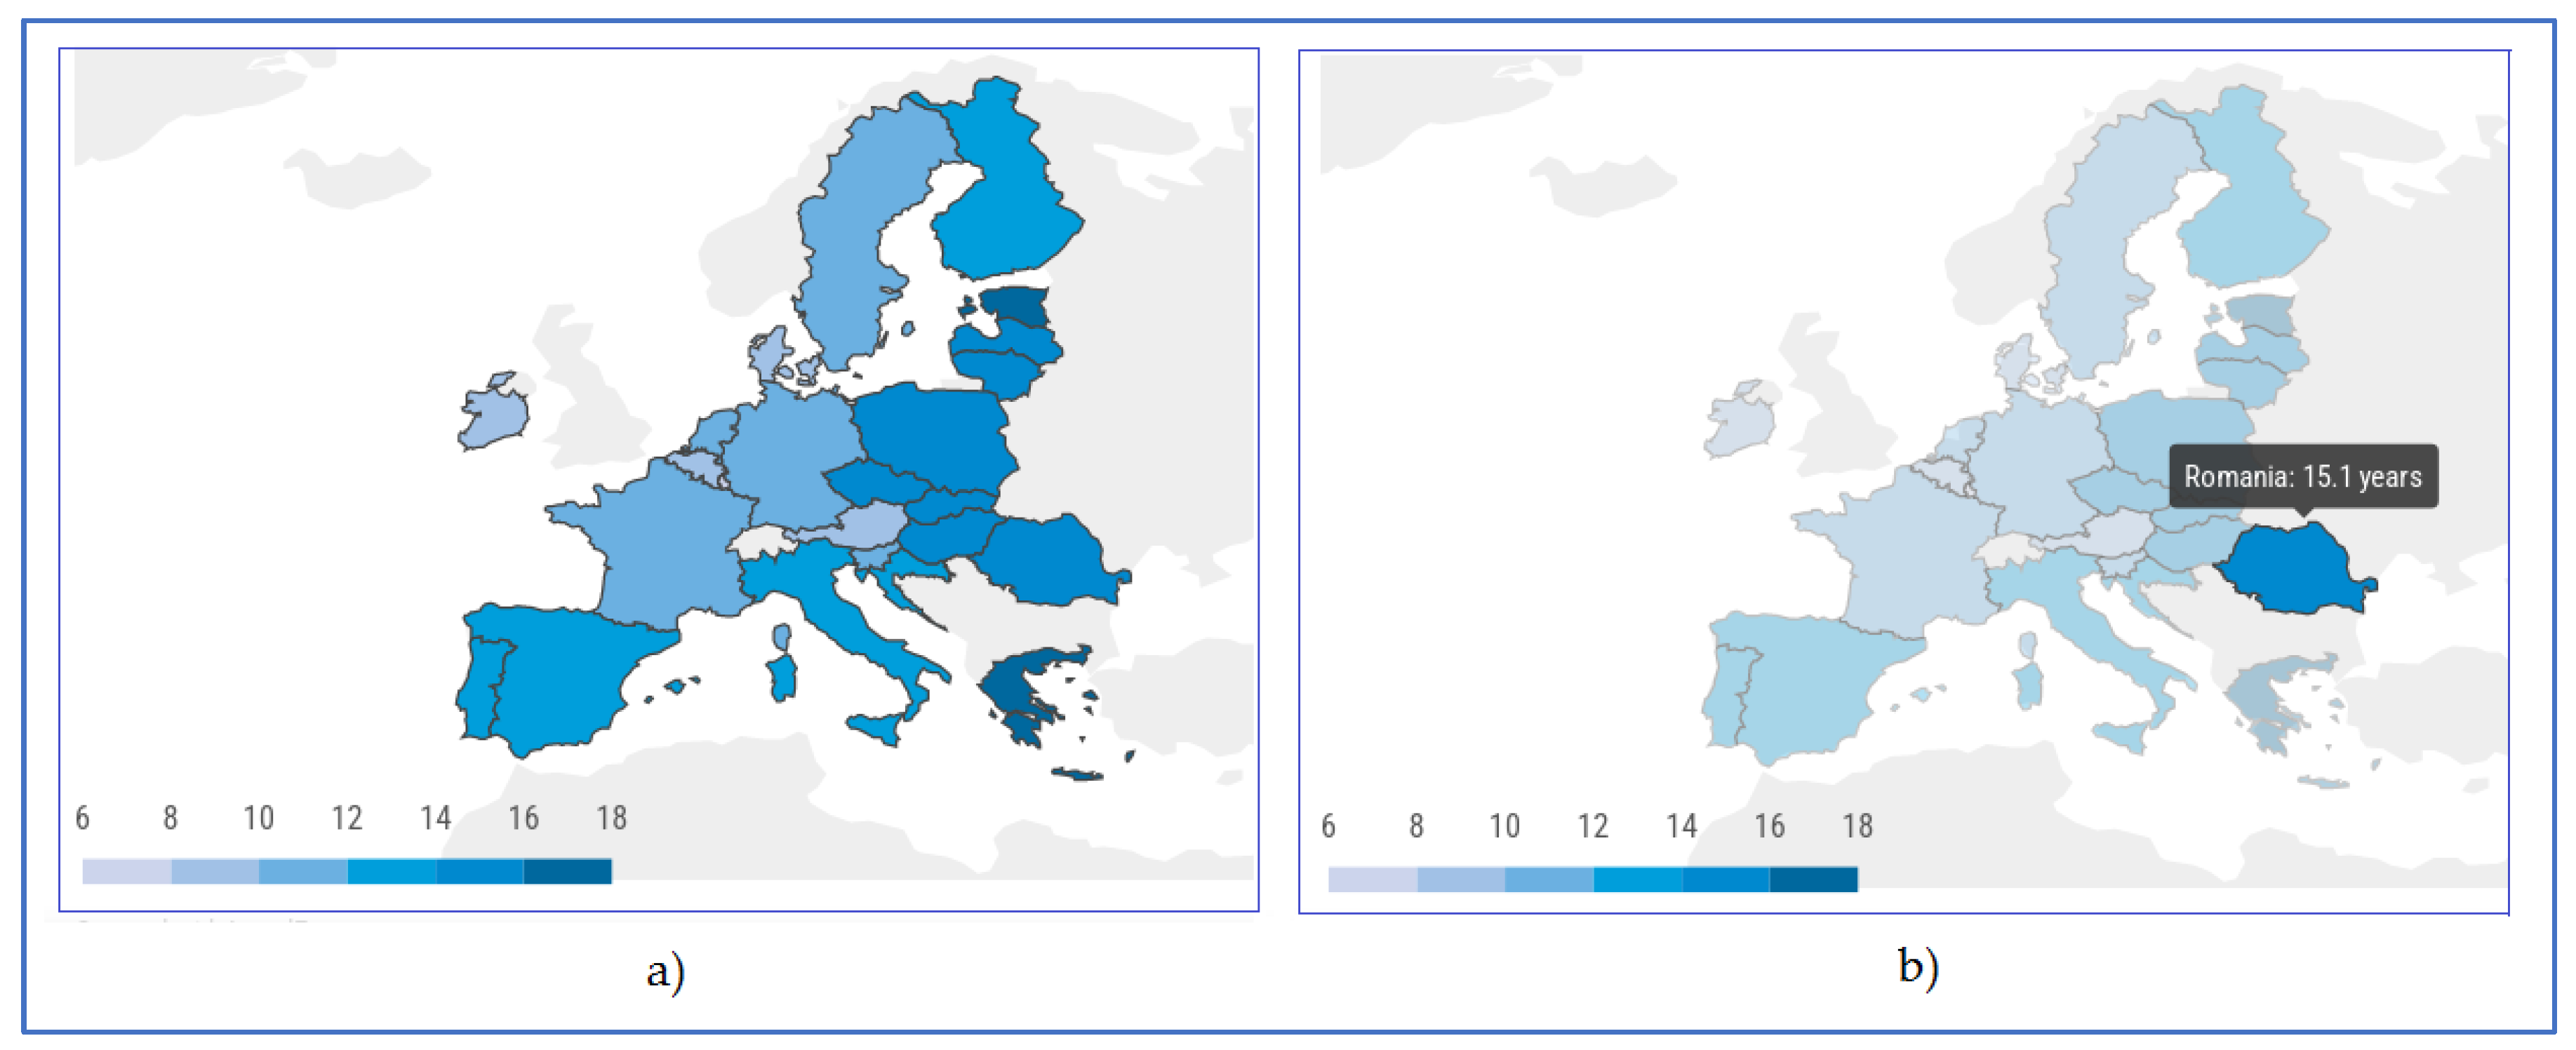
The need to implement such systems has come with the increase in the average age of vehicles in Europe. According to the interactive study by ACEA (Driving Mobility for Europe) [
2], the average age of vehicles in Europe ranges from about 10 years (in most European countries) to 17 years (in Greece), as shown in
Figure 1.
In Romania, Brasov city, where the research was conducted, the average age of vehicles is about fifteen years. Almost all the countries of Eastern Europe have similar values.
With the ongoing global climate crisis, the need to develop more effective technologies for carbon dioxide capture is increasing. Many systems have been studied and various technologies have been implemented, indicating a strong interest.
CO
2 Capture and Storage (CCS) technologies were developed to reduce carbon dioxide emissions from the coal, oil, and gas industries, as noted in [
3,
4,
5,
6,
7]. For example, paper [
8] presents different methods for selecting a more suitable application method for capturing and storing CO
2 to further improve the emission absorption efficiency.
For now, around 10% of CO
2 emissions has been utilized or converted through different means, like in article [
9] where a technology named Cross-borehole Electrical Resistivity Tomography (CHERT) by the authors has been implemented in the CO
2 Capturing and Storing field, in order to optimize the design of the ERT electrode arrays and corresponding working schemes for lab research experiments.
In one of the most recent studies presented in [
10], Wang et al. propose an upgrade to direct air capture (DAC) technology using the ultrasonic impregnation method to load Tetra-Ethylene-Pent-Amine (TEPA) onto Alumina (Al
2O
3) as the adsorbent. The TEPA-Al
2O
3 system was packed into the Rotating Adsorption Bed (RAB) to capture carbon dioxide from the air.
Of course, in the automotive industry, which represents one of the main polluters globally, research interest in reducing carbon dioxide emissions is very high. Many studies are based on carbon dioxide reduction from the exhaust gases of a spark ignition engine. The research from paper [
11] proposes that, for carbon dioxide reduction, a post-combustion capture system should be used (for a spark ignition engine). In a post-combustion capture system, carbon dioxide is absorbed using a Mono-Ethanol-Amine (MEA) absorption catalyst after combustion.
In another work [
12], Margull et al. propose a system comprising a membrane reactor (MR) with a carbon molecular sieve membrane (CMSM), followed by an adsorptive reactor (AR) for carbon dioxide pre-combustion capture.
Mixing different fuels is another solution for reducing carbon dioxide emissions. In paper [
13], the influence of hydrogen added to the natural gas or biogas fuel mixture is discussed. The mixture was used in spark ignition engines. The assembly with the fuel mixtures in the unit was equipped with a CO
2 removal system.
To summarize the techniques and technologies used by researchers from this field in the most recent publications that we have described in this section, we have provided observations regarding this research in
Table 1.
Our research is also based on a similar technology for reducing CO2 and other polluting compounds in road vehicles. It is important to emphasize that the proposed technology is particularly useful for used vehicles older than 10 years, which represent the largest share of vehicles in large cities in Eastern Europe.
The work addresses a very little-explored area in the automotive industry—reducing CO2 emissions by storing it in aqueous solutions. For the creation of an efficient filter, which also preserves the performance of the engine (power, torque), and whose costs are reasonable, no solution has yet been found. CO2 reduction by storage or reaction with other oxides is used in other branches of industry, but not for automotive or land-based applications to produce energy from fossil fuels. Thus, the work builds on established principles and proposes a solution to reduce CO2 emissions from combustion gases at relatively low cost, without negatively affecting the environment.
The novelty of the present study lies in the experimental validation of a low-cost, aqueous CaO–MgO-based CO
2 filtration system integrated directly into the exhaust line of an in-use spark ignition vehicle, without modifying the engine or fuel system. While CaO- and MgO-based carbonation reactions have been extensively investigated for CO
2 capture in industrial and stationary contexts, mainly under high-temperature or reactor-controlled conditions, as well as in laboratory-scale aqueous mineral carbonation systems [
14,
15,
16], their application under low-temperature, atmospheric pressure conditions typical of vehicle exhaust systems has received limited attention. Unlike conventional carbon capture approaches such as post-combustion absorption systems, membrane reactors, or direct air capture technologies, which are generally designed for centralized or large-scale operation [
17,
18], the proposed solution operates at idle engine conditions, making it suitable for older vehicles and static internal combustion engine applications.
Furthermore, this work introduces and experimentally evaluates the effect of the exhaust gas discharge distance relative to the reactive aqueous solution surface, identifying an optimal geometric configuration that reduces CO
2 concentration without causing significant increases in CO or NO
x emissions or unacceptable exhaust backpressure. Previous studies addressing carbonation-based CO
2 capture primarily focus on sorbent material development, reaction kinetics, and reactor-scale mass transfer phenomena [
19,
20], without considering geometric or operational optimization of gas–liquid interaction within a vehicle exhaust environment. To the authors’ knowledge, such an experimental investigation of exhaust–solution geometry applied to real spark ignition vehicle operation has not been previously reported in the literature.
2. Theoretical Assessment
There are various strategies for reducing carbon dioxide emissions from internal combustion engines. The technologies used in this field are presented in specialized publications [
21,
22,
23], so we can base our research on them. One of them, applicable to static systems (test stands and generators), is the use of carbon dioxide absorption solutions to remove carbon dioxide from exhaust gases. Calcium oxides and magnesium oxides in water-based solutions can be used in CO
2 reduction systems. The following basic carbonation reactions can be considered:
Those reactions can be used to separate CO
2 from exhausted gases at concentrations exceeding the required levels. Kinetic data on the reaction show that its rate is initially fast and controlled, but undergoes a sudden transition to a slower controlled diffusion regime. Moreover, the carbonation conversion decreases with the number of carbonation–calcination cycles. The interactions of CaO and CO
2 indicated that chemical adsorption occurs at temperatures between 25 °C and approximately 300 °C, while bulk carbonate formation occurs at higher temperatures [
21].
Oversaturation and the nucleation and growth of calcium carbonate crystals are possible due to carbon dioxide absorption [
15]. The limiting factor is considered the absorption rate. From this reaction, ammonia hydrolyzes, forming hydroxyl ions. By direct reaction between CO
2 and OH ions, bicarbonate ions will be formed, and after that, they will be transformed into carbonate ions. The last phase will be the reaction between Ca
2+ and CO
32−, in which CaCO
3 precipitates. The composition of the aqueous phase changes will also induce a change in the CO
2 solubility, which will affect the driving absorption force. The absorption rate of carbon dioxide in aqueous solutions will affect the chemical reaction rate between carbonate and calcium ions and will depend on the mass transfer coefficient, the equilibrium, and the actual carbon dioxide solubility [
21,
22]. When the absorption of CO
2 is accelerated, the precipitation rate will increase. Also temperature values will influence the course of calcium carbonate formation [
23].
An ideal carbon dioxide sorbent must have a high absorption capacity and fast kinetics at low CO
2 partial pressure, and, for sure, a high chemical stability. The sorbents used frequently are natural materials based on Ca, like limestone (CaCO
3) and dolomites (Ca, Mg (CO
3)
2), because they have a high initial capacity of absorption and the price is accessible. Natural sorbents exhibit rapid decay in absorption capacity during carbonation or calcination cycles [
24].
Magnesium oxide (MgO) is a mineral and is industrially obtained by calcining magnesite or dolomite, as well as hydroxide, nitrate, carbonate, oxalate, and even magnesium sulfate. In all cases, it results in a white powder that is a poor conductor of heat and electricity (calcined magnesia) [
25].
Due to its strong tendency to react with oxygen, magnesium can reduce many oxides, such as CO
2, SO
2, Al
2O
3, etc.
Magnesium oxide is obtained by direct oxidation of magnesium or by calcination of magnesium hydroxide, nitrate, or carbonate. MgO reacts with water to form magnesium hydroxide, a weak base:
Magnesium hydroxide dissolves very little in water; the aqueous solution is weakly alkaline. It is converted back to magnesium oxide at high temperatures [
19].
Calcium oxide, CaO, is also called slaked lime. It can be obtained using the methods to obtain MgO. It is a white, amorphous powder with a density of 3.16 g/cm
3. It reacts with water at a normal temperature [
25].
Calcium oxide has a high melting point of 2580 °C and reacts with water to form calcium hydroxide.
Calcium oxide, like any basic oxide, reacts with acetic anhydrides and acids. For example, it forms calcium carbonate with carbon dioxide:
Calcium hydroxide, Ca(OH)
2, is obtained by combining calcium oxide with water. The conversion of calcium oxide to calcium hydroxide will result in slaked lime. If calcium hydroxide is further treated with water, milk of lime is obtained. It partly consists of a solution of calcium hydroxide and a suspension of Ca(OH)
2 in water. The solubility of calcium hydroxide in water is low (at 20 °C, it is 0.129 g Ca(OH)
2/1000 g H
2O). Left longer in suspension (undissolved), it is deposited at the bottom of the vessel, and a clear solution of Ca(OH)
2, limewater, remains above. It has a strong basic character [
26].
A characteristic reaction of calcium hydroxide is the reaction with carbon dioxide when calcium carbonate is produced:
Calcium carbonate, CaCO
3, is one of the most common compounds in nature. It is a white substance, poorly soluble in water (solubility: 1.3 mg CaCO
3 in 100 g of water at 20 °C). Therefore, if Ca
2+ and CO
32− ions are present in the solution, a white, crystalline precipitate of calcium carbonate is formed [
17]:
If carbon dioxide is added, the precipitate disappears because calcium bicarbonate (calcium hydrogen carbonate) is formed, which is soluble:
The reaction is reversible. Carbon monoxide, CO, is formed from the incomplete combustion of fossil fuels.
CO is slightly reactive at normal temperatures. At temperatures above 700 °C, carbon monoxide burns in the air and carbon dioxide is produced:
The reaction is reversible. The reaction of CO with water vapors will also result in carbon dioxide [
27,
28]:
The reaction (14) will proceed to the right upon the addition of carbon dioxide to the system, according to Le Châtelier’s principle. Adding heat to the system favors the reverse reaction, i.e., calcination [
27,
28,
29]. So, the carbonation reactions cannot be accelerated by simple heating; rather, the temperature increase must be accompanied by a simultaneous increase in the amount of carbon dioxide [
28,
29].
The reaction is applicable to studies of carbon deposition in bodies of water, particularly the seas and oceans. The oceans have significant potential to capture anthropogenic carbon dioxide. The oceans contain a large amount of carbon dioxide gas. Under these conditions, ocean waters are a good solution for storing carbon dioxide produced by industrial activity, transport, and other sources. The problem with carbon storage processes has led to increased ocean acidity levels [
30,
31].
The process of storing carbon dioxide in the oceans involves introducing it under pressure and dissolving it in water at depths greater than 1000 m or on the ocean floor, but not at depths greater than 3000 m. CO
2 is introduced into the water by injecting or pumping the gas to the ocean floor. It is estimated that CO
2 will return to the atmosphere, as a result of storage, after long periods of time—hundreds or thousands of years. As a disadvantage of the solution, pumping carbon dioxide to the ocean floor is risky in the long term; the problem of greenhouse gases is a challenge for the future [
32,
33].
Another solution is carbonation, directly converting carbon from gas to a solid. Thus, an alternative is represented by the reactions of calcium and magnesium oxides, or the compound Mg
2SiO
4, with carbon dioxide, under high-pressure conditions [
28,
29,
30,
31,
32]. The equations for the transition of carbon from the gas phase to the solid phase are as follows:
Theoretically, MgCO3 can be used in industrial processes to store carbon dioxide at temperatures between 400 °C and 600 °C.
The method described earlier, the direct transformation of gas into solid, is theoretically simple and efficient. The direct gas–solid method has the disadvantage that it cannot be applied to specific transport and industrial applications, in general, due to slow kinetics and very low conversion rates [
31].
Another alternative is indirect carbonation (conversion from gas to solid by indirect processes). The advantage over aqueous solutions is the recovery of energy during carbonation: the exothermic heat of carbonation is recovered and used throughout the system, increasing the total energy input available. Lackner et al. [
34] have used magnesium and calcium oxides and hydroxides. Their tests showed that the carbonation process using CaO and Ca(OH)
2 occurs rapidly under high-temperature, high-pressure conditions. The problem was that the minerals used in the process, such as wollastonite, are relatively rare and expensive. Very good results were obtained when Mg(OH)
2 was used in the process and when minerals containing magnesium silicate were used. The process also required high temperatures and pressures. In the case of Mg(OH)
2 carbonation, a reversible dehydroxylation–rehydration reaction was used. Following the reaction, Mg(OH)
2 is converted into MgO and vice versa. These reactions are presented below [
34].
3. Methodology and Experimental Research Equipment
3.1. The Used Equipment
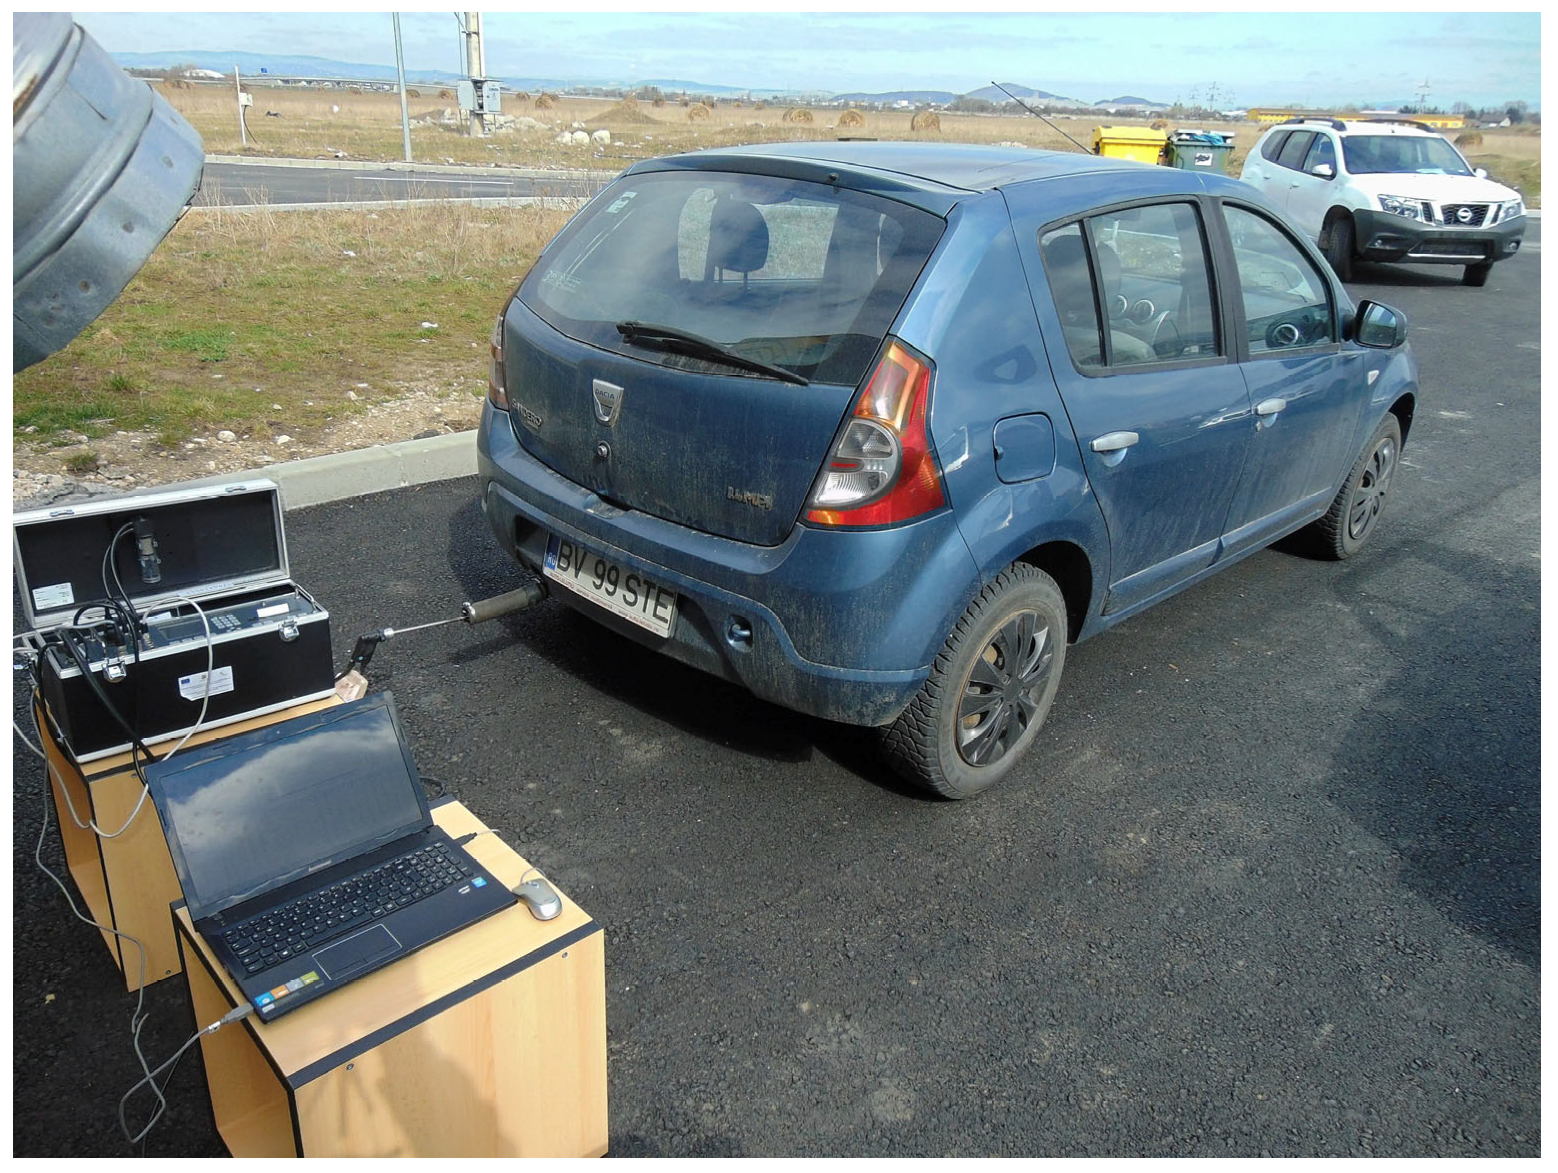
The experimental research was conducted by analyzing a vehicle about 15 years old, which is the average age of vehicles in Eastern Europe. The measurements were made with the portable analyzer, GA-21 plus (produced by Madur Wien, Austria [
35]), with the assembly shown in
Figure 2.
With the GA-21 plus, several tests were performed under the same temperature conditions, from engine start to the point at which the optimal operating temperature was reached. The vehicle’s engine was operated at idle speed for all measurements.
The GA-21 plus is a flue gas analyzer, used by the authors in several research analyses [
36,
37]. This apparatus uses electrochemical sensors to measure exhausted gas concentration. This type of analyzer is fitted with several types of sensors:
- -
The oxygen sensor (O2);
- -
The carbon monoxide sensor (CO);
- -
The nitric oxide sensor (NO);
- -
The sulphur dioxide sensor (SO2);
- -
The carbon dioxide sensor (CO2);
- -
The nitrogen oxides sensor (NOx).
The oxygen O
2, the nitric oxide NO, the carbon monoxide CO, and the sulphur dioxide SO
2 are measured directly by the analyzer with electrochemical cells. The other components will be calculated. The analyzer displays the carbon dioxide and oxygen concentrations as percentages. The remaining gas concentrations are shown in the following forms [
36]:
- -
In parts per million [ppm], the volume concentration;
- -
In [mg/m3], the absolute mass concentration;
- -
In [mg/m3], the mass concentration in relation to the O2 content.
The characteristic parameters of the inlet air are the environmental temperature and the exhausted gas temperature.
The analyzer calculates the following combustion parameters using the temperatures, the gas concentrations, and the used fuel properties:
- -
The Stack Loss (SL);
- -
The efficiency (h);
- -
The air excess coefficient (λ);
- -
The losses from the incomplete combustion (IL).
From measurements, the analyzer sensors detect the temperature and the concentrations of the gas elements. The sensors’ indications are directly proportional to the volume concentration of the detected elements, which are expressed in parts per million [ppm]. So, using direct measurement, the following are obtained:
- -
The flue gas temperature t expressed in [°C];
- -
The ambient temperature t0 expressed in [°C];
- -
The volume concentration of O2 expressed in [%].
- -
The volume concentration of CO expressed in [ppm];
- -
The volume concentration of NO expressed in [ppm];
- -
The volume concentration of SO2 expressed in [ppm].
The volume concentration of CO
2 cannot be obtained directly with a GA-21 plus analyzer, but it can be calculated from the measured maximum CO
2 concentration (CO
2max) and the O
2 concentration. The analyzer calculates the volume concentration of CO
2 with the following relation according to [
23]:
The exhausted gases contain nitrogen oxides, NO and NO
2. The GA-21 plus analyzer does not have a sensor for nitrogen dioxide measurement, but it does have a sensor for NO measurement. The NO
2 content can be calculated from the measured NO values. The NO in the exhaust is 95% of the total nitrogen oxides (NO
x). The GA-21 analyzer can calculate the total concentration of nitrogen oxides NO
x with the following relation according to [
33]:
By adding the concentration of NO to the NO
2 concentration, the NO
x concentration [
23,
33] will be
The used analyzer can also extract the mass concentration value in [mg/m3] from the concentration value in [ppm]. The mass concentration of the exhausted gas elements depends on their temperature and pressure. To compare measurement results, standard conditions parameters (standard temperature and pressure) are used, including the 1000 [hPa = 1 bar] pressure and 0 °C (273.15 K) temperature. The analyzer will indicate two values expressed in [mg/m3]: the absolute mass concentration and the mass concentration relative to oxygen.
Absolute mass concentration is defined by how many milligrams of a given gas are contained in a volume of 1 [m
3] of combustion gas at standard conditions (the standard value of pressure, p
0 =1000 hPa, and the standard value of temperature, T
0 = 273.15 K). The concentration value is obtained by multiplying the concentration expressed in [ppm] by a correction factor A.
Table 2 shows the correction factor A values for the analyzed exhausted gases.
The absolute mass concentration is computed using the following equation:
where CO expressed in [mg/m
3] is the absolute CO mass concentration from exhausted gases at the standard conditions, CO expressed in [ppm] is the absolute CO volume concentration in exhausted gases obtained from measurement, and A
CO is the correction factor.
3.2. The Testing Procedure
The tested vehicle was a Dacia Sandero, manufactured in Romania in 2009. The vehicle was equipped with a 1390 cm
3 spark ignition engine with 75 hp at 5500 rpm (
Figure 3).
The tests were conducted to evaluate exhaust gases from the cold start of the engine and from running (idle speed) until the engine reached optimal operating temperature. The data were automatically recorded every 10 s, and each test lasted 1050 s (17 min and 30 s). Tests 2–4 were carried out using the filtering system. For Test No. 2, the exhaust gases inside the filter were measured 10 mm above the reactive solution. For Test No. 3, the exhaust gases from the filter were collected at 30 mm above the reactive solution. For Test No. 4, the exhaust gases inside the filter were measured 20 mm above the reactive solution. All tests were carried out under similar conditions (temperature and atmospheric pressure). Data specific to the test of engines were collected: emissions (CO2, CO, NOx), ambient temperature, exhaust temperature, and the excess air coefficient from the exhaust gases.
The test conditions were similar for all tests. These were carried out on days with similar ambient temperatures (temperature, pressure, humidity). The days were not consecutive; suitable days for testing were chosen when the weather conditions were similar. The weather conditions for the four tests were as follows:
Test 1—Day 1—Ambient temperature 12.3 °C (54.1 °F); atmospheric pressure 761 [mmHg].
Test 2—Day 2—Ambient temperature 12.5 °C (54.5 °F); atmospheric pressure 759 [mmHg].
Test 3—Day 3—Ambient temperature 12.1 °C (53.8 °F); atmospheric pressure 765 [mmHg].
Test 4—Day 4—Ambient temperature 12.5 °C (54.5 °F); atmospheric pressure 767 [mmHg].
The tests were carried out by a team of two researchers (the authors of the paper, Stelian Tarulescu and Radu Tarulescu). The costs of carrying out the tests were approximately: making the filtering system—EUR 200; the fuel used—approx. EUR 50; equipment threads—EUR 20; labor—20 EUR/h × 10 h = EUR 200; data processing—20 EUR/h × 10 h = EUR 200. The costs were covered by the Research Center for High-Tech Products for Automotive at Transilvania University of Brasov.
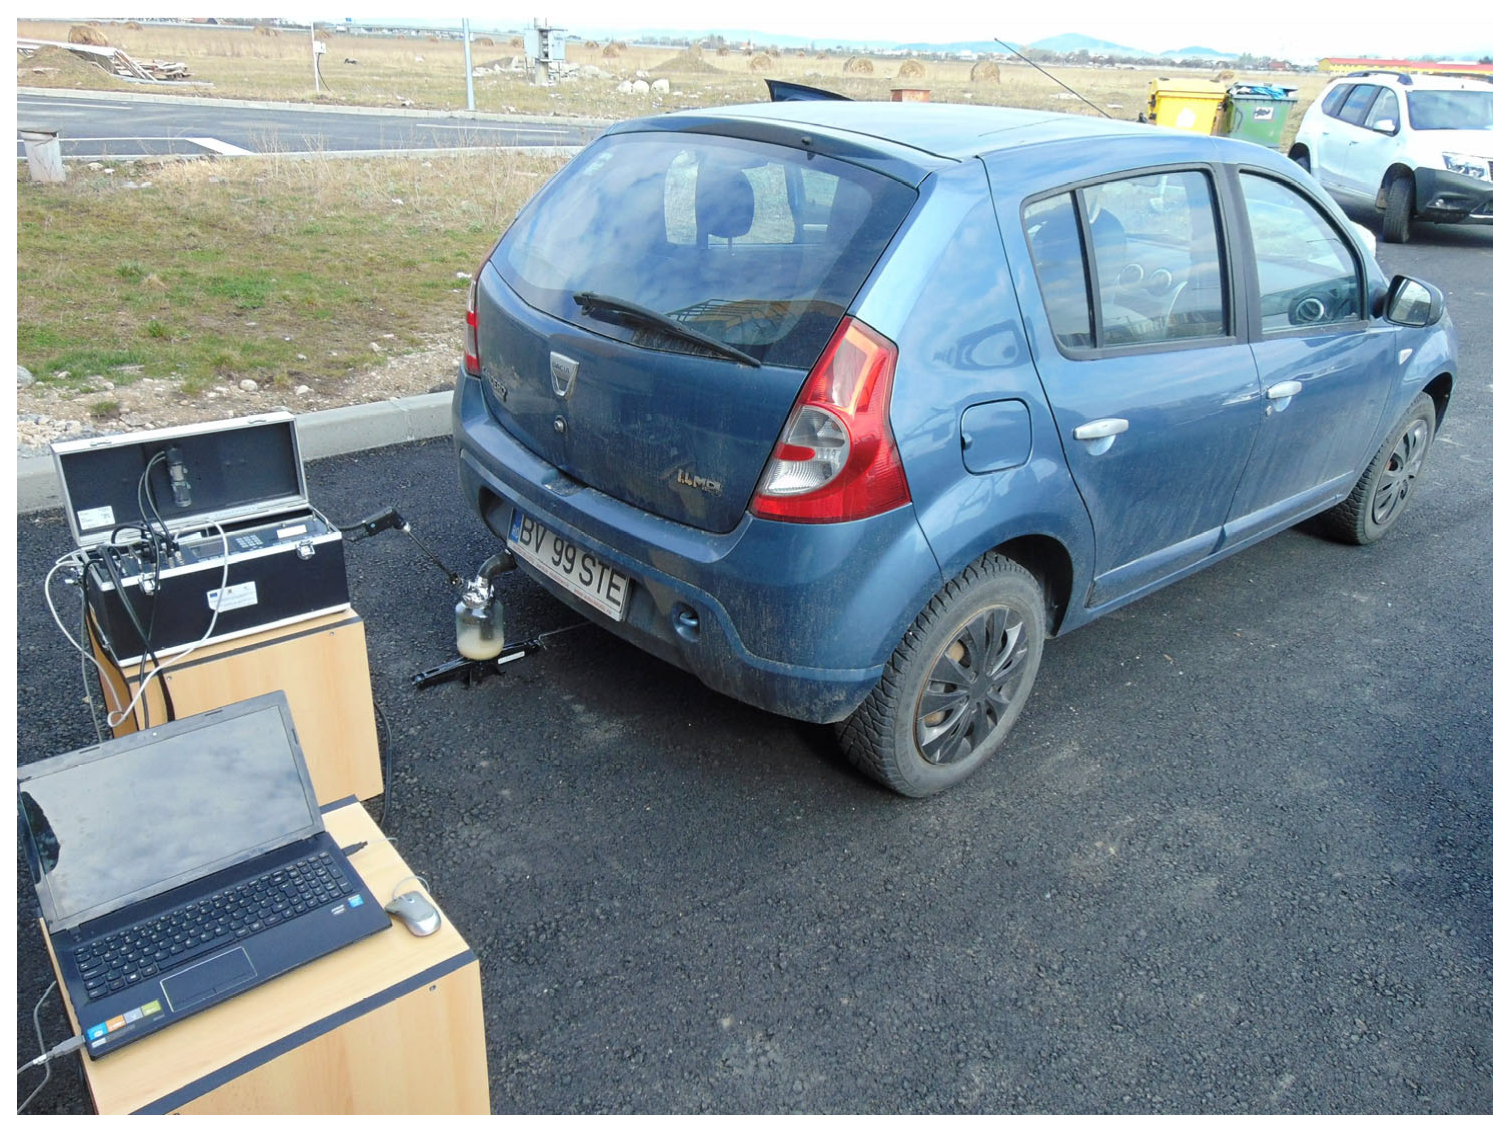
The filtration system was attached to the tested vehicle. The connection was made using the exhaust pipe adapter. The GA 21 Plus gas analyzer was commissioned in the testing perimeter. Its probe was inserted into the adapter protruding from the filtration system.
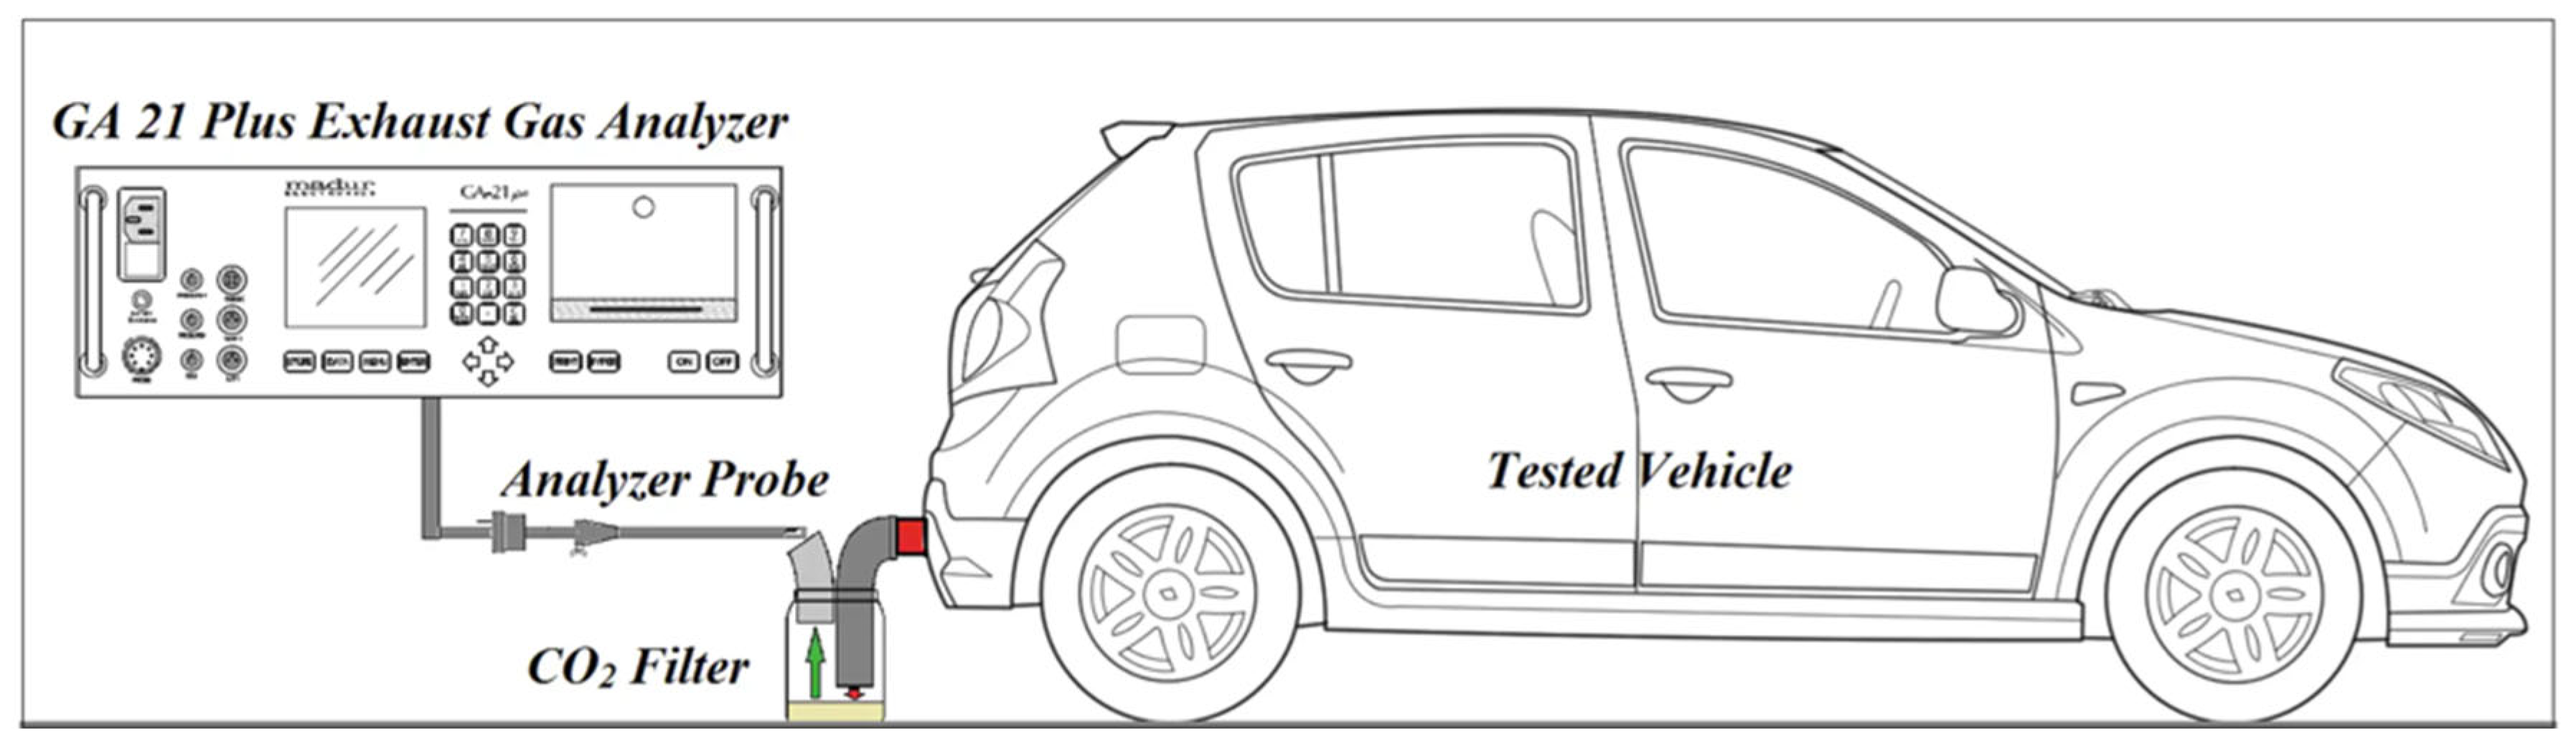
The equipment used is a gas analyzer from the Madur company, called GA 21 Plus. The equipment records flue gas emission values (O2, CO2, CO, NOx, SO2, etc.) and environmental values, such as ambient temperature and well temperatures, coefficient of excess air in the exhaust gases, and measurement efficiency (with Stack Loss). The analyzer measures ambient temperature for use in calculations, such as Stack Loss. The emissions are measured using electrochemical cells.
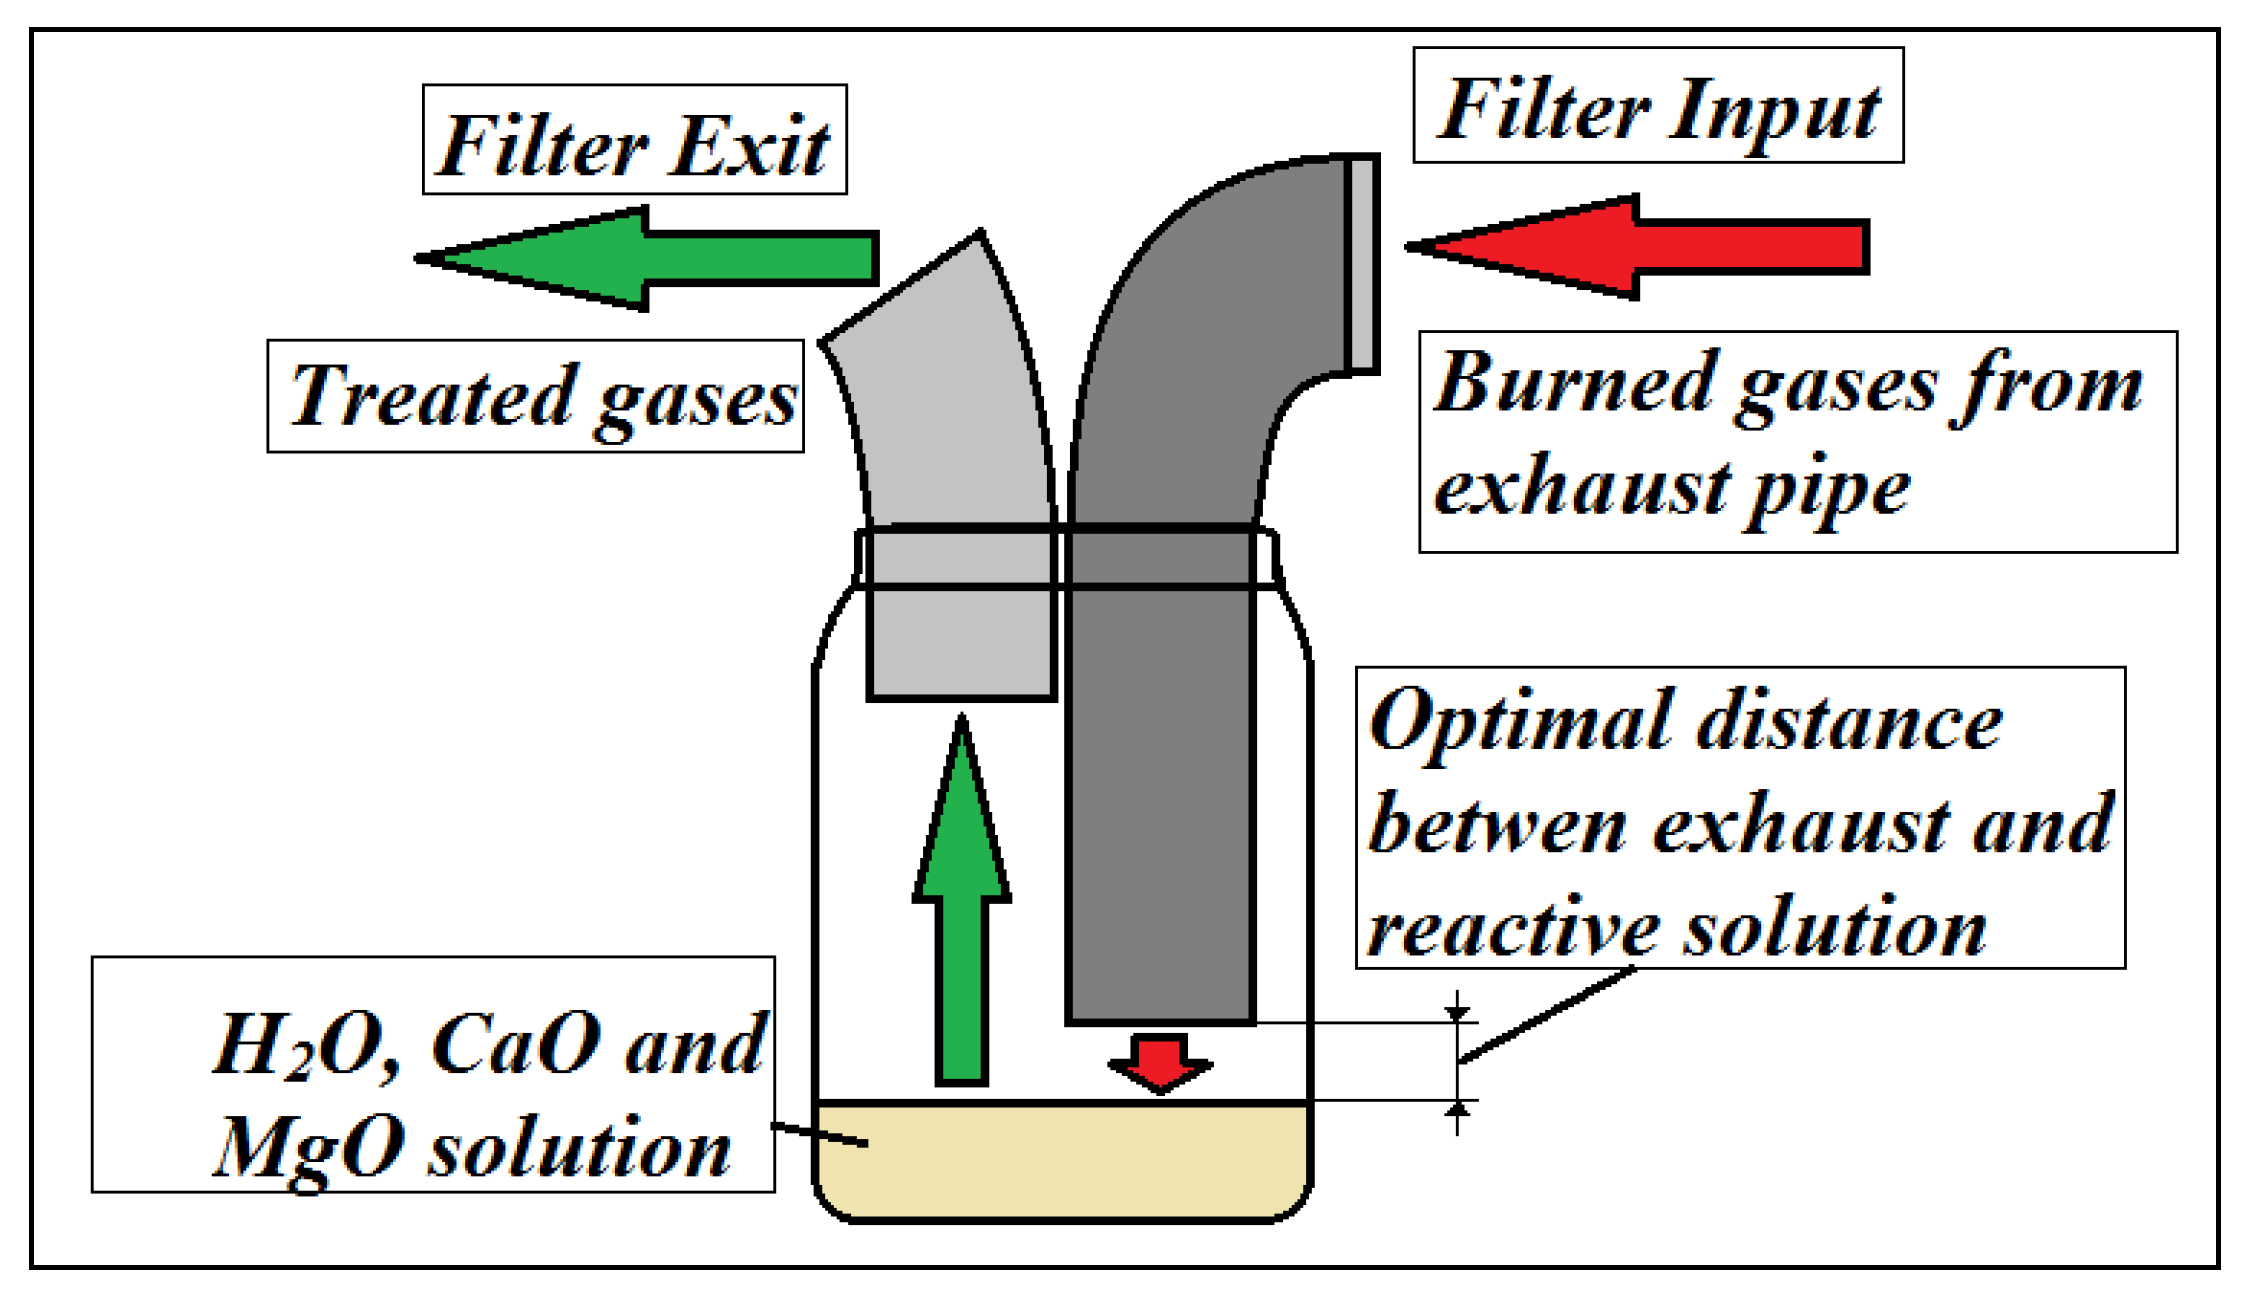
Figure 4 shows the diagram of the equipment and filtering system for data collection. The CO
2 filtration system proposed by the authors consists of a glass container with a 2000 cm
3 volume, in which 340 cm
3 of reactive aqueous solution (water containing CaO and MgO) was introduced. The solution was prepared using 20 g of powder consisting of 60% CaO and 40% MgO, dissolved in 0.33 L of water, and the result was an aqueous solution of calcium and magnesium hydroxides [
38], which was introduced into the filtration system:
On the filtration system, the following equipment is connected:
- -
An adapter for the exhaust pipe of the tested vehicle;
- -
An adapter for the probe of the measuring equipment.
The system was tested, and the modified parameter was the distance between the extension of the exhaust pipe (adapter for the exhaust pipe) and the surface of the reactive solution. Tests were performed for three values: 10 mm, 20 mm, and 30 mm. The filtration system and the way of varying the distance between the exhaust gases discharge and the surface of the aqueous solution are shown in
Figure 5.
The values of the main pollutants in the exhaust gases were recorded for each test. To highlight the filtration system’s efficiency, the evolution of carbon dioxide, carbon monoxide, and nitrogen oxides was monitored.
The tests were performed at idle speed, from cold start to optimal operating temperature.
The interaction of the exhaust gases with the tested solution results in a reduction in CO2 levels, with only small differences in CO and NOx levels between Test 1 (without a filter) and Test 4. No other environmental impacts were recorded as a result of the reduction reactions.
The efficiency with which the analyzer performs the measurement is expressed by the ETA parameter (Analyzer Efficiency) and is inversely proportional to the probe losses SL (Stack Loss). For the tests performed, the efficiency (ETA) ranged from 95.7% to 4.3%, with losses of up to 4.3%.
4. Results and Discussions
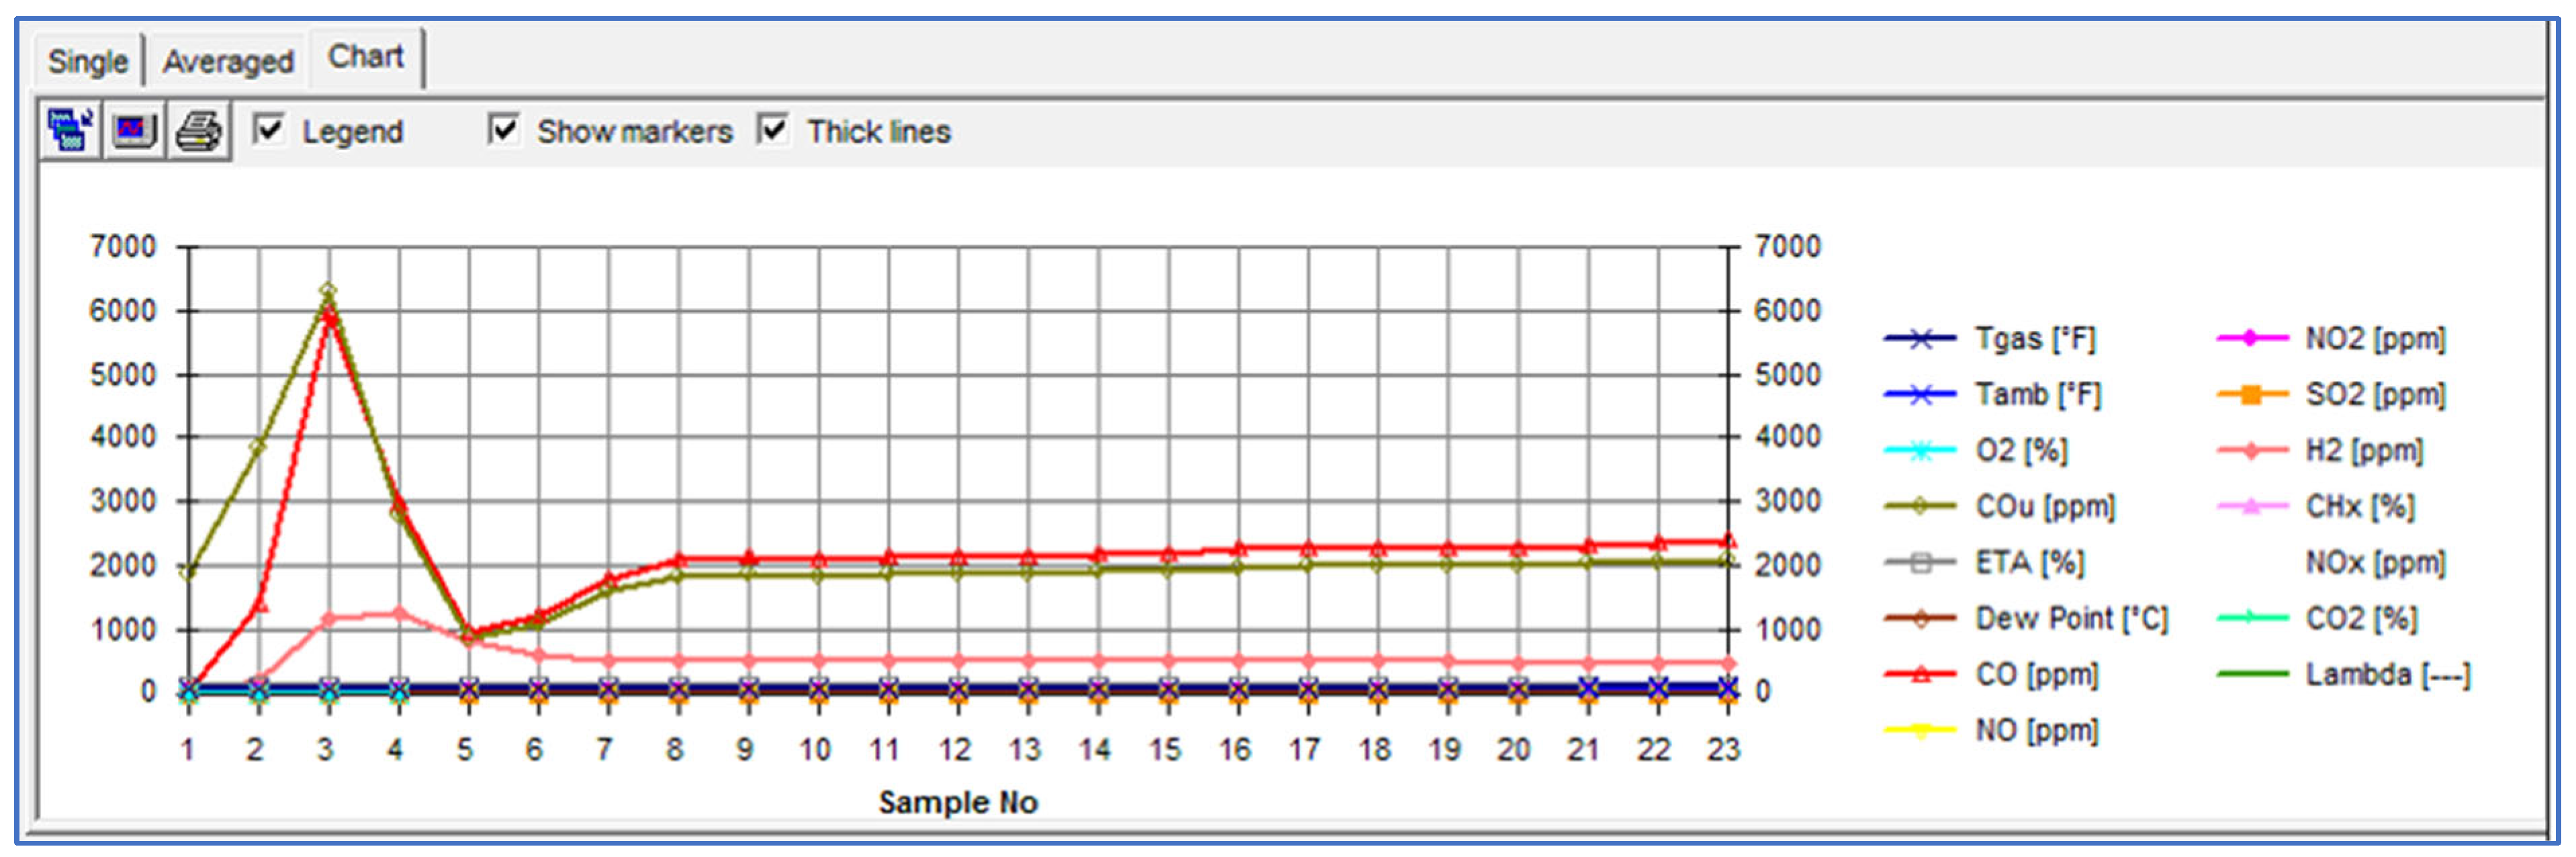
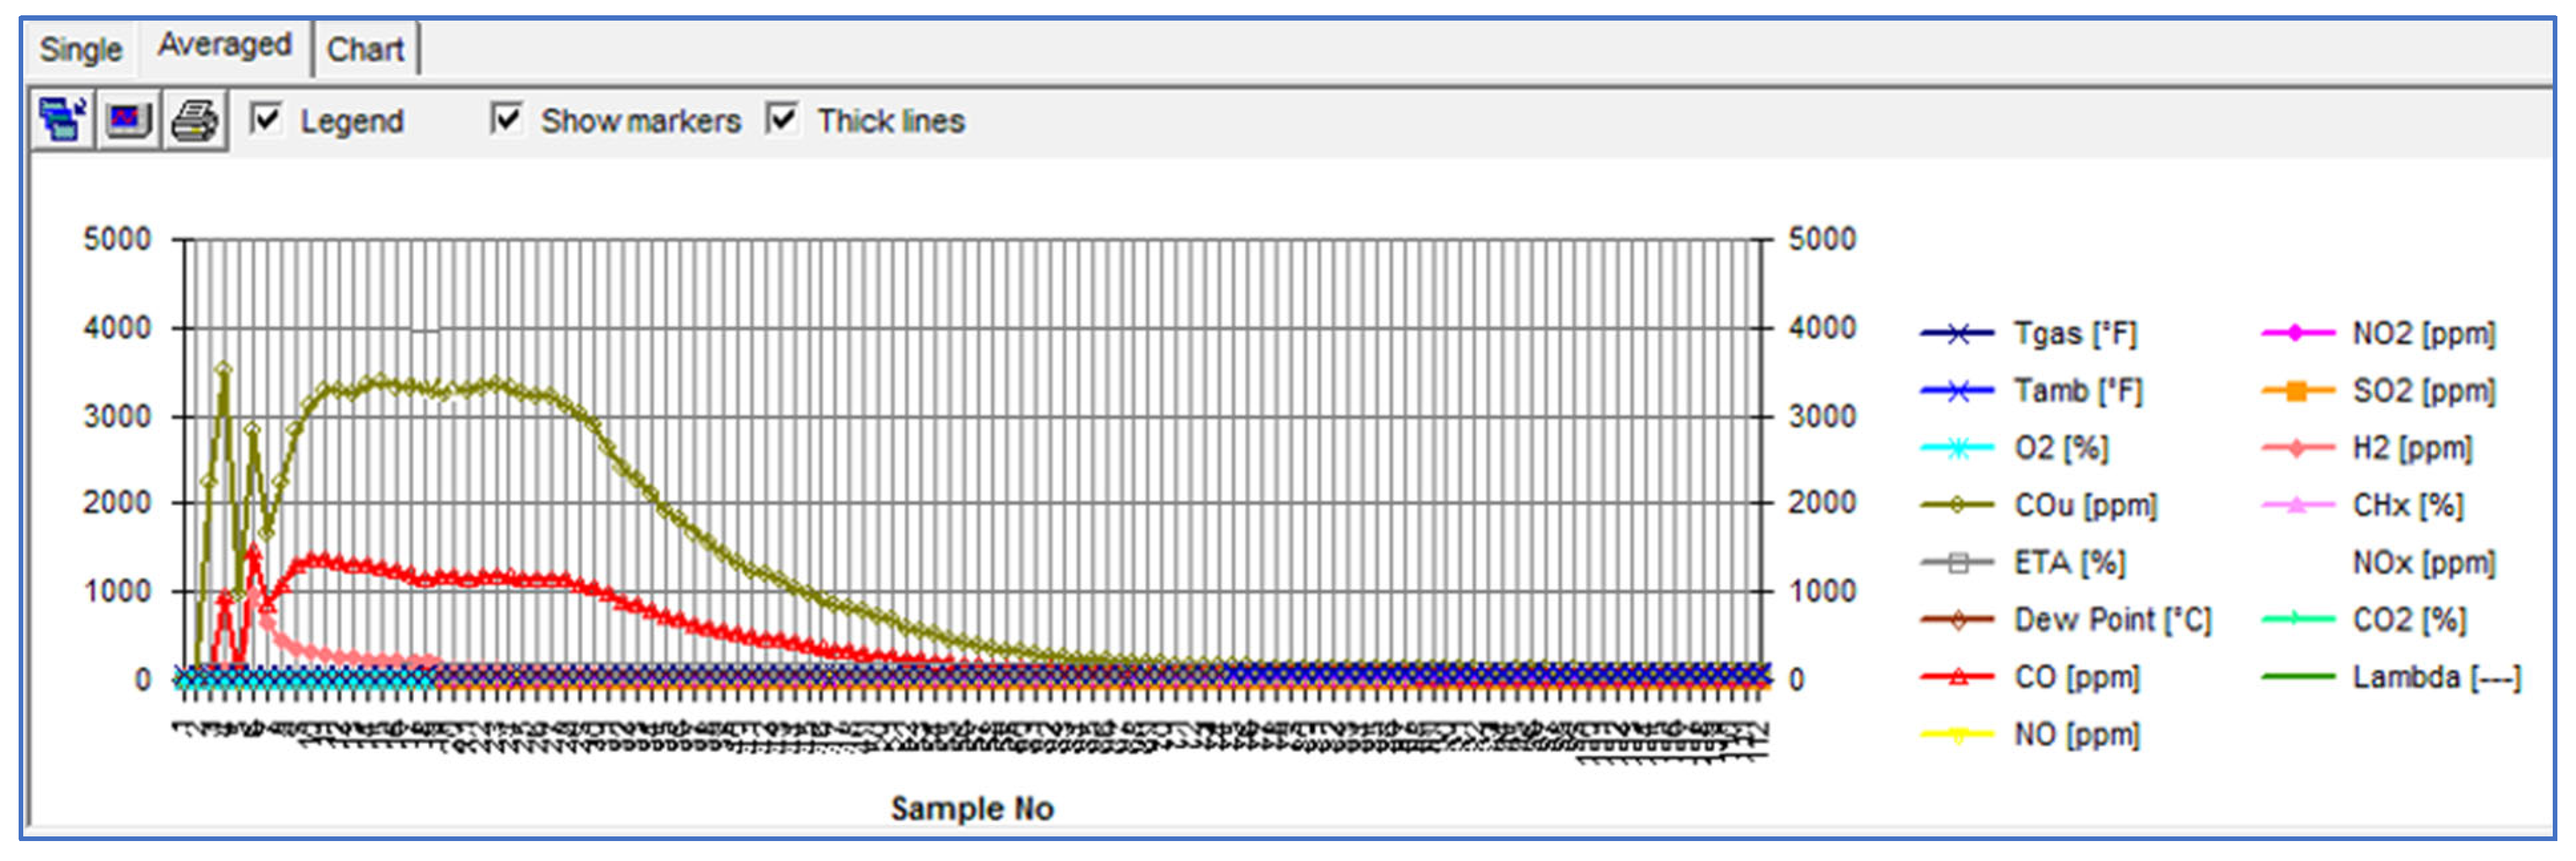
The data from the four tests were recorded. For example, the worksheets resulting from Test 1 (without filtration system—
Figure 5) and Test 4 (filtration system, exhaust distance from the reactive solution of 20 mm—
Figure 6) are presented below.
Figure 6 shows a screenshot of the equipment software during Test No. 1 after 230 s of testing. It is observed that when the engine starts cold, the CO and H
2 values are very high (specific to cold starting), then they decrease and stabilize. The disadvantage of viewing the graph in the software is the large differences in the rates of various emissions (or parameters), with only the very large variations visible. Variations in CO
2 or NO
x are not visible.
The worksheets for Tests 2 and 3 are not presented, as the most relevant comparison was made between Test 1 and Test 4.
For Test No. 4, a screenshot from the software is shown in
Figure 7. Large variations are also observed when starting cold for CO and H
2, but after the engine reaches optimal operating temperature, the values drop towards the minimum threshold.
The data from the four tests were processed, resulting in a worksheet that compares the CO2, CO, and NOx values for the four tests.
The test results (1, 2, 3, and 4) were summarized in an Excel worksheet. The data recorded by the equipment from engine cold and running (idle engine speed) were processed until the engine reached the optimal operating temperature. The data saved every 10 s was entered into the worksheet for each of the four tests. The duration of each test was 1050 s (17 min and 30 s). For each saved line, an order number was entered, from 1 to 105.
The excess air coefficient from the exhaust gases is also automatically recorded by the equipment. It varied depending on the test mode, from maximum to minimum values, as follows:
Test 1—Lambda ranged from 1.27 (at cold start) to 1.02 (at the end).
Test 2—Lambda ranged from 1.78 (at cold start) to 1.31 (at the end).
Test 3—Lambda ranged from 1.56 (at cold start) to 1.15 (at the end).
Test 4—Lambda ranged from 1.45 (at cold start) to 1.17 (at the end).
Exhaust back pressure is a relevant parameter in terms of the quality of the combustion processes in the engine and the quality of the exhaust gases for all tests, which varied as follows:
Testul 1—Exhaust back pressure varies from minimum (−0.01 hPa) to maximum (0.01 hPa).
Testul 2—Exhaust back pressure varies from minimum (−0.03 hPa) to maximum (0.09 hPa).
Testul 3—Exhaust back pressure varies from minimum (−0.03 hPa) to maximum (0.03 hPa).
Testul 4—Exhaust back pressure varies from minimum (−0.03 hPa) to maximum (0.02 hPa).
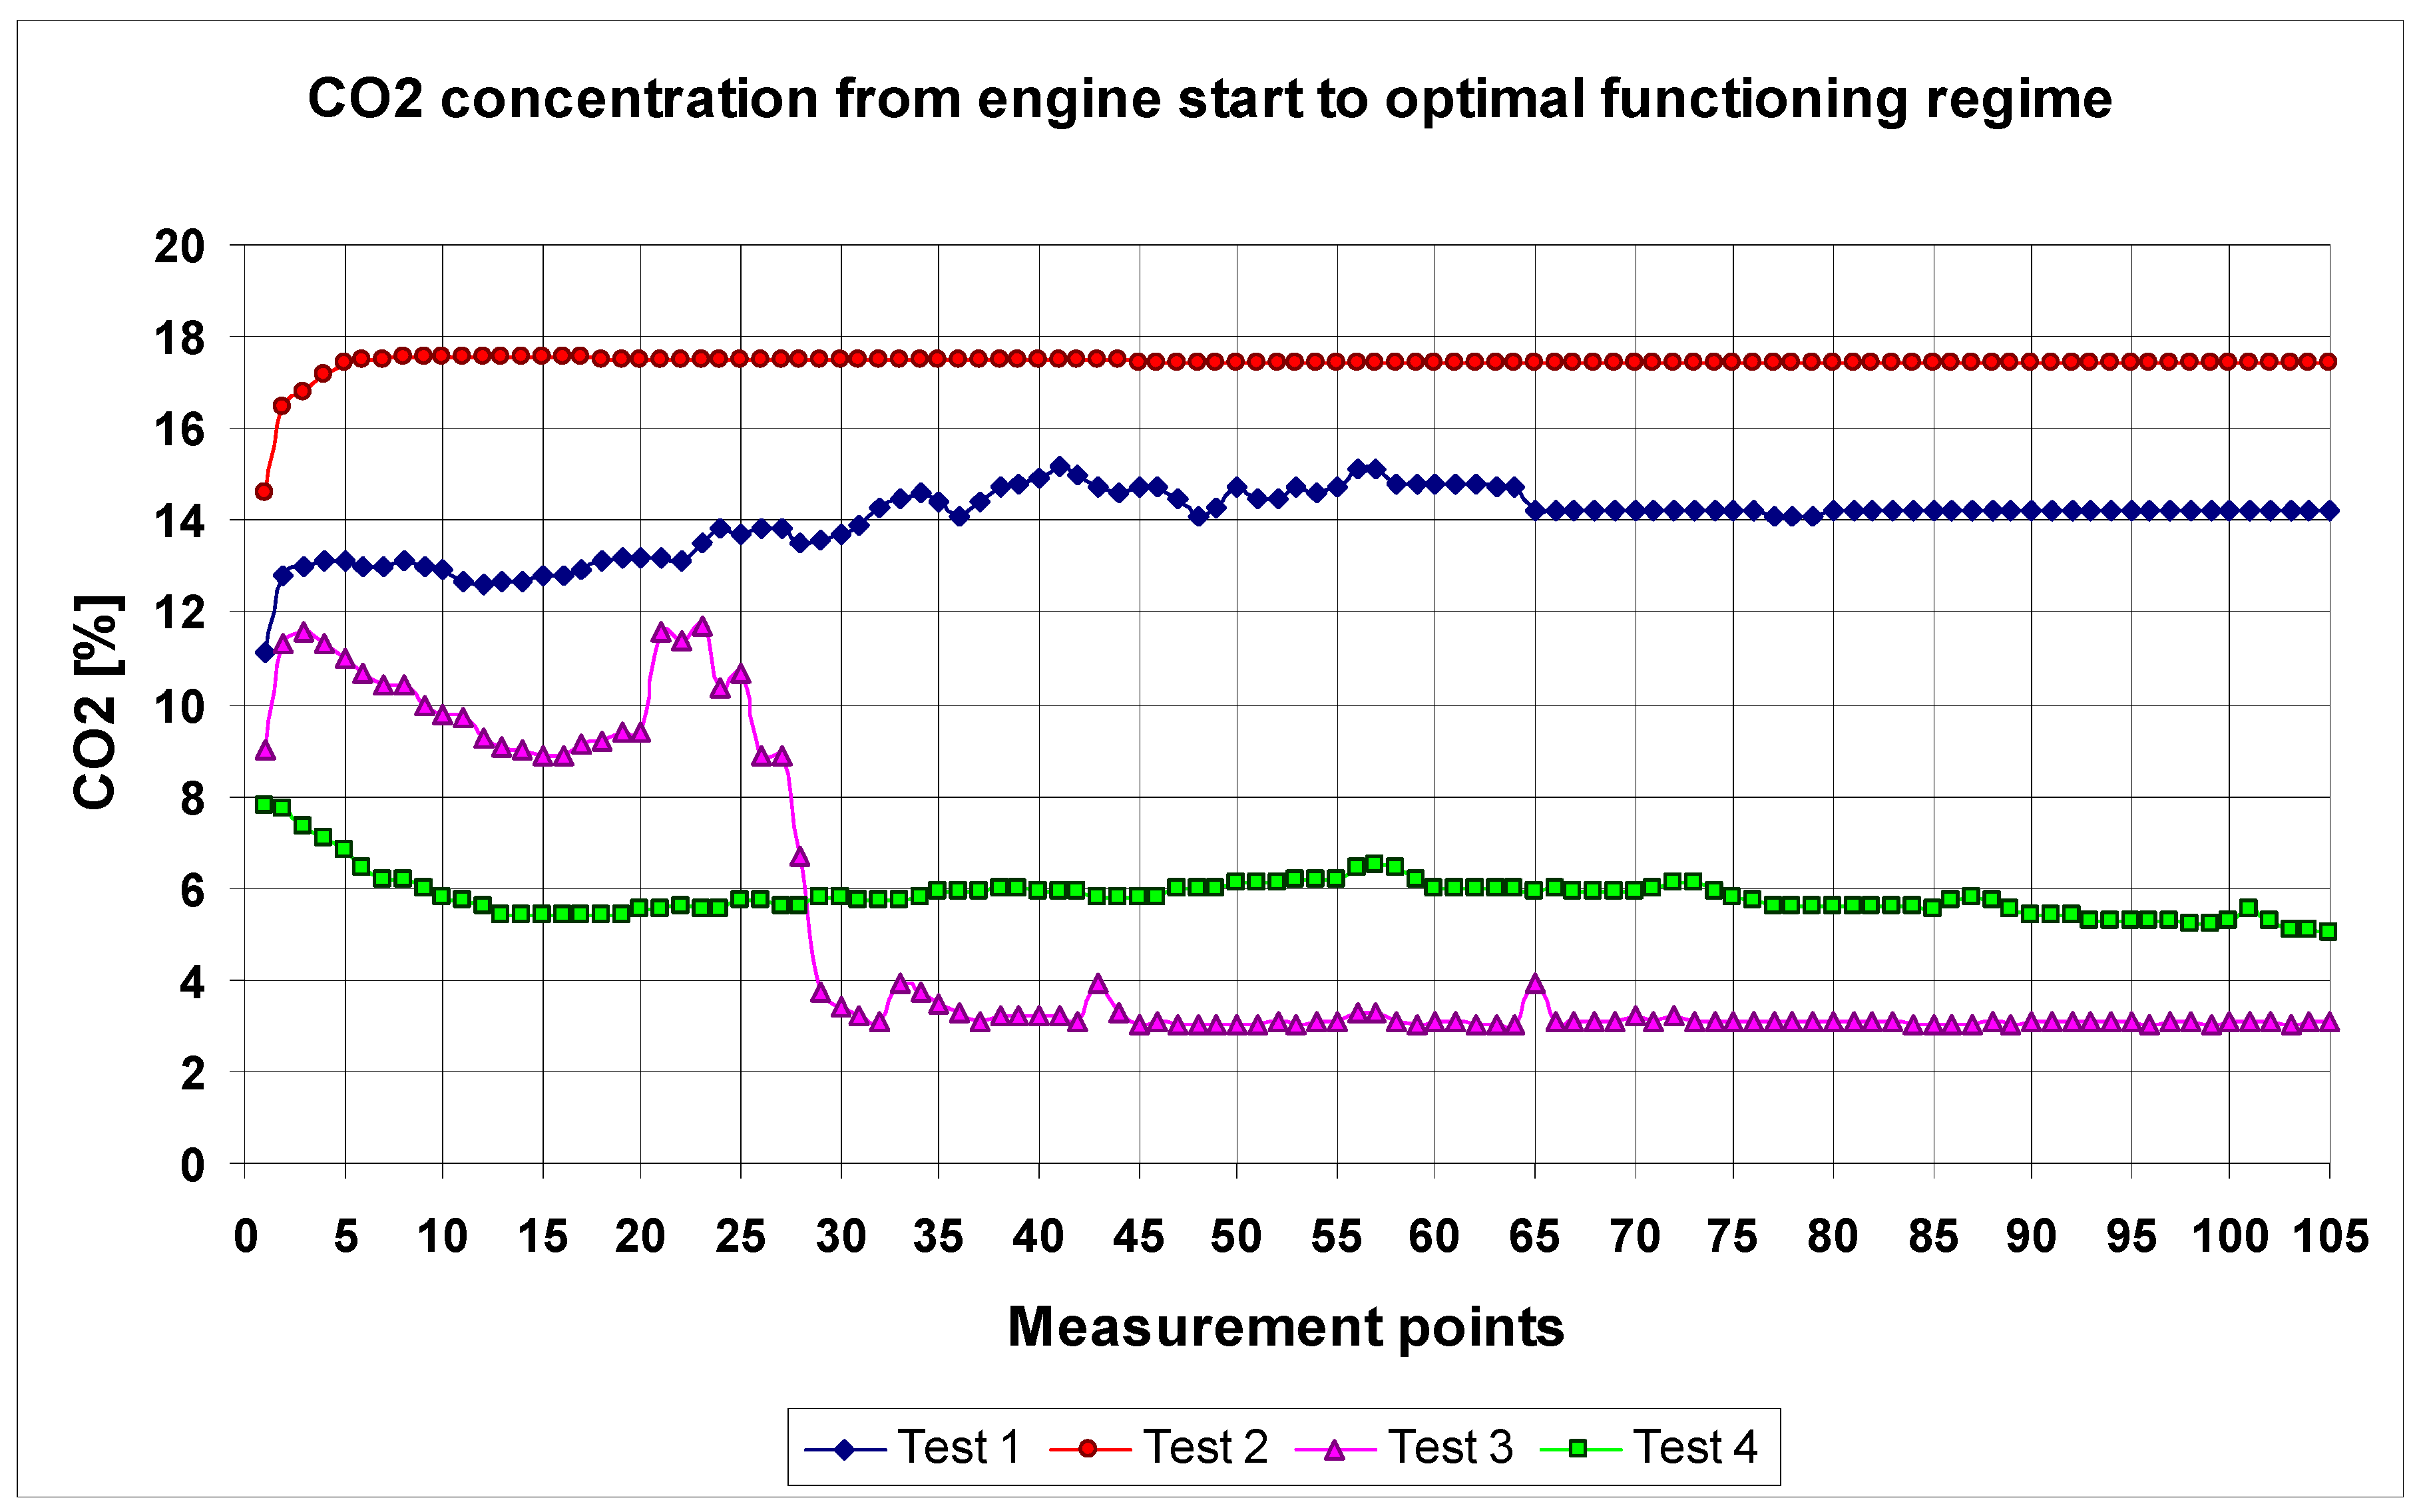
Figure 8 shows the CO
2 values (in percentages) measured for all tests. The measurement points (from 1 to 105) correspond to each set of values recorded by the equipment from the time the engine starts cold until it reaches optimal operating temperature.
Similarly, the developments in CO and NO
x are presented in
Figure 9 and
Figure 10, which are relevant to defining the quality of the exhaust gases in each test.
The evolution of carbon monoxide (CO) concentration shown in
Figure 9 highlights the influence of the filtration system configuration on incomplete combustion products. While the reference test without the filtration system exhibits the lowest overall CO levels, the results obtained with the filter indicate that exhaust backpressure and gas–liquid interaction conditions play an important role in CO formation. In particular, the elevated CO values observed in Test 2 can be attributed to the reduced distance between the exhaust outlet and the reactive solution surface, which led to increased flow resistance and less favorable exhaust gas evacuation.
In contrast, Test 4 demonstrates a more stable CO evolution throughout the test duration, suggesting that the selected exhaust-to-solution distance provides a suitable compromise between effective CO
2 reduction and minimal disturbance of the combustion process. To further assess whether the filtration system influences high-temperature combustion-related emissions, the evolution of nitrogen oxides (NO
x) concentration for all tests is analyzed and discussed in
Figure 10.
The values obtained from the tests were compared, and the following conclusions were reached:
- -
Compared to Test 1, the lowest CO2 values were obtained in Test 3. However, the minimum values were obtained only when the engine approached the optimal operating temperature.
- -
The optimal evolution of the CO2 concentration was recorded in Test 4. The values were low both during cold starting and during engine operation at temperatures close to optimal.
- -
In the case of CO, the optimal evolution was recorded in Test 1 when no filtration system was used. However, the minimum values for both cold starting and optimal engine operation were recorded in Test 4.
- -
The CO values recorded in Test 2 were very high due to the counter-pressure caused by the small distance between the exhaust pipe and the reactive solution. Also in Test 3, the CO values varied widely between the maximum and minimum.
- -
The lowest values were obtained in Test 4 for NOx. However, the small differences in the values obtained across all tests indicate a limited impact of the system on the formation of the fuel mixture.
The solution presented in this paper has a number of practical advantages: relatively low testing costs; low costs for the implementation of the filtration system (both the device and the solutions used); high accessibility regarding the procurement of the substances necessary for testing (substances often used in the agricultural industry as soil fertilizers); low impact on the environment both in the case of the construction of the filtration system and in the case of exploitation (the substances resulting from the reactions between the exhaust gases and the aqueous solution do not have an additional impact on the environment); high degree of generality regarding the use of the system in other applications (especially static ones—thermal systems, generators, etc.); CO and NOx values do not change their evolutions much in the case of the use of the filtration system (only the optimal constructive solution for the filtration system must be identified); there is the possibility of testing alternative fuels; and the functional parameters of the engine are not substantially influenced.
As disadvantages of the presented solution, we mention the following: it is not yet a portable solution to be practical for driving vehicles tests; no relevant engine load tests have yet been carried out due to equipment losses (similar but new equipment is yet to be purchased); a limitation of the equipment is the lower performance of the unburned hydrocarbon sensor, an emission that needs to be monitored; the test procedure does not cover various operating regimes (testing will continue on the AVL stand); vehicles equipped with LPG or CNG have not yet been tested; no relevant tests have been carried out for supercharged engines, nor the influence on EGR systems, particulate filters, or catalysts (we will develop test procedures, but also for experimental engines on the stand).
Comparing our results with those of other researchers, we can say that a solution has been identified to reduce CO2 emissions by storing it in aqueous solutions. The results are not spectacular, but they confirm the processes used industrially or in other technical fields, different or complementary to the automotive industry. CO2 reduction through storage benefits static applications, but an on-board system for cars can be developed in the future.
A notable advancement in direct CO
2 mitigation for spark ignition engines is the adaptation of post-combustion carbon capture (PCC) systems on the exhaust stream. The study by Santosh and Vinith Kumar [
11] provides experimental evidence for this method, implementing the PCC unit downstream of the engine exhaust. The system used monoethanolamine (MEA), a widely studied chemical absorbent for carbon capture, to selectively absorb CO
2 from the exhaust gas stream. MEA reacts with CO
2 to form ammonium carbonate compounds, effectively removing CO
2 from the exhaust before atmospheric release. An empty section in the exhaust manifold served as a residence chamber, increasing contact time between exhaust gases and absorbent, a critical factor in maximizing capture efficiency. The experiment demonstrated a measurable reduction in CO
2 emissions from the SI engine with the PCC system in place, confirming that a post-combustion absorption process can capture a portion of carbon dioxide even after combustion has occurred. Although this method does not eliminate carbon generation at the source, it prevents a significant part of the CO
2 from entering the atmosphere, thus reducing the effective carbon footprint.
While post-combustion capture targets CO
2 after it forms, Janusz-Szymańska et al. [
13] advocate a dual approach involving both emission control (incorporating after-treatment systems such as carbon capture, exhaust treatment, and hybridization to reduce net emissions) and fuel efficiency improvements (improving thermodynamic efficiency through advanced engine calibration). This combined strategy recognizes that a single mitigation mechanism is unlikely to achieve substantial decarbonization: efficiency gains alone reduce fuel consumption, but a carbon capture component directly addresses emissions still produced. The dual method is advantageous because there are parallels approaches in stationary power plants (where carbon capture is paired with efficiency upgrades) and it offers flexibility across application scales. In particular, mild hybridization and advanced combustion strategies can reduce fuel consumption, while post-combustion systems capture the CO
2 that remains unavoidable.
These findings suggest a multi-pronged strategy: improving engine efficiency and reducing fuel consumption, while capturing residual CO2 before it enters the atmosphere, providing a robust pathway to decarbonize spark ignition engines, especially where rapid electrification is infeasible.
Research in the field of carbon dioxide storage has similar results, with different applications for which they are used, the substances used, and the costs required. The present study introduces these CO2 reduction methods in the field of internal combustion engines as well, being of interest mainly from the perspective of the simplicity of the proposed system and the reduced costs of reacquisition and use.
5. Conclusions
The number of vehicles older than 10 years is increasing in European countries, with the average age about 12 years. In Eastern European countries, the average age is even higher, around fifteen years. To ensure vehicles’ compliance with pollution standards, the authors proposed a filtration system for combustion gases of a spark ignition engine. Spark ignition engines remain widely used in light-duty road vehicles, backup generators, and small power generation units. Despite advancements in electrification, engines still contribute significantly to the global carbon footprint due to the combustion of hydrocarbon fuels and subsequent emissions of CO2, the primary greenhouse gas driving global warming. Reducing the carbon footprint of spark ignition engines is therefore imperative not only for Eastern European cities’ air quality but also for global climate mitigation strategies.
In our research, to reduce CO2 concentration in exhaust gases without increasing other specific oxides, a filter operating with a reactive aqueous solution (H2O, CaO, and MgO) was designed and tested. The proposed system applies to vehicles older than ten years whose pollutant emissions no longer comply with the environmental standards. The filter was tested on a vehicle equipped with a 1390 cm3 spark ignition engine (Dacia Sandero model from 2009), of 75 hp.
In this case, it is important to adjust the distance between the end of the exhaust pipe and the reactive solution. Thus, a reference test was performed without a filter, and three tests with a filter were performed, with the exhaust distance from the reactive solution varying.
Following the detailed analysis of the values obtained from the four tests, it can be concluded that the system is efficient, especially when the distance between the exhaust pipe and the reactive solution is adjusted to the optimal value of 20 mm.
The tests will continue on experimental engines from test stands, both spark ignition and compression ignition engines. Alternative fuel mixtures will also be tested to verify the filtration system’s efficiency under as many conditions as possible.
The design will be patented, and a project will be started to create a prototype filter for use primarily in static applications with internal combustion engines: test stands for engines and generators. Subsequently, an attempt will be made to develop a prototype filter for use on vehicles.
After the research, we have identified a viable solution to reduce CO2 emissions from the combustion of fossil fuels. The solution was developed as a system that reduces CO2 from vehicle exhaust gases (tests conducted on a vehicle equipped with a spark ignition engine), but it can also have applications in static systems. The main advantage of the system is its low construction, testing, and operational costs. Also a great advantage is access to the solutions necessary for the system’s realization, which are readily available on the market. It is very important that the system does not have a negative impact on the environment, and can also be used in urban areas. The disadvantages related to testing modes, applicability, and on-board running vehicle testing will be reduced through further research and testing, as well as the purchase of new equipment in the future.
Reducing the CO2 footprint of spark ignition engines remains a critical challenge in the global effort to combat climate change. While the automotive industry moves toward electrification, spark ignition engines continue to dominate in many applications, especially in regions where infrastructure or economic constraints delay the adoption of electric alternatives. Ultimately, no single technology provides a complete solution. A multi-faceted approach, combining operational efficiency, carbon capture, and supportive regulatory policies, is essential for achieving meaningful reductions in the carbon footprint of SI engines. These strategies serve as vital bridges in the transition toward a low-carbon transport sector, and with our experimental research, we want to contribute towards sustainability.