1. Introduction
Road safety remains a major global concern. The Global Status Report on Road Safety revealed that in 2021, around 1.19 million people lost their lives in road traffic accidents, with 92% of these fatalities occurring in low- and middle-income countries [
1]. Several factors contribute to this high accident rate, such as excessive speeding, driver distractions, driving under the influence of alcohol or drugs, poor road infrastructure, vehicle defects, and driver skills [
1]. A driver’s ability to control the vehicle in a critical situation significantly influences the severity of the accident.
Braking is a vital aspect of vehicle control, enabling drivers to manage speed and react to unexpected dangers. Braking behavior varies depending on the situation and the driver’s reaction time. Common types include normal braking, anticipatory braking, and emergency braking. Emergency braking or hard braking refers to sudden, forceful braking, typically performed in emergency situations to avoid collisions. While this reaction can be lifesaving, it often comes with negative side effects. For example, emergency braking can cause loss of vehicle stability, especially on wet, slippery, or uneven surfaces, which may increase the risk of skidding, rollover, or triggering a rear-end collision if the following vehicle is too close. Studies in [
2,
3] show a moderate correlation between emergency braking events and historical crash accidents, with approximately 1 crash/mile for every 147 emergency braking events [
3]. In addition, frequent emergency braking may reflect aggressive driving habits [
3]. Understanding braking patterns can help identify drivers who are more prone to the risk of a traffic incident. Furthermore, ref. [
2] suggests that clusters of emergency braking events can serve as early indicators of future collisions, allowing for targeted interventions to mitigate accident risks and enhance road safety.
While there are numerous studies that discuss crash detection systems [
4,
5,
6,
7,
8], only a few have been proposed to track and analyze braking, such as studies in [
9,
10,
11,
12]. These studies analyze braking patterns using post-processing [
9], telematics data analysis [
10], and machine learning models [
11,
12]. These methods are typically linked to sensors that detect variations in acceleration and speed patterns, such as a Global Positioning System (GPS) sensor [
10] and accelerometers, either used alone or in combination with gyroscopes [
11,
13]. GPS sensors provide spatial and temporal contexts. They offer location data for each braking event, enabling researchers and traffic authorities to map high-risk areas. GPS also tracks vehicle speed before and after braking, facilitating an understanding of how rapidly speed is reduced during deceleration. Furthermore, time-stamped route information allows analysts to associate braking behavior with specific road types, traffic conditions, and time-of-day patterns. However, relying solely on GPS for braking detection also has its limitations, mainly due to the low accuracy of speed estimation provided by GPS. Meanwhile, in [
9,
11,
12,
13], braking detection is based on accelerometers, either used alone or in combination with gyroscopes. Accelerometers, which measure changes in velocity over time, are particularly effective in capturing the dynamic aspects of braking. They can detect the intensity of braking through deceleration magnitude, typically expressed in meters per second squared or g-force, and identify hard or emergency braking events, which are marked by sudden, sharp decelerations often associated with emergency situations or aggressive driving. Additionally, accelerometers can measure the frequency and duration of braking episodes, offering insights into driving patterns and potential safety risks. In [
11,
12], emergency braking is detected using accelerometer data fed to machine learning and artificial neural network algorithms. However, these algorithms usually require considerably high computation loads, which becomes a major concern in the context of real-time and embedded applications.
While accelerometers are highly effective for braking monitoring, several challenges arise due to the accelerometer’s inherent characteristics. One of the primary issues is their high sensitivity to vibrations, which can lead to false positives in braking detection. Road irregularities, vehicle suspension movement, and engine vibrations can generate acceleration signals that resemble emergency braking events. Even with sophisticated neural network algorithms, normal driving movements can still be misclassified as emergency braking, speed bumps, or zig-zag movements as described in [
11]. Additionally, accelerometers exhibit drift and bias, particularly in long-term measurements [
14]. Small errors in orientation or sensor placement can accumulate over time, leading to incorrect estimations of deceleration and braking intensity [
15]. Another challenge is shock response, where abrupt impacts can cause sudden spikes in acceleration readings (such as when a vehicle hits potholes), making it difficult to distinguish genuine braking events from external disturbances [
16].
Unlike the study in [
11] that deals with multiclass classification, this paper attempts to tackle a binary classification problem. This paper proposes an algorithm for detecting emergency braking and non-emergency braking events based on accelerometer and gyroscope signals. To achieve efficient computation, the algorithm incorporates a simple pre-processing filter and a classical statistics method. Instead of using artificial intelligence techniques, the proposed algorithm applies a simple moving average and finds the relationship between accelerometer and gyroscope peak magnitudes that differentiates emergency braking from other events. The use of a moving average, instead of a low-pass filter as in [
11], is effective and computationally more efficient. The effects of different window lengths on the moving average are presented and discussed. The proposed algorithm shows that emergency braking signals possess a unique characteristic that sets them apart from events, such as regular braking, crossing damaged roads, and speed bumps. Furthermore, unlike prior studies that required sensors to be positioned in fixed orientations [
14,
15], the algorithm proposed in this study introduces a novel advantage by enabling users to place the sensor in any direction. In addition, the proposed braking detection algorithm can be used in applications, such as early warning systems that notify fleet management when emergency braking is detected, indicating the potential for an accident.
2. Related Works
Accident detection systems have evolved significantly through the integration of various sensors such as accelerometers, gyroscopes, and GPS. Numerous studies have explored different sensor configurations and algorithms to improve the accuracy and reliability of accident detection mechanisms. For instance, the study in [
4] utilized an accelerometer not only to detect accidents but also to determine if a vehicle had rolled over. A mercury switch was also incorporated to detect and count instances of hard braking. The accelerometer, in a stationary vehicle, remained in a zero-g position with a stable output of approximately 1.65 V, which corresponded to a digital value of 338. Deviations from this value during vehicle roll indicated a rollover. For hard braking, the mercury switch functioned by completing an electrical circuit through inertia-driven contact closure during abrupt deceleration, prompting a falling-edge interrupt in the microcontroller to register the event.
Similarly, ref. [
17] adopted a threshold-based method using accelerometer data, where values exceeding 3092 (approximately 30 G) indicated a collision. The study employed a conversion formula, g-force = 0.0108 × val − 3.4, to interpret raw sensor data and further examined how varying road conditions, such as smooth or rough surfaces, influenced these readings. Furthermore, the study in [
18] introduced the use of a limit switch to complement accelerometer and GPS readings. Positioned at the front and rear of the vehicle, the limit switch reliably indicated collision events through contact-based electrical triggers.
A different approach was taken in [
19], which implemented the SW-420 vibration sensor—a seismic detector capable of producing logic-high signals (2.5–5 V) when the intensity of vibration surpassed a predefined threshold. This method provided a cost-effective solution for identifying significant impacts. In the same year, ref. [
5] developed a classification system based on g-force intensity using accelerometers. Impacts were categorized as mild (5–20 G), moderate (20–40 G), or severe (>40 G), while values below 5 G were deemed non-accidents. This stratified approach enabled the system to assess collision severity and inform appropriate response mechanisms.
A study in [
6] employed the MPU-6050 (TDK InvenSense), a three-axis accelerometer and gyroscope module, for refined accident detection. The system relied on specific thresholds—tilt angles exceeding 80 degrees on the X-axis and 70 degrees on the Y-axis and vibration levels over 4000 mV/G—to confirm severe accidents. Meanwhile, ref. [
7] proposed a hybrid method combining a sudden speed drop of over 20 km/h within three seconds, a tilt angle change greater than 15 degrees, and a crash signal to determine if an accident occurred. The system also assessed the vehicle’s motion status post-deceleration; if it had stopped completely, the event was classified as an accident.
Further advancements were made in [
20], which introduced high-frequency data sampling, capturing acceleration readings every 2 ms. The algorithm used calculated the vector sum of acceleration across all three axes, comparing the total to a set threshold to identify abrupt changes in force that indicated a collision. This allowed for more responsive, real-time detection. Lastly, ref. [
8] presented a multi-sensor fusion approach involving accelerometers, gyroscopes, and vibration sensors. The system determined the magnitude of motion by computing the distance between two points in three-dimensional space, based on changes in the x, y, and z coordinates. It also derived orientation angles to standardize the data. The gyroscope measured angular velocity to verify collision events, while threshold values were calibrated using sensor sensitivity to ensure precise detection. This comprehensive method enhanced the reliability of accident detection by confirming data from motion, orientation, and impact sensors.
Table 1 shows a summary of the related works.
In contrast to the related studies that have been discussed, which focused on developing accident detection systems for situations where a collision or accident had already occurred, this study proposes an algorithm to detect both emergency and non-emergency braking based on accelerometer and gyroscope signals before an accident takes place. This approach allows the system to function as an early warning application, indicating the potential risk of a collision or accident. Additionally, the proposed algorithm allows sensors to be oriented in any direction without intensive computation, making the system easily adaptable to brake detection systems in various types of four-wheeled or larger vehicles.
4. Results and Discussions
Table 2 shows the acquired data distribution of various events.
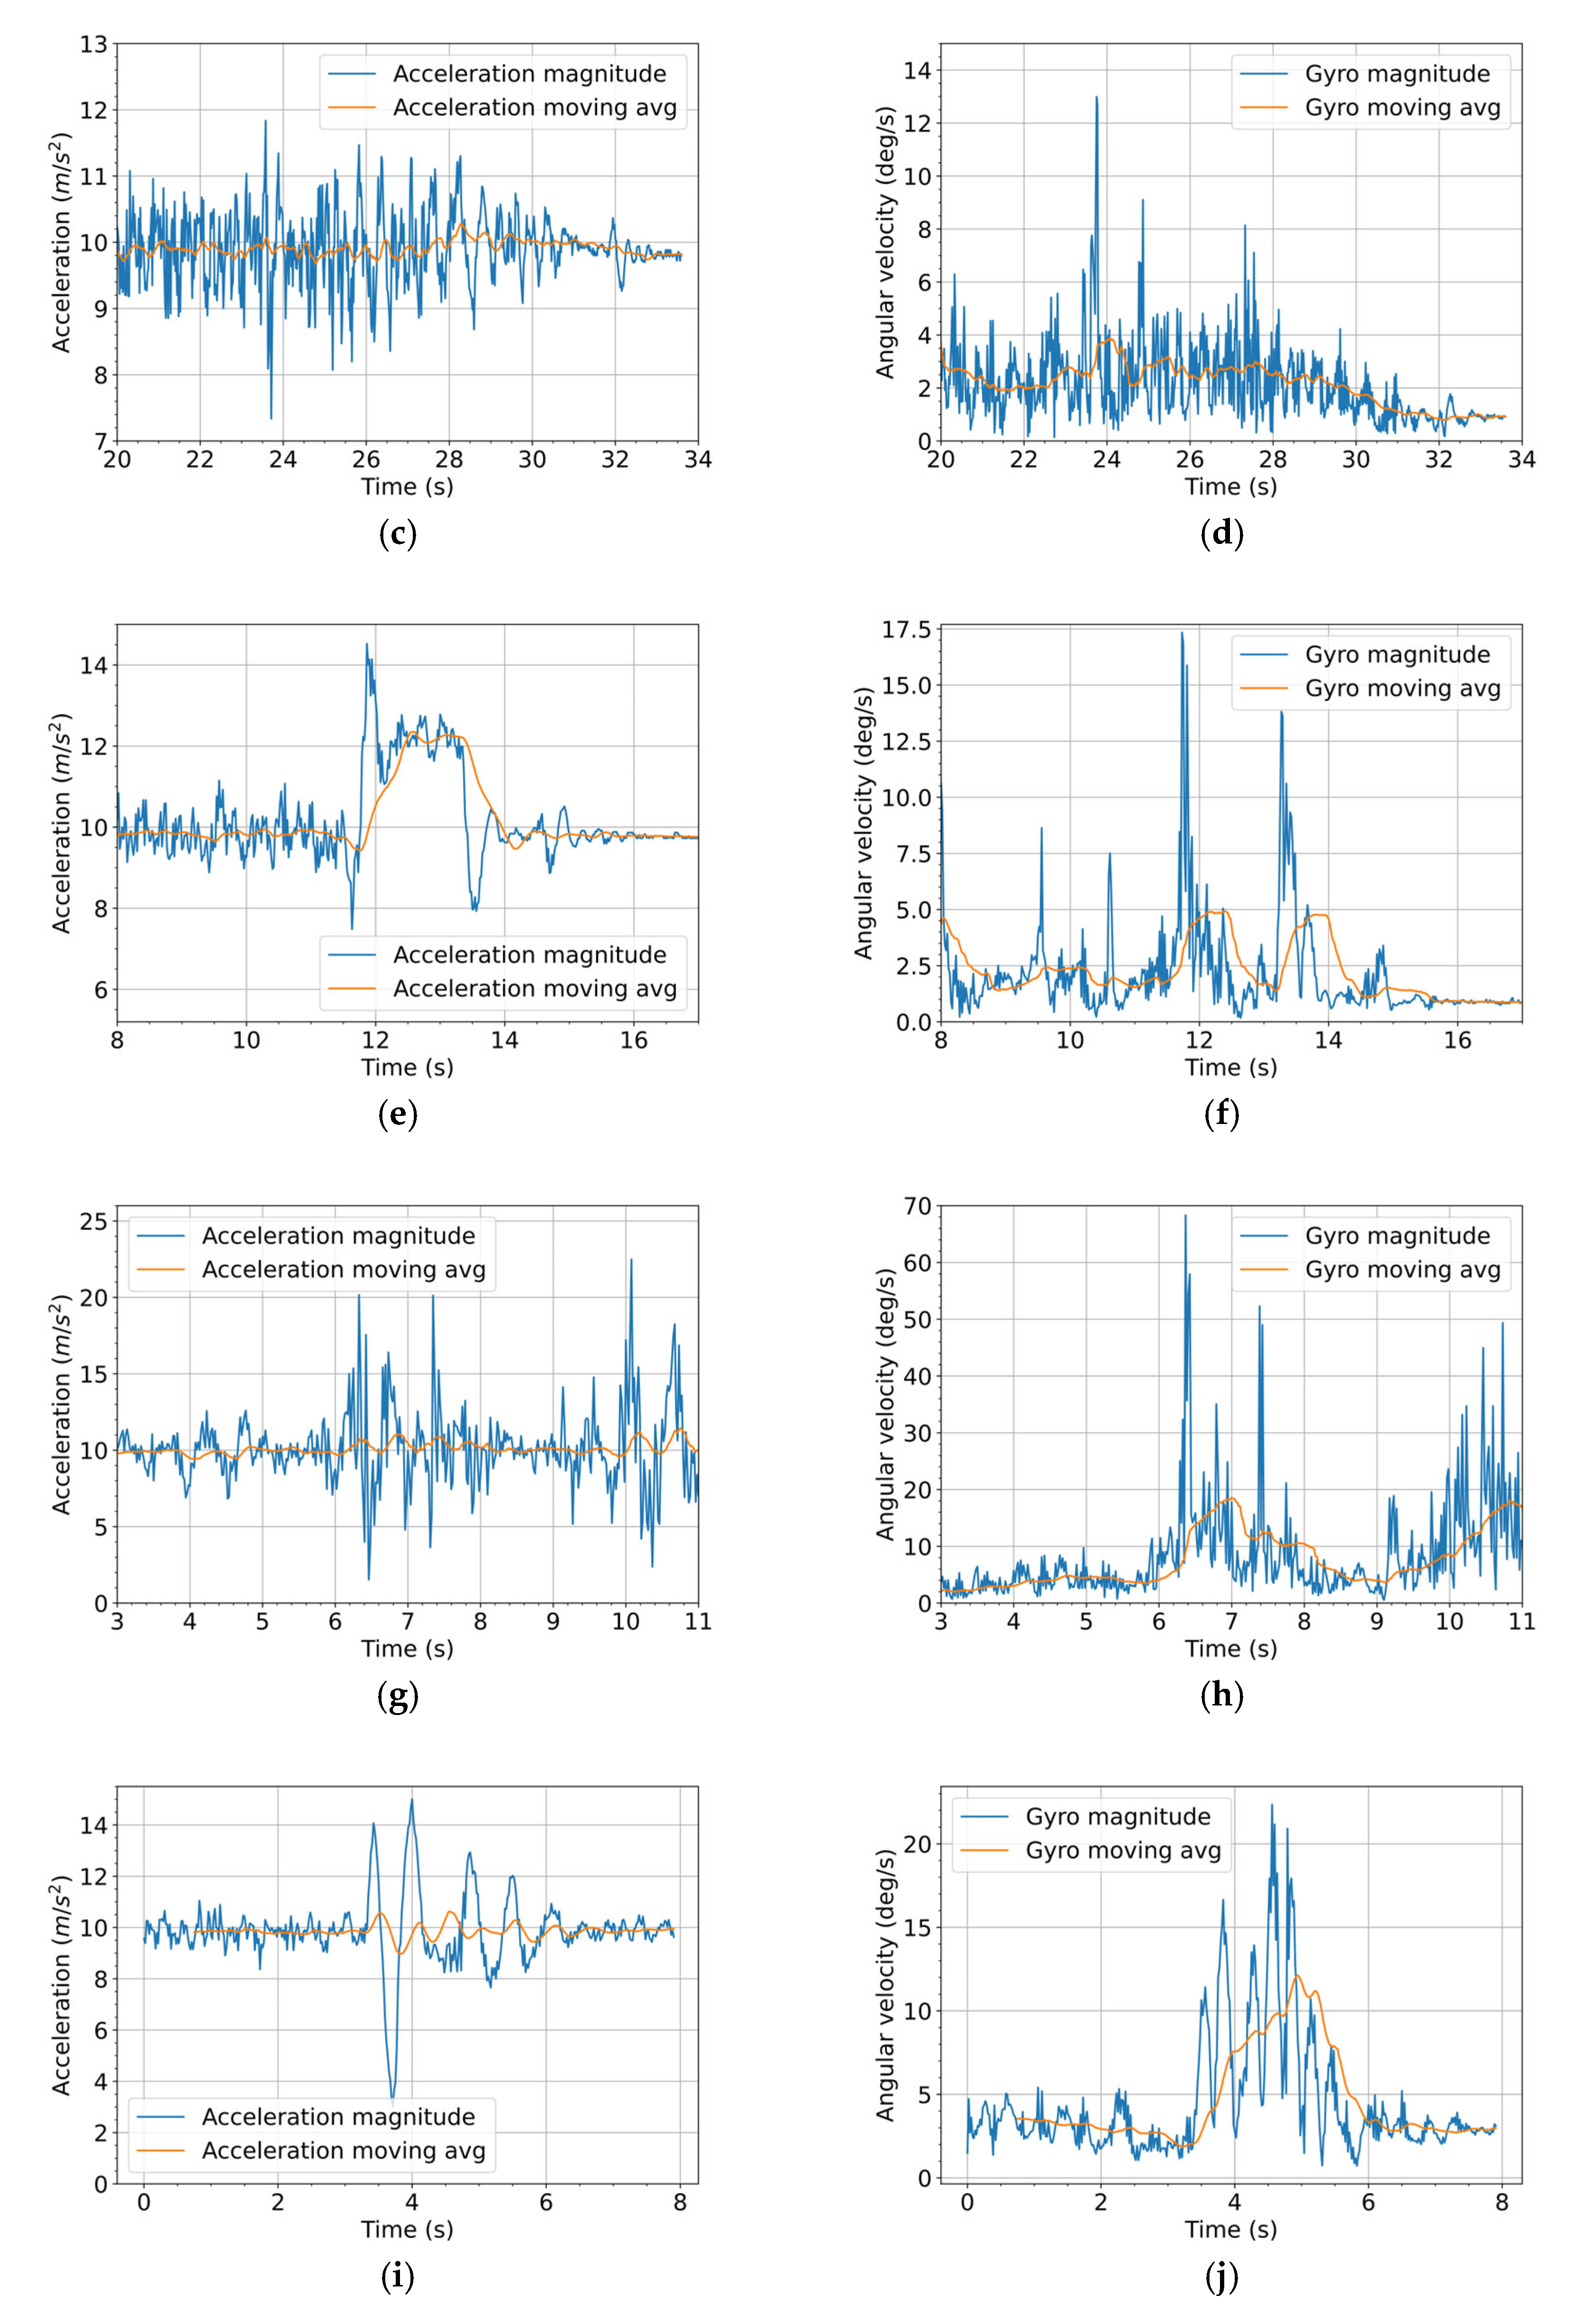
Figure 3 shows the accelerometer and gyroscope raw data sample for engine idle, regular braking, emergency braking, damaged road, and speed bumps, respectively.
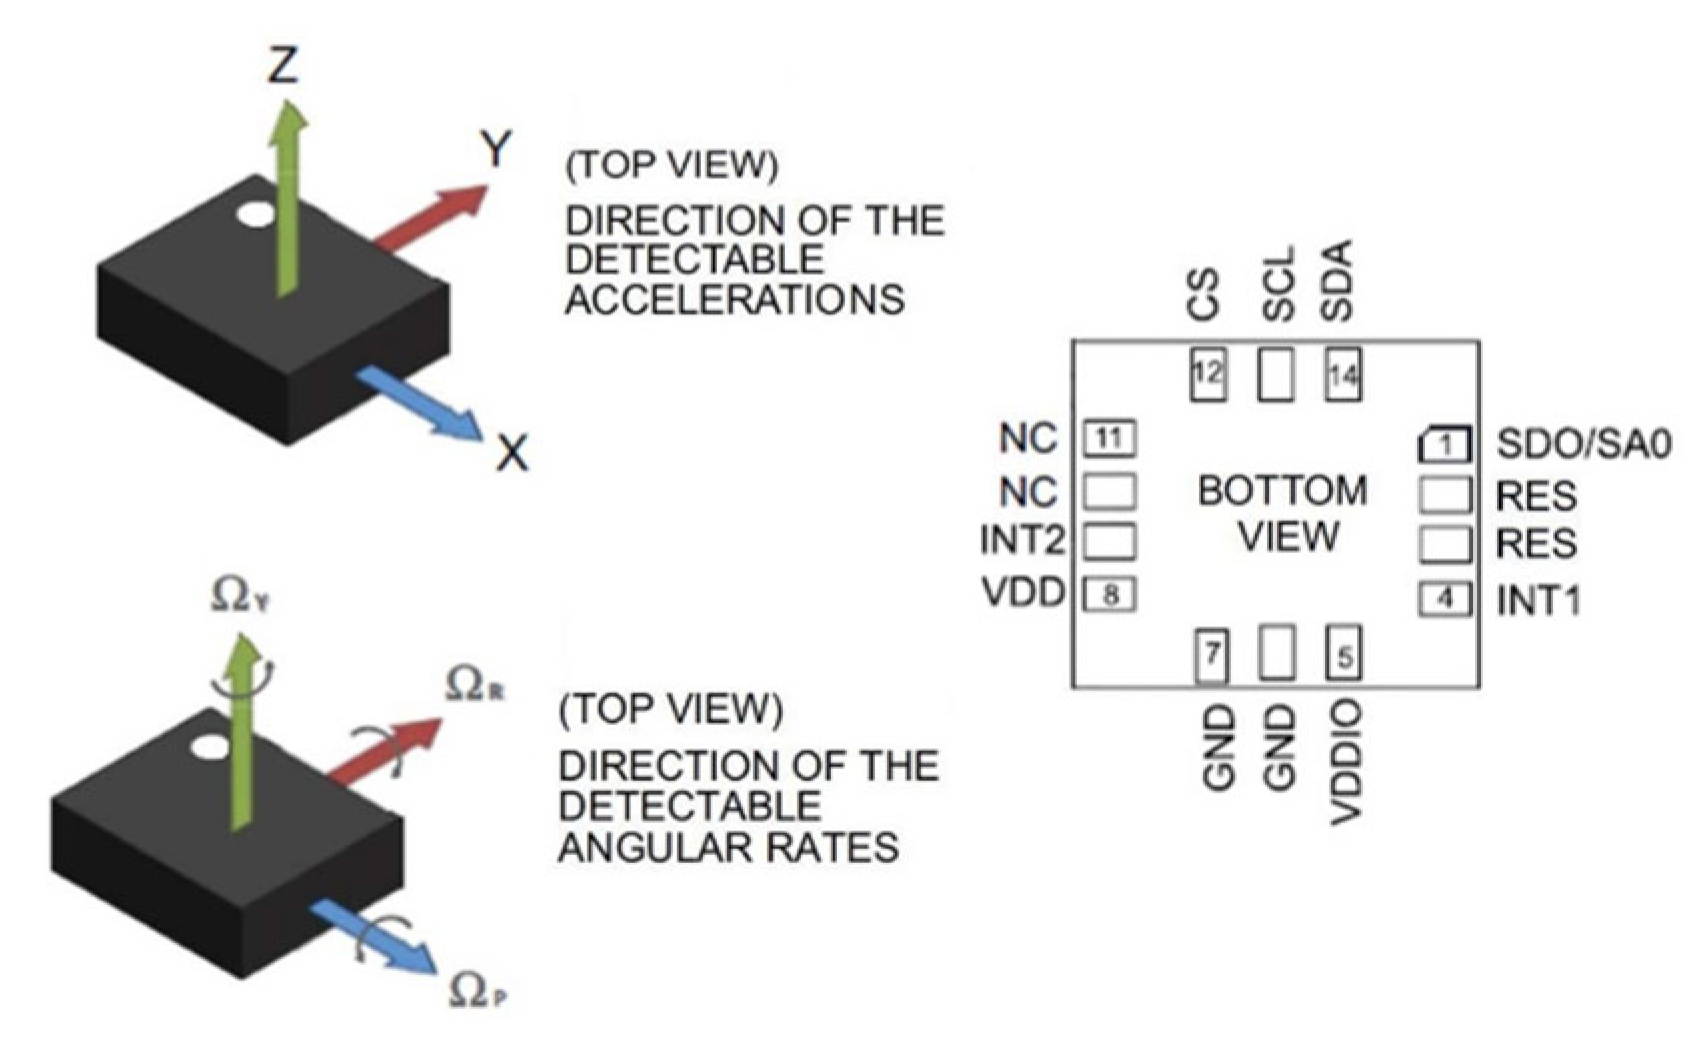
Figure 3a,b shows the data for engine idle. It can be seen that the ASM330LHH IMU sensor is not positioned flat on its base as the Z-axis is not at 9.8 m/s
2 and the X and Y axes have non-zero values; instead, it is inclined to a certain degree.
Figure 3c,d illustrates a data sample for regular braking, where it can be seen in the accelerometer data that the onset of braking happens at around 5 s and progresses slowly until a full stop at 10.5 s. On the other hand, the gyroscope data do not indicate noticeable changes in trends during braking because the vehicle’s angular position across pitch, roll, and yaw remains stable. This indicates that normal braking primarily affects linear acceleration, not orientation. Furthermore,
Figure 3e,f presents an example of accelerometer and gyroscope data for emergency braking. In this example, the vehicle is cruising at a speed of 40 km/h and undergoes a deceleration of 5.5 m/s
2. It shows braking starting at 11.5 s, followed by a short pulse for approximately 2 s, and ends with oscillations until a complete stop at 15 s. This type of short pulse is typically found in emergency braking events, and it signifies the magnitude and duration of deceleration experienced by the vehicle. In the gyroscope data, some degrees of rotation in the Ω
R direction can also be observed. This is related to back-and-forth shock movements usually experienced at the end of emergency braking events.
In
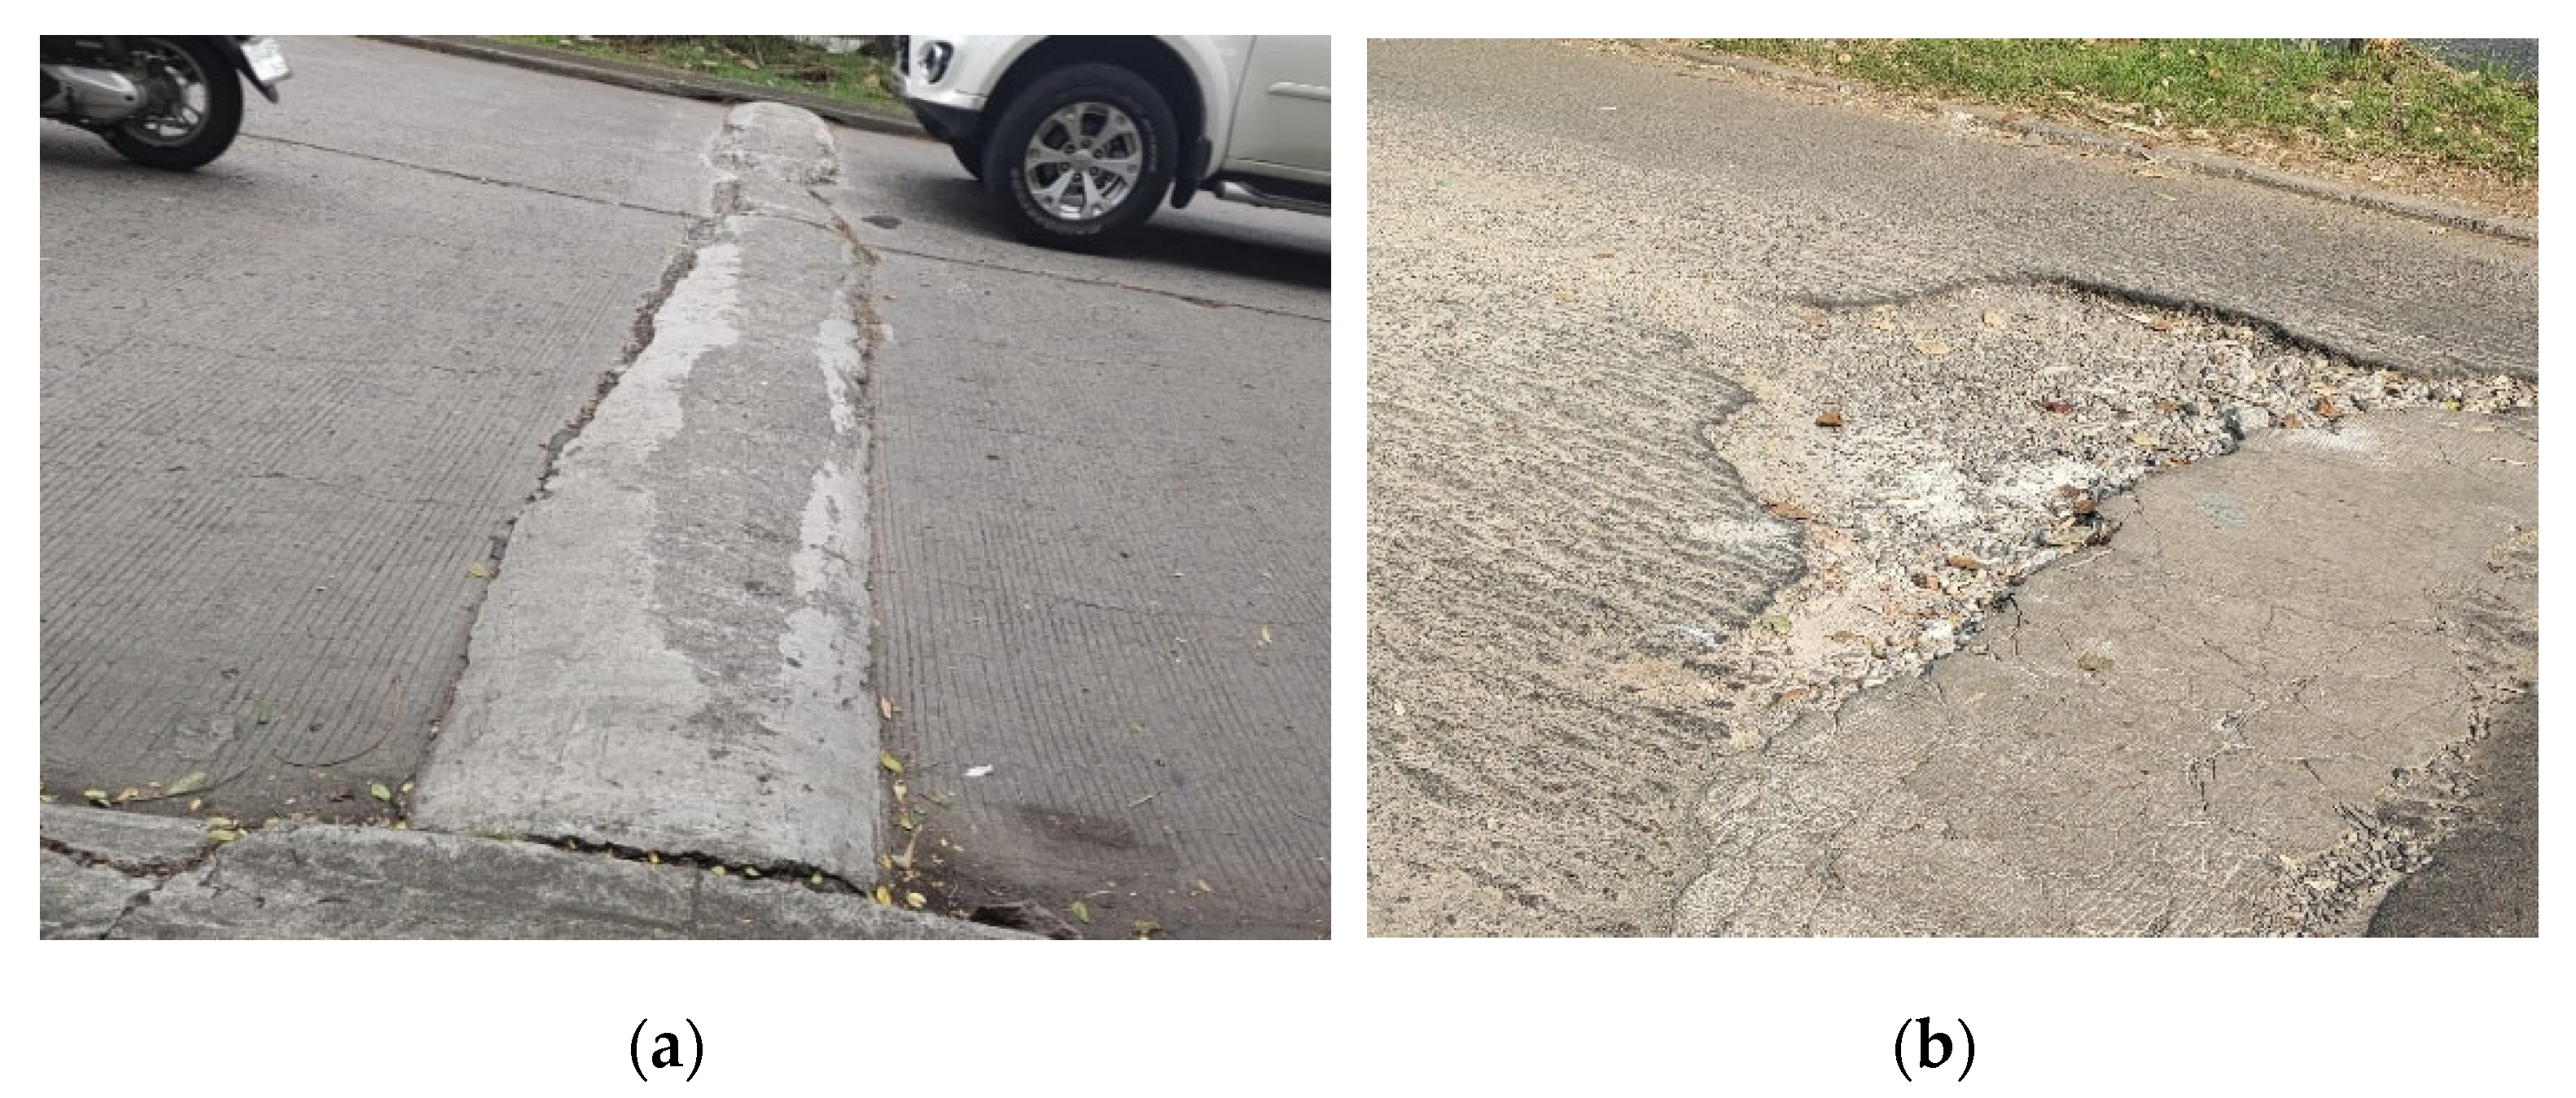
Figure 3g,h, a sample of data for the vehicle moving across a damaged road is shown. Generally, both the accelerometer and gyroscope data exhibit rapid oscillation around the baseline of their axes. Strong vibrations start at around 6 s and continue as the vehicle crosses the damaged road. It can be seen that the peak values for the accelerometer and gyroscope reach up to −20 m/s
2 and −65 deg/s, which are much higher than those of emergency braking.
Figure 3i,j shows the data trends of the vehicle moving over a speed bump, which exhibit slower oscillations compared with those in
Figure 3g,h. However, the peak values can also become significantly higher than those of emergency braking.
Overall, from
Figure 3, it can be seen that the instantaneous values cannot be used directly as decision criteria to distinguish emergency braking from the other events. Further processing steps are needed to extract more distinguishable features.
4.1. Magnitude and Moving Average
The first step in processing the raw data is to calculate the accelerometer and gyroscope magnitude according to Formulas (1) and (2), respectively. This step is meant to combine and simplify the three-axis measurements into a single parameter describing the overall magnitude of acceleration and angular velocity experienced by the vehicle.
The most prominent feature in emergency braking, compared to other events, is the short pulse, as shown in
Figure 4e,f. In contrast, the speed bump and damaged road events are characterized by high oscillations around the accelerometer and gyroscope baselines. Therefore, the signal needs to be further processed so that the pulse shape is preserved as much as possible while the signal oscillation is greatly suppressed. This can be achieved by applying a moving average filter according to Formulas (3) and (4).
In
Figure 4, the blue traces show the calculation results of accelerometer and gyroscope magnitudes, whereas the orange traces show the magnitude moving average with a window length of 40. In
Figure 4a,b, it can be seen that during engine idle, the accelerometer magnitude oscillates around 9.8 m/s
2, which signifies the engine vibration superimposed on the gravitational force. The gyroscope is averaged at 0.5 deg/s; this offset can be compensated to zero if needed. In
Figure 4e,f, it can be observed that the averaged accelerometer magnitude smoothed out the random vibration while the prominent pulse shape of emergency braking is retained. On the other hand,
Figure 4g–j show that the high peak magnitudes for the damaged road and speed bump have been averaged to significantly lower values because the signals typically oscillate around the gravitational force.
For high-frequency suppression, the same effect can be achieved by using low-pass filters instead of a moving average. However, low-pass filters, particularly those with sharp band transitions, are computationally much more intensive than a moving average. Computation time can be a crucial consideration in embedded applications, including in the automotive field, where this emergency braking detection system will be implemented. To gain an indication of the computational load, the following tasks based on Python 3 libraries were executed on the Orange Pi 5 SBC and Raspberry Pi Zero 2 W SBC: Butterworth low-pass filter (Scipy’s filtfilt), moving average (Numpy’s convolve), and moving average (Bottleneck’s move_mean). The execution time was measured using the timeit library. In addition, execution time on the ESP32 (WROOM-32) microcontroller using the RunningAverage’s getFastAverage library is also presented. In each of the experiments, 500 data points were fed into the processing task.
It can be seen in
Table 3 that the LPF execution time increased significantly with the filter order. Numpy’s moving average is at least nine times faster than the Butterworth low-pass filter. Furthermore, the Bottleneck’s moving average was more than 160 times faster than that of the low-pass filter.
Table 4 shows that the moving average execution time on the ESP32 microcontroller was around 533–536 µs. Only a small increase in execution time with the increase in window length was observed because the RunningAverage algorithm efficiently computed the sliding window.
4.2. Optimal Window Length
Figure 5 depicts all peaks of the averaged acceleration and angular velocity of all datasets in
Table 2 at different window lengths. The dotted line represents the polygonal boundary that encloses all the non-emergency points, which was computed using the ConvexHull method from the scipy Python library. Emergency braking points that lie inside the polygon are assigned a distance of zero. At a window length of 10, emergency braking is not completely separated from other events, as the averaging effect is still insufficient. Some points are located inside the polygon. At a window length of 30, emergency braking forms a cluster secluded from other events. Further increasing the window length to 75 and 100 results in lower peaks for emergency braking. This is a consequence of the more aggressive smoothing effect of longer window lengths. However, such an over-smoothing effect does not affect the peaks of the regular braking pulse because its pulse duration is still longer than the window length. As shown in
Figure 3c, the pulse duration of regular braking is around 5 s, or equivalent to 260 samples. Whereas the pulse duration of emergency braking is around 2 s, as shown in
Figure 3e.
It was also observed that using acceleration as the only parameter is not sufficient for an emergency braking detection system. In particularly, peak acceleration on damaged roads can reach high values comparable to those of emergency braking. Thus, the acceleration of emergency braking becomes indistinguishable from other events. Therefore, the gyroscope becomes useful as a second parameter. Intuitively, because there is no vibrating motion during emergency braking, its peak angular velocity is usually low. This is a key feature that distinguishes emergency braking from a damaged road event, which has a high angular velocity as a consequence of vibration caused by crossing an irregular road surface.
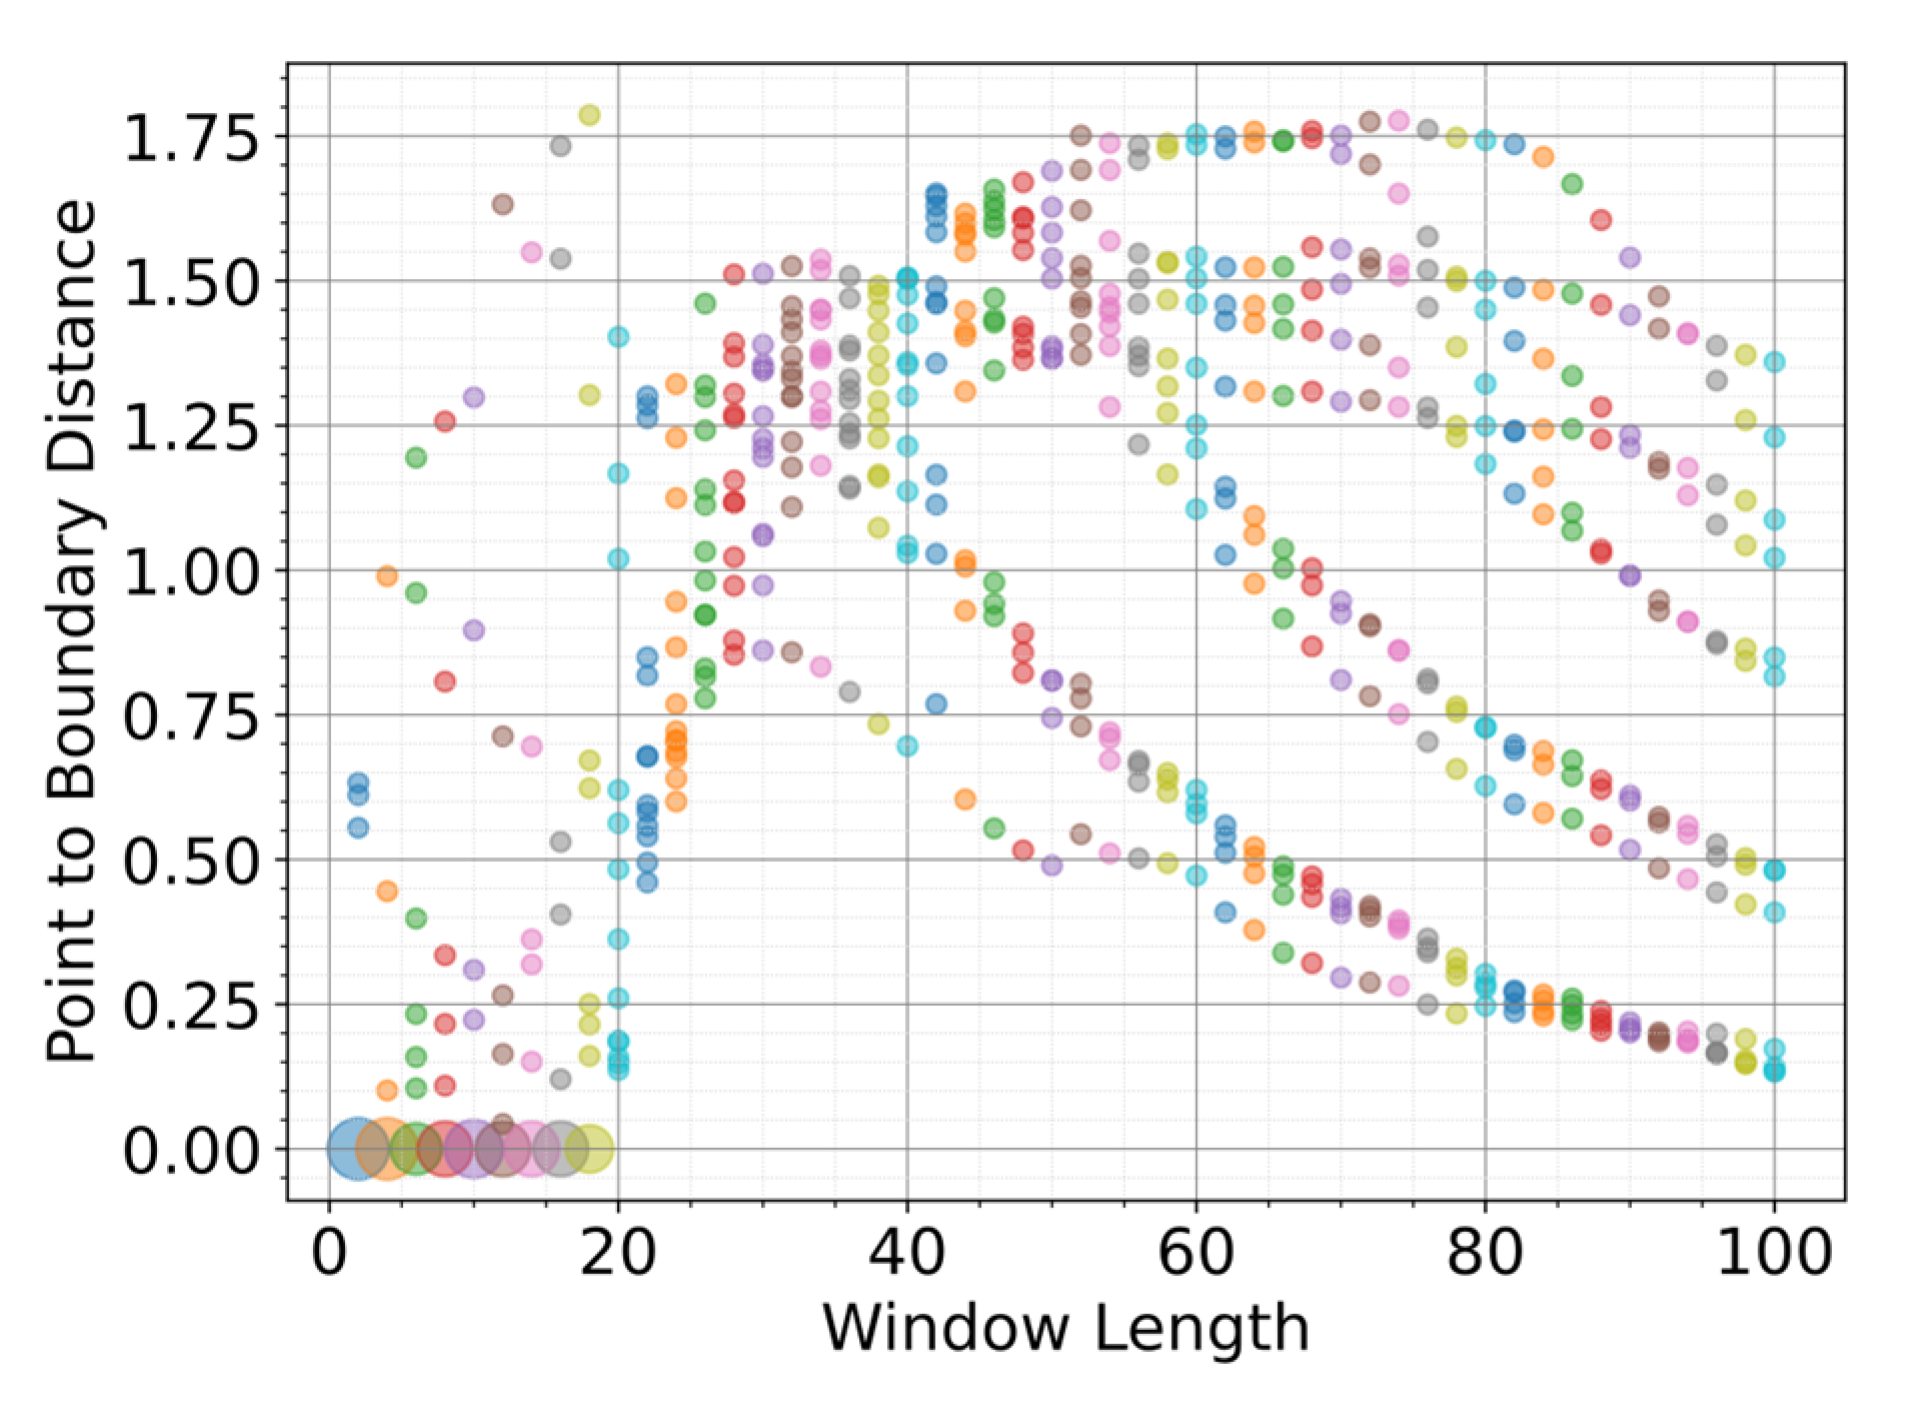
To find the optimal window length that maximizes the separation distance between the emergency braking points and the non-emergency boundary, a systematic search was performed according to the criteria described in Equations (5)–(10).
Figure 6 describes the Euclidean distances between each point of emergency braking and the non-emergency boundary at different window lengths. Each points/dots that have a zero distance are located inside the non-emergency boundary. Larger dots signify more points at that distance. It can be seen that the optimal window length is around 30 because the minimum distance reaches its maximum (at around 0.86) and no points are located inside the polygon boundary. This is also shown in
Figure 5b.
5. Conclusions
This study presents a simple yet effective method for emergency braking detection based on the combined use of accelerometer and gyroscope data. Unlike previous studies that rely on artificial neural networks and require substantial computational resources, the proposed algorithm uses a moving average filter and classical statistical analysis to differentiate emergency braking from other events. The experimental results demonstrate that emergency braking has a distinct profile characterized by a short pulse in acceleration magnitude and relatively low angular velocity. By plotting the peak values of acceleration against angular velocity, the algorithm can effectively separate emergency braking events from regular braking, speed bumps, and damaged roads. This lightweight approach offers a practical solution for embedded automotive systems and can be deployed in early warning systems to enhance traffic safety and fleet monitoring.
The results presented in this paper are preliminary and require validation through more datasets on different vehicle types including automatic emergency braking (AEB) systems, different drivers, and higher travelling speeds. In addition, the presented classification thresholds are based on flat/level road conditions as these were the conditions used during measurements. On uphill or downhill roads, the thresholds will change depending on the degree of inclination. This is a consequence of the proposed algorithm, which does not remove gravitational acceleration. However, a small degree of inclination is expected to be tolerable as there are margins of separation between emergency braking and non-emergency braking. Therefore, the proposed algorithm in its current form is suitable for generally flat road environments.


