Abstract
Timely and accurate traffic information is crucial for maintaining safety and efficiency on motorway networks. This research examines time delays in traffic information transmission through intelligent transport systems (ITSs) and cooperative intelligent transport systems (C-ITSs) on the Slovenian motorway network. The aim of the research is to assess the effectiveness of existing notification systems and the impact of time delays on the timely informing of drivers in the event of an accident in a tunnel. Using real-world data from Regional Traffic Center (RCC) in Vransko, manual and automated activations of traffic portals and different update frequencies of the Promet+ mobile application were analyzed during peak hours. Results show that automated activation reduces delays from 34 to 25 s at portals and from 27 to 18 s in the Promet+ app. Continuous updates in the app provided the highest driver coverage, leaving only 15 uninformed drivers in the morning peak and 8 in the afternoon, whereas 60 s update intervals left up to 71 drivers uninformed. These findings highlight the effectiveness of automation and continuous updates in minimizing delays and improving driver awareness. The research contributes by quantifying latency in ITSs and C-ITSs and demonstrating that their combined use offers the most reliable information delivery. Future improvements should focus on hybrid integration of ITS and C-ITS, dynamic update intervals, and infrastructure upgrades to ensure consistent real-time communication, shorter response times, and enhanced motorway safety.
1. Introduction
Traffic systems are becoming increasingly complex, which heightens the need for their efficiency and safety. In this context, intelligent transport systems (ITSs) and cooperative intelligent transport systems (C-ITSs) play an important role, representing two approaches to improve traffic management and road safety.
Intelligent transport systems are defined in [1,2] as the application of several information and communication technologies to reach three main goals: to improve transport efficiency, enhance road safety, and lower transport impact on the environment. According to these general objectives, five applications of ITSs can be recognized: ITSs aimed at reducing traffic congestion, ITSs aimed at lowering pollution levels and travel delays, ITSs aimed at detecting incidents and warning drivers about them, and the ones aimed at minimizing all factors potentially leading to accidents [1]. In Europe, ITS core services are made up of three service categories, i.e., Traffic and Travel Information Services (TTISs), Traffic Management Services (TMSs), and Freight and Logistics Services (F&LSs) [2]. TTISs comprise general information services, like road weather forecasting, real-time event information, traffic conditions, and speed limit information. Among TMSs, there are services like dynamic lane management, incident warning and management, variable speed limits, ramp metering, etc. While in F&LS category services related to good transportation and truck management (e.g., intelligent truck parking) [2]. Traditional ITSs include technologies such as video surveillance and detection cameras, variable message signs (VMSs), road weather stations, and height control systems, which are remotely managed by Regional Traffic Control Centers (RCCs) providing drivers with essential information on traffic conditions, speed limits, and hazards on the road network. However, the effectiveness of these systems is limited by their reliance on variable message signs and the time required for drivers to perceive, interpret, and respond to the displayed information. In rapidly changing traffic situations, especially in high-risk environments such as when approaching a tunnel, even short delays can significantly affect driver responsiveness. This increases the risk of accidents and traffic congestion.
The advancement of technology has allowed us to develop cooperative intelligent transportation systems (C-ITSs) that do not rely on information coming merely from the infrastructure: thanks to wireless communication technologies, they indeed enable communication among all transport system components, i.e., between infrastructure and vehicles and among vehicles themselves [3]. As a result, drivers should receive timely alerts about potential hazards, traffic congestion, or changes in traffic regulations, reducing the need to focus on roadside signals.
Nevertheless, for C-ITSs to be effective, the speed of information transmission plays a crucial role, directly influencing driver reaction times and decisions, especially in critical traffic situations: faster and more accurate data transmission allows drivers to respond promptly, helping reducing the risk of secondary accidents.
In recent years, project C-ROADS [4] has been playing a central role in the deployment of ITSs and C-ITSs on the European road network, with 18 member states running pilots and developing activities to extend and improve the use and interoperability of ITS and C-ITS. Also, Slovenia is part of this initiative and has been actively implementing both ITSs and C-ITSs, especially on its motorway network. According to the last C-ROADS report [4] from the end of 2022, ITS-G5 infrastructure was deployed on 34 km of the Slovenian TEN-T road network, especially on A1 and H4 motorways, and it has been extended in the following years. The goal is to implement a hybrid “Infrastructure to Vehicle” (I2V) and “Vehicle to Infrastructure” (V2I) solution that allows drivers to obtain real-time traffic information through the use of the Promet+ smartphone application [5].
Despite all efforts to deploy these advanced systems, one of the major open issues is still the evaluation of their effectiveness. The present research work would like to tackle this aspect by analyzing the functioning of the implemented ITSs and C-ITSs on a specific road section of the Slovenian motorway network, between two motorway tunnels. To assess their impact, a comparison of their performance in terms of information transmission speed and amount of warned road users is carried out. To reach these goals, first, a literature review is developed, in which ITS and C-ITS applications in Europe, the U.S., and Asia are mentioned, basic concepts of traffic management systems are provided, and the issue of ITS/C-ITS assessment is explained through the overview of previous research works assessing similar systems. After that, the methodology followed during the research is explained, describing the selected location, the systems considered in the study, the available data, and the theory used to calculate the number of drivers reached and unreached by the ITS/C-ITS message. Further, results are presented and discussed, and conclusions are drawn.
2. Related Works
The present section aims to review two aspects of ITSs and C-ITSs: in the first sub-section, the deployment of ITSs and C-ITSs in various countries of the world is tackled; the second sub-section focuses on the definition of impact assessment and evaluation and reviews works that dealt with these issues.
2.1. Overview of ITS and C-ITS Deployment
The application of ITSs and C-ITSs is spreading worldwide. In Europe, although some works and projects about ITSs had already emerged in the 1990s, it was in 2010 that a sharp change was observed when Directive 2010/40/EU was adopted. The aim of this directive was to give a framework to European Member States to coordinately develop and deploy ITS technologies and to strengthen the collaboration among its states, public authorities, and stakeholders from industry [6]. Among initiatives sustained by the European Commission, one of the main and widest projects focusing on ITS and C-ITS technology deployment is C-ROADS [4]. In its last available report from year 2023 [4], it is indicated that many efforts have been spent on the implementation of C-ITSs along motorways by all countries, and that many member states began to integrate C-ITSs, also at an urban level, with some examples related to vulnerable road users. Limiting the review to some examples of C-ITS deployment to motorway applications, in Austria, 175 roadside stations were placed on the motorways around Vienna, Graz, on the Vienna-Linz-Salzburg corridor, and in various border regions. Also, they equipped road operator vehicles with C-ITS vehicle units. In the Flemish region of Belgium, a cloud-based virtual infrastructure was deployed connecting road users with the Traffic Management Centre. In particular, they tried to connect various C-ITS services, like road warnings, in-vehicle signage, hazardous locations notifications, etc., with an Intelligent Speed Assistance system. The Czech Republic implemented ITS-G5 technology on several motorway segments, also on the borders with Austria and Germany. In this last country, eleven different C-ITS services were implemented in five different sites. Among these, road work warning services, maintenance vehicle warnings, emergency vehicle approaching service notifications, traffic jam ahead warning services, and in-vehicle information/signage services have been deployed. Similar C-ITS services were implemented in Greece, specifically road work warning, hazardous location notification, in-vehicle signage, and probe vehicle data collection. Nevertheless, a difference should be noticed: while in the previous mentioned states, the deployed systems refer to extensions of Day-1 and development of Day-1.5 services, Greece selected mainly Day-1 services (probably due to its recent participation in the project). Hungary implemented C-ITS services on two main motorway segments, the one connecting Austria and Budapest and part of the Mediterranean Corridor. Their systems cover traffic jam warning, hazardous location notification, road work warning, weather condition notification, in-vehicle signage, and in-vehicle speed limit warnings, belonging both to Day-1 and Day-1.5 services. Italy implemented, among others, interesting cooperative systems based on V2X technologies, i.e., truck platooning and highway chauffeur. In particular, this last system was tested both on an Italian motorway and on the border with Austria, obtaining good results. The Netherlands made many efforts in implementing C-ITS on their motorway network. Currently, they are working on three additional services, i.e., road work warning, emergency or priority vehicle approaching, and emergency or rescue vehicle in intervention. According to [6], in the U.S., many projects have also been proposed for the deployment of C-ITSs. FHWA and Auburn University funded a project aimed at implementing Driver Assistive Truck Platooning, defined as cooperative adaptive cruise control system for trucks. USDOT promoted Connected Vehicle Pilot Deployment Program, addressing the combination of mobile applications and connected vehicle technologies to increase road safety. An interesting work carried out by Duan [7] compares the works developed from 1991 to 2012 in Europe and the U.S., especially public policy documents, to draw the path of ITS technologies in these two continents and highlight their trends. Among his findings, the author highlighted the different role played by the U.S. and Europe in the development of ITS technologies, with U.S. prioritizing it and making it a “military-to-civilian technology”, while Europe highlighted the industrial importance of these technologies. This difference also led to a different timing in the standardization of ITSs, with the U.S. leading the process and acting already at early stages, and Europe encouraging standardization but not intervening in it. This introduced a diversification of the technological development of ITSs and the promotion of different actors both from the industry and academic sectors in the development process. Also, in Asia, efforts have been made to implement ITS and C-ITS technologies: a study report was issued in 2022 about the available connectivity status in Asia, especially on Asian Motorway 9—connecting the Chinese seaport of Lianyungang to St. Petersburg [8]. This document also states the implementation of many ITS and C-ITS technologies across three Asian Countries, i.e., China, Kazakhstan, and the Russian Federation. On the Chinese segments of the route, the infrastructure is equipped with 5G technology, cameras, and radars enabling the detection of any dangerous situation in traffic. These systems can forward information about the danger to drivers via smartphone applications. Also, a cooperative adaptive cruise control technology for trucks was implemented on the Donghai Bridge, and a data center was completed, which monitors the real-time status of the vehicles. In Kazakhstan, there are ongoing projects to deploy ITSs on Motorway 9 segments, which are mainly related to tolling services, road user information, and speed monitoring services. On the Russian segment of the mentioned road, V2I interfaces are available, providing information about dangerous situations, obstacles on the carriageway, direction changes and stop warnings to drivers.
From this overview, it is clear that the deployment of both ITSs and C-ITSs is a current interest for the majority of countries worldwide. Therefore, a way to assess their effectiveness is even more in demand. The next sub-section focuses on this aspect, highlighting that there is still not a standardized method to assess the impact of these systems and reviewing some of the works in this field.
2.2. Traffic Management Systems
As mentioned in the Introduction, traffic management systems are a category of ITSs that monitor traffic flow and detect potentially dangerous traffic events to ensure the best and safest use of the road system possible [2]. Seven services are considered TMSs. These are dynamic lane management, variable speed limits, ramp metering, hard shoulder running, HGV overtake ban, incident warning, and management and traffic management for corridors and networks [2]. DeSouza et al., in their work [9], reviewed TMSs, highlighting their basic functioning, the classification and qualitatively analyzing some systems they found in the literature. Firstly, they highlighted that thanks to the Vehicle Ad Hoc Network (VANET), two ways of communication are possible: vehicle to vehicle (V2V) and vehicle to infrastructure (V2I). Then, to have a positive effect on road safety and traffic efficiency, which are the TMS’s primary goals, these systems rely on three steps: information gathering from different traffic sources (vehicle or road-related), information processing, and service delivery [9]. Their work follows the review of 19 TMS works, which were classified first on the basis of their relation with the infrastructure (i.e., infrastructure-free or infrastructure-based), and then according to their function. Three accident detection and warning systems were found [10,11,12]. In ref. [10], the authors present a V2V solution aimed at reducing traffic congestion on highways due to traffic accidents. Ref. [11] is an improvement of the previous work, based on a different data transmission protocol and transmission channel (service channel and no more control channel), which are more suitable for highly dynamic environments. Finally, in ref. [12] the authors developed a system based on the information collected by an OBD 2 unit to identify accidents. Ref. [13] presents an evaluation through the simulation of a short-range warning advertisement system, which can be used for vehicle-to-vehicle and vehicle-to-roadside communication. To assess the system, they used parameters related to the amount of sent data, their delay, the amount of lost data, and the amount of data received by the destination. Results showed that the more vehicles on the road network, the higher the provided benefit. As can be noticed from this overview, though TMSs are described in the literature, especially in relation to their concepts and technical characteristics, little effort has been made for their evaluation.
2.3. ITS and C-ITS Impact Assessment and Evaluation
Though there is much interest in ITS and C-ITS technologies, and standards for their implementation are clearly defined [14], an open challenge is related to the evaluation and assessment of their impact. In ref. [15] the authors dealt with these two aspects that, though similar, tackle different levels of C-ITS implementation. As they defined in [16], while impact assessment aims to identify the future consequences of a proposed, but not realized, service, impact evaluation refers to assessing the consequences of an already existing service. These aspects are even more important, since the European Union has established [16] that ITSs must positively impact the issues of the transport sector, like road safety, sustainability, and congestion.
From the literature review developed in [16], which considered four characteristics—i.e., the type of C-ITS service, the spatial conditions, the traffic demand, and the assessment method—of C-ITS assessment approaches in order to identify useful research on this topic, it has been found that only 15 works assessed the application of C-ITS on a real-world motorway network. Of these, only five works used real-world traffic demand data, being therefore comparable to the present research.
In refs. [17,18], the authors aim to assess the impact of a road work warning system, developed within the scope of the C-Roads Italy project, on the travel time and driving regime on a segment of the A22 motorway. To do so, they used PTV Vissim 11 software to simulate two scenarios: the first considers the implementation of the C-ITS on level 3 vehicles, while the second scenario simulates usual conditions, without any C-ITS. They found that the use of such a warning has positive effects on the number of vehicles taking over directly at the bottleneck, decreasing it, and therefore allowing the maintenance of higher speeds. This can have a positive impact both on the safety at nearby road works and on congestion. Also, the application of the C-ITS brought a decrease in the delay upstream the road works of 6%, which is also a high benefit of the system. Similarly, Kotsi et al. [19] simulated two scenarios via SUMO: a baseline scenario not implementing any C-ITS, and a scenario with the implementation of five C-ITS services, i.e., hazardous location notification (HLN)–stationary vehicle, HLN–weather condition warning, road work warning, in-vehicle signage-embedded VMS, in-vehicle signage–shockwave damping. They used actual traffic demand from Egnatia Odos Tollway and considered the following as key performance indicators: average speeds, CO2 emissions, collisions, lane changes, and travel time. The results show positive contributions of the C-ITS services, reducing the number of collisions and leading to more careful lane-changing maneuvers, less or smoother speed changes and sometimes also a decrease in the emissions. The authors of [20] analyzed the improvement produced by implementing C-ITSs on a road network, where ITSs are already deployed. To do so, they consider that a larger overlap of ITS and C-ITS services should bring more restrained benefits: so, the lower the density of ITS installations, the higher the incremental benefits of C-ITSs. Testing 246 Flanders’ motorway segments, where there is more than one ITS service, they found out that C-ITS implementation could bring a 26% emission reduction. The safety impact of C-ITSs was studied in [21]. The authors focused on the forward hazardous situation warning system, which was deployed thanks to a C-ITS pre-deployment project on Korean freeways. Thanks to this project, they had the chance to gather real, on-field connected vehicle data and to use driving behavior parameters to evaluate the effect of C-ITSs. They collected speed, spacing, average time to collision (TTC), average time-exposed time to collision (TET), acceleration noise, speeding rate, and peak-to-peak jerk and calculated a crash potential index (CPI) to quantify the effect of the implementation of the systems. The results show a decrease in the average speed and acceleration noise, by 10.2% and 1.9%, respectively, and an increase in the average spacing. Also, the TTC and TET had positive changes, and the CPI jumped down by 20.7%, indicating an improvement in terms of safety, when applying the C-ITS service. A pilot evaluation and validation of seven C-ITS services according to interoperability were carried out in a Vienna living lab, and the approach followed is described in [22]. In this work, the authors first checked the C-ITSs for their correct functioning—controlling the correctness of the followed protocols and the related outputs. After that, they checked them for interoperability, by comparing the results obtained by different pilots developed in Austria, Germany, and the Netherlands. Finally, the performance of the systems was also tested by analyzing the position and speed of the vehicles implementing the C-ITS services. The main take-away of [22] is that the impact areas defined by C-Roads, i.e., road safety, traffic efficiency, and environment and user acceptance, though fundamental, are not enough to assess C-ITS interoperability, which should be tested with other approaches, as the first author described. Ref. [23] used a simulation-based test bed to assess two route guidance schemes in comparison to the baseline simulation, where no guidance strategy is considered. The first scheme has individual route guidance strategies, while the second one implements multiple route guidance strategies. The authors evaluated these scenarios according to market penetration, congestion level, update level, and compliance rate. The results indicated an improvement of 22.5% in travel time, 45.4% in speed, and an increase of 13.6% in travel distance. Also, they found a positive relationship between the market penetration of the system and its benefits and that, as could be expected, in extreme congestion levels—meaning no congestion or sever congestion—such strategies are not totally beneficial.
From this overview, it is clear that until now, the impact evaluation of these systems has received little attention. Also, no standardized criteria have been defined for their evaluation, with each work considering different key performance indicators to assess the systems. The contribution of this research lies in the quantification of the impact of existing ITSs and C-ITSs on the basis of real-world data, by calculating their speed information transmission and the number of users effectively warned by each system. Also, this quantification allows us to compare the two systems and to suggest improvements to their implementation.
3. Data and Methodology
3.1. ITS and C-ITS Infrastructure
On a Slovenian motorway network, two key ITSs are currently in use: the Traffic Control and Management System and the Tunnel Control and Management System. To manage these two systems, the motorway management company DARS operates the advanced Kažipot II information system, which enables the collection, processing, and distribution of traffic data in real time. Through this system, all key traffic information is immediately transmitted to the warning system and indirectly published on the promet.si website, RTV Slovenia teletext, telephone answering machines, and all radio stations. In addition, the system enables automated transmission of data to competent institutions, such as the police, the Slovenian Infrastructure Directorate, and the Ministry of Infrastructure, thus ensuring the rapid notification of all relevant services and improving responsiveness to potential traffic contracts. The Traffic Management and Control System should rapidly detect traffic accidents, congestion, and other emergency events and inform road users about current traffic conditions. It consists of various technological components to effectively monitor, control, and manage traffic in real time. These technologies include video surveillance cameras, sensors for measuring traffic density and speed, microwave detectors, variable traffic information signs (VTISs), weather stations, and height controls, which together enable a flexible and coordinated response to current road conditions.
Variable traffic information signs (VTISs) are devices that provide drivers with up-to-date information about traffic conditions, incidents, road works, or speed limits, using a combination of international symbols and text messages [24,25]. Messages include details of the incident (e.g., road works or accidents), location, consequences (e.g., lane closures or traffic jams), and recommended actions (e.g., reducing speed or taking an alternative route). These signs may also display graphical representations of traffic conditions and congestion. Both static and variable traffic signs use international symbols, enabling clear and universal communication that overcomes language barriers and ensures better understanding for drivers from different countries [25]. These systems are adapted to the principles of Human Machine Interface (HMI) so that drivers receive only the necessary information at key points [26]. In Slovenia, variable traffic signs enable effective real-time traffic management through various forms, such as portals, semi-portals, variable traffic signs, and variable signposts. Portals are installed at specific locations, above the whole lane width of the motorway to inform drivers about unexpected events, especially about congested sections or accidents and road works, enabling timely decisions and relief of critical sections [27].
Regarding C-ITSs, currently in Slovenia, the PROMET+ mobile application is active. This application was developed to provide users with real-time access to traffic data via mobile networks, thereby enhancing the hybrid communication infrastructure. Ongoing pilot projects are currently testing communication between motorway management systems and vehicles through mobile networks, with the Promet+ application serving as a functional equivalent to an onboard unit (OBU). In this role, it delivers traffic information directly to users’ mobile devices. Beyond disseminating road condition updates, the application also supports virtual traffic signaling, enabling the transmission of critical information to vehicles even in situations where physical signage (e.g., portals before tunnels) is not visible due to adverse weather conditions such as fog or snow. The system presently operates on existing mobile networks, including 3G, 4G, and LTE, while the forthcoming transition to 5G is anticipated to significantly increase data transmission speed and reliability [5].
3.2. Study Site and Data Collection
To conduct a comprehensive analysis of information transmission delays, this research focused on a specific case study, namely, the motorway section leading to the Trojane tunnel on the A1 motorway in the direction of Ljubljana, Slovenia. This segment was selected due to its infrastructural and operational significance, high traffic volumes, and the challenging geographic and traffic conditions that influence the performance of intelligent transport systems.
The analyzed section spans from the Jasovnik tunnel (stationing km 8.212 on section 0043) to the Trojane tunnel (stationing km 0.510 on section 0067), with a total length of 2.219 km (Figure 1). Of this, 1.709 km belong to section 0043, and 0.510 km to section 0067, corresponding to the distance between kilometer markers 77.000 and 79.219 [10,11,27]. The area lies within the municipalities of Lukovica and Zagorje ob Savi and forms a critical traffic corridor connecting central Slovenia with the Zasavje region.
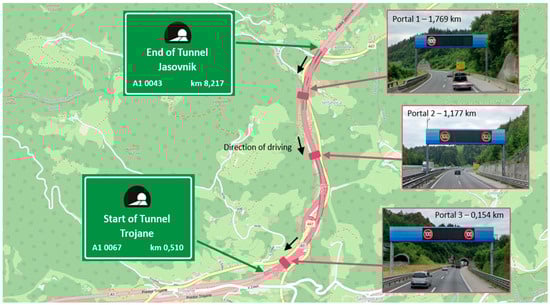
Figure 1.
Motorway section between the Jasovnik and Trojane tunnels with marked portal locations.
Three ITS portals are installed along the section, enabling dynamic traffic management and real-time driver notifications. The first portal is located 1.769 km before the Trojane tunnel entrance, the second 50 m before the Trojane exit (1.177 km before the tunnel), and the third only 154 m from the tunnel entrance. All portals are connected to the Regional Control Centre (RCC) in Vransko, which enables remote management, the rapid detection of traffic conditions, and the corresponding adjustment of traffic signaling.
The effectiveness of ITSs and C-ITSs was evaluated based on two criteria: the number of drivers who were not informed about traffic conditions in time due to delayed information and a comparison of the time delays associated with different modes of information transmission. The analysis utilized data from traditional traffic information portals, representing conventional ITSs, and data from the Promet+ mobile application [5], which serves as an example of a C-ITS-based solution.
The first step in the analysis consisted of determining the capacity of the section during peak traffic periods to estimate the number of vehicles passing through within a given time frame. Traffic volume and average speed data were obtained from the automatic traffic counter QLTC8, installed at measurement point 0067 Trojane–Blagovica.
The analysis was based on the concept of peak hour, which represents a fundamental element in traffic flow analysis, identifying the time interval with the highest traffic demand and therefore the most critical conditions for assessing capacity and level of service. Peak hour is generally defined as the consecutive 60 min period within a day that experiences the highest traffic volumes. In practice, traffic counts for determining the peak hour are typically carried out on working days between Tuesday and Thursday, since these days are considered to best reflect regular traffic conditions, while Mondays and Fridays often exhibit irregular patterns [27]. In this study, the peak hour was determined on the basis of a 16 h traffic count conducted on the 16 October 2024. This day was chosen together with the experts of the motorway management company DARS, since no disruptions were recorded, making it suitable for assessing typical traffic flow. The analysis revealed two critical peak hours: the morning peak period between 05:30 and 06:30 and the afternoon peak period from 14:16 to 15:16, which were therefore taken as the representative time interval for further evaluation. During the morning peak (5:30–6:30), a total of 2.918 vehicles passed through the Trojane tunnel, 1.856 on the driving lane, and 1.062 on the overtaking lane. In the afternoon peak (14:16–15:16), 1.554 vehicles were recorded, 905 on the driving lane, and 649 on the overtaking lane. The average speed in both periods was approximately 101 km/h. All traffic flow data recorded during the peak hours are reported in Table 1 and Table 2.

Table 1.
Traffic data for the Trojane tunnel during the morning peak hour on 16 October 2024.
Table 2.
Traffic data for the Trojane tunnel during the afternoon peak hour on 16 October 2024.
However, it should be noted that transmission delay is largely independent of vehicle type. For C-ITS and ITS portals, delays are determined by the system’s detection, processing, and communication steps, rather than the type of vehicle receiving the message. Consequently, while Table 1 and Table 2 report vehicle counts, the effect of vehicle type on transmission delay was not analyzed. Building on this, the next step of the analysis compared four modalities for transmitting traffic information:
- Manual transmission to ITS portals;
- Automated transmission to ITS portals;
- Manual transmission to the Promet+ mobile application;
- Automated transmission to the Promet+ mobile application.
In cases when ITS portals are manually activated, traffic accidents are typically detected via video surveillance systems integrated into the Traffic Control and Management System and the Tunnel Supervisory Control System. Once an accident is identified, the data are processed locally with an average delay of around 10 s. This local processing step helps reduce the network load and improves the reliability of data transmission. The accident information is then forwarded to the Regional Control Centre (RCC), where a traffic manager assesses the situation. If the accident is confirmed and considered relevant, the operator manually activates the warning message on the appropriate traffic portals. Following this, the information is transmitted from the RCC to the portals themselves. According to 2024 data from the Vransko Regional Control Centre, the average transmission time to the portals located before the Trojane tunnel is approximately 11 s, based on system-exported data provided directly by DARS. Altogether, the entire process, from detection to the display of the warning, takes an average of 34 s, with the total delay largely influenced by the operator’s response time.
In contrast to manual activation, the automated transmission of information to ITS portals operates without any human intervention. The system autonomously detects critical events, such as wrong-way driving, smoke, or fire, and automatically initiates appropriate responses, including speed limit reductions, warning messages, or even tunnel closures. In the case of the Trojane tunnel, where video detection is implemented, there is an initial data delay of approximately 10 s. Once the event is detected, the data is transmitted within three seconds to the Kažipot system, i.e., the national traffic information system, where it is processed in about one second and immediately triggers the appropriate message on the portals. The subsequent transmission of this information to the portals takes an average of 11 s.
Despite the initial 10 s delay in detection, the entire process from event detection to message display takes approximately 25 s, allowing faster and more responsive alerts for drivers compared to manual activation. However, the duration of automated activation is not always consistent, as it may vary depending on factors such as weather conditions, network load, and specific system configurations. The data presented here is based on information provided by the developer of the ITSs currently used by DARS d.d.
A similar process applies to manual transmission to the Promet+ application. Once the accident is verified by the RCC operator, the data is transmitted to the Kažipot system, an interface which facilitates the integration with the mobile application. This additional transmission phase takes approximately four seconds, resulting in an average total delay of 27 s from initial detection to the app notification.
However, the shortest delay is achieved with fully automated C-ITS transmission to the Promet+ mobile application. In this case, the detected event is automatically validated within the Kažipot system, with no operator involvement. Upon validation, the warning is instantly transmitted to the application, requiring only four seconds. The total process, from detection to user notification takes an average of just 18 s, representing the fastest response time among all analyzed transmission methods and highlighting the key advantage of automated C-ITS solutions for timely traffic information dissemination.
Following the identification of peak traffic hours and the definition of different modes of traffic information transmission to drivers, a quantitative assessment of information effectiveness was conducted. This assessment involves calculating the number of drivers who are not informed of an accident in a timely manner and consequently lack the opportunity to take appropriate action, such as selecting an alternative route. Such situations can significantly contribute to traffic congestion, particularly in critical sections such as the Trojane tunnel.
The first part of the analysis focuses on information transmission to ITS portals, examining the impact of transmission delays on the timely dissemination of information to drivers. Specifically, the analysis evaluates how many drivers are not informed of an accident in time, thereby limiting their ability to choose alternate routes and potentially causing congestion before the Trojane tunnel.
The number of drivers not informed in a timely manner timely via the portal is calculated using Equation (1):
where
- —number of drivers not informed in a timely manner via the portal [veh];
- —distance from the portal to the closed tunnel or road section [km];
- —minimum distance required for proper visibility of the portal [km];
- —average vehicle speed during peak hour i [km/h];
- —traffic flow during peak hour i [veh/s];
- —information transmission delay to drivers [s].
The results of the performed analysis will highlight the difference in the number of drivers informed in a timely manner between manual and automated portal activation, further reinforcing the importance of automation within ITSs.
The second part of the analysis addresses the transmission of traffic information via the Promet+ mobile application, representing a modern component of a C-ITS framework. This part of the study focuses on two update scenarios: continuous updating, where the application constantly monitors the system and immediately triggers an alert when an event is detected, and periodic updating, where the application queries the system for new information at 60 s intervals.
In both scenarios, the analysis evaluates the impact of manual and automated activation of information transmission and calculates how many drivers are not informed in a timely manner about an incident, under the assumption that all drivers have the Promet+ application installed, with sound notifications enabled and visual alerts properly configured. For continuous Promet+ updates, the number of uninformed drivers is determined solely by the transmission delay multiplied by the traffic flow, reflecting those who encounter an event before the alert reaches them.
In the case of continuous updating, the number of drivers not informed in time is calculated as follows (2):
where
- —number of drivers not informed in a timely manner via Promet+ continuous update [veh];
- —transmission delay [s];
- —traffic flow during peak hour i [veh/s].
However, due to high battery consumption, the Promet+ application currently operates in a periodic update mode with a 60 s interval. This trade-off between energy efficiency and information timeliness directly affects a driver’s ability to respond to unexpected events, as delayed information may mean a missed opportunity to divert to an alternative route.
Since the exact moment when the application will fetch and display new information cannot be predicted under fixed intervals, the analysis considers the worst-case scenario. This occurs when an accident is detected immediately after an update has just been completed, resulting in the next update occurring only after the full 60 s interval. When combined with the system’s own processing delay, this introduces a significant latency.
The impact of this delay is quantified using Equation (3):
where
- —number of drivers not informed in a timely manner via Promet+ with 60 s periodic updates [veh];
- —system transmission delay [s];
- —traffic flow during peak hour i i [veh/s].
This equation accounts for both the system delay and the fixed update interval, providing an estimate of drivers who may miss the alert under the worst-case timing scenario, assuming uniform traffic flow.
The methodology described enables a quantitative assessment of the effectiveness of various traffic information transmission methods and the impact of time delays on timely driver awareness. Based on the presented data and equations, the following section will provide specific calculations for each scenario, along with graphical representations that illustrate the differences between manual and automated information transmission via variable message signs and the PROMET+ mobile application.
4. Results
The graph in Figure 2 illustrates the time delays associated with each information transmission method, measured from the moment a hazard is detected in the Trojane tunnel to the activation of traffic portals or display of the alert in the Promet+ mobile application.
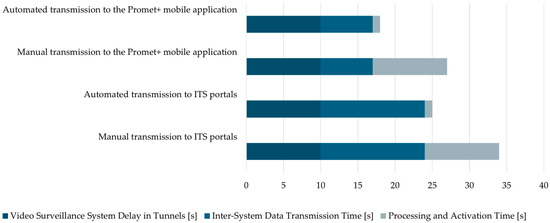
Figure 2.
Time delay in the transmission of traffic information to the portals and the Promet+ application.
The graph clearly shows that automated activation significantly reduces the time required to transmit traffic information compared to manual processes. The shortest delay is observed in the automated C-ITS transmission to the Promet+ app, whereas the longest delay occurs in the manual activation of traffic portals.
In the following sub-sections, the effectiveness of traffic information transmission through ITSs and C-ITSs will be presented separately.
4.1. Traffic Information Transmission Through Portals (ITSs)
Based on traffic data (Table 1 and Table 2) and on time delay data (Figure 2), firstly, results about the effectiveness of various combinations of activating traffic portals (ITS) located before the Trojane tunnel are examined. The focus is on response times, spatial coverage of information, and comparisons between manual and automated alert transmission methods. Three main scenarios for portal activation were considered: the activation of the first portal only, combination of the first and second portal, and simultaneous activation of all three portals. In all cases, the number of drivers who were not informed on time was monitored.
In the first scenario (Figure 3), when only the first portal, located 1.769 km before the tunnel entrance and 0.642 km before the Trojane exit, was activated, drivers received the alert “Tunnel closed” upon detecting the tunnel closure. This allowed drivers to exit the motorway in time and choose an alternative route, thus reducing the risk of congestion before the closure.
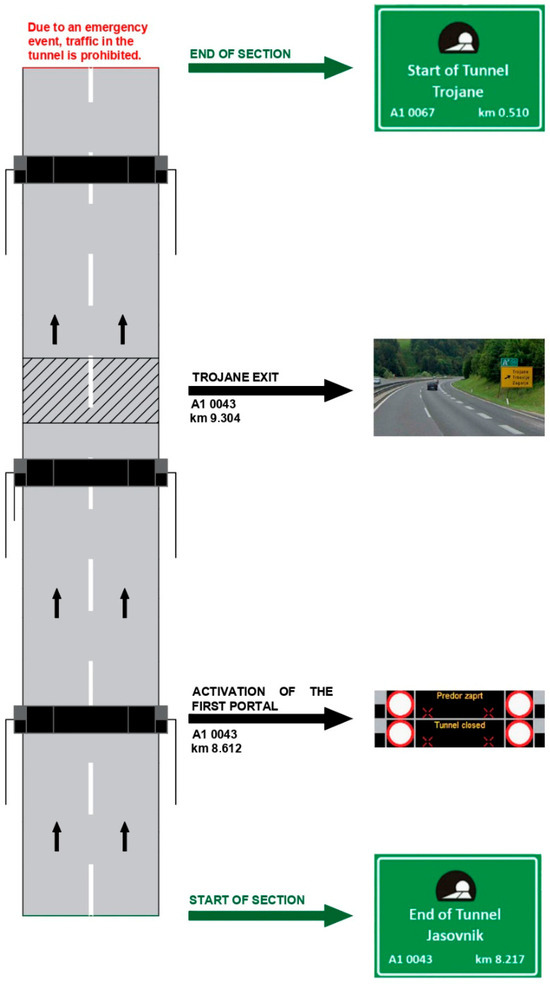
Figure 3.
Sketch of first portal activation during an event at the Trojane tunnel.
The results (Table 3) show that, with the manual activation of the portals during the morning traffic peak, 80 drivers were not informed on time, while with automated activation, this number dropped to 73. Similarly, in the afternoon peak, manual activation left 43 drivers uninformed, while automated activation reduced this number to 39. These results clearly indicate that automated information transmission improves notification efficiency and reduces the risk for drivers being in a closed area without prior warning.
Table 3.
Calculation of the number of drivers not informed in a timely manner during the first portal activation in the area before the Trojane tunnel.
Adding the second portal (Figure 4), located 1.177 km before the tunnel entrance and 0.050 km before the Trojane exit, significantly improved the spatial coverage of information. This portal acts as the last point where drivers still have the opportunity to leave the motorway before reaching the tunnel closure. The combination of the first and second portal allows for dual-level notification, an early warning followed by a confirmation of the closure right before the exit.
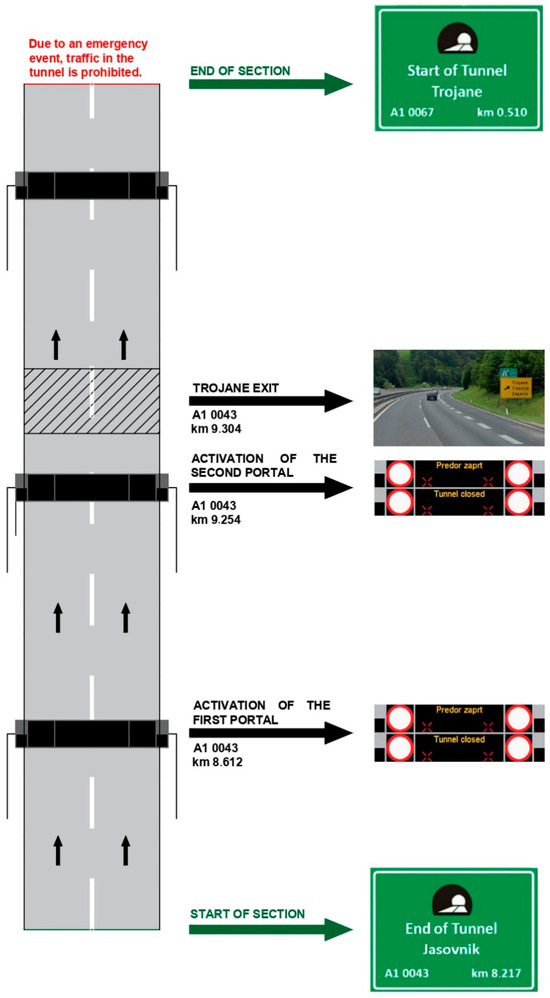
Figure 4.
Sketch of first and second portal activation during an event at the Trojane tunnel.
The analysis (Table 4) showed that with the manual activation of the second portal during the morning peak, 63 drivers were not informed, and in the afternoon peak, 34 drivers were not informed. Automated activation reduced this number to 56 drivers in the morning peak and 30 drivers in the afternoon peak. The results confirm that the combination of both portals improves the effectiveness of notifications, although automated activation remains key for timely communication.
Table 4.
Calculation of the number of drivers not informed in a timely manner during activation of the first and second portals in the area before the Trojane tunnel.
The third portal (Figure 5), located just 0.154 km before the Trojane tunnel, no longer offers an opportunity for vehicle diversion to alternative routes. Its goal is to provide operational safety by informing drivers of the immediate danger and allowing them to reduce speed in time and stop safely.
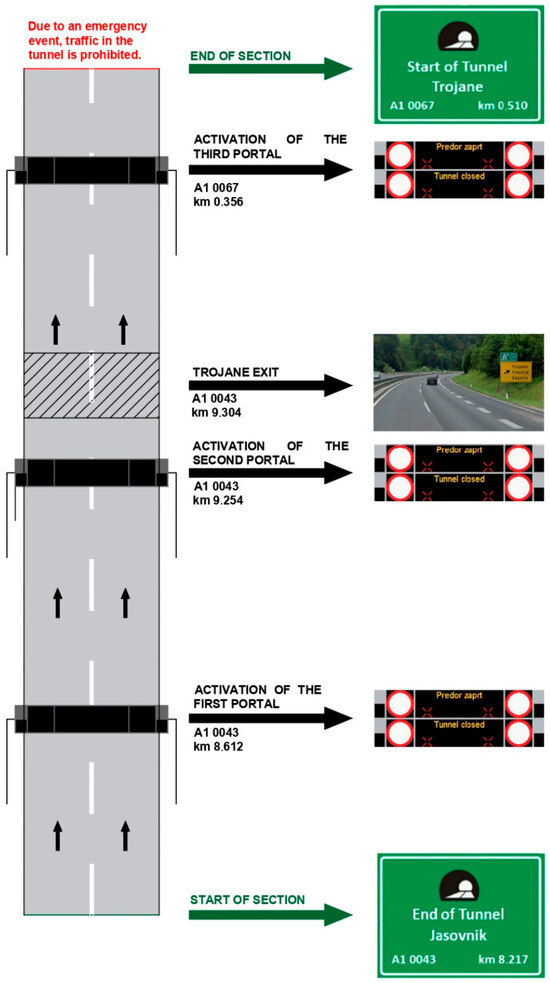
Figure 5.
Sketch of all three portals activation during an event at the Trojane tunnel.
The results of the analysis (Table 5) show that the number of uninformed drivers with activation of all three portals was slightly lower compared to activating one or two portals. With manual activation, 33 drivers remained uninformed in the morning peak and 18 in the afternoon peak, while automated activation reduced this number to 26 drivers in the morning and 14 drivers in the afternoon peak.
Table 5.
Calculation of the number of drivers not informed in a timely manner during activation of all three portals in the area before the Trojane tunnel.
These findings confirm that activating all three portals increases the effectiveness of notifications. However, automated activation is crucial for timely driver notification and greater safety, as it enables quick and accurate responses to tunnel closures.
4.2. Traffic Information Transmission Through Promet+ Mobile Application
In this second part of the analysis, the results of transmitting traffic information to the Promet+ mobile application are discussed, with two update methods tested: continuous updating of the application and updating every 60 s. Both scenarios were analyzed for manual and automated activation during the morning and afternoon traffic peaks.
With the continuous updating of the Promet+ application, the results showed that automated activation significantly improved the timeliness of driver notifications (Table 6). With manual activation, 22 drivers did not receive the alert on time during the morning peak, nor 12 during the afternoon peak. With automated activation, the number of uninformed drivers was even lower, with 15 in the morning and 8 in the afternoon peak. This proves that the automated system enables faster and more efficient information transmission.
Table 6.
Calculation of the number of drivers not informed in a timely manner during continuous application updates in the area before the Trojane tunnel.
With updates every 60 s (Table 7), the difference between manual and automated activation became even more pronounced. With manual activation, 71 drivers did not receive the alert on time during the morning peak, nor 38 during the afternoon peak. Automated activation reduced this number to 63 drivers in the morning and 34 in the afternoon peak, indicating that the automated system provides greater timeliness in notifications and reduces the number of drivers who are not informed about the emergency event.
Table 7.
Calculation of the number of drivers not informed in a timely manner during 60 s application updates in the area before the Trojane tunnel.
These results indicate that both conventional ITSs and C-ITSs significantly contribute to improving the timeliness of driver notifications about emergency events. Automated activation, both in ITSs and C-ITSs, demonstrates greater effectiveness in informing drivers, as it reduces the number of drivers who are not notified in time. C-ITSs, by transmitting information to the Promet+ mobile application, further increase the speed and accuracy of notifications. Together, these systems contribute to greater safety and a reduced risk of traffic congestion and accidents.
5. Discussion
The main objective of the study was to assess the effectiveness of ITSs and C-ITSs in relation to time delays in the transmission of traffic information and the accessibility of notifications for drivers. Both manual and automated modes of traffic information transmission were considered, with data analyzed from the RCC in Vransko for an average working day, namely 16 October 2024.
The results confirm that automated activation significantly reduces notification delays and consequently lowers the risk to drivers. The average time delay for manual activation at traffic portals was 34 s, and 27 s for continuous updates in the Promet+ application. In comparison, automated activation reduced these delays to 25 s for portals and 18 s for the Promet+ application. These findings highlight the advantages of automated systems in minimizing information transmission delays.
Data from Table 8 and Table 9 further demonstrate that continuous updates in the Promet+ application provide the highest level of driver information coverage. During the morning peak hour, only 15 drivers remained uninformed, while during the afternoon peak, the number dropped to eight—i.e., reducing the percentage of uninformed drivers by 79.45% in comparison to the activation of the first portal. In contrast, with a 60 s update interval, variability increased significantly, leaving up to 71 drivers uninformed. The comparison of results reveals that the difference between manual and automated activation is particularly notable at the first traffic portal, where automation reduces the number of uninformed drivers by 9%.
Table 8.
Number of uninformed drivers under time delays caused by manual system activation.
Table 9.
Number of uninformed drivers under time delays caused by automated system activation.
Moreover, continuous updates in the Promet+ application show less variation between morning and afternoon peak hours compared to traffic portals, indicating greater consistency in the system.
These findings confirm that the difference between continuous and 60 s updates in the Promet+ application is substantial, as the number of uninformed drivers can more than triple with longer update intervals. This suggests that introducing dynamic update intervals, where the application detects traffic density and adjusts the update frequency accordingly, would be a more effective approach to deliver information in a timely manner to the drivers in critical traffic conditions.
Figure 6 clearly shows that automated activation reduces the number of uninformed drivers in all cases, with the most significant difference observed at the first portal, where the number of uninformed drivers drops from 80 to 73.
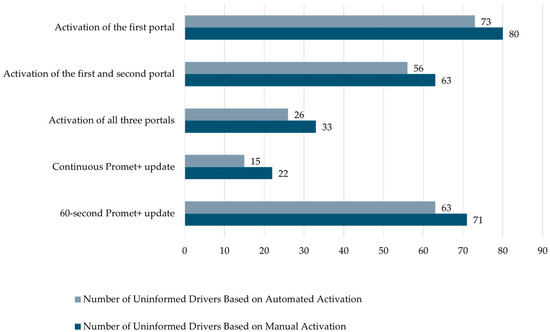
Figure 6.
Comparison of the number of uninformed drivers with manual and automated notification activation during the morning peak hour.
The findings indicate that the best results are achieved through a combination of the automated activation and continuous updates of the Promet+ application, as this ensures the fastest and most reliable dissemination of traffic information.
Furthermore, the distance of traffic portals from the critical area has proven to be an important factor, as it reduces the available reaction time for drivers—particularly under conditions of heavy traffic or poor visibility. This implies that integrating automated systems and optimizing portal placement can further enhance traffic safety and reduce the risk of congestion and rear-end collisions.
The analysis of the update frequency in the Promet+ mobile application confirmed that more frequent updates are essential for reducing the number of uninformed drivers. While a 60 s update interval may provide timely notifications on open motorway sections, it proves insufficiently responsive under dynamic traffic conditions. To improve responsiveness, it would be advisable to implement a dynamic update interval that allows for faster information transmission and reduces the number of uninformed drivers—especially in critical sections such as tunnels and areas prone to congestion. Reducing the interval to seven seconds would enable the notification method to reach the same level of timeliness as motorway portals, further enhancing the responsiveness of the C-ITS and improving road safety.
A combined use of an ITS and C-ITS is still recommended, as each system has its own strengths and limitations that complement one another. Motorway portals are effective but limited to specific sections of the network, whereas C-ITS enables broader and earlier warnings across the entire motorway infrastructure. The Promet+ application is particularly effective in adverse weather conditions, as it delivers alerts directly to the driver’s mobile screen, reducing the likelihood of missed warnings.
Nevertheless, due to the advantages of C-ITSs, traffic portals cannot be entirely replaced. The effectiveness of the application depends on mobile network coverage, which may be limited in tunnels or areas with weak signal, thus affecting the timeliness of alerts. Additionally, not all drivers use mobile applications or pay attention to notifications while driving, which limits the real-world reach of the system. One possible solution to improve system performance in or near tunnels would be the use of repeaters or dedicated infrastructure to ensure a stable communication link.
In the end, Table 10 provides a comparison between the present study and impact evaluation studies found in the literature. It can be noticed that only comparable studies were considered, i.e., research works dealing with ITSs/C-ITSs deployed on motorways, using real-world data and assessing existing systems. Three main observations can be made: Firstly, the majority of the studies use simulations to assess the effectiveness of the analyzed systems. In doing so, they generally analyze one existing situation and one possible, future system implementation. In comparison, the present research evaluates two existing systems, both already working on the considered motorway section. Also, the table highlights that previous studies mainly focus on the comparison of with—without cases, indicating that they assess the impact of only one type of system (either ITS or C_ITS). This study aims to evaluate the impact of both and compare the two systems to also highlight possible future improvements. Finally, most of the studies assess congestion and environmental factors, only secondarily evaluating the impact on road safety. The aim of this research is primarily to assess the effect on road safety, by understanding how many users would be able to avoid an unexpected dangerous event thanks to the deployed ITSs and C-ITSs, and consequently the effect on congestion.
Table 10.
Comparison between previous works and the present study.
6. Conclusions
Intelligent transport systems (ITSs) and cooperative intelligent transport systems (C-ITSs) represent a key technological advancement in the field of traffic management and road safety enhancement. Traditional ITS solutions, which rely on roadside infrastructure, provide information to drivers via overhead variable message signs and other visual indicators. However, their effectiveness is constrained by delays in information dissemination and the driver’s need to visually perceive and interpret the messages. In contrast, C-ITS enables direct communication between infrastructure and vehicles (I2V), and between vehicles themselves (V2V), significantly improving the speed and reliability of traffic information delivery. This low-latency exchange supports proactive driving behavior and better decision-making in critical scenarios.
The contribution of this study to the field of traffic management lies in the empirical assessment of the effectiveness of existing traffic notification systems (by analyzing the number of users notified) and the quantification of their latency. Using real-world data from DARS d.d., this study investigated how the speed of information transfer impacts timely driver awareness of traffic incidents on a motorway section leading to the Trojane tunnel (Ljubljana-bound). Two complementary systems were analyzed: a traditional ITS setup with roadside portals and a C-ITS system based on the Promet+ mobile application.
The findings reveal that continuous real-time updates through the mobile app significantly increase the timeliness of notifications and their accuracy: during the morning peak period, only 15 drivers remained uninformed when using the app, compared to a much higher number in scenarios relying solely on motorway portals. In the afternoon peak, this number dropped further to just eight uninformed drivers. These results affirm that C-ITS solutions offer faster, more accurate and efficient information dissemination than traditional ITS methods.
The main conclusions emphasize that a C-ITS offers superior adaptability, accuracy, and responsiveness to changing traffic conditions. The Promet+ app, with its continuous update feature, contributed to quicker driver awareness, which in turn reduced the likelihood of congestion and enhanced traffic safety.
Despite these promising results, this study has certain limitations. One major challenge is the dependency of C-ITSs on mobile network quality. In areas with weak signal coverage—such as tunnels or remote motorway segments—the reliability and timeliness of message delivery can be compromised. To effectively address this challenge, future research should explore the experimental implementation of dynamically adaptive update intervals based on real-time traffic and weather conditions. This would mean that in critical areas—such as tunnels or high-accident segments—the application would push updates at shorter intervals than in regular conditions. Additionally, the development of predictive models using artificial intelligence and historical traffic data could enable more accurate risk forecasting and automated activation of pre-emptive warnings. This would improve both safety and traffic flow while reducing the impact of unexpected incidents.
Practically, in order to not rely only on the mobile network, in the future, the C-ITS could be enhanced by integrating automatic accident detection through in-vehicle sensors, such as cameras, LiDAR, or radar. These sensors can immediately detect incidents and hazards, allowing vehicles to alert nearby traffic and the infrastructure in real time, to further reduce reaction times and improve safety.
Moreover, this study did not account for broader behavioral factors, such as driver reactions to different notification types and the overall user acceptance of mobile applications. Further research should also examine the impact of these factors. Also, it would be interesting to simulate the existing network and systems working on it and compare the simulation results to the ones obtained from this real-world analysis, and to further study other scenarios, different incident types and varying weather conditions evaluating them on system performance.
In the long term, a key objective for Slovenia and Europe should be the comprehensive integration of C-ITS hybrid communication with the existing ITS infrastructure, along with targeted infrastructure upgrades and the development of advanced predictive analytics. Such integration would significantly enhance the timeliness and precision of traffic information, optimize incident response, and ultimately improve road safety and traffic efficiency across the motorway network.
Author Contributions
Conceptualization, M.Š., C.G. and U.Z.; methodology, I.M. and C.G.; formal analysis, I.M.; investigation, I.M. and C.G.; resources, U.Z.; data curation, I.M.; writing—original draft preparation, I.M. and C.G.; writing—review and editing, M.Š., C.G. and U.Z.; visualization, I.M.; supervision, C.G., M.Š. and U.Z. All authors have read and agreed to the published version of the manuscript.
Funding
This research received no external funding.
Data Availability Statement
Dataset available on request from the authors.
Conflicts of Interest
The authors declare no conflicts of interest.
References
- PIARC. Road Network Operations and Intelligent Transport Systems—A Guide for Practitioners. Available online: https://rno-its.piarc.org/en/intelligent-transport-systems/what-its (accessed on 19 August 2025).
- Ferrante, E.; Giamarelos, O. Reference Handbook for Harmonized ITS Core Service Deployment in Europe. European ITS Platform. Available online: https://www.its-platform.eu/wp-content/uploads/ITS-Platform/AchievementsDocuments/ReferenceHandbook/EUEIP-ReferenceHandbook_accessible.pdf (accessed on 19 August 2025).
- Deveci, M.; Gokasar, I.; Pamucar, D.; Zaidan, A.A.; Wen, X.; Gupta, B.B. Evaluation of Cooperative Intelligent Transportation System scenarios for resilience in transportation using type-2 neutrosophic fuzzy VIKOR. Transp. Res. Part A Policy Pract. 2023, 172, 103666. [Google Scholar] [CrossRef]
- C-ROADS. Annual Deployment Overview Report 2023. Available online: https://www.c-roads.eu/fileadmin/user_upload/media/Dokumente/M43_Annual_deployment_overview_report_2023_v1.pdf (accessed on 19 August 2025).
- PROMET.SI. Promet+ Application. Available online: https://www.promet.si/en/promet-application (accessed on 10 August 2025).
- European Union. Directive 2010/40/EU of the European Parliament and of the Council of 7 July 2010 on the Framework for the Deployment of Intelligent Transport Systems in the Field of Road Transport and for Interfaces with Other Modes of Transport Text with EEA Relevance. Available online: https://eur-lex.europa.eu/eli/dir/2010/40/oj/eng (accessed on 20 August 2025).
- Duan, R. A comparative study on ITS (intelligent transport system) standardization policies in the U.S. and Europe. Heliyon 2023, 9, e21310. [Google Scholar] [CrossRef] [PubMed]
- Ducrest, A.J.; Chong, E.; Lee, C.; Yershov, A.; Nizov, M.; Kryuchkov, V.; Shen, Y. Facilitating the Deployment of Highly and Fully Automated Vehicles in Road Traffic Along the Asian Highway Network. Study Report; United Nations ESCAP: Bangkok, Thailand, 2022. [Google Scholar]
- De Souza, A.M.; Brennand, C.A.R.L.; Yokoyama, R.S.; Donato, E.A.; Madeira, E.R.M.; Villas, L.A. Traffic management systems: A classification, review, challenges, and future perspectives. Int. J. Distrib. Sens. Netw. 2017, 13, 1550147716683612. [Google Scholar] [CrossRef]
- De Souza, A.M.; Boukerche, A.; Maia, G.; Meneguette, R.I.; Loureiro, A.A.; Villas, L.A. Decreasing greenhouse emissions through an intelligent traffic information system based on inter-vehicle communication. In Proceedings of the 12th ACM International Symposium on Mobility Management and Wireless Access, Montreal, QC, Canada, 21–26 September 2014; pp. 91–98. [Google Scholar] [CrossRef]
- De Souza, A.M.; Villas, L.A. A new solution based on inter-vehicle communication to reduce traffic jam in highway environment. IEEE Lat. Am. Trans. 2015, 13, 721–726. [Google Scholar] [CrossRef]
- De Souza Am Yokoyama, R.S.; da Fonseca, N.L.S. Garuda: A new geographical accident aware solution to reduce urban congestion. In Proceedings of the IEEE International Conference on Computer and Information Technology; Ubiquitous Computing and Communications; Dependable, Autonomic and Secure Computing; Pervasive Intelligence and Computing, Liverpool, UK, 26–28 October 2015; pp. 596–602. [Google Scholar]
- Kshigar, N.; Sutar, U.S. An Intelligent Traffic Management and Accident Prevention System based on VANET. Int. J. Sci. Res. 2013, 14, 2319–7064. [Google Scholar]
- European Commission. Communication from the Commission to the European parliament, the Council, the European Economic and Social Committee and the Committee of the Regions, A European Strategy on Cooperative Intelligent Transport Systems, a Milestone Towards Cooperative, Connected and Automated Mobility; European Commission: Brussels, Belgium, 2010. [Google Scholar]
- Agriesti, S.A.M.; Ponti, M.; Marchionni, G.; Gandini, P. Cooperative messages to enhance the performance of L3 vehicles approaching roadworks. Eur. Transp. Res. Rev. 2021, 13, 1. [Google Scholar] [CrossRef]
- Walch, M.; Schirrer, A.; Neubauer, M. Impact assessment of cooperative intelligent transport systems (C-ITS): A structured literature review. Eur. Transp. Res. Rev. 2025, 17, 11. [Google Scholar] [CrossRef]
- Agriesti, S.A.M.; Studer, L.; Marchionni, G.; Gandini, P.; Qu, X. Roadworks Warning—Closure of a Lane, the Impact of C-ITS Messages. Infrastructures 2020, 5, 27. [Google Scholar] [CrossRef]
- Kotsi, A.; Mitsakis, E. Large scale deployment of C-ITS: Impact assessment results of the C-Roads Greece Pilots. In Proceedings of the 11th International Congress on Transportation Research, Heraklion, Greece, 20–22 September 2023; Available online: https://arxiv.org/pdf/2311.10734 (accessed on 16 July 2025).
- Degrande, T.; Vannieuwenborg, F.; Colle, D.; Verbrugge, S. From ITS to C-ITS motorway roadside infrastructure: The handicap of a headstart? In Proceedings of the 23rd Biennal Conference of the International Telecommunications Society, Gothenburg, Sweden, 21–23 June 2021; International Telecommunications Society (ITS): Calgary, Canada, 2021. [Google Scholar]
- Jang, J.; Ko, J.; Park, J.; Oh, C.; Kim, S. Identification of safety benefits by inter-vehicle crash risk analysis using connected vehicle systems data on Korean freeways. Accid. Anal. Prev. 2020, 144, 105675. [Google Scholar] [CrossRef]
- Frötscher, A.; Monschiebl, B. C-Roads: Elements of C-ITS service evaluation to reach interoperability in Europe within a wide stakeholder network. In Proceedings of the IEEE 87th Vehicular Technology Conference (VTC Spring) 2018, Porto, Portugal, 3–6 June 2018; pp. 1–5. [Google Scholar] [CrossRef]
- Lee, J.; Park, B.B. Evaluation of Route Guidance Strategies Based on Vehicle-Infrastructure Integration Under Incident Conditions. Transp. Res. Rec. J. Transp. Res. Board 2008, 2086, 107–114. [Google Scholar] [CrossRef]
- Ghahremannezhad, H.; Lin, C.; Shi, H. Traffic Surveillance Video Analytics: A Concise Survey; Innovative AI Technologie: Newark, NJ, USA, 2022. [Google Scholar]
- National Academies of Sciences, Engineering, and Medicine; National Research Council, Transportation Research Board. Highway Capacity Manual: A Guide for Multimodal Mobility Analysis, 7th ed.; National Academies Press: Washington, DC, USA, 2022. [Google Scholar]
- DARS d.d. D-05 Characteristics of the Trojane and Podmilje Tunnels. In Annexes to the Operational Protection and Rescue Plan in the Event of Accidents in the Trojane and Podmilje Tunnels, 4th ed.; DARS d.d.: Ljubljana, Slovenia, 2023. [Google Scholar]
- Fu, L.; Zhang, O.; Tian, S. Real-time video surveillance on highways using combination of extended Kalman Filter and deep reinforcement learning. Heliyon 2024, 10, e26467. [Google Scholar] [CrossRef] [PubMed]
- Geopedia, Sinergise Solutions d.o.o. Available online: https://www.geopedia.world/#T12_x1658785.7372887188_y5812209.495200409_s14_b2345 (accessed on 9 January 2025).


Disclaimer/Publisher’s Note: The statements, opinions and data contained in all publications are solely those of the individual author(s) and contributor(s) and not of MDPI and/or the editor(s). MDPI and/or the editor(s) disclaim responsibility for any injury to people or property resulting from any ideas, methods, instructions or products referred to in the content. |
© 2025 by the authors. Licensee MDPI, Basel, Switzerland. This article is an open access article distributed under the terms and conditions of the Creative Commons Attribution (CC BY) license (https://creativecommons.org/licenses/by/4.0/).