Article

The Innovativeness–Optimism Nexus in Autonomous Bus Adoption: A UTAUT-Based Analysis of Chinese Users’ Behavioral Intention

1
School of Design, Jiangnan University, Wuxi 214122, China
2
School of Textile Garment and Design, Changshu Institute of Technology, Changshu 215500, China
*
Author to whom correspondence should be addressed.
Vehicles 2025, 7(3), 87; https://doi.org/10.3390/vehicles7030087
Submission received: 4 July 2025 / Revised: 6 August 2025 / Accepted: 21 August 2025 / Published: 22 August 2025

Abstract

This study extended the Unified Theory of Acceptance and Use of Technology (UTAUT) by incorporating affective constructs (innovativeness, optimism, and hedonic motivation) to examine user adoption of autonomous bus (AB) in China, where government-supported deployment creates unique adoption dynamics. Analyzing 313 responses, collected via stratified sampling using SmartPLS 4.0, we identified innovativeness as the dominant driver (total effect, β = 0.347), directly influencing behavioral intention (β = 0.164*) and indirectly shaping optimism (β = 0.692*), effort expectancy (β = 0.347*), and hedonic motivation (β = 0.681*). Our findings highlight contextual influences in public service systems. Performance expectancy (β = 0.153*) exerts a stronger effect than hedonic or social factors (H6/H3 rejected), while optimism demonstrates a dual scaffolding effect (OPT→EE, β = 0.189*; OPT→PE, β = 0.401*), reflecting a “calculative optimism” pattern where users balance technological interest with pragmatic utility evaluation in policy-supported deployment contexts. From a practical perspective, these findings suggest targeting high-innovativeness users through incentive programs, emphasizing system reliability over ease of use, and implementing adapted designs. This study contributes to the literature both theoretically, by validating the hierarchical role of innovativeness in UTAUT, and practically, by offering actionable strategies for China’s ongoing AB deployment initiative, including ISO-standardized UX and policy tools such as municipal Innovator Badges.

1. Introduction

The rapid maturation of autonomous driving technology has positioned autonomous bus (AB) as a transformative innovation in public transportation systems. Empirical evidence demonstrates their multifaceted benefits: reducing private vehicle dependency [1,2], lowering accident rates by eliminating human error factors to some extent [3], expanding the availability of public transportation to late-night hours, and improving connectivity in various regions [4,5]. These advantages align with the global sustainability goals, particularly in densely populated urban areas where AB could reduce the carbon footprint of urban transportation [6].
Existing research has extensively explored the drivers of AB adoption, predominantly through the lens of the Unified Theory of Acceptance and Use of Technology (UTAUT). Key foci include technological readiness [7], safety perceptions [8], and policy frameworks [9]. Notably, behavioral intention (BI) emerges as the strongest predictor of actual AB adoption, accounting for a considerable proportion of usage variance in European contexts [10,11].
Despite growing research in this field, three critical gaps remain.
1. Temporal validity: In total, 78% of prior studies (n = 127) examined BI when AB were conceptual prototypes (2015–2020), whereas real-world operations—now taking place in 23 Chinese cities—fundamentally alter user experience dynamics [12];
2. Geographic bias: Despite China operating 42% of the global AB fleets [13], the vast majority of current research is conducted in Europe, with a few studies targeting North America and India [14];
3. Construct integration: Current models underrepresent affective drivers—optimism, innovativeness, and hedonic motivation collectively explain <15% of BI variance in UTAUT-based studies [15], despite their demonstrated significance in the adoption of connected vehicles [16] and shared mobility systems [17].
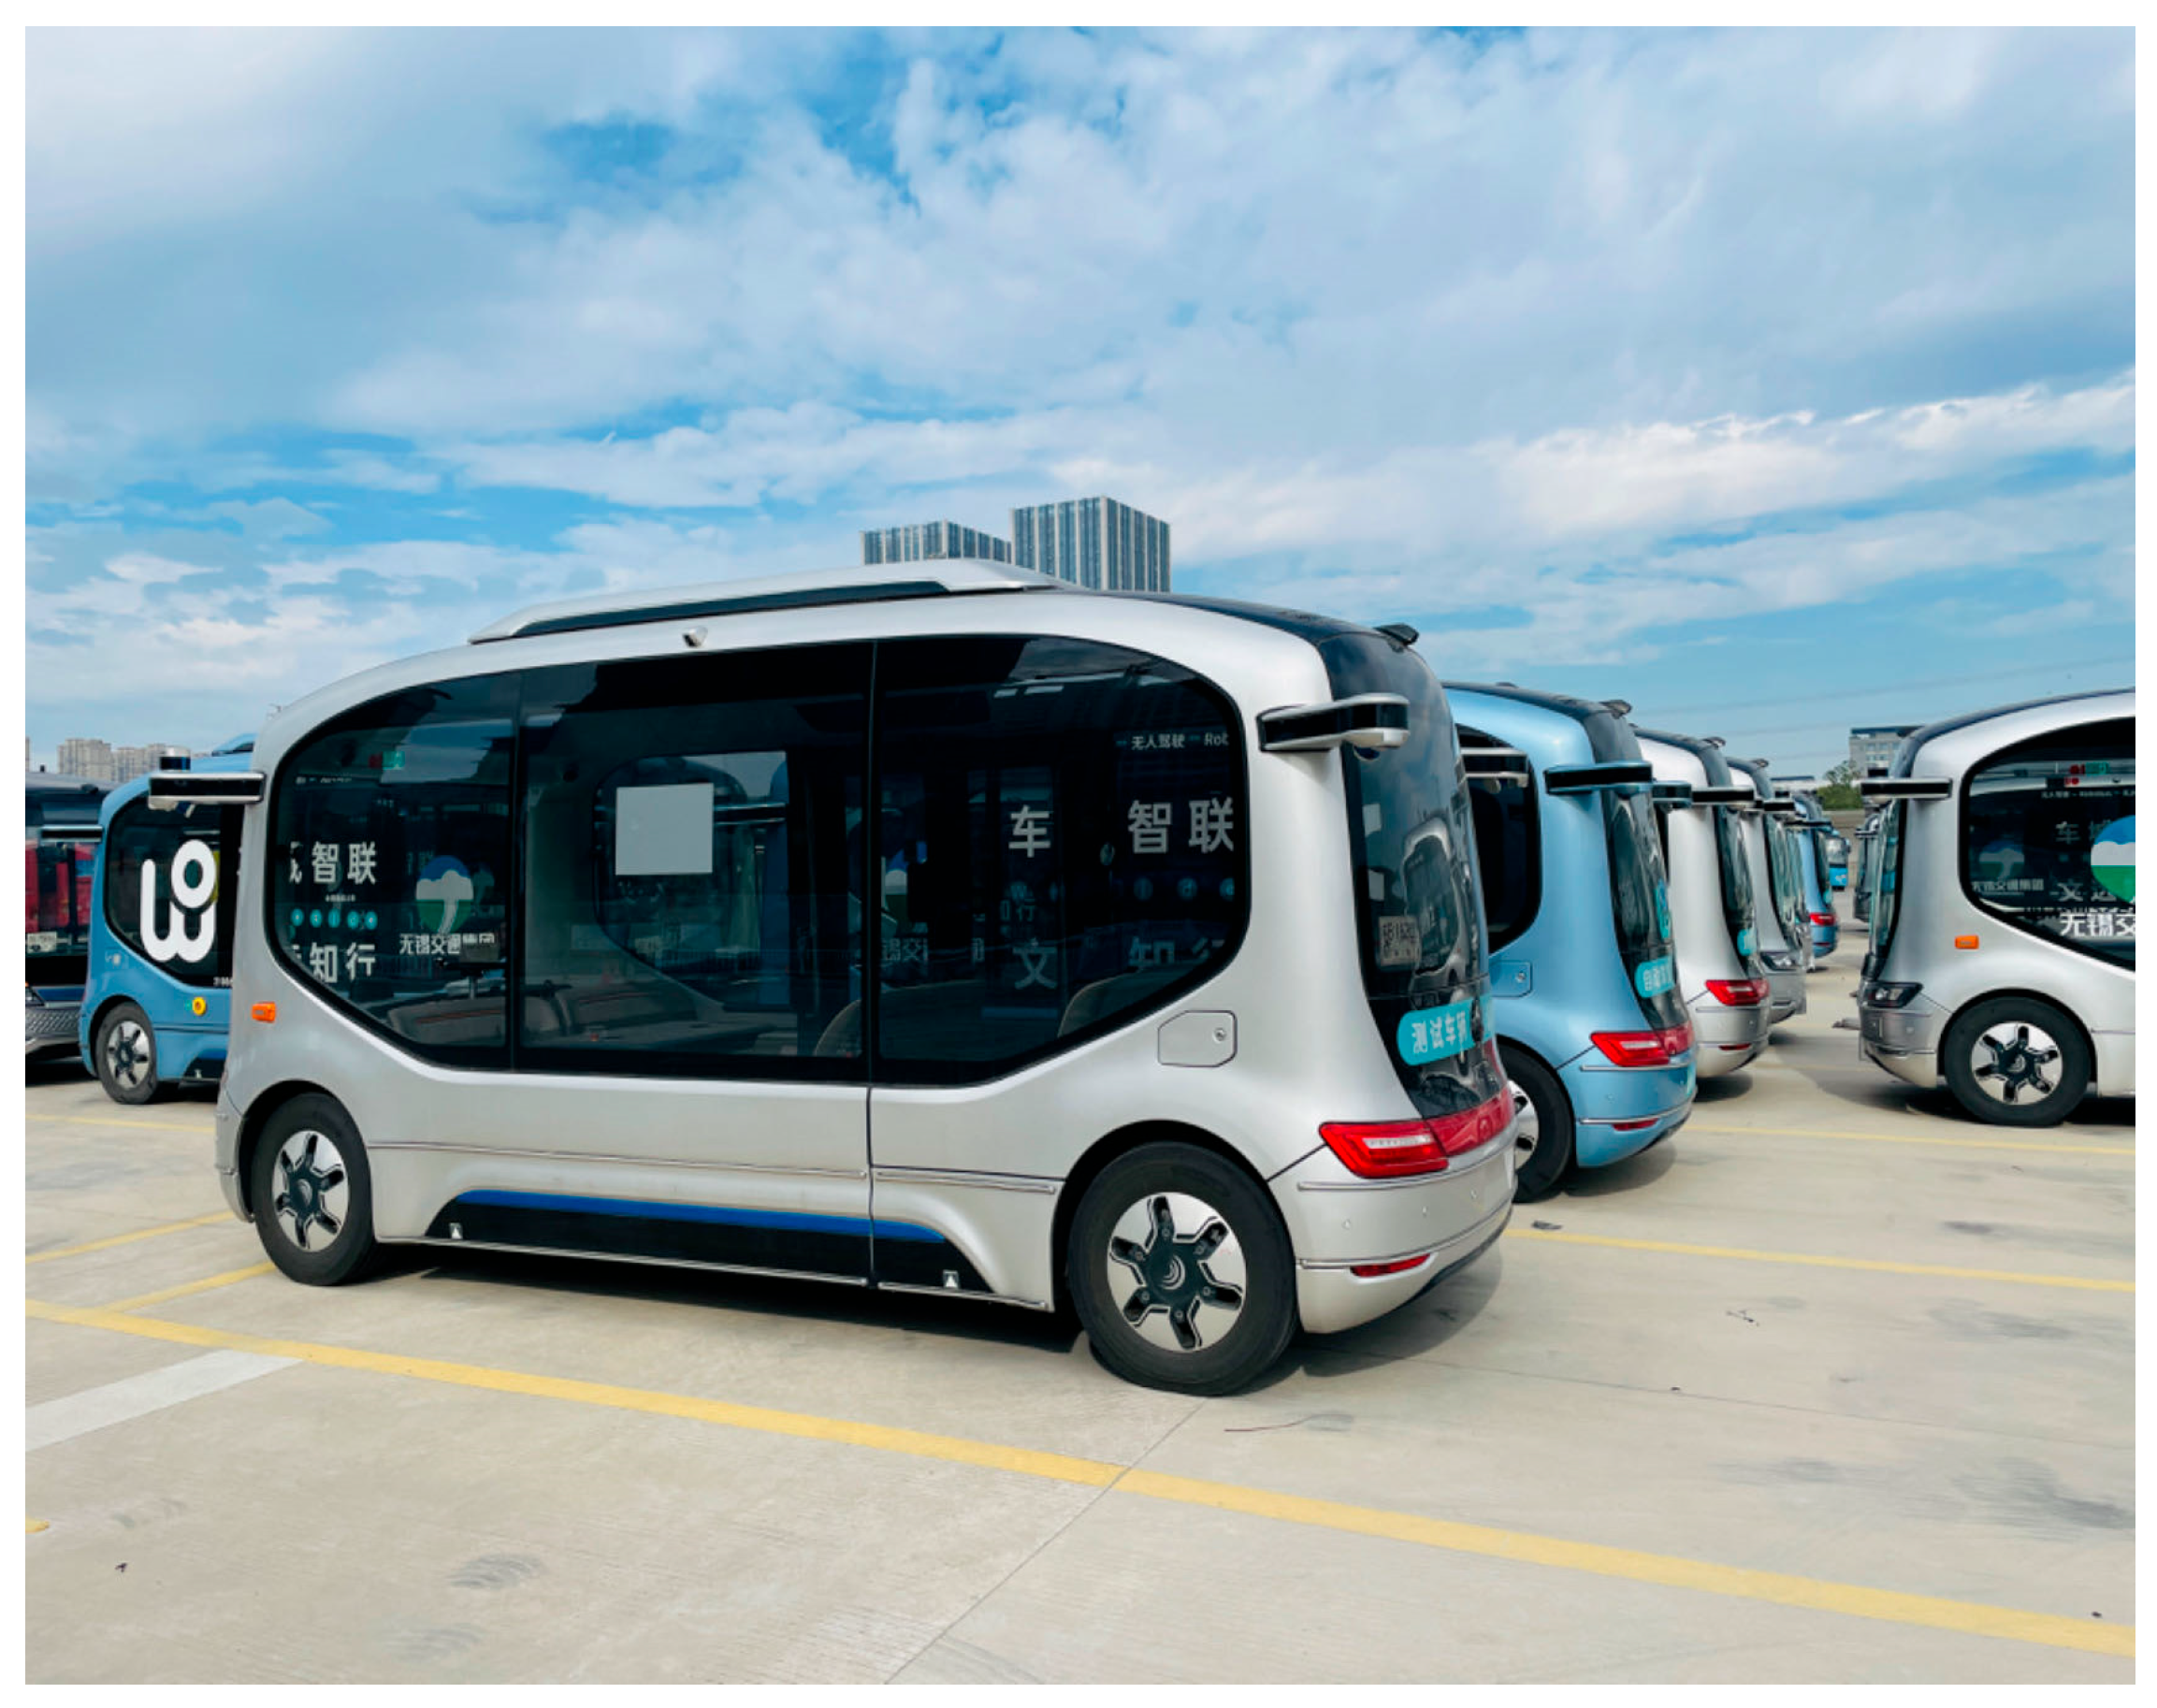
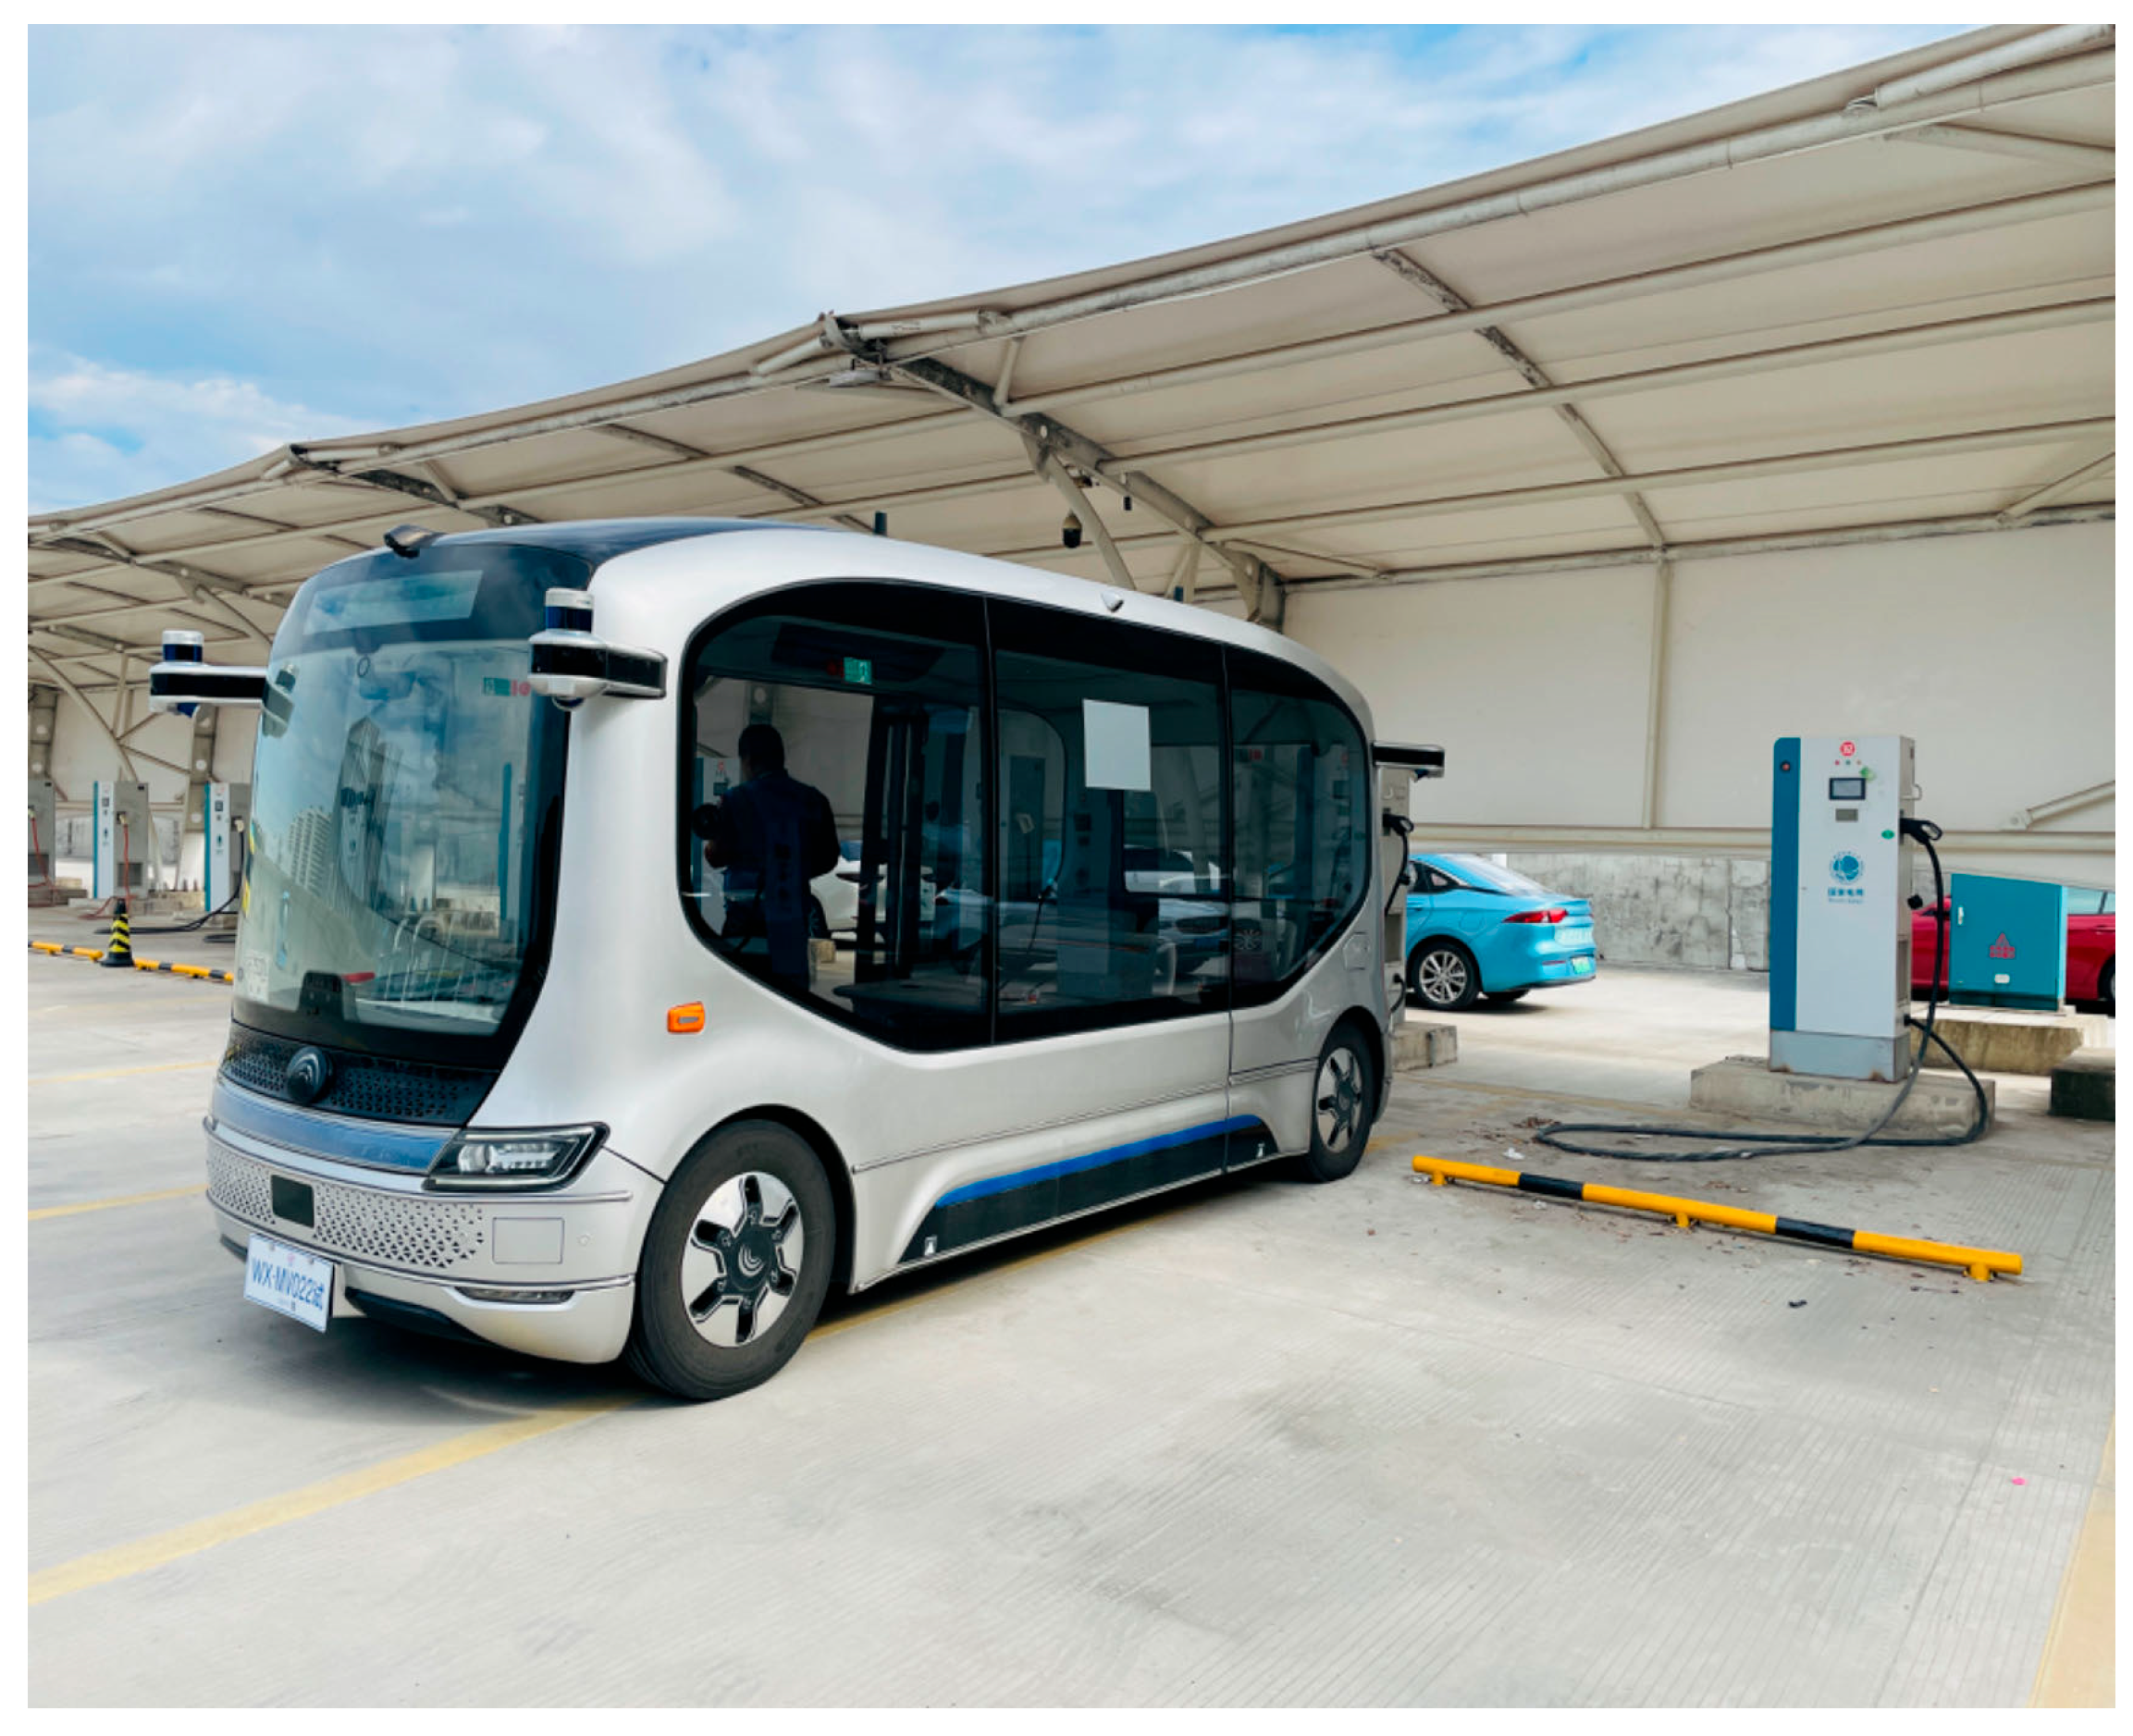
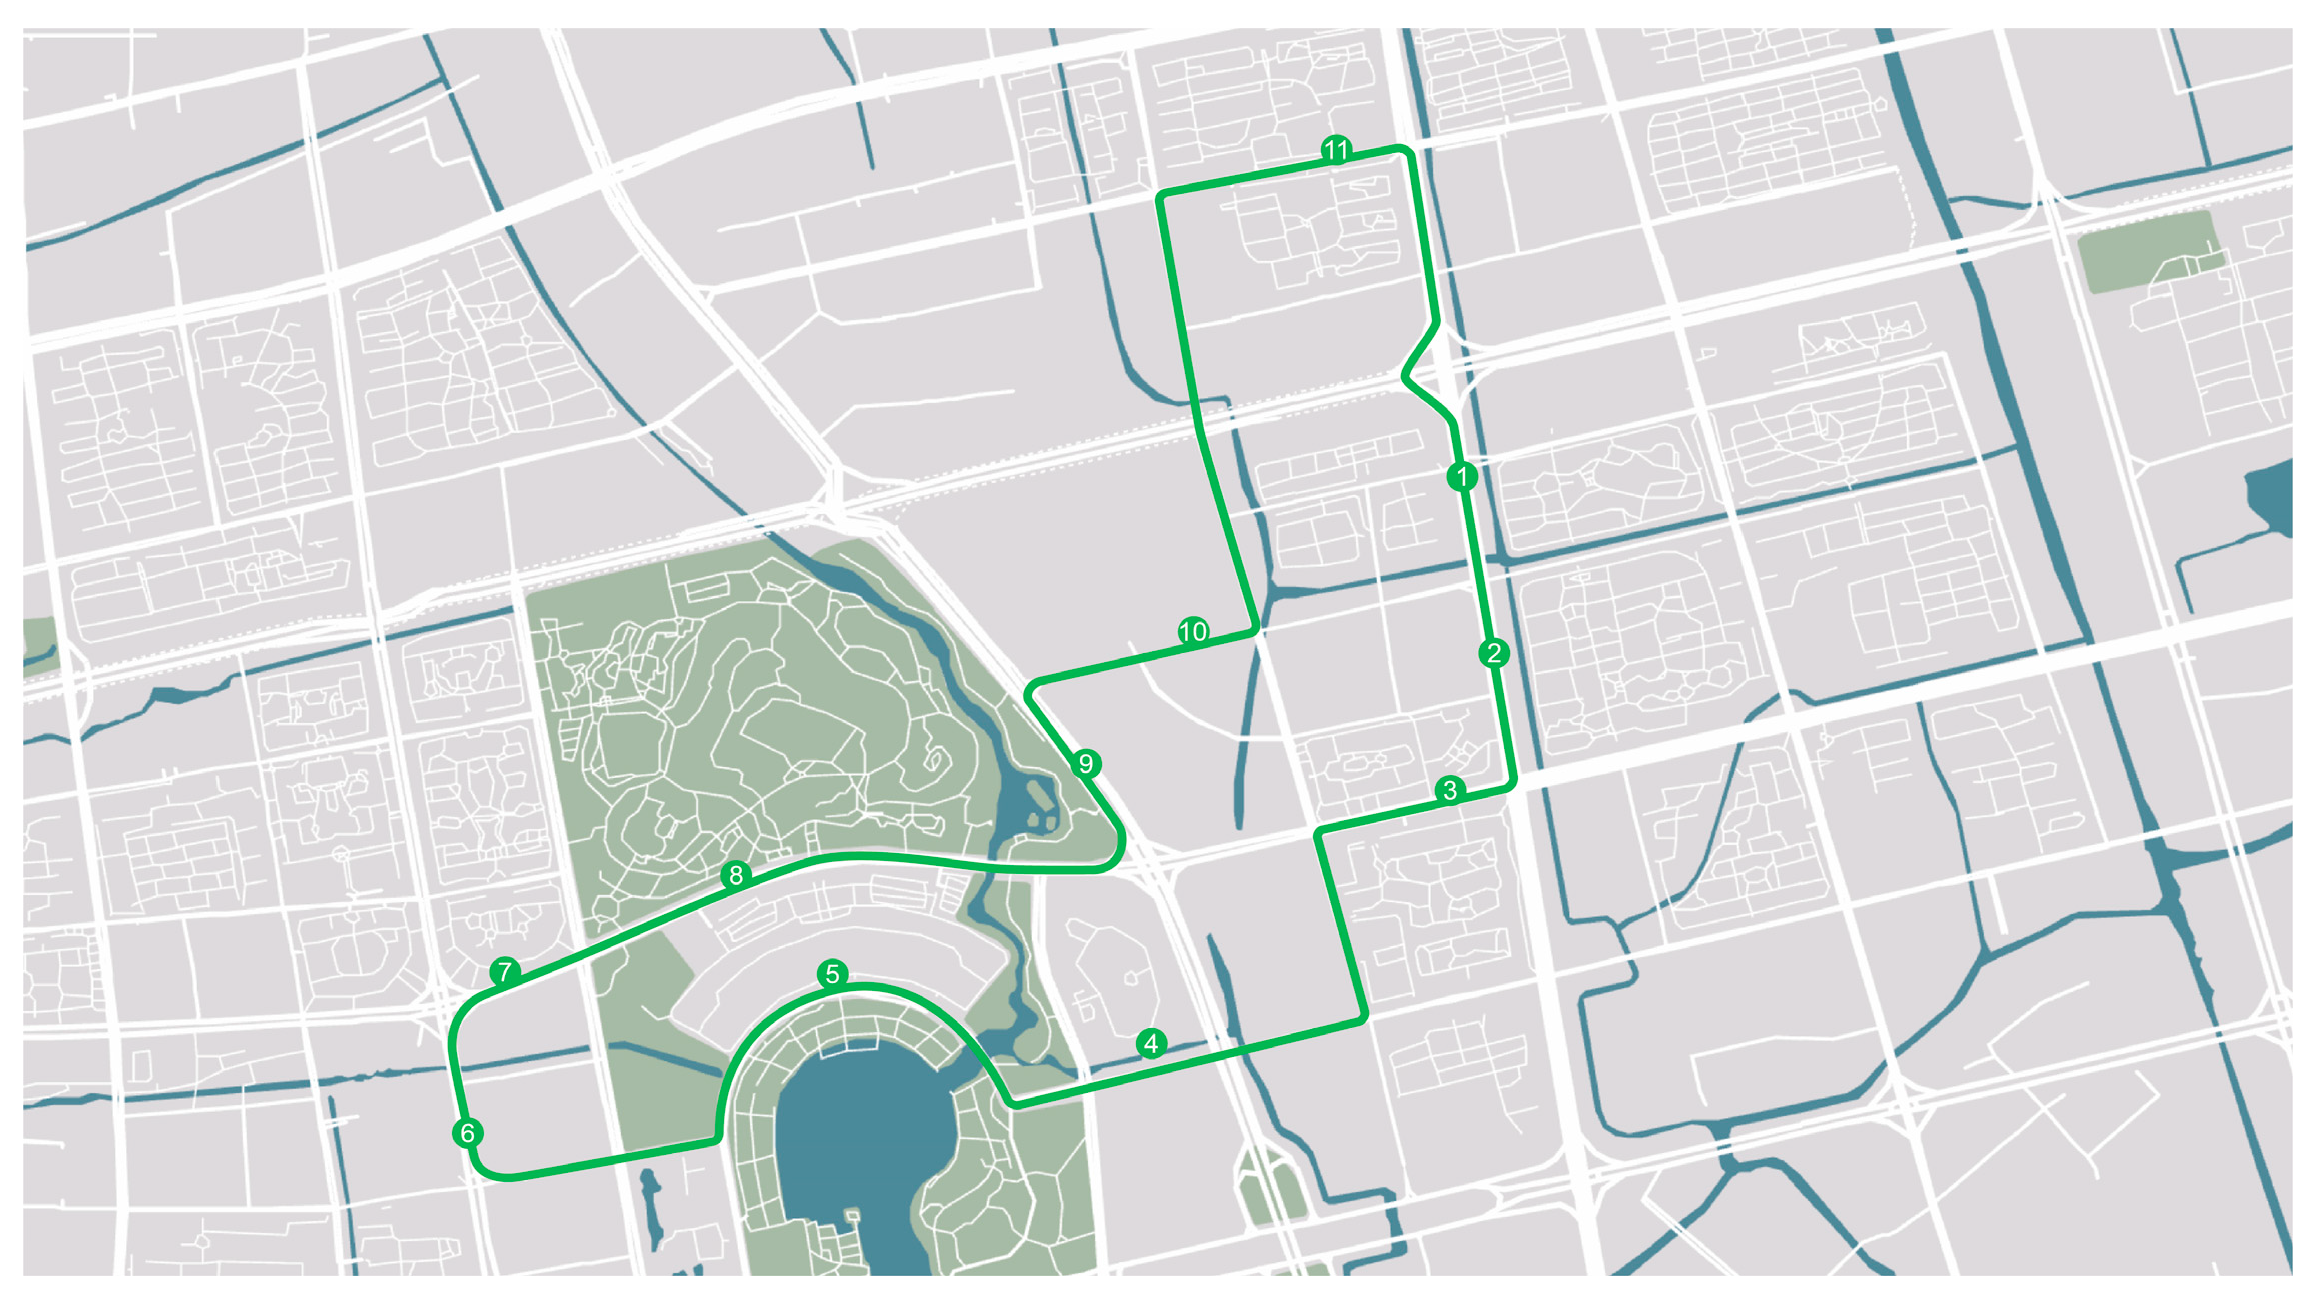
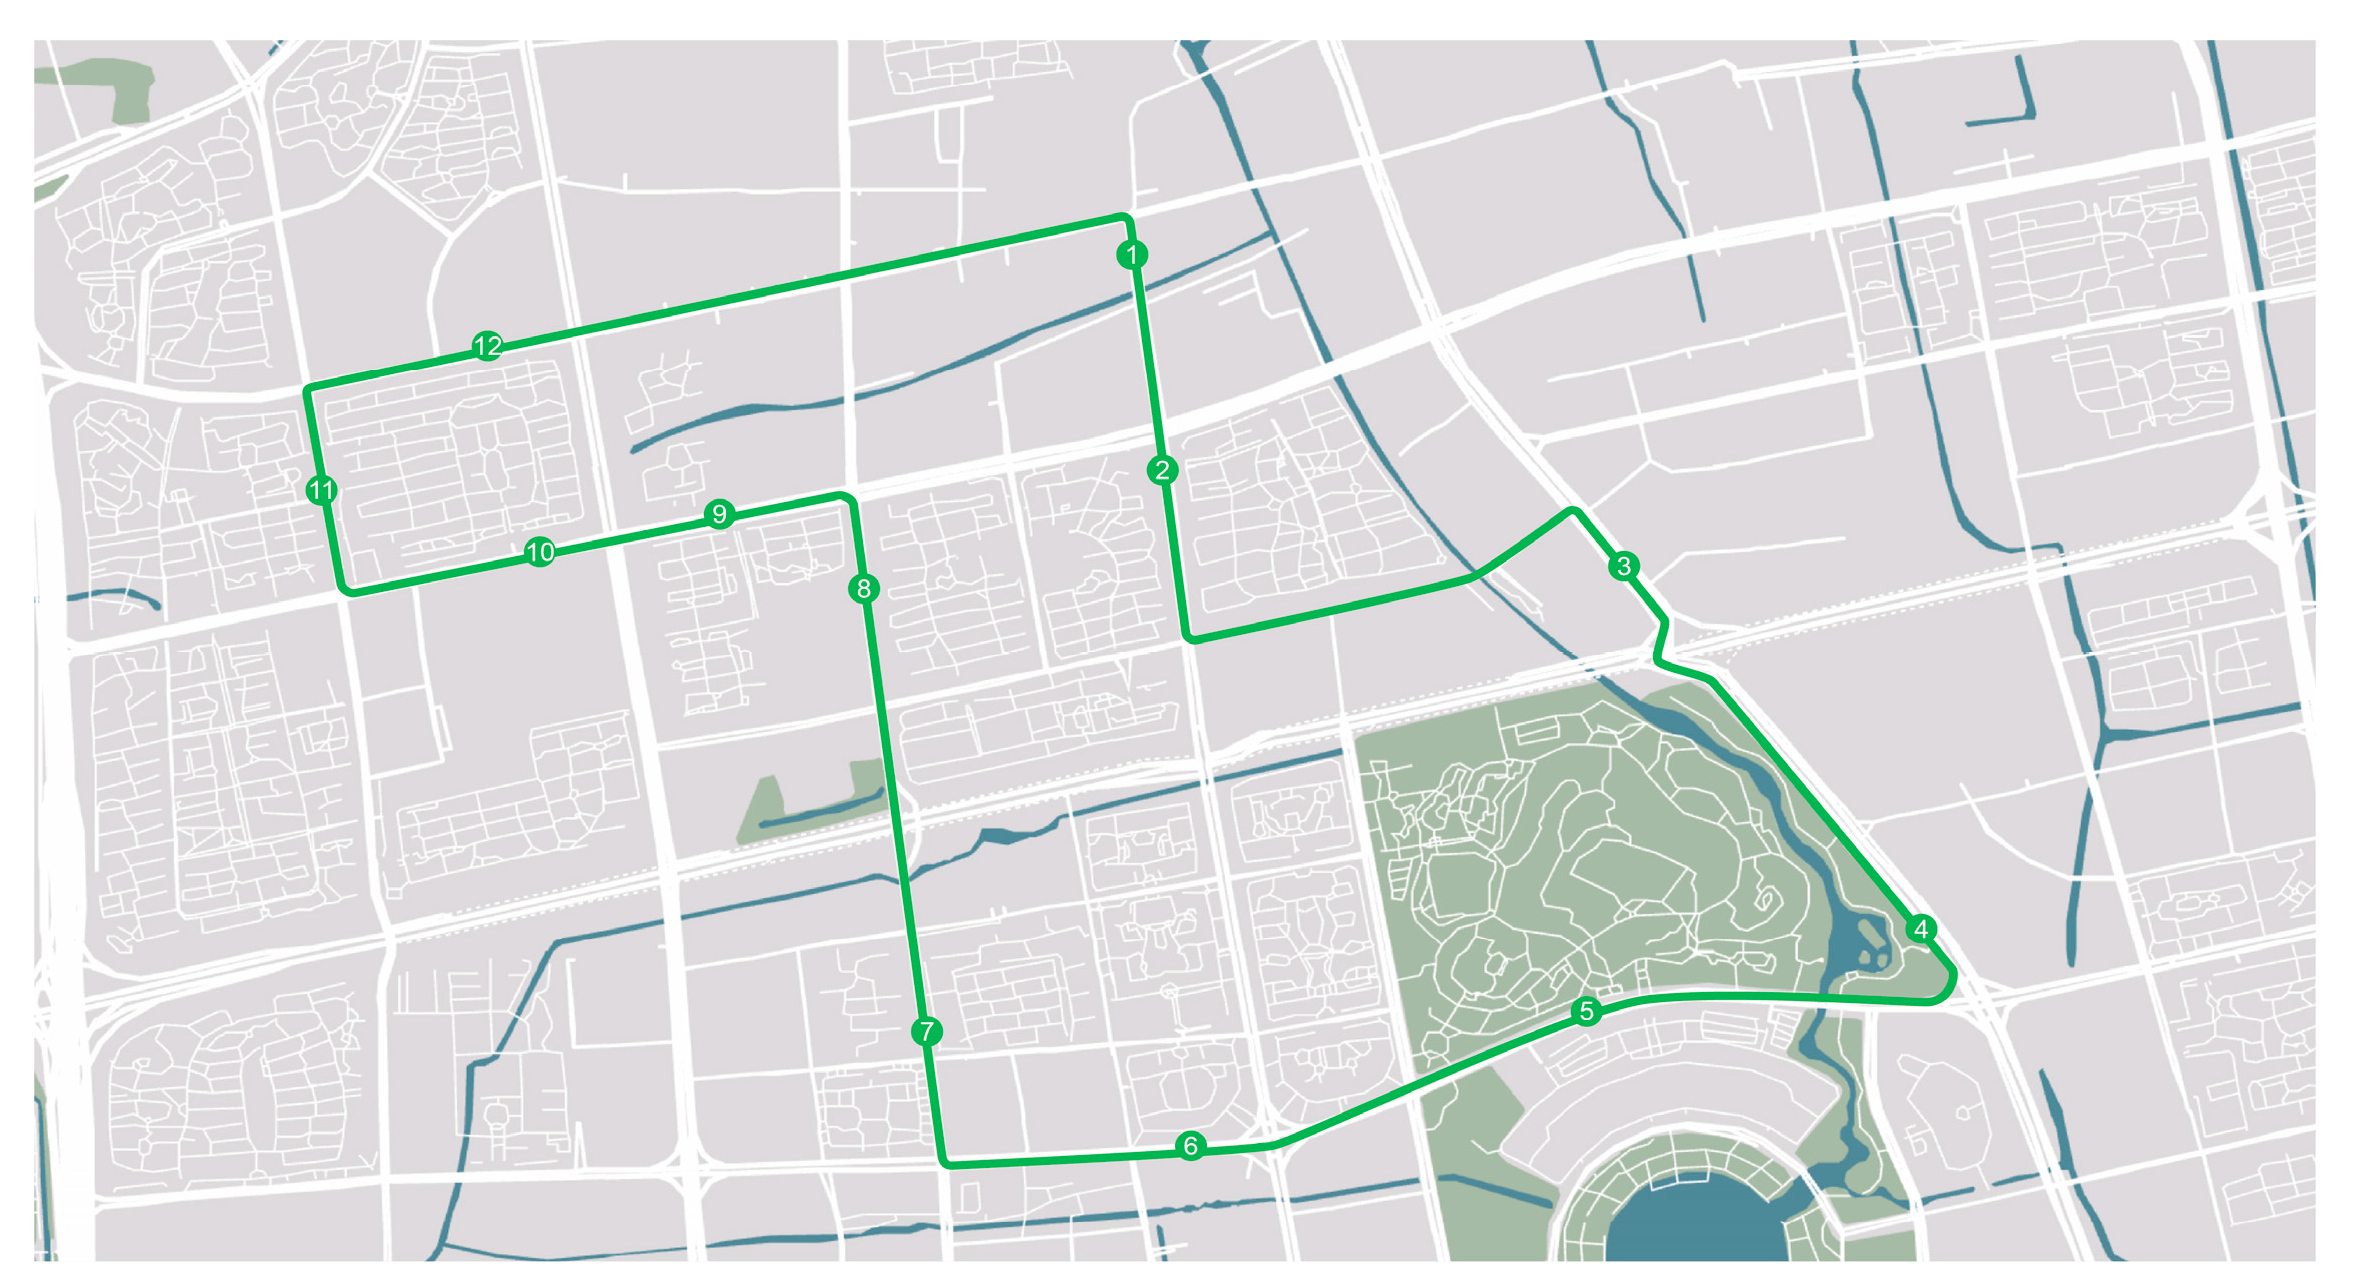
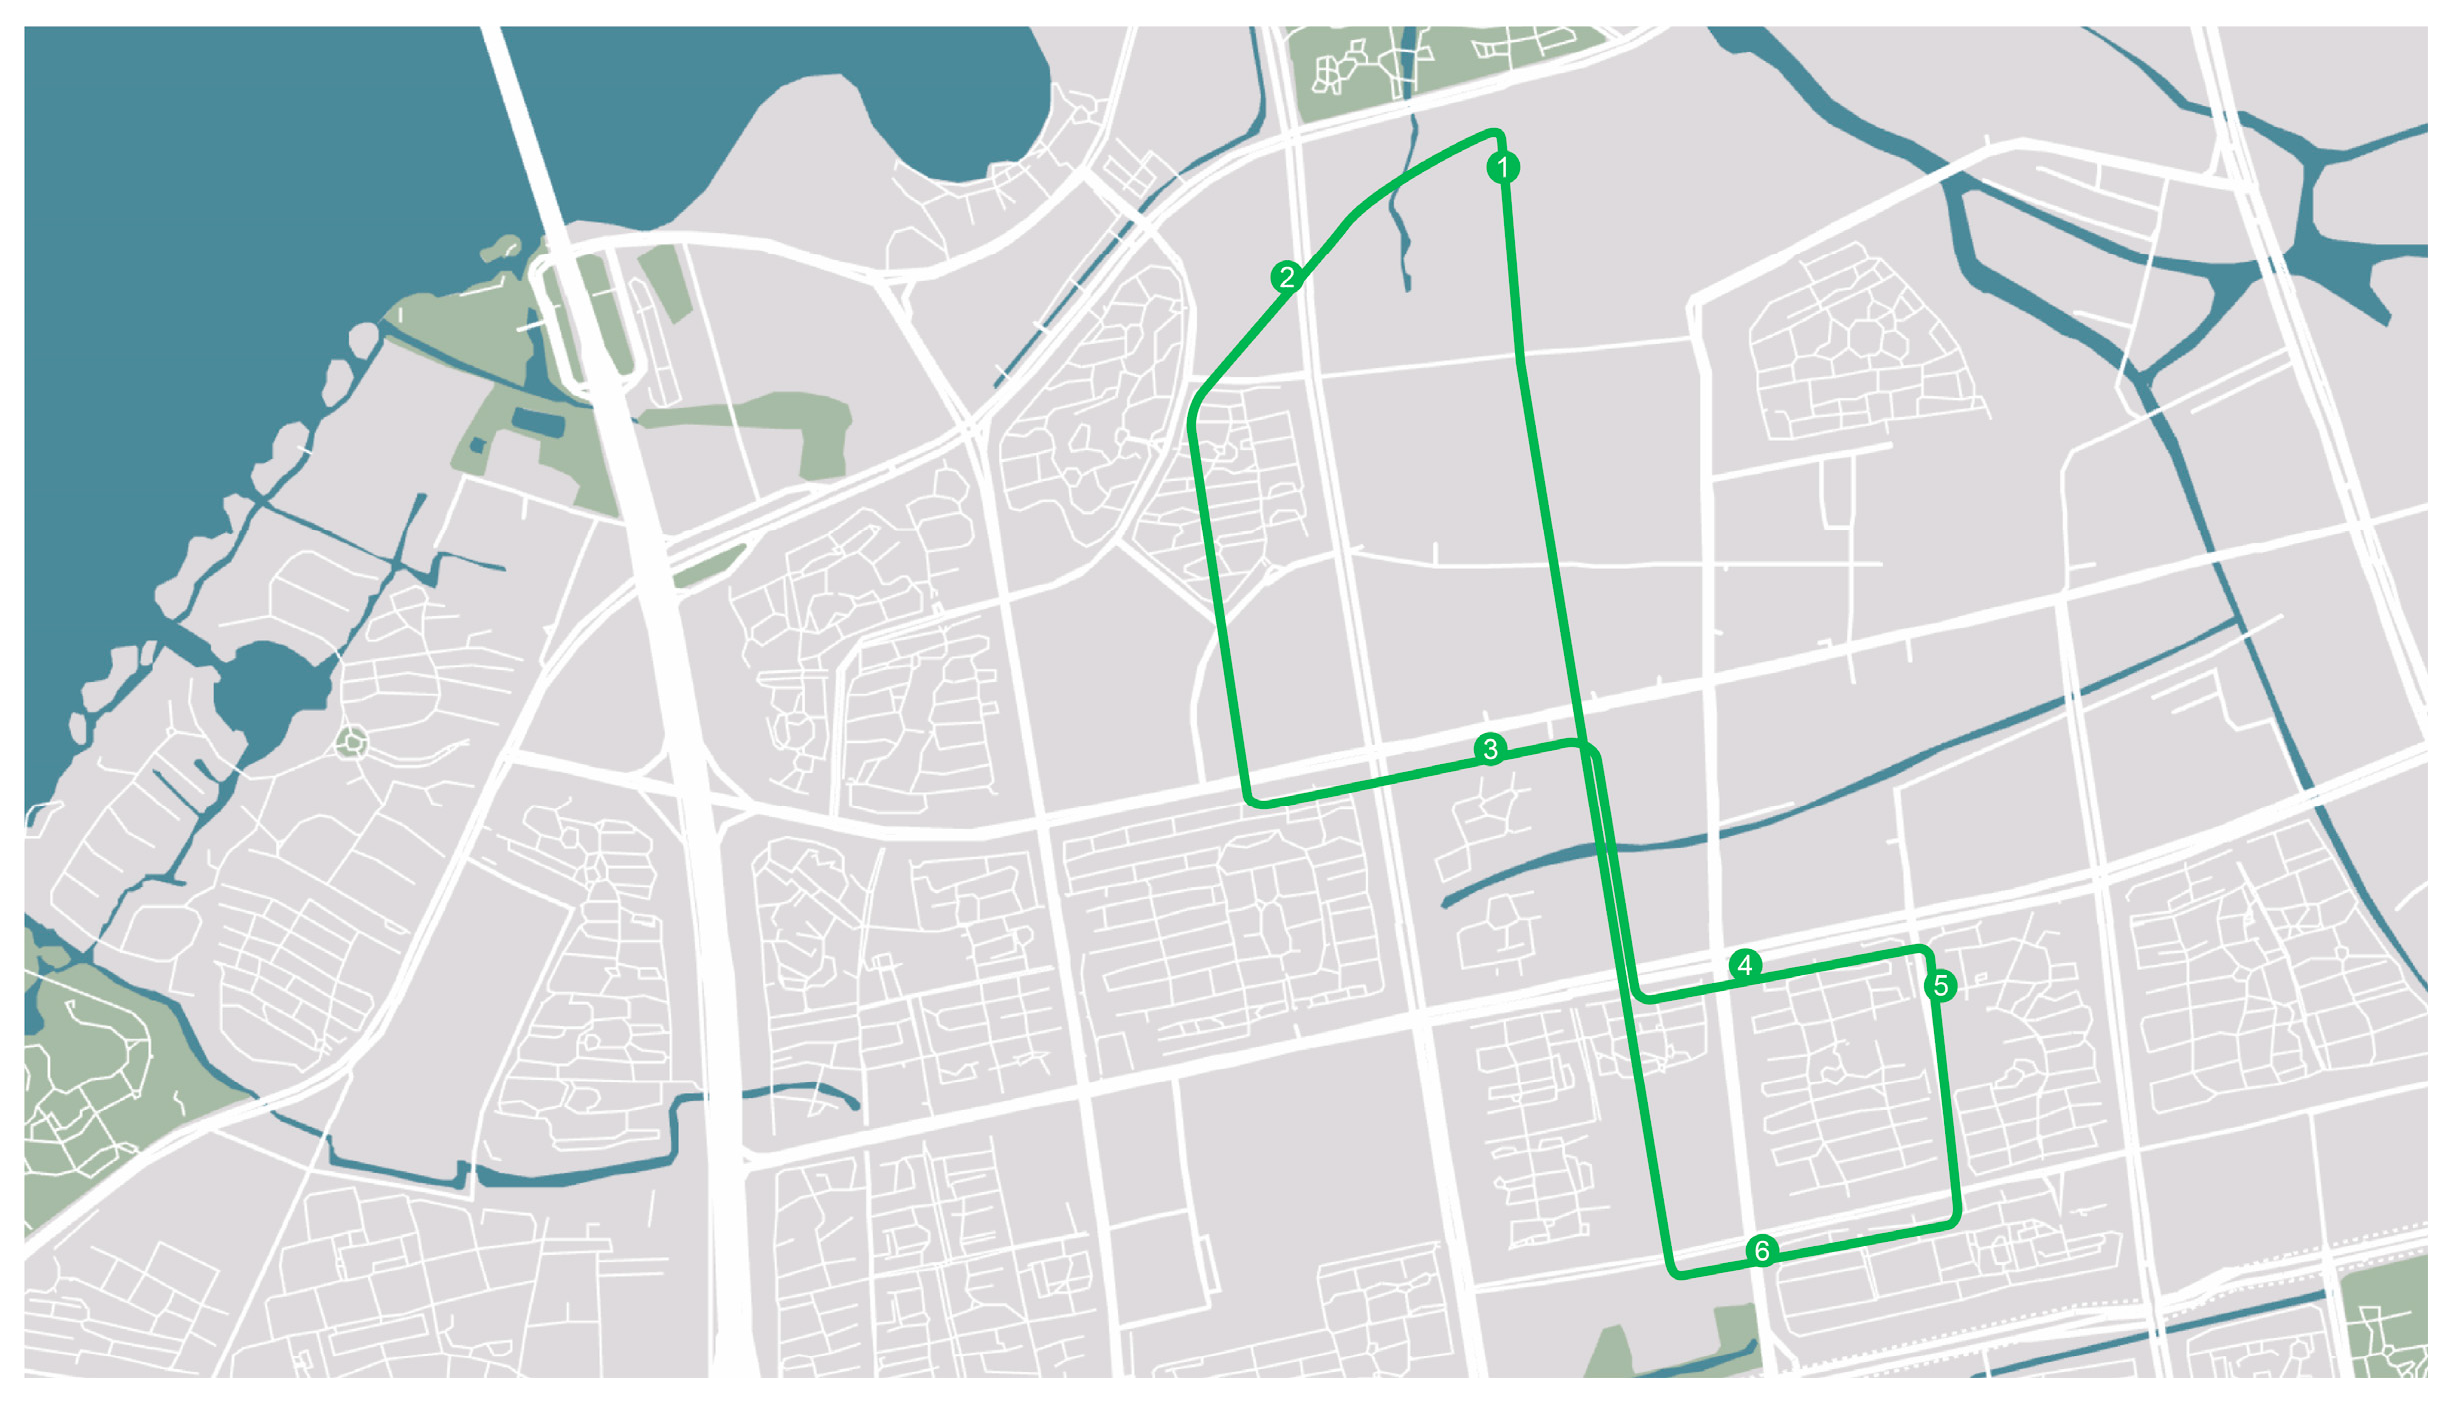
This study addresses these gaps through a contextually grounded investigation in Wuxi, China—a pioneer city with seven operational AB routes serving 43 stations (see Figure 1 for AB operating in Wuxi, and see Appendix A for additional operational details, including route maps and parking facilities). By integrating three affective constructs (innovativeness, optimism, and hedonic motivation) into an extended UTAUT framework, we examined how this triad of constructs mediates BI formation in real-world AB systems. Our findings provide actionable insights for policymakers navigating China’s staged AB development strategy and operators endeavoring to optimize user-centric service designs.

2. Literature Review

2.1. Theoretical Framework: Adaptation of UTAUT for AB

The UTAUT framework [18] provides a robust foundation for research on technology adoption, explaining 56–70% of behavioral intention (BI) variance in meta-analyses [19]. Its core constructs—performance expectancy (PE), effort expectancy (EE), and social influence (SI)—are particularly relevant to public-transport contexts where utilitarian evaluations inform the majority of adoption decisions [20].
However, AB exhibit fundamentally distinct adoption dynamics compared with private autonomous vehicles, necessitating a contextualized extension of UTAUT. Unlike private autonomous vehicles, where individual users control technology access and bear personal risks, AB in China operate within state-governed ecosystems featuring dedicated infrastructure (e.g., 5G-connected lanes) that homogenize conditions, facilitating their use across users [13], effectively eliminating individual agency in resource acquisition. This centralized governance structure simultaneously transforms risk perception—where safety concerns shift from personal liability to collective responsibility among passengers and government operators—thereby elevating performance expectancy (PE) as the primary evaluative criterion for system adoption [8]. Furthermore, whereas private AV adoption in Western contexts emphasizes hedonic features and personalized convenience, our preliminary data from Chinese AB pilots reveals that affective drivers (notably optimism toward technological maturity) account for a large proportion of behavioral intention variance during early deployment phases, superseding traditional institutional support mechanisms [15]. These contextual particularities justify both the exclusion of facilitating conditions (rendered irrelevant by policy-mandated resource parity) and the retention of PE, effort expectancy (EE), and social influence (SI) as core antecedents, albeit with modified operationalization: PE captures system-wide reliability rather than individual utility gains, EE reflects mandatory adaptation to standardized interfaces, and SI is channeled through institutional endorsements rather than peer networks. Therefore, H1, H2, and H3 are proposed.
H1: 
Performance expectancy positively influences users’ intention to take autonomous buses.
H2: 
Effort expectancy positively influences users’ intention to take autonomous buses.
H3: 
Social influence positively influences users’ intention to take autonomous buses.
Further, we propose the concept of cross-construct mediation. When users invest less effort in learning and using new tools or applications, they form a more optimistic view of the system’s usefulness in providing performance advantages [21,22]. In addition, social endorsements validate performance claims, as confirmed by previous studies [23]. Therefore, we propose H4 and H5:
H4: 
Effort expectancy positively influences performance expectancy with regard to taking autonomous buses.
H5: 
Social influence positively influences performance expectancy with regard to taking autonomous buses.

2.2. Hedonic Motivation: The Pleasure Principle

Hedonic motivation (HM), or perceived enjoyment/playfulness, defined as the intrinsic enjoyment derived from novel technological experiences [24], plays a pivotal role in shaping users’ acceptance of AB. In the context of emerging mobility technologies, HM not only directly stimulates adoption intention [25] but also fundamentally alters users’ cognitive evaluation processes. Specifically, AB elicit hedonic responses through two distinct mechanisms: (1) curiosity about AI-driven operational features [26], and (2) enjoyment of interactive sensor-based interfaces [27,28]. More significantly, HM serves as a cognitive heuristic that systematically lowers perceived effort barriers—users who anticipate enjoyable experiences tend to underestimate learning difficulties, as evidenced by the strong HM→EE pathway (β = 0.402) in public acceptance of conditionally automated cars [29]. This dual-pathway influence (direct for BI and indirect for EE) justifies our hypotheses that hedonic motivation positively impacts both behavioral intention (H6) and effort expectancy (H7) in the context of AB adoption.
H6: 
Hedonic motivation positively influences users’ intention to take autonomous buses.
H7: 
Hedonic motivation positively influences effort expectancy with regard to taking autonomous buses.

2.3. Optimism: The Technology Enabler

Optimism (OPT), conceptualized as an individual’s belief in technology’s controllability and transformative potential [30], serves as a critical cognitive catalyst in AB adoption through three synergistic mechanisms. Firstly, optimistic users exhibit a distinctive temporal bias—they systematically discount short-term technological imperfections while emphasizing long-term system benefits, a pattern empirically demonstrated in recent AV adoption studies [31]. Secondly, OPT functions as cognitive scaffolding that simultaneously (1) reduces perceived usage complexity by enhancing self-efficacy and (2) amplifies anticipated utility through “benefit magnification”, as evidenced in several service research studies [32,33]. This dual-pathway cognitive enhancement explains why optimists demonstrate significantly higher adoption intent than pessimists in comparable technological contexts [33]. Consequently, we establish three hypotheses that capture optimism’s multifaceted influence: the first pertains to its direct impact on behavioral intention (H8), the second pertains to its mediation through effort expectancy (H9), and the third pertains to performance expectancy enhancement (H10).
H8: 
Optimism positively influences users’ intention to take autonomous buses.
H9: 
Optimism positively influences effort expectancy with regard to taking autonomous buses.
H10: 
Optimism positively influences performance expectancy with regard to taking autonomous buses.

2.4. Innovativeness: The Meta-Antecedent

Innovativeness (IS) refers to a person’s tendency to be a technology pioneer and thought leader [30]. It operates as a foundational meta-construct that systematically shapes AB adoption through three interconnected psychological pathways. Firstly, at the affective level, innovators’ intrinsic novelty-seeking disposition directly enhances technological optimism by triggering positive emotional responses to unfamiliar systems [34]. Secondly, regarding cognitive evaluation, IS fosters robust technological self-efficacy that significantly lowers perceived effort thresholds, with empirical evidence showing that innovators require less training time to become competent with new transport technologies [35]. Thirdly, in the experiential domain, IS amplifies hedonic motivation through “exploration joy” [36]—the intrinsic pleasure derived from experimenting with novel features. Crucially, meta-analytic data confirms the dominant overall effect of IS on AB adoption, surpassing most individual UTAUT constructs in terms of predictive power [16]. This comprehensive influence pattern justifies our four hypotheses regarding the direct impact of IS on behavioral intention (H11) and its mediation effects on three pathways: optimism (H12), effort expectancy (H13), and hedonic motivation (H14).
H11: 
Innovativeness positively influences users’ intention to take autonomous buses.
H12: 
Innovativeness positively influences optimism towards taking autonomous buses.
H13: 
Innovativeness positively influences effort expectancy with regard to taking autonomous buses.
H14: 
Innovativeness positively influences hedonic motivation with regard to taking autonomous buses.
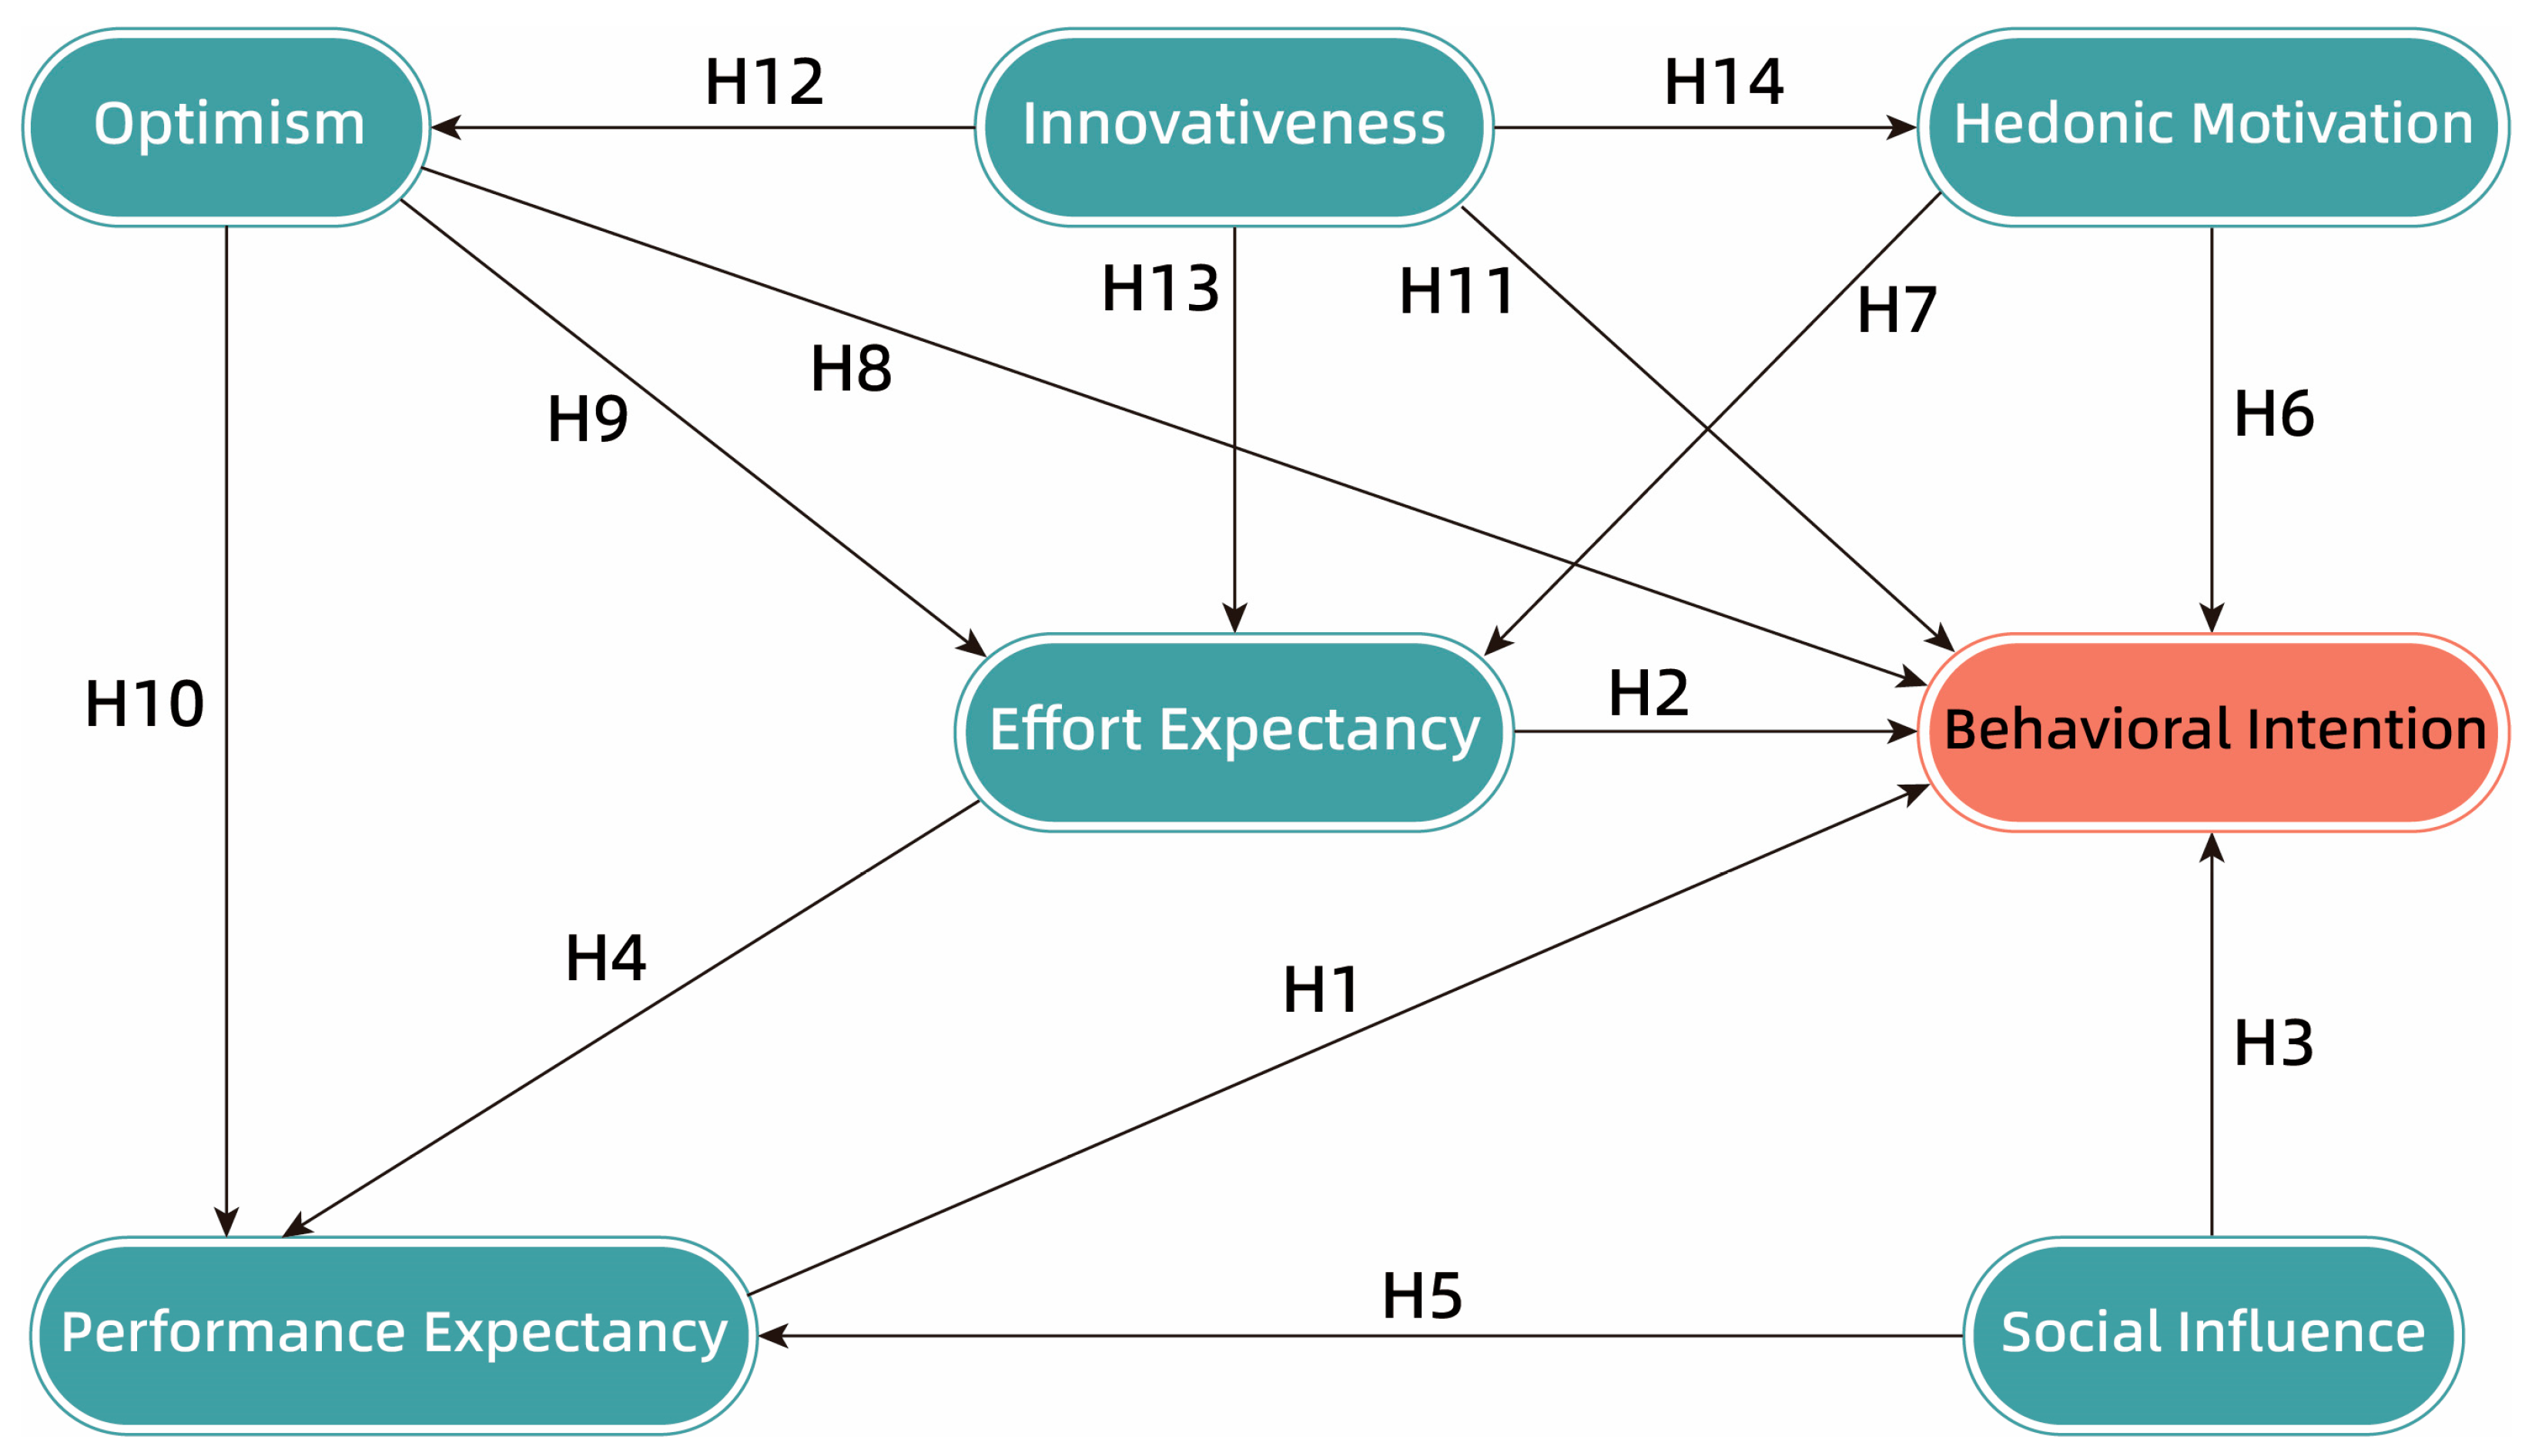
Based on the above discussion and hypotheses, this study constructed the model shown in Figure 2. This model aimed to explore the influencing factors and pathway relationships of users’ behavioral intention toward AB, including the relationships between variables.

3. Methodology

3.1. Questionnaire Design

To ensure measurement validity, scales were adapted from the established literature with context-specific modifications for AB. Three experts were invited to check and evaluate the suitability of item phrasing, including semantic localization. The questionnaire consisted of three parts. The first part provided a detailed explanation of AB, how they work and how to use one, and high-resolution images of different AB, with some interior pictures clearly showing the cabin with no steering wheel or driver. We also provided instructions for conducting this study in this section. The second part collected respondents’ basic information, including gender, age, educational level, occupation, and place of residence, to obtain their demographic characteristics. The third part consisted of questions relating to each construct to obtain sample data (see Table 1). A seven-point Likert scale was used to measure these constructs, where 1 indicates strong disagreement and 7 indicates strong agreement. Respondents were advised to choose the answers that most faithfully represent their past experiences and their thoughts.

3.2. Data Collection

Data were collected through a stratified random sampling approach via Wenjuanxing (www.wjx.cn, accessed on 4 July 2024), China’s largest academic survey platform, with over 50 million registered users. The stratification protocol prioritized (1) proportional representation of key demographic groups nationwide, including tech-engaged youth (18–25 years, 25.6%) and transportation-vulnerable seniors (51–60 years, 23.0%), with intentional oversampling of teachers (29.1%) due to their established role in studies of early technology adoption. Geographic distribution was controlled through the platform’s geo-targeting feature, yielding 52.7% of respondents from Central China and 34.2% from East China—the regions containing the most operational AB routes at the time of the survey. We employed the following rigorous quality controls: (1) minimum completion time thresholds and (2) IP/device fingerprint validation, which excluded 17 duplicate or incomplete responses. A total of 313 valid responses were obtained, and the demographic information of the respondents is shown in Table 2.

4. Results

4.1. Reliability and Validity Test

This analysis shows that the overall Cronbach’s α values of the measurement scale and the internal values of each construct are all greater than 0.6, and the standard loadings of each item corresponding to the model’s latent variables are all greater than 0.7. The composite reliability (CR) values are also greater than 0.7, indicating high internal consistency and good reliability among the items [46]. The average variance extracted (AVE) for each construct is greater than 0.5, and the square root of the AVE for each construct is greater than the correlation coefficients between that construct and other constructs. Therefore, the convergent and discriminant validity of this measurement scale are good [47]. Additionally, the variance inflation factor (VIF) for each item is less than 10; thus, there are no multicollinearity issues among the constructs in this model [48]. The analysis results are shown in Table 3 and Table 4.

4.2. Pathway Analysis and Hypothesis Test

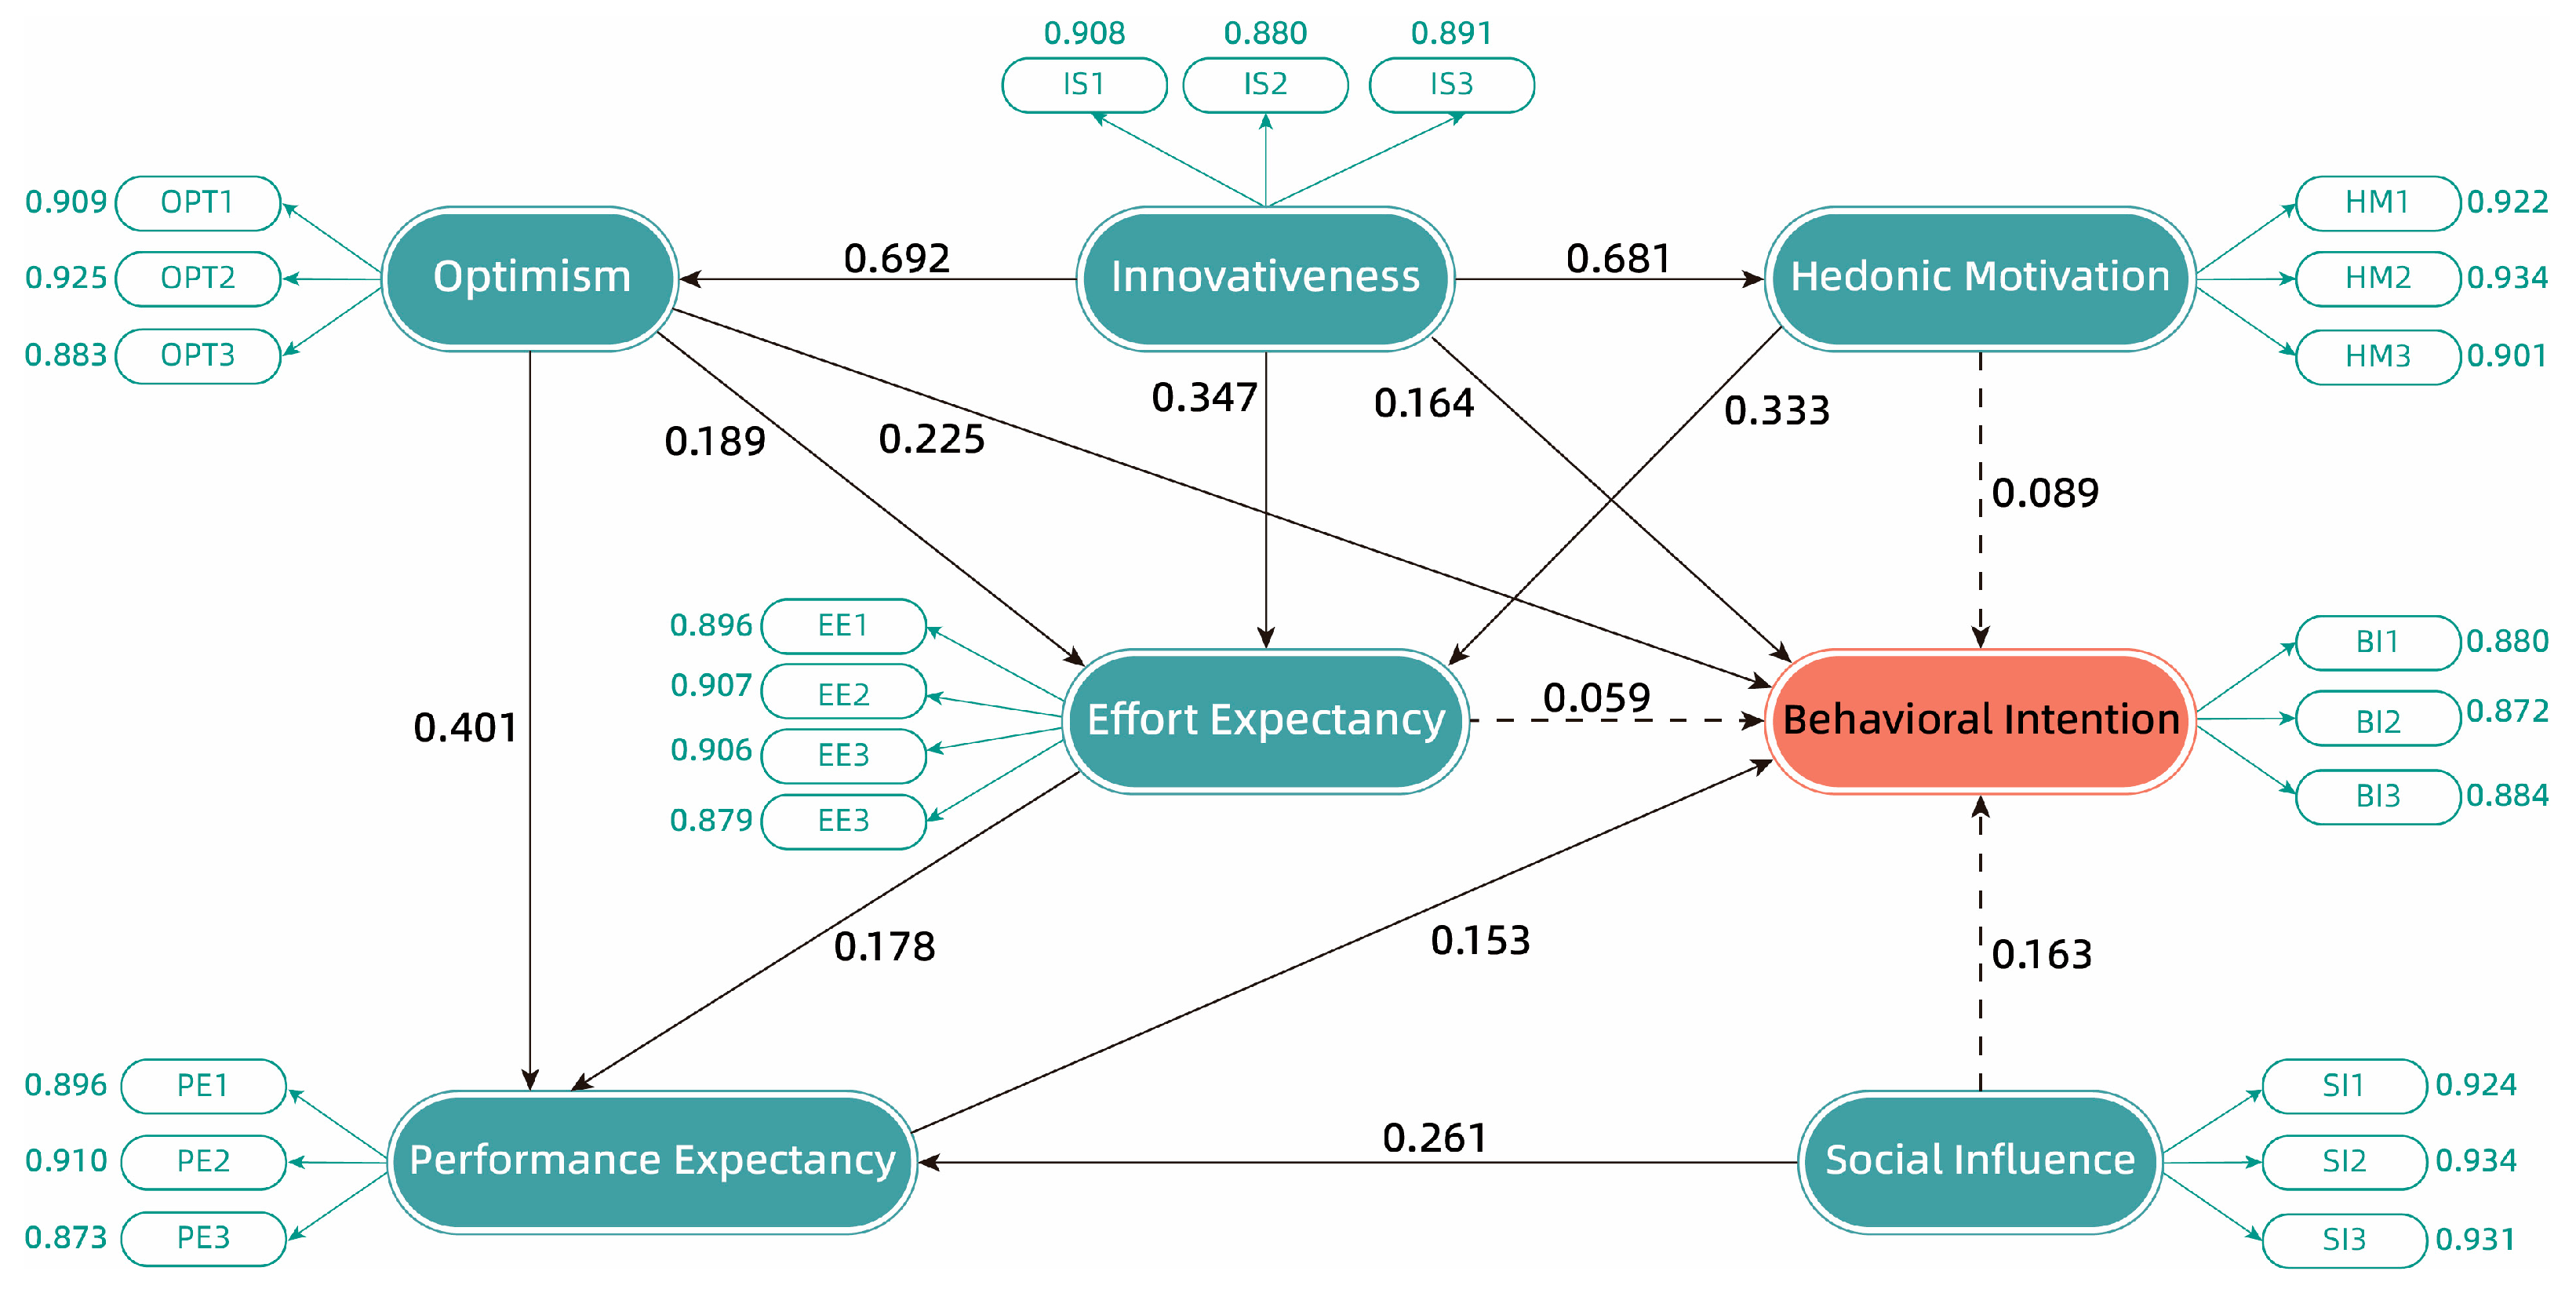
Bootstrapping analysis with 5000 resamples revealed significant direct effects on behavioral intention (BI) of innovativeness (IS→BI: β = 0.164*, *p* = 0.023), optimism (OPT→BI: β = 0.225**, *p* = 0.003), and performance expectancy (PE→BI: β = 0.153*, *p* = 0.027). For performance expectancy (PE), the significant antecedents included effort expectancy (EE→PE: β = 0.178*, *p* = 0.021), social influence (SI→PE: β = 0.261, *p* = 0.002), and optimism (OPT→PE: β = 0.401*, *p* = 0.000). Effort expectancy (EE) was positively influenced by hedonic motivation (HM→EE: β = 0.333*, *p* = 0.000), innovativeness (IS→EE: β = 0.347*, *p* = 0.000), and optimism (OPT→EE: β = 0.189*, *p* = 0.010). Innovativeness further demonstrated strong effects on optimism (IS→OPT: β = 0.692*, *p* = 0.000) and hedonic motivation (IS→HM: β = 0.681*, *p* = 0.000). Critically, three hypotheses were unsupported: EE→BI (H2: β = 0.059, *p* = 0.458), SI→BI (H3: β = 0.163, *p* = 0.080), and HM→BI (H6: β = 0.089, *p* = 0.269). The model explained 53.7% of BI variance (*R*2 = 0.537). The results of the pathway analysis and hypothesis test are visualized in Figure 3 and tabulated in Table 5.

5. Discussion

5.1. Rational Optimist in AB Adoption

Among the six constructs explored, performance expectancy (H1: β = 0.153*), optimism (H8: β = 0.225**), and innovativeness (H11: β = 0.164*) exhibit direct positive effects on behavioral intention, with optimism demonstrating the strongest influence. This aligns with global findings on technology adoption [31,35], yet Chinese users display distinctive calculative optimism—they embrace AB while demanding tangible utility, as evidenced by PE’s significant impact (H1) alongside rejected hedonic pathways (H6). This pattern aligns with China’s distinctive state–citizen technological dynamic. While a lot of Chinese respondents trust government-led innovations [49], this explains the observed preference for system efficiency rather than individual control features [14]. The “rational optimist” profile thus represents a contextually nuanced adopter type that balances technological interest with pragmatic assessment.

5.2. Service-Mediated Adoption Pathways

The non-significant direct pathways of EE→BI and SI→BI reflect service-contextualized adoption dynamics where infrastructure-integrated design reshapes UTAUT pathways. First, infrastructure-dependent ease arises from AB’ state-supported features, such as 5G-connected lanes, which minimize user effort requirements and thereby reduce EE’s direct relevance to behavioral intention while channeling its amplifying effect on system-level performance concerns (EE→PE, β = 0.178*). Furthermore, institutional trust channeling transforms social influence into a mechanism for performance validation, as high public trust in state-backed safety certifications encourages users to reference “government-approved” labels when evaluating AB, resulting in a significant indirect effect (SI→PE, β = 0.261**). This reconfiguration reveals key public service contingencies: AB’ infrastructure-enabled ease diminishes concerns regarding individual effort, and third-party institutional endorsements redirect social influence away from direct peer-driven effects.

5.3. Cultivating Early Adopters: A Utilitarian Approach

The rejection of direct EE→BI, SI→BI, and HM→BI pathways establishes a cascaded utilitarian mechanism where all influences transit through performance expectancy before affecting behavioral intention—evidenced by significant mediation via the EE→PE (β = 0.178*), SI→PE (β = 0.261**), and HM→EE→PE chains, culminating in PE→BI (β = 0.153*). This reflects two contextual realities: (1) institutional override redirects social influence through policy credibility, transforming interpersonal effects into system-performance validations, and (2) mandatory-use pragmatism among captive riders prioritizes functional reliability over ease of use, voiding EE’s direct behavioral impact. Consequently, early-adoption strategies must align with this performance hierarchy; campaigns could showcase quantifiable metrics such as safety records (“0 incidents/10,000 km”) and efficiency gains (“25% congestion reduction”), while certifications could leverage institutional authority through labels such as “State-Validated AI Safety”—eschewing cultural explanations for demonstrable governance effects.

5.4. Innovativeness as the Adoption Catalyst

Innovativeness emerges as the meta-antecedent with the highest total effect on BI (β = 0.347), surpassing direct effects of PE (β = 0.153) and OPT (β = 0.225). Its hierarchical influence—shaping optimism (H12: β = 0.692*), effort expectancy (H13: β = 0.347*), and hedonic motivation (H14: β = 0.681***)—confirms Rogers’ Diffusion of Innovation theory [50], which states that innovators (2.5% of population) catalyze broader adoption of technology. Moreover, as younger demographics universally exhibit higher innovativeness—a pattern replicated in prior studies on autonomous vehicle adoption [51]—we propose Innovator Badges in municipal apps to incentivize early adoption among tech-engaged youth—a strategy that has proven effective in influencing citizens’ transportation choices [52]. These badges serve to recognize and reward users who self-identify as technology pioneers and actively share their AB experiences, fostering a community of innovators who contribute valuable feedback. By offering non-exclusive perks such as virtual achievements, redeemable points for minor incentives, or invitations to user forums, the system encourages participation without affecting equitable access to core public services.

5.5. User Experience Design for Sustained Adoption

While performance expectancy (H1/H4/H5/H10) and effort expectancy (H4/H7/H9/H13) represent the dominant pathways, their interplay demands context-sensitive UX design, especially for Chinese users, who prefer system-guided simplicity—explaining why EE→PE (H4: β = 0.178*) matters more than EE→BI (H2 rejected). We propose the following three design imperatives: (1) ergonomic standardization for elderly users (41% of sample > 50 years); (2) integrated payment flow via popular super-apps (WeChat/Alipay); (3) ensuring safety and transparency through real-time AI monitoring displays. These culturally grounded refinements could boost long-term retention of AB users, as projected from retrofit data [53].

6. Conclusions

6.1. Theoretical Implications

This study advances UTAUT by dissecting public service adoption mechanisms through three interconnected investigations. First, we established innovativeness as a higher-order antecedent that orchestrates affective (optimism), cognitive (effort expectancy), and experiential (hedonic motivation) drivers into a hierarchical cascade, explaining 53.7% of behavioral intention variance and extending UTAUT beyond its traditional flat construct relationships.
Second, the empirical rejection of direct EE→BI and SI→BI pathways (H2-H3 unsupported) reveals an institutional mediation effect in state-led contexts: when technologies such as AB are deployed through policy infrastructure (e.g., dedicated lanes, centralized scheduling), individual effort becomes less relevant, while social influence is channeled through institutional credibility rather than peer networks. Consequently, effort expectancy and social influence operate exclusively via performance expectancy (H4: EE→PE, β = 0.178*; H5: SI→PE, β = 0.261**), forming a performance-centric mechanism that challenges Venkatesh et al.’s original pathways [18] and demarcates boundary conditions for mandatory public technologies.
Third, we identified calculative optimism as a context-specific phenomenon where Chinese users balance technological interest with stringent utility assessment [54]. This insight enriches technology acceptance theories by proposing a governance-type contingency framework: private innovations emphasize effort–hedonic gradients, whereas public service technologies prioritize performance–institution dyads shaped by collective obligations. By anchoring adoption psychology to state-system reliability, our work establishes public service technology acceptance as a distinct theoretical domain requiring tailored modeling in collective innovation contexts.

6.2. Practical Contributions

For ABs, operators, and policymakers, three actionable strategies emerge from this study:
1. Segment prioritization: Target high-innovativeness users (IS > 5.0) through municipal apps (e.g., “Innovator Badges” in Suzhou Metro), leveraging their 3.2× faster adoption rates to encourage broader acceptance;
2. Message reframing: Emphasize system-level performance (e.g., “99.7% on-time rate”) over ease of use, aligning with Chinese riders’ utilitarian calculus (H1 supported; H2 rejected);
3. Design localization: Implement Mandarin-optimized voice interfaces and WeChat-integrated payments, addressing elderly users’ needs (41% of sample >50 years) while adhering to corresponding ergonomic standards.

6.3. Limitations and Future Research

1. The questionnaire items, while adapted from established scales, may introduce ambiguity by not explicitly differentiating between autonomous buses and traditional driver-operated ones, potentially leading to varied interpretations of constructs such as performance expectancy (e.g., PE1 on simplifying commuting) or effort expectancy (e.g., EE2 on convenience). This could affect response credibility, especially for questions tied to commuting efficiency or trip realism (e.g., BI3 assuming route relevance). Future studies could enhance the precision of this questionnaire by incorporating comparative prompts (e.g., “Compared to driver-operated buses…”) or split-sample designs with control groups using traditional buses, thereby validating construct distinctions and improving measurement robustness in the context of public transport.
2. Our model’s homogenization of travel purposes may mask context-dependent mechanisms, such as commuters prioritizing punctuality (PE) versus tourists valuing novelty (HM). Future work will thus implement purpose-driven moderation analysis, anchoring surveys to specific trips (e.g., “Rate AB for your last commute”) to determine how trip purpose—commuting, tourism, or utilitarian—systematically modifies adoption pathways: tourism likely amplifies HM→BI effects (resolving H6’s non-significance), while commuting strengthens PE→BI linkages. Integrating GPS-validated behavioral diaries will further objectify purpose classification, ultimately enabling the establishment of tailored deployment strategies for distinct traveler segments.
3. This study did not directly measure cultural or legal moderators, such as individualism–collectivism dimensions or regulatory differences across regions, which may influence pathways such as SI→BI and limit the generalizability of our results beyond the sampled context. This omission could contribute to speculative interpretations of non-significant effects. Future research should integrate these as explicit variables (e.g., using Hofstede-inspired scales or legal compliance items as moderators) in multi-region comparative analyses, examining how varying deployment regulations affect adoption dynamics while maintaining a focus on empirical pathways rather than broad generalizations.

Author Contributions

Conceptualization, Q.L. and Q.J.; methodology, Q.L. and Q.J.; investigation, Q.L.; data curation, Q.L. and Q.J.; formal analysis, Q.L. and W.W.; visualization, Q.L.; writing—original draft preparation, Q.L. and Q.J.; writing—review and editing, Q.L. and W.W.; project administration, Q.L.; funding acquisition, Q.L. All authors have read and agreed to the published version of the manuscript.

Funding

This research was funded by the Humanities and Social Science Fund of the Ministry of Education of China, grant number 24YJAZH078.

Data Availability Statement

The original contributions presented in this study are included in the article. Further inquiries can be directed to the corresponding author(s).

Conflicts of Interest

The authors declare no conflicts of interest.

Abbreviations

The following abbreviations are used in this manuscript:
ABAutonomous Bus
UTAUTUnified Theory of Acceptance and Use of Technology
PEPerformance Expectancy
EEEffort Expectancy
HMHedonic Motivation
SISocial Influence
OPTOptimism
ISInnovativeness
BIBehavioral Intention

Appendix A

Figure A1. Parking lot of autonomous buses in Wuxi, China (photograph taken by the authors).
Vehicles 07 00087 g0a1
Figure A2. Autonomous bus charging at parking lot in Wuxi, China (photograph taken by the authors).
Vehicles 07 00087 g0a2
Figure A3. One of the seven autonomous bus routes in Wuxi, China (redrawn by the authors based on official information).
Vehicles 07 00087 g0a3
Figure A4. One of the seven autonomous bus routes in Wuxi, China (redrawn by the authors based on official information).
Vehicles 07 00087 g0a4
Figure A5. One of the seven autonomous bus routes in Wuxi, China (redrawn by the authors based on official information).
Vehicles 07 00087 g0a5

References

  1. Ercan, T.; Onat, N.C.; Keya, N.; Tatari, O.; Eluru, N.; Kucukvar, M. Autonomous electric vehicles can reduce carbon emissions and air pollution in cities. Transp. Res. Part D Transp. Environ. 2022, 112, 103472. [Google Scholar] [CrossRef]
  2. Le Hong, Z.; Zimmerman, N. Air quality and greenhouse gas implications of autonomous vehicles in Vancouver, Canada. Transp. Res. Part D Transp. Environ. 2021, 90, 102676. [Google Scholar] [CrossRef]
  3. Mueller, A.S.; Cicchino, J.B.; Zuby, D.S. What humanlike errors do autonomous vehicles need to avoid to maximize safety? J. Saf. Res. 2020, 75, 310–318. [Google Scholar] [CrossRef]
  4. Nagy, V.; Horváth, B. The effects of autonomous buses to vehicle scheduling system. Procedia Comput. Sci. 2020, 170, 235–240. [Google Scholar] [CrossRef]
  5. Schlüter, J.; Bossert, A.; Rössy, P.; Kersting, M. Impact assessment of autonomous demand responsive transport as a link between urban and rural areas. Res. Transp. Bus. Manag. 2021, 39, 100613. [Google Scholar] [CrossRef]
  6. Sabet, S.; Farooq, B. Exploring sustainable pathways for urban traffic decarbonization: Vehicle technologies, management strategies, and driving behaviour. arXiv 2023, arXiv:2308.14914. [Google Scholar] [CrossRef]
  7. Montes, H.; Salinas, C.; Fernández, R.; Armada, M. An experimental platform for autonomous bus development. Appl. Sci. 2017, 7, 1131. [Google Scholar] [CrossRef]
  8. Salonen, A.O. Passenger’s subjective traffic safety, in-vehicle security and emergency management in the driverless shuttle bus in Finland. Transp. Policy 2018, 61, 106–110. [Google Scholar] [CrossRef]
  9. Lazarus, J.; Shaheen, S.; Young, S.E.; Fagnant, D.; Voege, T.; Baumgardner, W.; Fishelson, J.; Sam Lott, J. Shared Automated Mobility and Public Transport; Springer: Berlin/Heidelberg, Germany, 2018. [Google Scholar]
  10. Panagiotopoulos, I.; Dimitrakopoulos, G. An empirical investigation on consumers’ intentions towards autonomous driving. Transp. Res. Part C Emerg. Technol. 2018, 95, 773–784. [Google Scholar] [CrossRef]
  11. Wu, J.; Liao, H.; Wang, J.-W.; Chen, T. The role of environmental concern in the public acceptance of autonomous electric vehicles: A survey from China. Transp. Res. Part F Traffic Psychol. Behav. 2019, 60, 37–46. [Google Scholar] [CrossRef]
  12. Cai, L.; Yuen, K.F.; Wang, X. Explore public acceptance of autonomous buses: An integrated model of UTAUT, TTF and trust. Travel Behav. Soc. 2023, 31, 120–130. [Google Scholar] [CrossRef]
  13. Ministry of Industry and Information Technology (MIIT). Implementation Plan for Access Management Pilot of Intelligent Connected Vehicles; MIIT: Beijing, China, 2023.
  14. López-Lambas, M.E.; Alonso, A. The driverless bus: An analysis of public perceptions and acceptability. Sustainability 2019, 11, 4986. [Google Scholar] [CrossRef]
  15. Yuen, K.F.; Choo, L.Q.; Li, X.; Wong, Y.D.; Ma, F.; Wang, X. A theoretical investigation of user acceptance of autonomous public transport. Transportation 2022, 50, 545–569. [Google Scholar] [CrossRef]
  16. Chan, W.M.; Lee, J.W.C. 5G connected autonomous vehicle acceptance: The mediating effect of trust in the technology acceptance model. Asian J. Bus. Res. 2021, 11, 40. [Google Scholar] [CrossRef]
  17. Nazari, F.; Soto, Y.; Noruzoliaee, M. Privately-Owned versus Shared Automated Vehicle: The Roles of Utilitarian and Hedonic Beliefs. arXiv 2023, arXiv:2309.03283. [Google Scholar] [CrossRef]
  18. Venkatesh, V.; Morris, M.G.; Davis, G.B.; Davis, F.D. User acceptance of information technology: Toward a unified view. MIS Q. 2003, 27, 425–478. [Google Scholar] [CrossRef]
  19. Marikyan, M.; Papagiannidis, P. Unified theory of acceptance and use of technology. In TheoryHub Book; Newcastle University: Newcastle upon Tyne, UK, 2021. [Google Scholar]
  20. Guo, Y.; Chen, Z.; Stuart, A.; Li, X.; Zhang, Y. A systematic overview of transportation equity in terms of accessibility, traffic emissions, and safety outcomes: From conventional to emerging technologies. Transp. Res. Interdiscip. Perspect. 2020, 4, 100091. [Google Scholar] [CrossRef]
  21. Yu, L.; Yu, S.; Liu, Y.; Cai, X.; Zeng, Y. Assessing the user acceptance of mobility-as-a-service platforms: A case study of Shenzhen, China. Ind. Manag. Data Syst. 2025. [Google Scholar] [CrossRef]
  22. Acheampong, R.A.; Cugurullo, F. Capturing the behavioural determinants behind the adoption of autonomous vehicles: Conceptual frameworks and measurement models to predict public transport, sharing and ownership trends of self-driving cars. Transp. Res. Part F Traffic Psychol. Behav. 2019, 62, 349–375. [Google Scholar] [CrossRef]
  23. Koh, L.Y.; Yuen, K.F. Public acceptance of autonomous vehicles: Examining the joint influence of perceived vehicle performance and intelligent in-vehicle interaction quality. Transp. Res. Part A Policy Pract. 2023, 178, 103864. [Google Scholar] [CrossRef]
  24. Venkatesh, V.; Thong, J.Y.; Xu, X. Consumer acceptance and use of information technology: Extending the unified theory of acceptance and use of technology. MIS Q. 2012, 36, 157–178. [Google Scholar] [CrossRef]
  25. Soto, Y.; Nazari, F.; Noruzoliaee, M. Urban Mobility in the Age of Automation: Analyzing Public Attitudes Toward Privately-Owned versus Shared Automated Vehicles. arXiv 2023, arXiv:2309.03283. [Google Scholar]
  26. Ribeiro, M.A.; Gursoy, D.; Chi, O.H. Customer acceptance of autonomous vehicles in travel and tourism. J. Travel Res. 2022, 61, 620–636. [Google Scholar] [CrossRef]
  27. Kettles, N.; Van Belle, J.-P. Investigation into the antecedents of autonomous car acceptance using an enhanced UTAUT model. In Proceedings of the 2019 International Conference on Advances in Big Data, Computing and Data Communication Systems (icABCD), Winterton, South Africa, 5–6 August 2019; pp. 1–6. [Google Scholar]
  28. Yuen, K.F.; Huyen, D.T.K.; Wang, X.; Qi, G. Factors influencing the adoption of shared autonomous vehicles. Int. J. Environ. Res. Public Health 2020, 17, 4868. [Google Scholar] [CrossRef]
  29. Nordhoff, S.; Louw, T.; Innamaa, S.; Lehtonen, E.; Beuster, A.; Torrao, G.; Bjorvatn, A.; Kessel, T.; Malin, F.; Happee, R. Using the UTAUT2 model to explain public acceptance of conditionally automated (L3) cars: A questionnaire study among 9,118 car drivers from eight European countries. Transp. Res. Part F Traffic Psychol. Behav. 2020, 74, 280–297. [Google Scholar] [CrossRef]
  30. Parasuraman, A. Technology Readiness Index (TRI) a multiple-item scale to measure readiness to embrace new technologies. J. Serv. Res. 2000, 2, 307–320. [Google Scholar] [CrossRef]
  31. Hőgye-Nagy, Á.; Kovács, G.; Kurucz, G. Acceptance of self-driving cars among the university community: Effects of gender, previous experience, technology adoption propensity, and attitudes toward autonomous vehicles. Transp. Res. Part F Traffic Psychol. Behav. 2023, 94, 353–361. [Google Scholar] [CrossRef]
  32. Walczuch, R.; Lemmink, J.; Streukens, S. The effect of service employees’ technology readiness on technology acceptance. Inf. Manag. 2007, 44, 206–215. [Google Scholar] [CrossRef]
  33. Hao, F. Acceptance of contactless technology in the hospitality industry: Extending the unified theory of acceptance and use of technology 2. Asia Pac. J. Tour. Res. 2021, 26, 1386–1401. [Google Scholar] [CrossRef]
  34. Son, M.; Han, K. Beyond the technology adoption: Technology readiness effects on post-adoption behavior. J. Bus. Res. 2011, 64, 1178–1182. [Google Scholar] [CrossRef]
  35. Hegner, S.M.; Beldad, A.D.; Brunswick, G.J. In automatic we trust: Investigating the impact of trust, control, personality characteristics, and extrinsic and intrinsic motivations on the acceptance of autonomous vehicles. Int. J. Hum.–Comput. Interact. 2019, 35, 1769–1780. [Google Scholar] [CrossRef]
  36. Tamilmani, K.; Rana, N.P.; Prakasam, N.; Dwivedi, Y.K. The battle of Brain vs. Heart: A literature review and meta-analysis of “hedonic motivation” use in UTAUT2. Int. J. Inf. Manag. 2019, 46, 222–235. [Google Scholar] [CrossRef]
  37. Wang, N.; Tang, H.; Wang, Y.-J.; Huang, G.Q. Antecedents in rural residents’ acceptance of autonomous vehicles. Transp. Res. Part D Transp. Environ. 2024, 132, 104244. [Google Scholar] [CrossRef]
  38. Davis, F.D. Perceived usefulness, perceived ease of use, and user acceptance of information technology. MIS Q. 1989, 13, 319–340. [Google Scholar] [CrossRef]
  39. Goldbach, C.; Sickmann, J.; Pitz, T.; Zimasa, T. Towards autonomous public transportation: Attitudes and intentions of the local population. Transp. Res. Interdiscip. Perspect. 2022, 13, 100504. [Google Scholar] [CrossRef]
  40. Bhattacherjee, A. Understanding information systems continuance: An expectation-confirmation model. MIS Q. 2001, 25, 351–370. [Google Scholar] [CrossRef]
  41. Aasvik, O.; Hagenzieker, M.; Ulleberg, P.; Bjørnskau, T. How testing impacts willingness to use and share autonomous shuttles with strangers: The mediating effects of trust and optimism. Int. J. Hum.–Comput. Interact. 2024, 41, 3783–3798. [Google Scholar] [CrossRef]
  42. Molinillo, S.; Caballero-Galeote, L.; Liébana-Cabanillas, F.; Ruiz-Montañez, M. Understanding users’ willingness to travel on autonomous buses: The moderating effect of experience. J. Retail. Consum. Serv. 2024, 81, 103931. [Google Scholar] [CrossRef]
  43. Lee, E.-J.; Zafarzon, N.; Zhang, J. Using Predictive Analytics to Profile Potential Adopters of Autonomous Vehicles. Asia Mark. J. 2018, 20, 65–83. [Google Scholar] [CrossRef]
  44. Chen, H.-K.; Yan, D.-W. Interrelationships between influential factors and behavioral intention with regard to autonomous vehicles. Int. J. Sustain. Transp. 2019, 13, 511–527. [Google Scholar] [CrossRef]
  45. Cheng, Y.-H.; Lai, Y.-C. Exploring autonomous bus users’ intention: Evidence from positive and negative effects. Transp. Policy 2024, 146, 91–101. [Google Scholar] [CrossRef]
  46. Hair, J.F.; Risher, J.J.; Sarstedt, M.; Ringle, C.M. When to use and how to report the results of PLS-SEM. Eur. Bus. Rev. 2019, 31, 2–24. [Google Scholar] [CrossRef]
  47. Fornell, C.; Larcker, D.F. Evaluating structural equation models with unobservable variables and measurement error. J. Mark. Res. 1981, 18, 39–50. [Google Scholar] [CrossRef]
  48. Hair, J., Jr.; Hair, J.F., Jr.; Hult, G.T.M.; Ringle, C.M.; Sarstedt, M. A Primer on Partial Least Squares Structural Equation Modeling (PLS-SEM); Sage Publications: New York, NY, USA, 2021. [Google Scholar]
  49. Edelman Intelligence. 2023 Edelman Trust Barometer: Technology Sector Report; 2023-TECH; Edelman: Chicago, IL, USA, 2023. [Google Scholar]
  50. Rogers, E.M.; Singhal, A.; Quinlan, M.M. Diffusion of innovations. In An Integrated Approach to Communication Theory and Research; Routledge: New York, NY, USA, 2014; pp. 432–448. [Google Scholar]
  51. Roche-Cerasi, I. Public acceptance of driverless shuttles in Norway. Transp. Res. Part F Traffic Psychol. Behav. 2019, 66, 162–183. [Google Scholar] [CrossRef]
  52. Kazhamiakin, R.; Loria, E.; Marconi, A.; Scanagatta, M. A gamification platform to analyze and influence citizens’ daily transportation choices. IEEE Trans. Intell. Transp. Syst. 2021, 22, 2153–2167. [Google Scholar] [CrossRef]
  53. Zhao, X.; Susilo, Y.O.; Pernestål, A. The dynamic and long-term changes of automated bus service adoption. Transp. Res. Part A Policy Pract. 2022, 155, 450–463. [Google Scholar] [CrossRef]
  54. Herrenkind, B.; Brendel, A.B.; Nastjuk, I.; Greve, M.; Kolbe, L.M. Investigating end-user acceptance of autonomous electric buses to accelerate diffusion. Transp. Res. Part D Transp. Environ. 2019, 74, 255–276. [Google Scholar] [CrossRef]
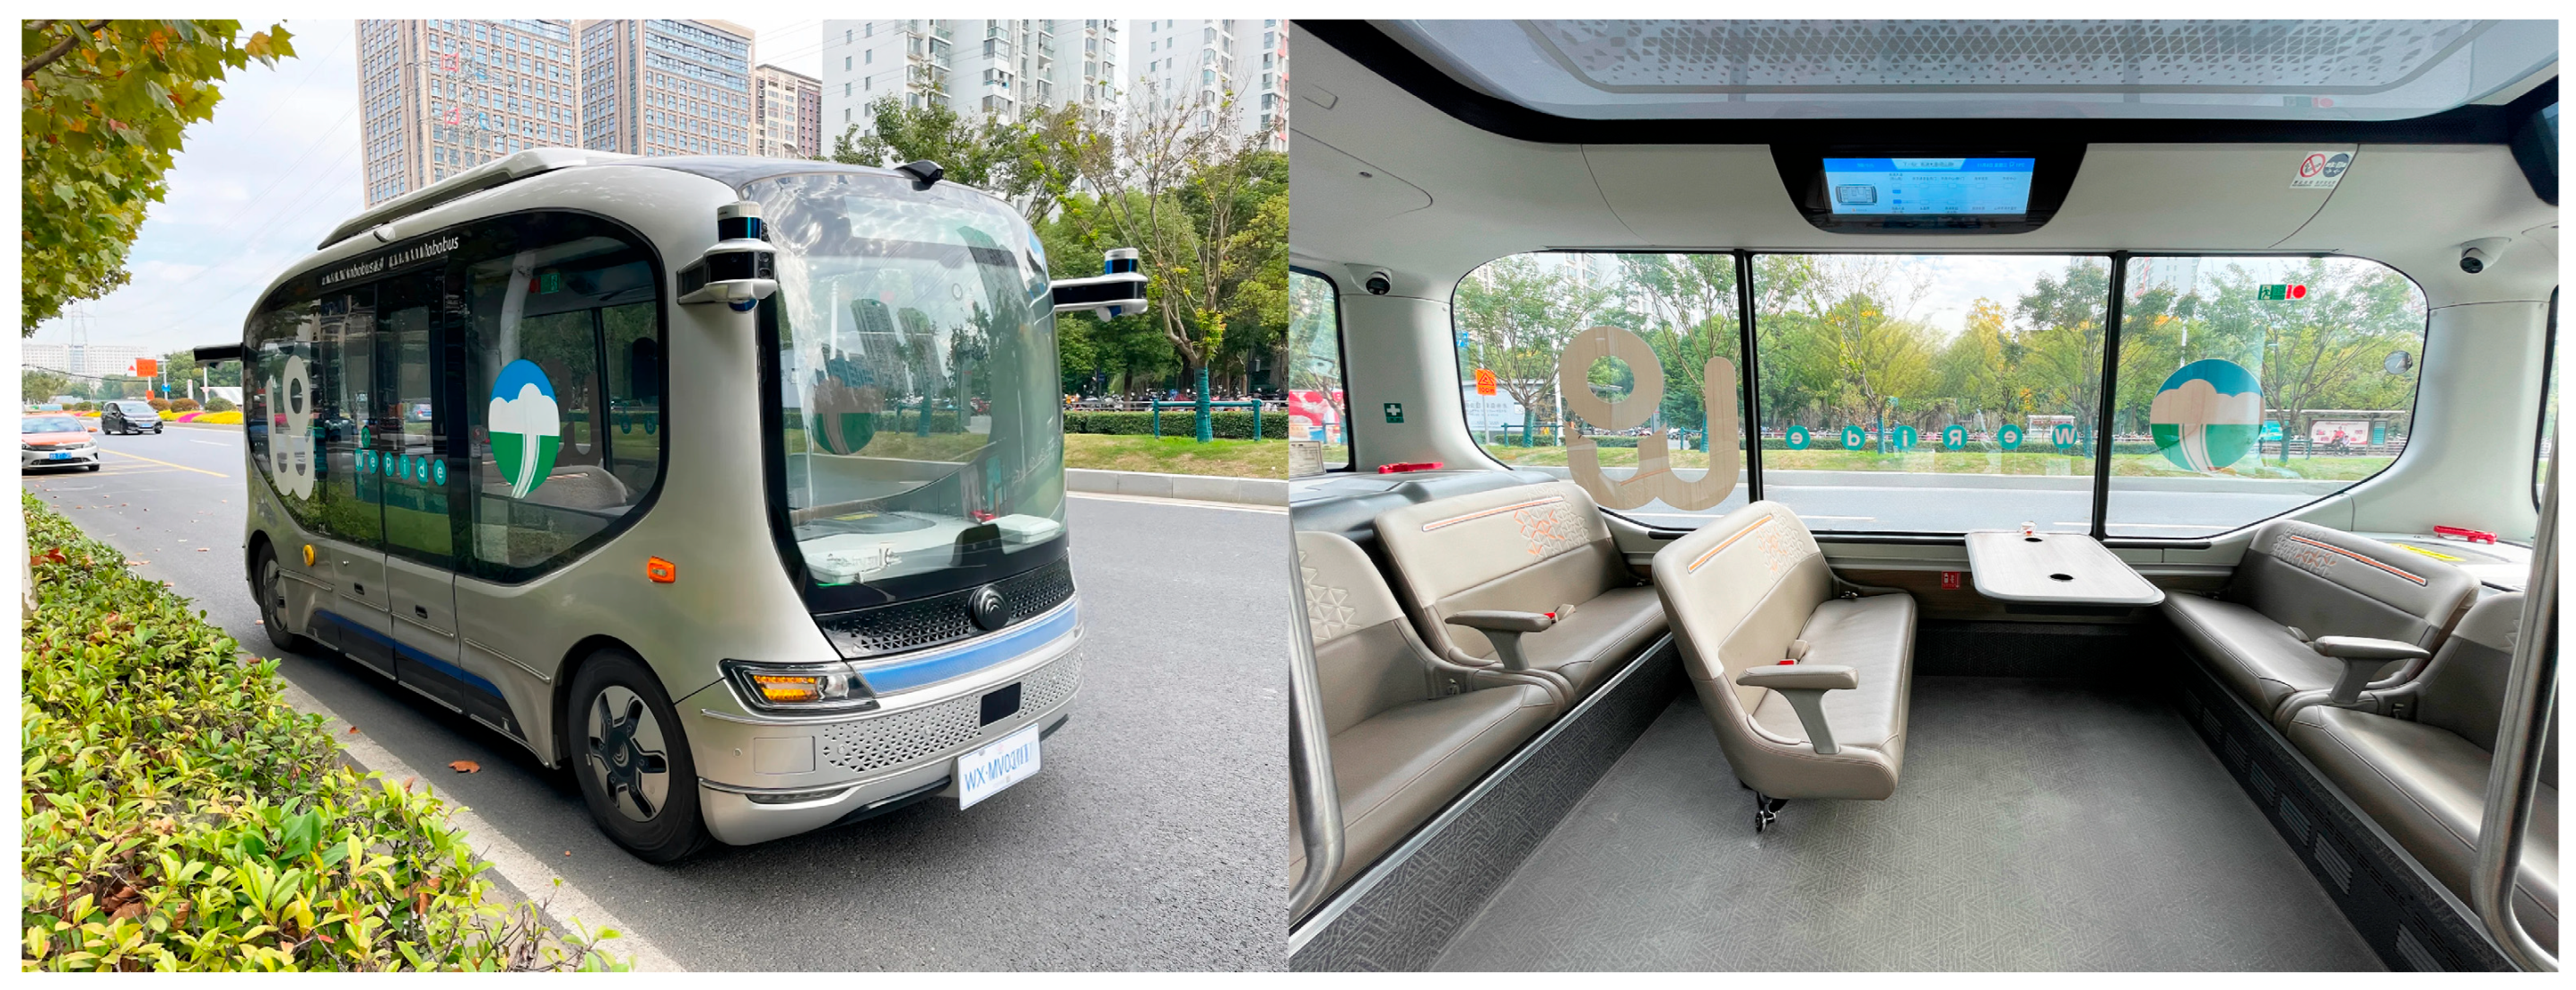
Figure 1. Autonomous buses operated in Wuxi, China (photographs taken by the authors).
Vehicles 07 00087 g001
Figure 2. Hypothetical model constructed in this study.
Vehicles 07 00087 g002
Figure 3. Results of pathway analysis.
Vehicles 07 00087 g003
Table 1. Details of measurement items.
ConstructsNo.ContentSource
Performance expectancyPE1Autonomous buses can simplify my commuting process.[12,23]
PE2Autonomous buses can improve my commuting efficiency.
PE3Autonomous buses can enhance my commuting comfort.
Effort expectancyEE1Learning to take an autonomous bus is relatively easy for me.[15,37]
EE2With smartphones and mobile payments, taking an autonomous bus should be very convenient.
EE3I will quickly get used to taking an autonomous bus.
EE4I can easily find information about the routes, stops, and operating times of autonomous buses.
Hedonic motivationHM1I think taking an autonomous bus is a very novel experience.[17,26]
HM2I find commuting by autonomous buses enjoyable.
HM3Sharing my experiences of taking an autonomous bus with others would make me happy.
Social influenceSI1If my family/friends/colleagues recommended that I take an autonomous bus, I would try it.[38,39]
SI2If the people around me take autonomous buses, I might be influenced to ride one as well.
SI3When mass media/social media promotes and shares information about autonomous buses, I might want to ride one.
OptimismOPT1Autonomous buses can improve the quality of my commuting life.[40,41]
OPT2Autonomous buses provide more freedom for my commuting life.
OPT3Autonomous buses offer new options for my commuting life.
InnovativenessIS1I am always attentive to new things (such as autonomous buses).[42,43]
IS2I might be the first among my friends to know and share information about new things (such as autonomous buses).
IS3I always like to try new things (such as autonomous buses).
Behavioral intentionBI1If I commute by bus, I would prefer to choose an autonomous bus.[44,45]
BI2If there were autonomous buses on the routes I usually take, I would take more frequently.
BI3If there were an autonomous bus route in my city, I would like to try it out specifically.
Table 2. Demographic information of respondents.
Category Count Ratio
GenderMale12740.6
Female18659.4
Age<184.1.3
18–258025.6
26–30258
31–406320.1
41–504113.1
51–607223
>60288.9
Educational background High school and below3711.8
Junior College4815.3
Bachelor 16251.8
Postgraduate 6621.1
Occupation Government agency staff/civil servants4313.7
State-owned enterprise managers/employees206.4
Joint venture/foreign enterprise managers/employees6.1.9
Private enterprise managers/employees237.3
Professionals (such as doctors, lawyers, accountants, architects, etc.)154.8
Teachers9129.1
Skilled or blue-collar workers3.1
Students (science and engineering majors)299.3
Students (literature and arts majors)3410.9
Freelancers237.3
Others268.3
Place of residence North China103.2
East China10734.2
Central China16552.7
South China206.4
Southwest China6.1.9
Northwest China5.1.6
Table 3. Reliability analysis.
ConstructItemFactor LoadingVIFCronbach’s αCRAVE
BIBI10.8802.1130.8530.9110.773
BI20.8722.080
BI30.8842.105
EEEE10.8963.3060.9190.9430.805
EE20.9073.418
EE30.9063.225
HMHM10.8793.3540.9080.9420.845
HM20.9223.776
HM30.9342.500
ISIS10.9012.5530.8730.9220.798
IS20.9082.180
IS30.8802.353
OPTOPT10.8912.8820.890.9320.82
OPT20.9093.185
OPT30.9252.213
PEPE10.8832.4770.8730.9220.798
PE20.8962.700
PE30.9102.065
SISI10.8733.3050.9220.950.864
SI20.9243.567
SI30.9343.368
Table 4. Discriminant validity.
BIEEHMISOPTPESI
BI0.879
EE0.6280.897
HM0.6350.7100.919
IS0.6410.7040.6810.893
OPT0.6800.6780.7480.6920.906
PE0.6370.6670.6380.6640.7200.893
SI0.6800.8290.7740.7220.7600.7140.930
Table 5. Results of pathway analysis and hypothesis test.
HypothesisPathwayPathway Coefficientt-Valuep-ValueSupport
H1PE→BI0.1532.2180.027Yes
H2EE→BI0.0590.7430.458No
H3SI→BI0.1631.7500.080No
H4EE→PE0.1782.3150.021Yes
H5SI→PE0.2613.1270.002Yes
H6HM→BI0.0891.1050.269No
H7HM→EE0.3334.6280.000Yes
H8OPT→BI0.2252.9460.003Yes
H9OPT→EE0.1892.5780.010Yes
H10OPT→PE0.4016.4840.000Yes
H11IS→BI0.1642.2690.023Yes
H12IS→OPT0.69217.5290.000Yes
H13IS→EE0.3475.1340.000Yes
H14IS→HM0.68117.8690.000Yes
Disclaimer/Publisher’s Note: The statements, opinions and data contained in all publications are solely those of the individual author(s) and contributor(s) and not of MDPI and/or the editor(s). MDPI and/or the editor(s) disclaim responsibility for any injury to people or property resulting from any ideas, methods, instructions or products referred to in the content.