Abstract
Regenerative braking technology is essential for reducing energy consumption in electric vehicles (EVs). This study introduces a method for optimizing the distribution of deceleration forces in front-wheel-drive electric vehicles that complies with the distribution range outlined by ECE-R13 braking regulations and aligns with an ideal braking distribution curve. In addition, using a fuzzy control strategy to manage the complex variables of the regenerative braking process, a robust and adaptable system is developed on the Simulink platform. Tested across various driving cycles are NEDC (New European Driving Cycle), WLTC (World Light Duty Vehicle Test Cycle), FTP-72 (Federal Test Procedure 72), and FTP-75 (Federal Test Procedure 75). The method significantly improves energy efficiency: 13% for WLTC, 16% for NEDC, and 30% for both FTP-72 and FTP-75. The simulation results were compared to regenerative braking control techniques A and B, showing that the proposed control method achieves a higher brake energy recovery rate. This leads to a considerable improvement in the vehicle’s energy recovery efficiency. These findings confirm the efficacy of the proposed regenerative brake control system, highlighting its potential to significantly enhance the energy efficiency of electric vehicles.
1. Introduction
Electric vehicles have evolved as a feasible alternative to tackle the problems of power use and environmental damage [1]. Nevertheless, the storage of energy using batteries within the electric vehicle sector has hindered the widespread adoption of electric vehicles powered solely by electricity, mostly because of their limited vehicle range [2,3]. Therefore, the control system for the regenerative braking system is proposed to enhance the allocation of force generated by regenerative braking with the purpose of maximizing energy recovery while maintaining brake safety. The advancement of the electric vehicle technique, which effectively captures electrical energy due to the deceleration caused by the motor, has a beneficial effect on enhancing efficiency in energy usage and driving the scope of electric vehicles [4].
Various factors contribute to enhancing the process of recovering energy through regenerative braking in electric vehicles. These factors encompass the arrangement of the electrical power system, the parameters of the battery and the electric motor, braking laws, the allocation of braking force between front and back wheels, and the method for distributing regenerative braking. The configuration of the driving motors categorizes regenerative braking systems into three basic categories: motors with an integrated center [5], motors located on the wheel side [6], and electric motors integrated within the wheel [7]. We can classify the energy-storing devices used for regenerative vehicle braking into three categories: hydraulic energy storage devices (HES), flywheel energy storage devices [8], and electric energy storage devices [9,10]. Liang et al. [11] introduced a dual-model predictive control hierarchical framework to enhance energy efficiency and handling stability in distributed drive electric vehicles. In addition, smart energy management for auxiliary loads, such as heating, ventilation, and air conditioning (HVAC), emphasizes the importance of optimizing energy efficiency and reducing the load on the vehicle’s power storage system [12].
Currently, the focus of research on braking energy recovery technology is mostly on enhancing the efficiency of recovering energy from vehicle brakes by allocating the braking force in a rational manner. The literature [13] categorizes the driver’s intentions for driving based on the pedal aperture and the pace of brake pedal movement. This enables the motor to produce the necessary brakes that regenerate force to fulfill the driver’s need for braking and lessen the effort required for driving. The study [14] on brake blending and torque vectoring in electric road vehicles through a flexible approach based on smart torque allocation further emphasizes the importance of optimizing the integration of electrical and mechanical braking systems. The authors in [15] analyzed the allocation of torque between the force of the motor and the mechanics of brakes and proposed several electric braking management strategies. These strategies are designed to consider the limitations of engine power and the braking needs of the driver. The objective is to sustain the braking system’s regenerative power at its greatest threshold, thus guaranteeing optimal braking efficiency. The authors in [16] focused on achieving maximum recuperation of energy by taking velocity into consideration for the motor and SOC in electric braking. They also explored the way the front and back axles share the braking power, as well as the braking force generated by the electromechanical system in the vehicle. In [17], a fuzzy logic control was developed for hybrid electric vehicles with rear-wheel drive. This controller utilized the factors in question, which are the SOC of the battery and the braking strength. Its main objective was to achieve combined control of the relationship between the motor and mechanical brake systems, ultimately enabling energy recuperation.
The aforementioned research primarily concentrates on the synchronized regulation of the mechanical-motor composite braking system during vehicle braking with the objective of achieving the allocation of mechanical braking force and motor braking force. Nevertheless, the aforementioned studies did not provide a comprehensive analysis of the factors that influence energy recovery. This paper proposes a two-layered control strategy for braking energy recovery. The first layer involves designing the braking force distribution strategy for the front and rear axles, guided by the ECE regulation curve and the ideal braking force distribution (I curve). The second layer uses fuzzy control, which takes into account factors such as engine anti-drag torque, vehicle speed, braking intensity, and the state of charge (SOC) of the power battery to determine the most optimal regenerative braking ratio possible. Finally, the proposed strategy is compared with existing control methods to highlight its effectiveness and superiority.
This paper presents a meticulously organized framework for the control strategy of regenerative braking in electric vehicles, emphasizing its significance in minimizing energy loss and increasing driving ranges. Section 2 examines the key elements of the vehicle’s braking system and presents the primary structure of the control strategy. Section 3 develops various braking modes to improve the distribution coefficient of the front axle braking force. These modes are based on the braking strength and allocate the braking forces for the front and rear axles accordingly. We also use the proposed multi-parameter fuzzy controller to distribute the electromechanical braking force of the front axle from the upper layer. This makes it possible to manage the front axle’s braking force in a coordinated way. Section 4 presents findings from the Simulink simulations conducted under standardized cycle conditions. It also provides a comparative analysis of the energy recovery efficiency of the proposed control and other controllers. Section 5 summarizes the findings of this research endeavor.
2. System Analysis and Modeling
2.1. Blended Braking System
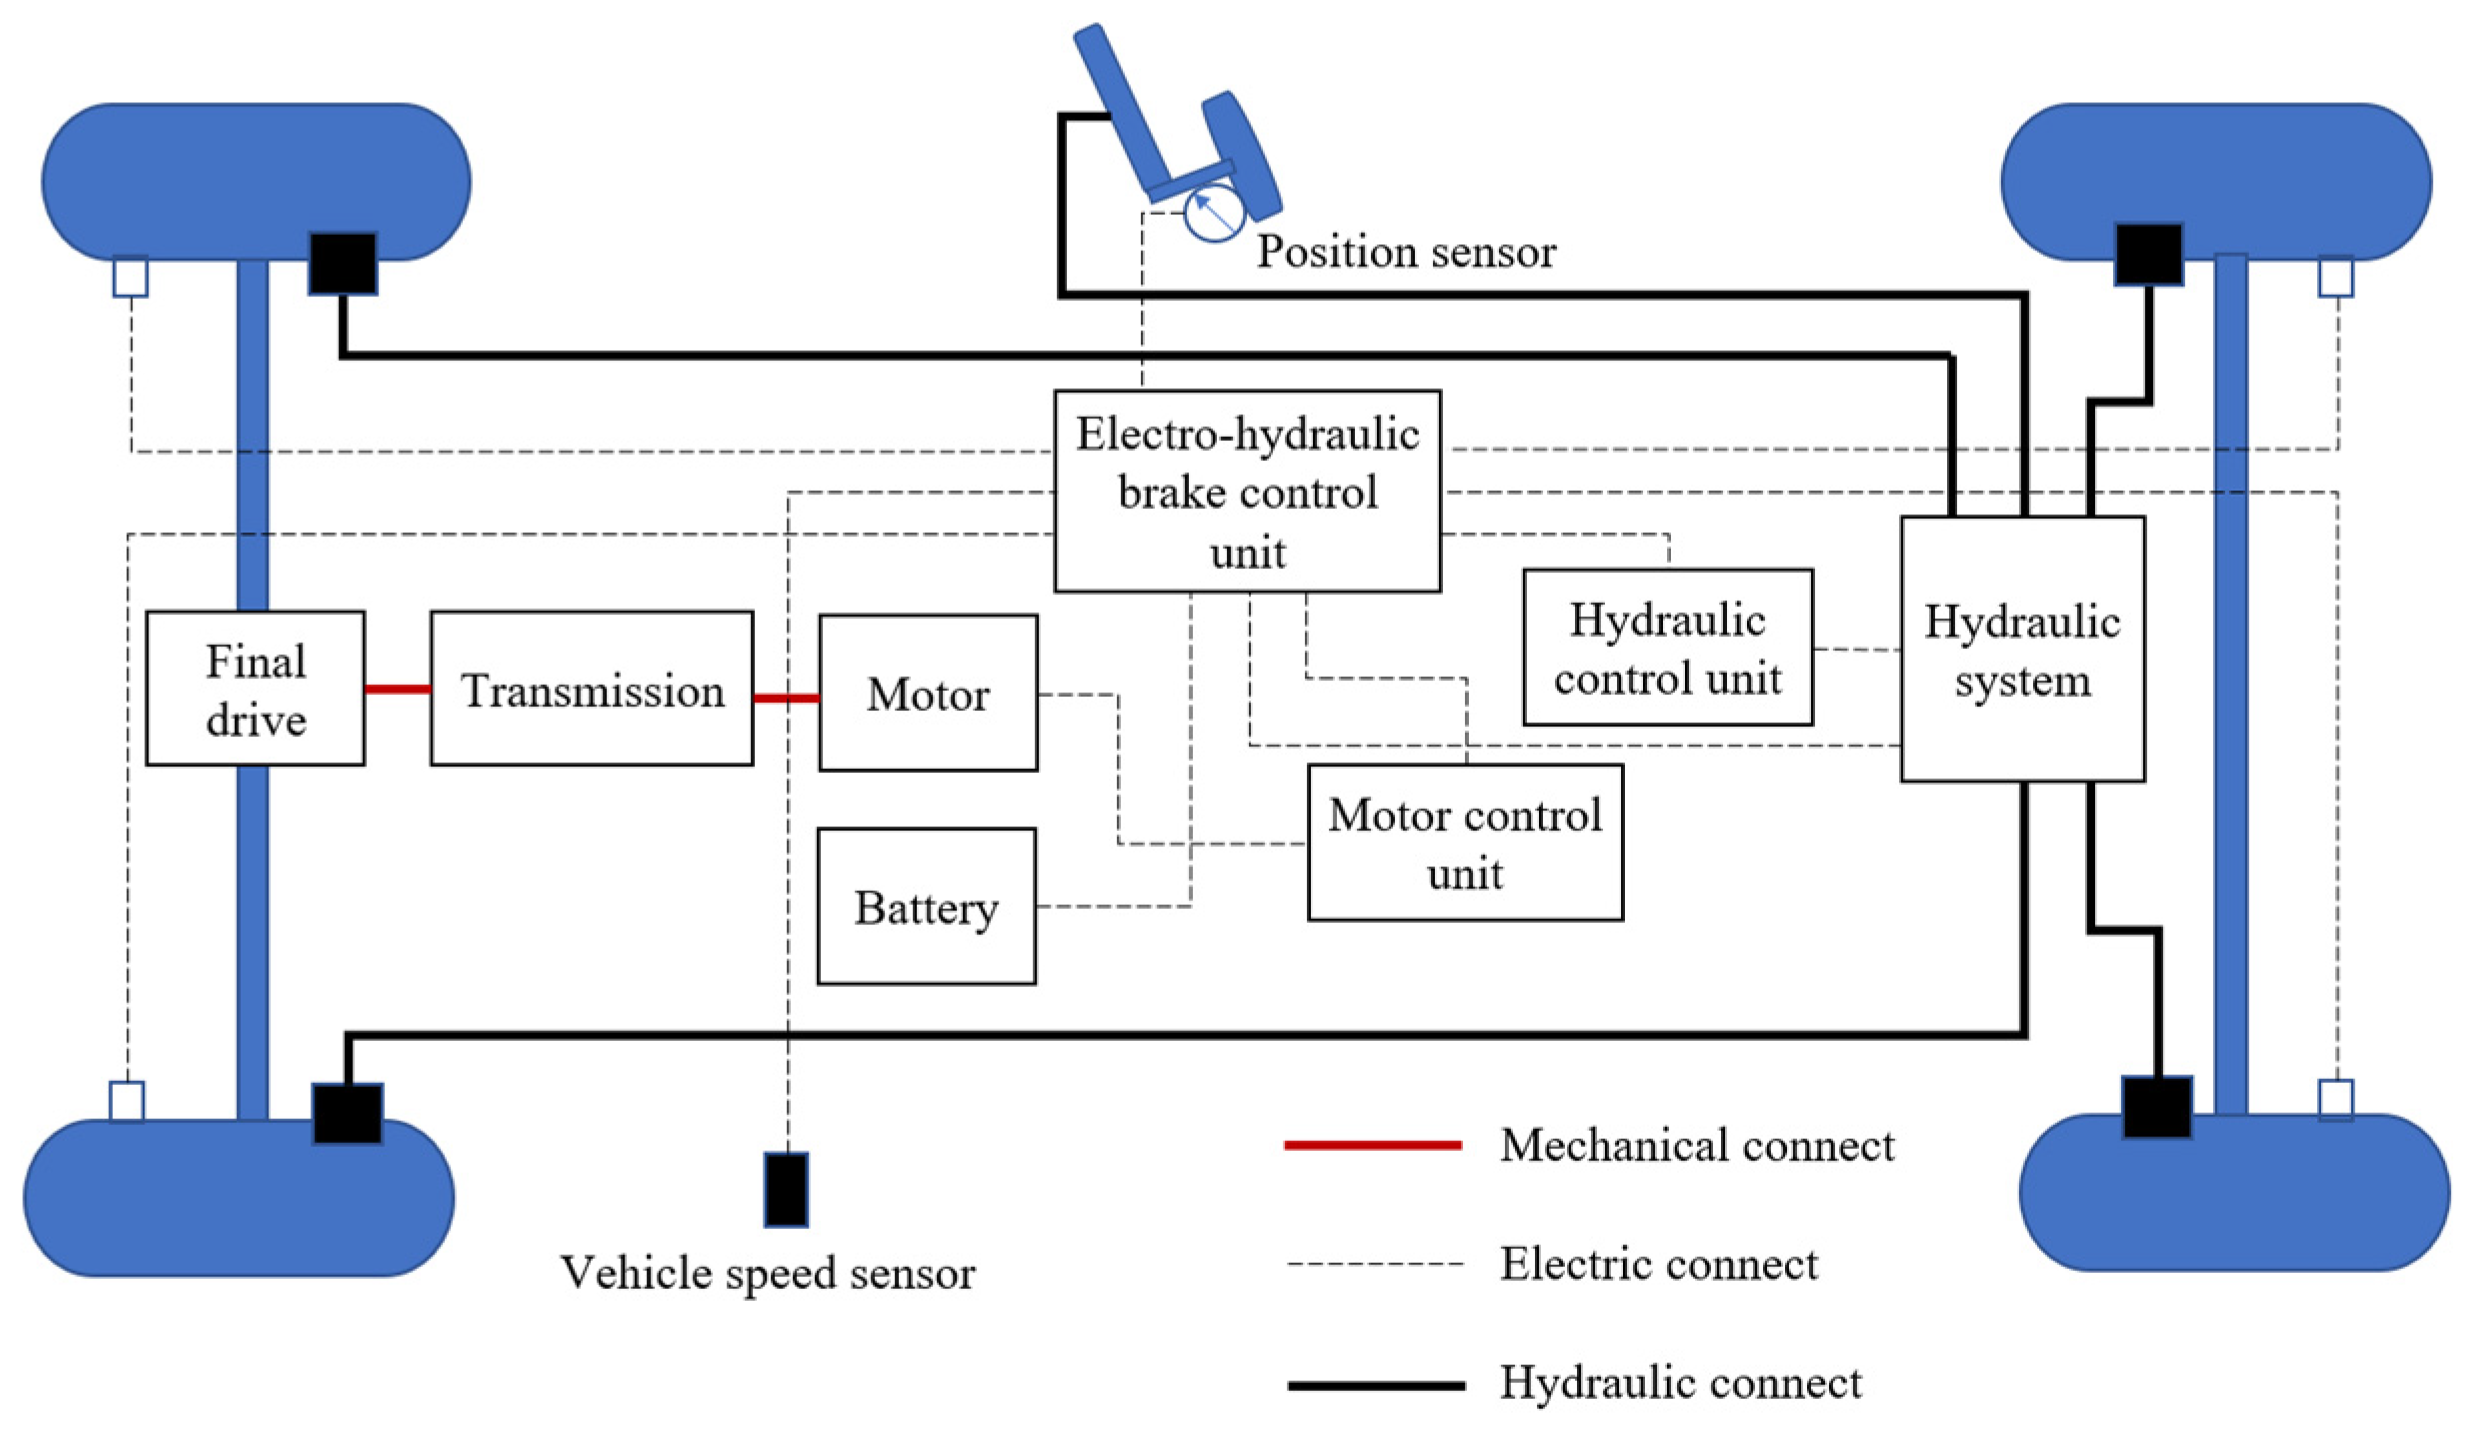
This research used a front-wheel-drive pure electric car as a basis for designing and examining the pavement observer and regenerative brake control strategy [18]. Figure 1 displays the arrangement of a front-wheel-drive electric car [19]. When the driver applies pressure to the pedal, the drive motor produces the appropriate amount of torque based on the desired signal from the motor control unit. This torque is then transferred to the front axle wheel end through the gearbox, drive shaft, and differential. When the driver applies pressure to the brake pedal, the electronic hydraulic control unit increases the pressure in response to the target signal received from the vehicle control unit. This pressure is then communicated through the hydraulic line from the master cylinder to the four brake wheel cylinders. When the regenerative braking feature is activated, the propulsion engine transforms a portion of the kinetic energy into electrical energy. This brake energy is then stored in the battery through the inverter, resulting in improved energy efficiency and increased driving range. Table 1 displays the vehicle specifications of electric vehicles with front-wheel drive.

Figure 1.
Braking system of electric vehicles.

Table 1.
Vehicle parameters.
2.2. Electric Vehicle Dynamic Model
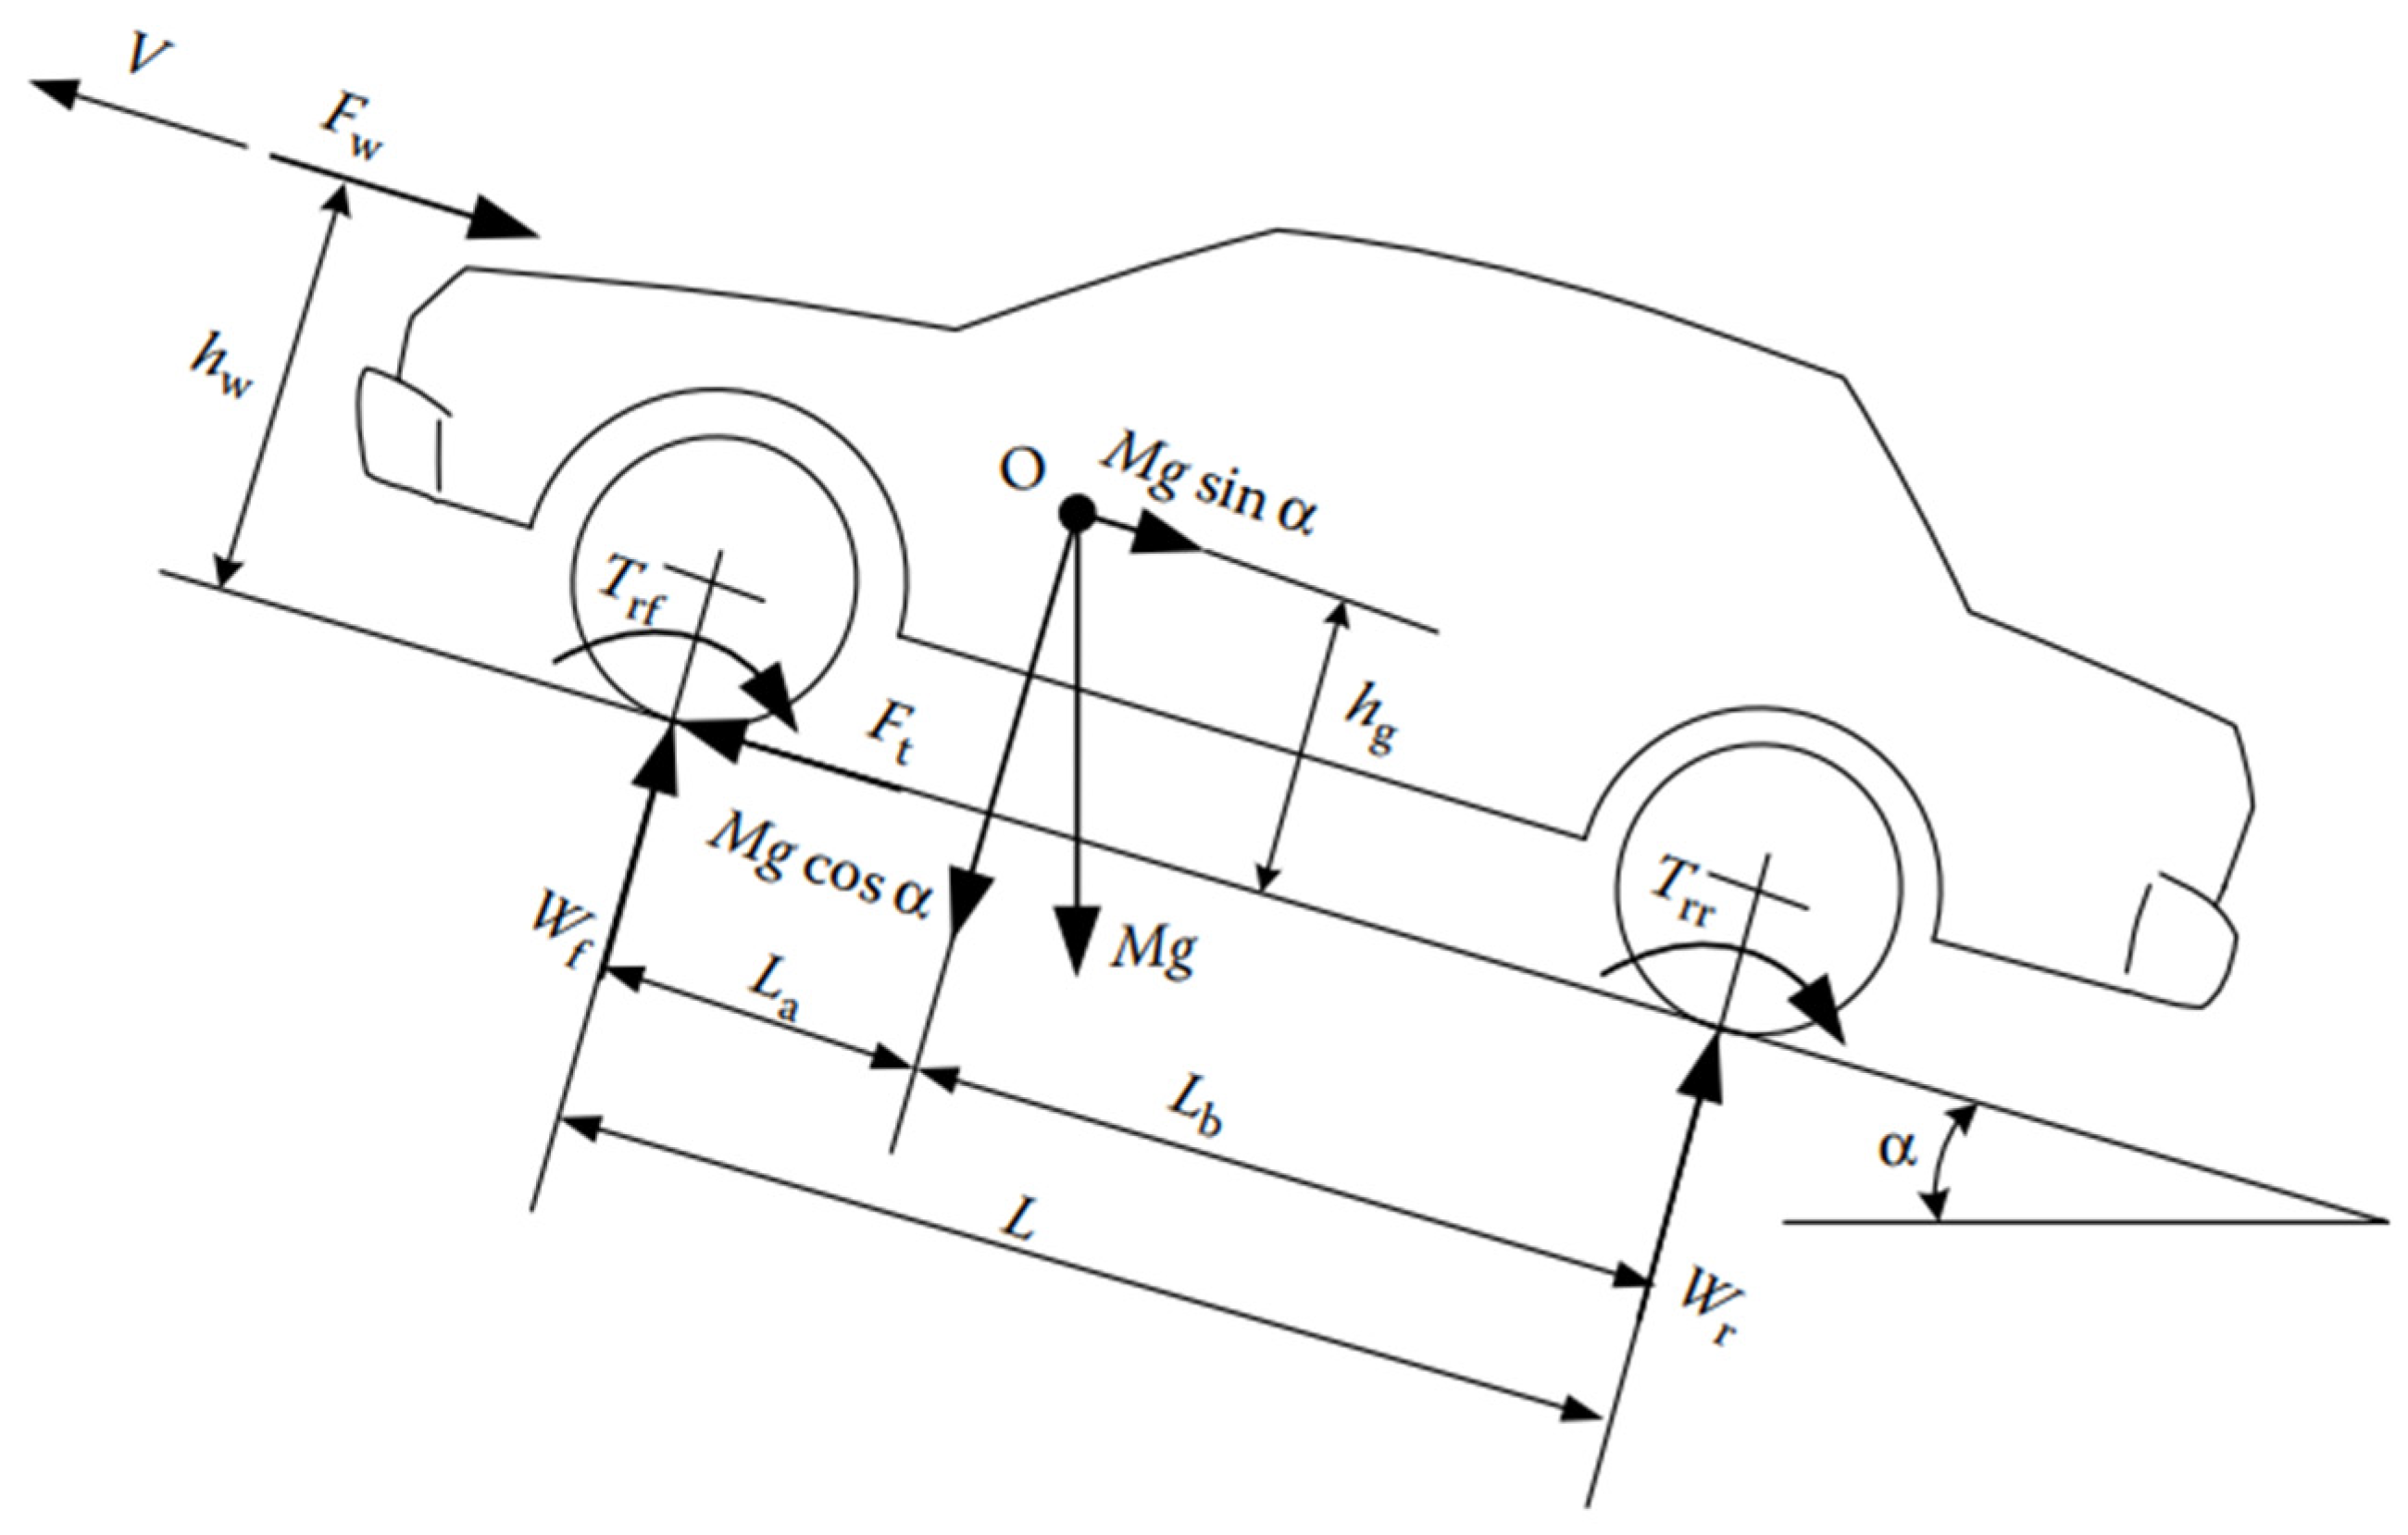
The dynamics of a vehicle are the result of the combined effects of all forces and torques acting upon it. The primary forces include longitudinal tire forces, gravitational forces, and aerodynamic drag, as shown in Figure 2. Longitudinal tire forces, denoted as , are the forces exerted by the tires that push the vehicle forward or backward depending on the direction of motion. The weight of the vehicle, expressed as , acts through the vehicle’s center of gravity (CG). This weight exerts a force pulling the vehicle towards the ground and, depending on the incline angle , either pulls the vehicle backward or forward. When considering aerodynamic effects, drag is an important factor; it opposes the vehicle’s motion, effectively slowing it down. For simplicity, aerodynamic drag is assumed to act through the CG and can be calculated using the following formula [20]:
where is the drag coefficient, is the air density, is the frontal of the vehicle, is the vehicle’s speed, and is the wind speed. The term accounts for the direction of the drag force.
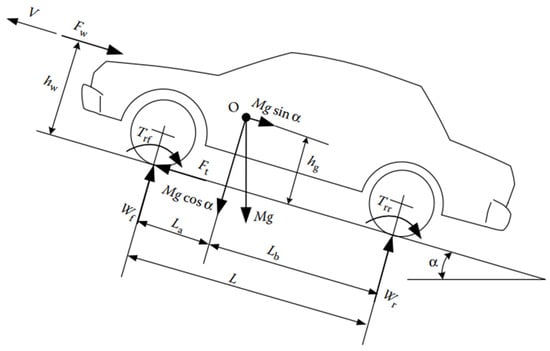
Figure 2.
Vehicle force diagram.
The longitudinal dynamics of the vehicle can be described by the following equation:
In the Equation (2), represents the mass of the vehicle, is the longitudinal acceleration, is the net longitudinal force generated by the tires, is the aerodynamic drag, is the acceleration due to gravity, and is the incline angle. The total longitudinal force is the sum of the longitudinal forces at the front and rear tires.
2.3. Vehicle Parameters
Table 1 displays the parameters of the electric vehicle.
2.4. Control Strategy for Recovering Braking Energy
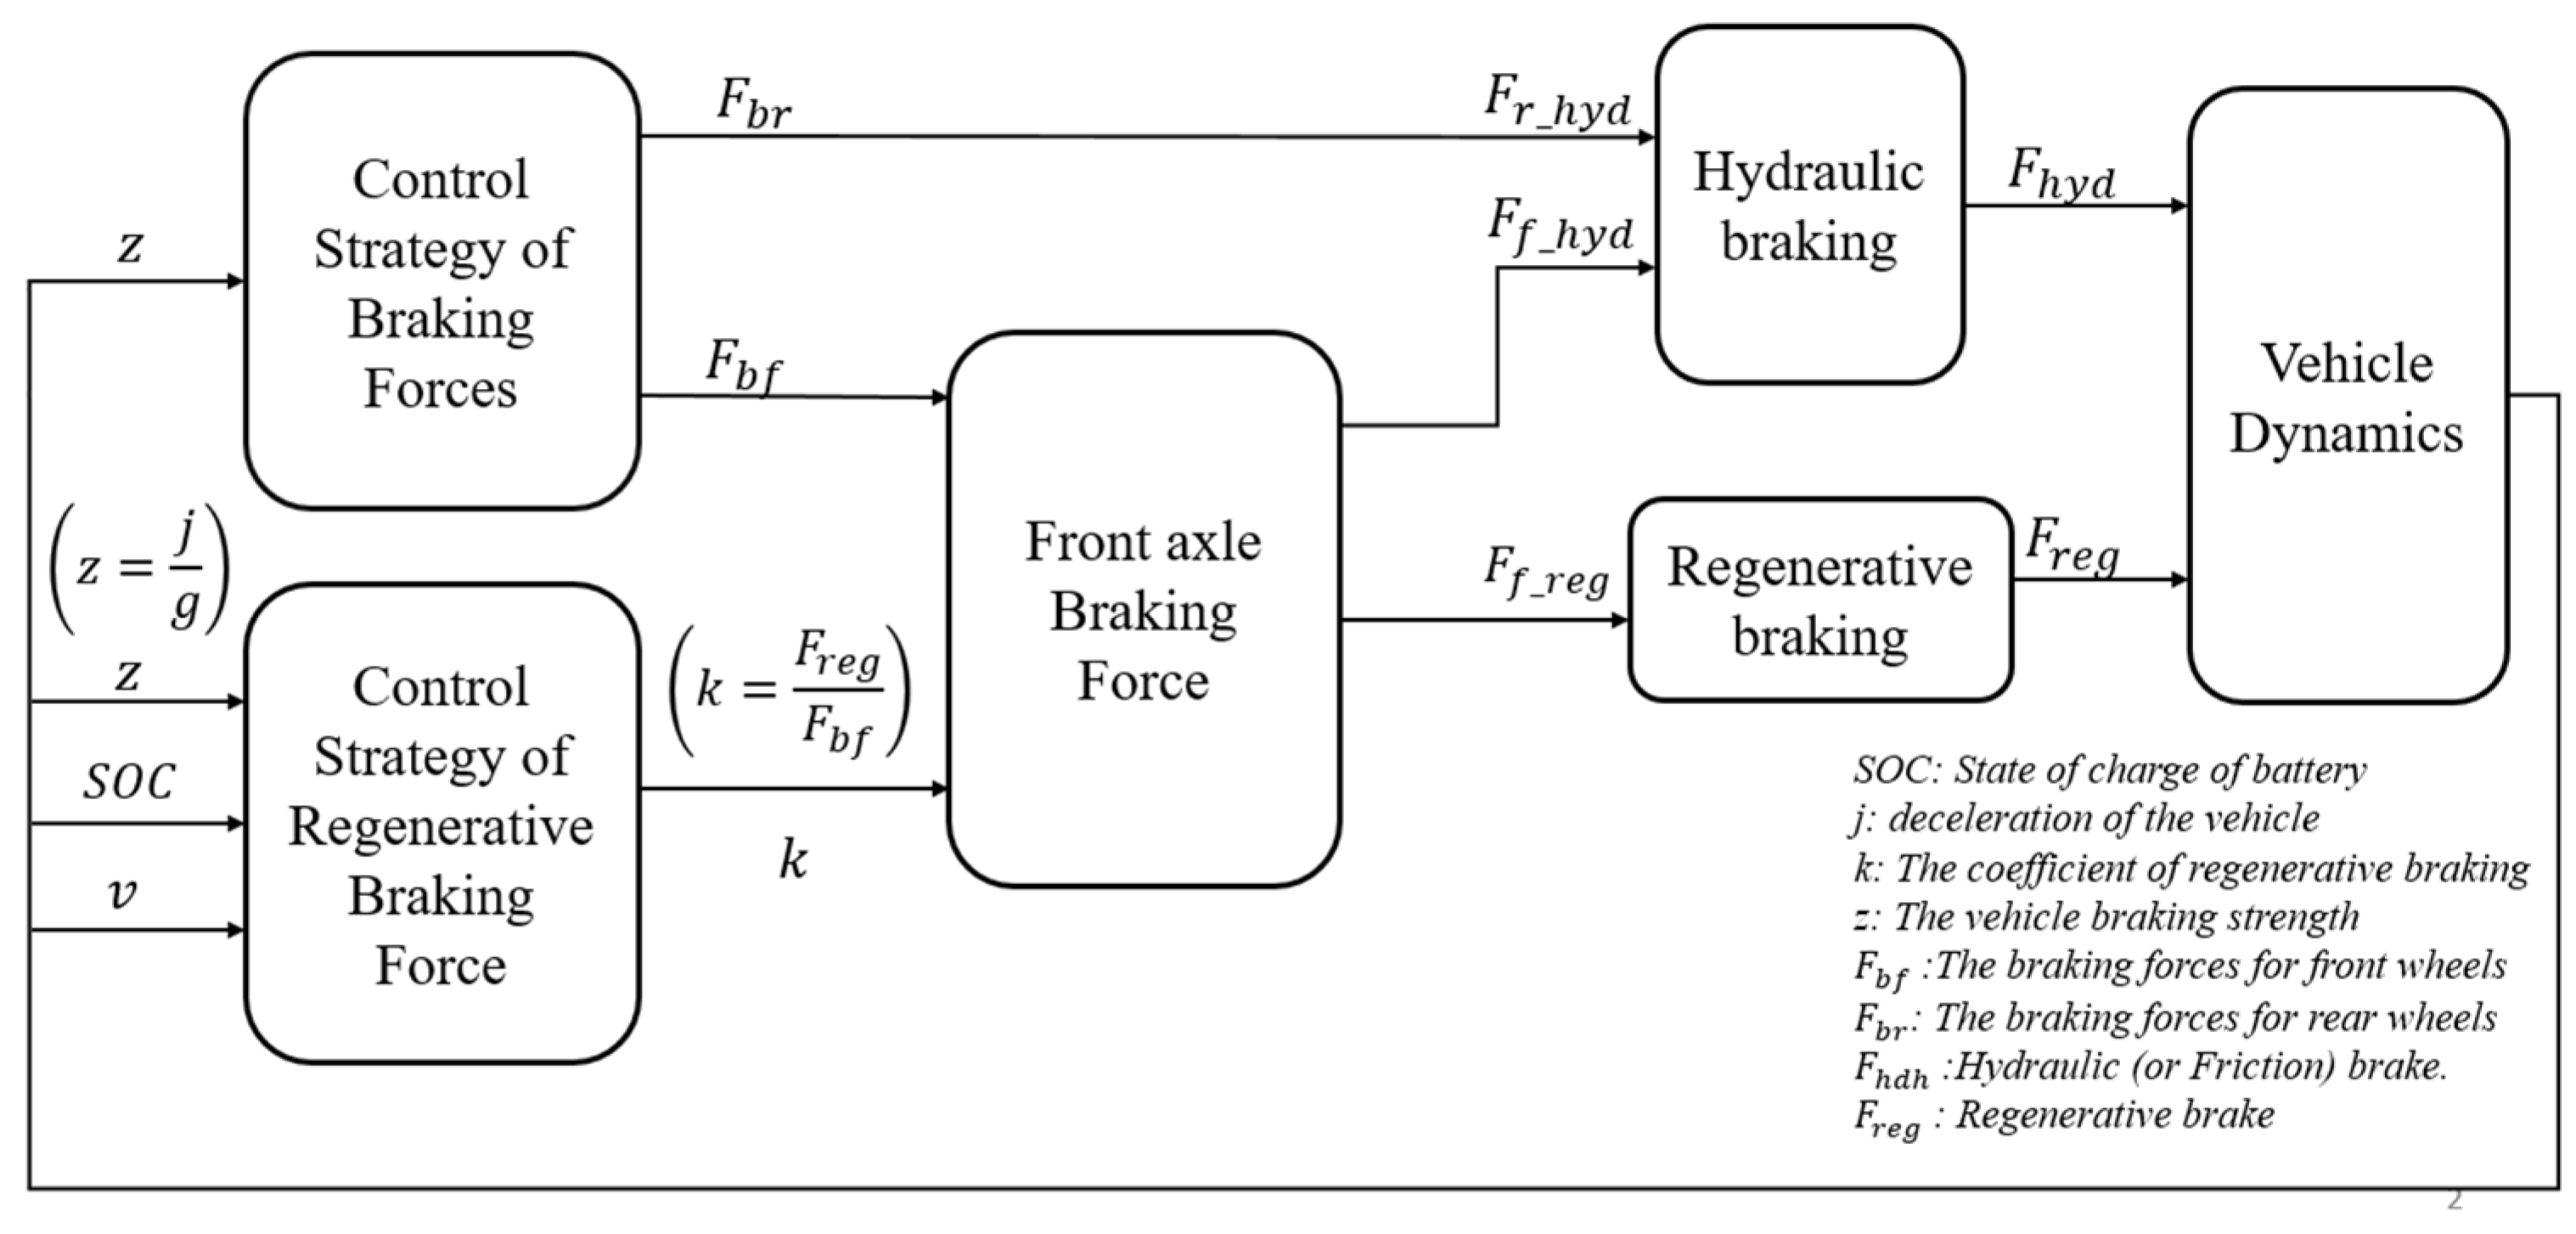
Figure 3 demonstrates the rationale behind the braking energy recovery control strategy, as outlined in this paper. The process begins with the Braking Force Control Strategy with a technique to comply with ECE R13 rules, where the braking force is calculated based on an analysis of the vehicle’s braking strength. From this, the appropriate braking force is allocated to the front and rear wheels through a specific force distribution strategy. Next, the Regenerative Braking Force Control Strategy calculates the proportion of braking force to be allocated to regenerative braking based on factors such as the battery’s state of charge, vehicle speed, and deceleration, by using fuzzy control to maximize energy recovery during braking. Fuzzy logic is particularly useful when dealing with systems that have uncertain or partially known parameters, such as the SOC of the battery and the unpredictability of future driving maneuvers. The ratio k represents the distribution between the regenerative braking force and the total braking force applied to the front axle, aiming to optimize energy recovery. The portion of the braking force not managed by regenerative braking is handled by the hydraulic braking system, ensuring that braking force is applied evenly to both the front and rear wheels, contributing to the vehicle’s overall braking force. Conversely, regenerative braking is prioritized on the front wheels to maximize energy recovery and reduce reliance on traditional friction brakes. Finally, Vehicle Dynamics represent the vehicle’s response to braking forces, including the distribution between hydraulic and regenerative braking. The vehicle’s deceleration and overall behavior are adjusted based on the interaction between these forces.
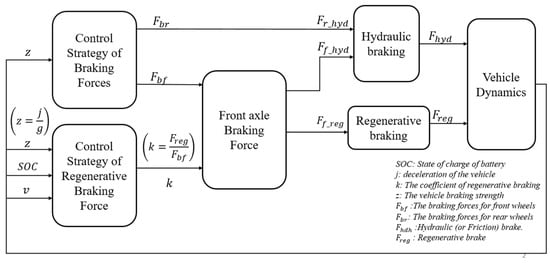
Figure 3.
Block diagram of overall system.
3. Controller Development
3.1. Braking Force Distribution for Front and Rear Axles
3.1.1. Front/Rear Braking Force Distribution Constraints
The road–wheel adhesion, directly proportional to the normal load on the wheel, constrains the maximum braking force. The braking force on the front and rear axles should be directly proportional to the normal forces acting on each axle.
Here, denotes the total braking force on the front wheels, and represents the total braking force on the rear wheels. When there is a decrease in speed, the value of becomes negative. For simplicity, let us define j and , representing the braking strength.
The ideal braking force distribution curve, known as the I curve, in automotive braking systems represents the optimal distribution of braking force between the front and rear wheels, ensuring maximum braking efficiency and vehicle stability. During braking, the vehicle’s weight shifts forward, requiring the front wheels to receive more braking force. The ideal curve helps determine the appropriate braking force ratio, preventing wheel lock-up and loss of control. It also balances the braking force with the tires’ grip on the road, ensuring safe and effective braking on various surfaces. It can be represented as follows:
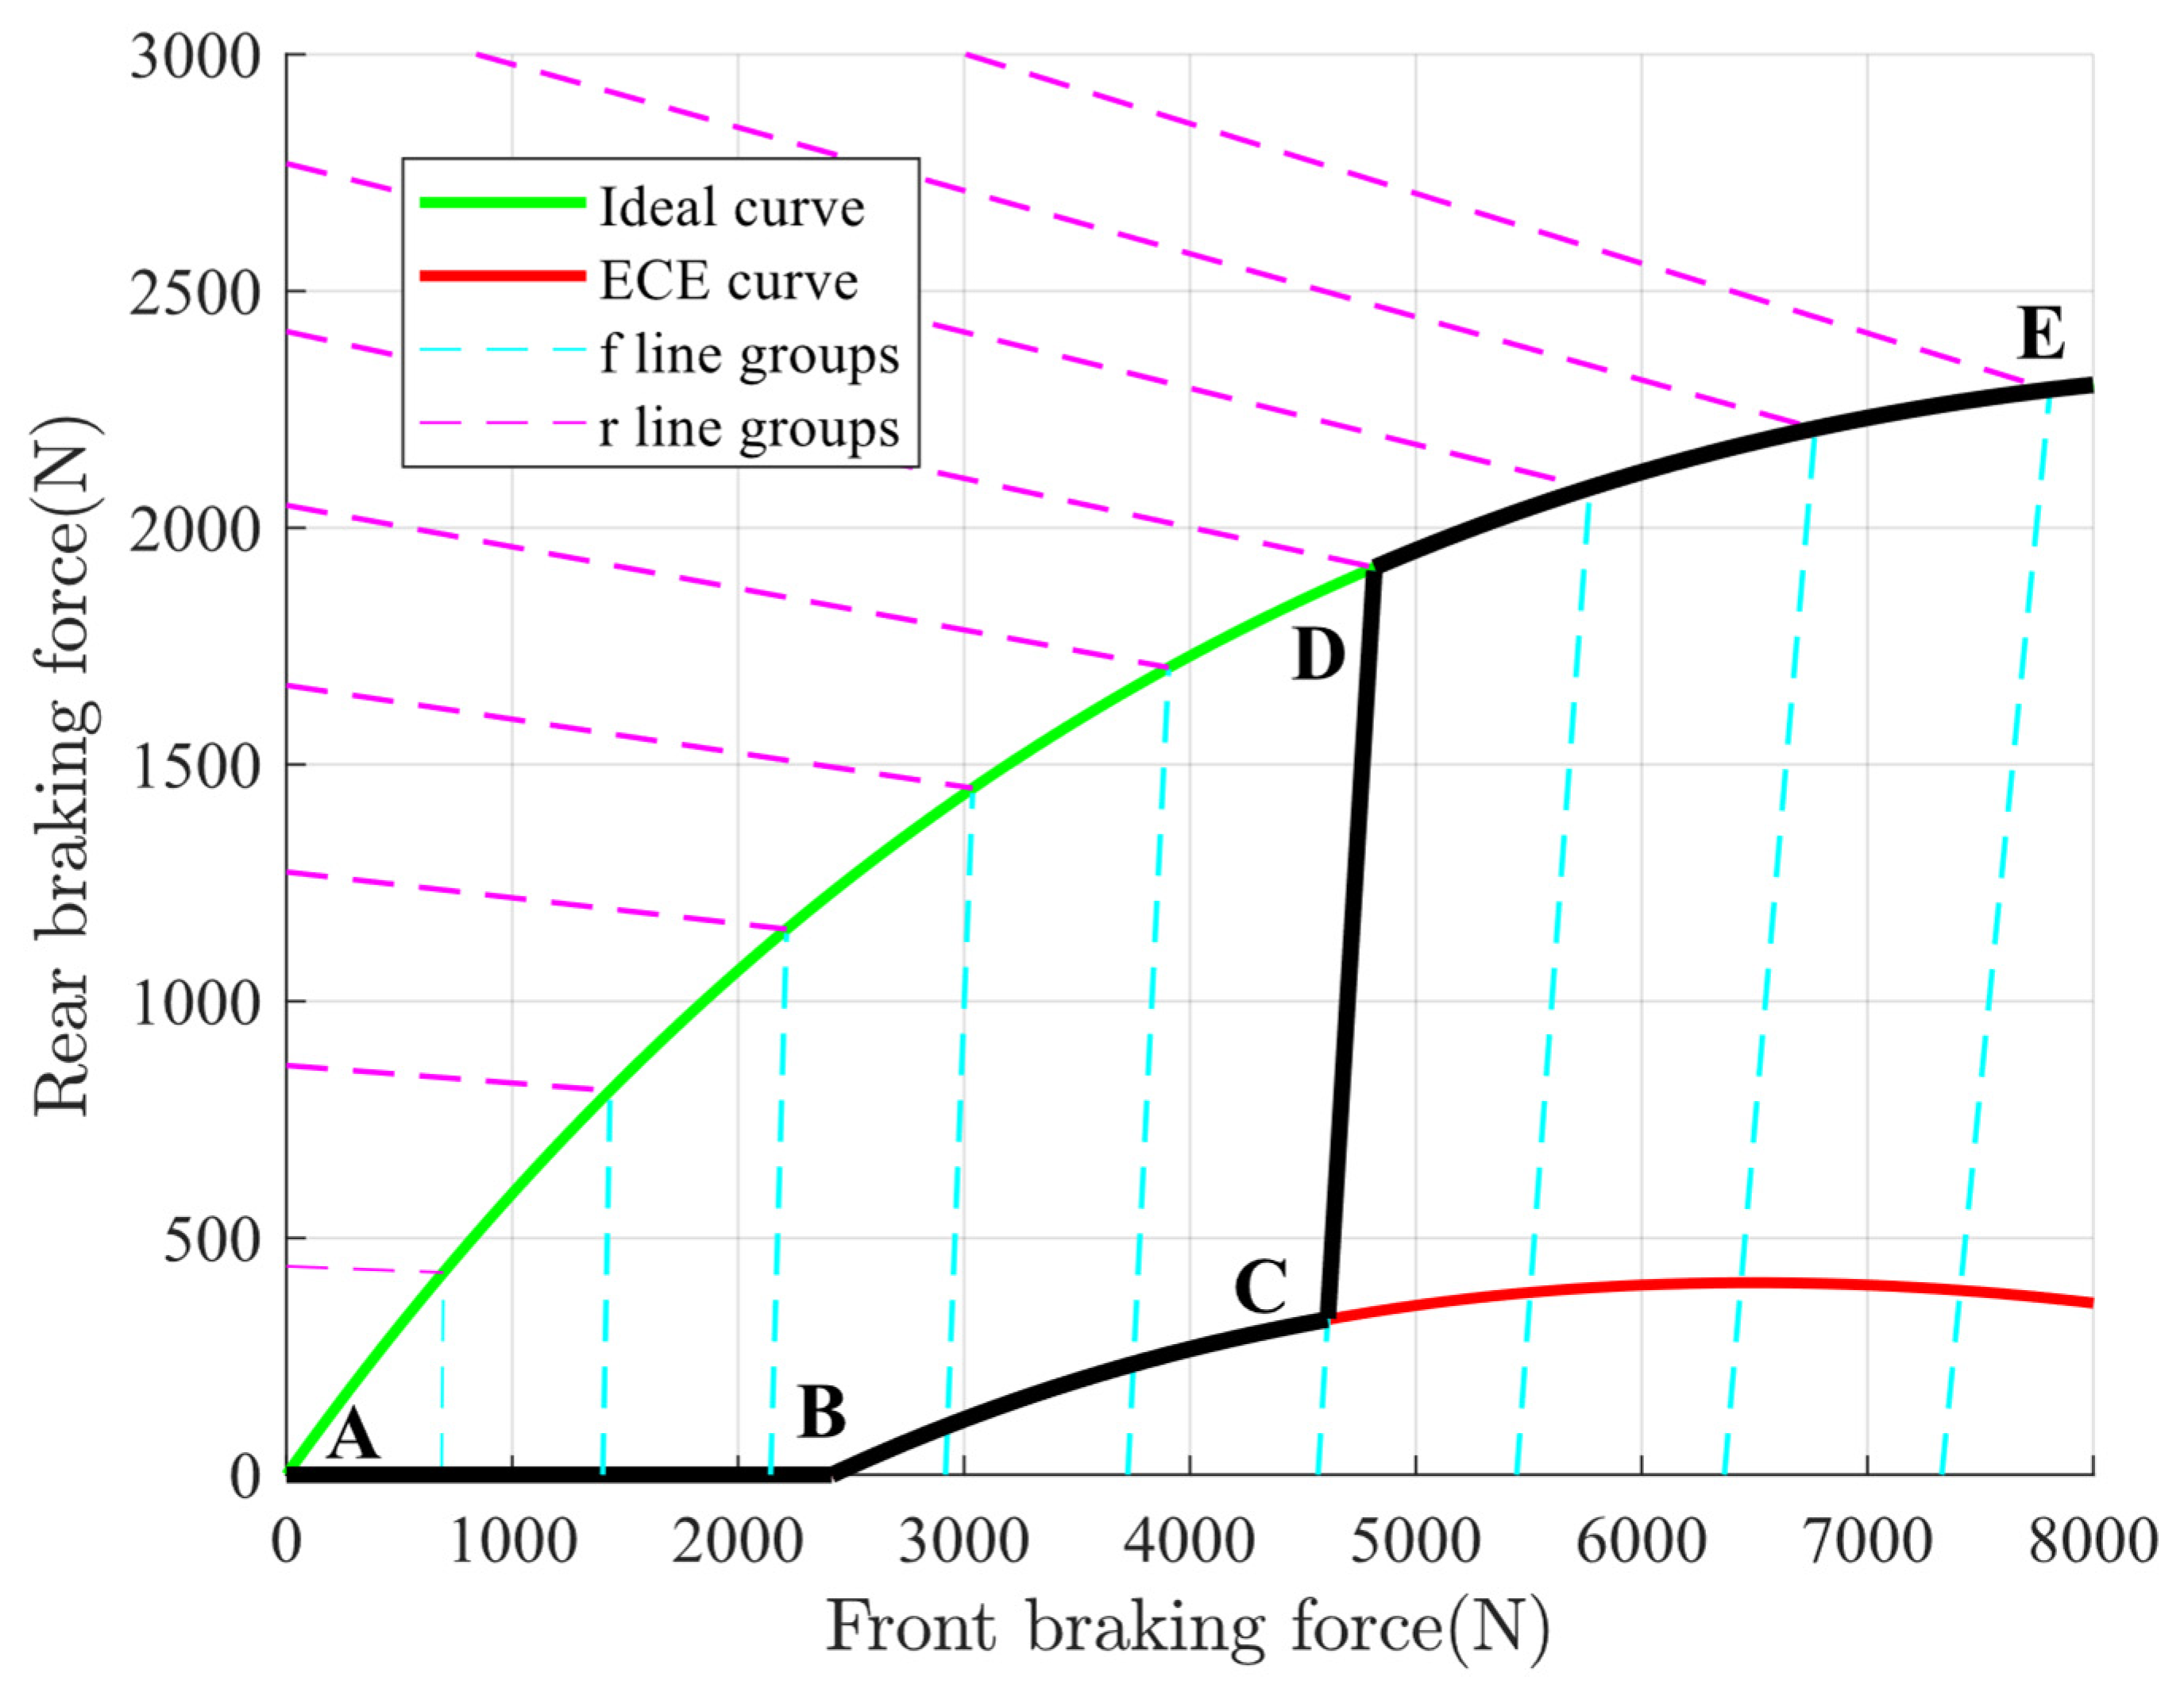
In a situation where the front wheels lock while the rear wheels remain unlocked, the braking force exerted on the front wheels can be mathematically represented by Equation (5). This equation generates a set of lines known as f lines, which depict the distribution of braking force on the front wheels of a vehicle. During braking, the vehicle’s weight shifts forward, requiring the front wheels to receive more braking force than the rear wheels. These lines, shown in Figure 4, vary based on the road’s adhesion coefficient . They help optimize the balance between braking force and the adhesion of the front tires, which is crucial for maintaining control during braking.
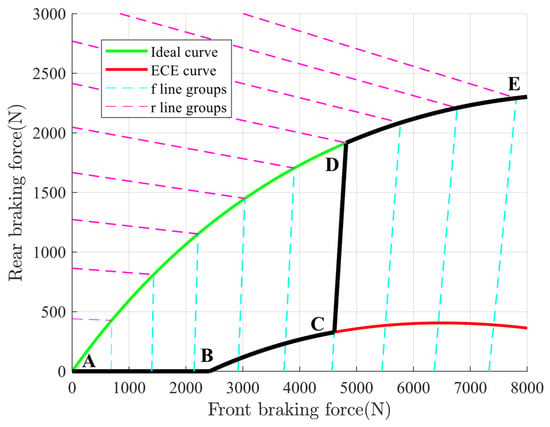
Figure 4.
Front and back wheel brake force distribution curve.
Furthermore, in the scenario where the rear wheels lock while the front wheels remain unlocked, this is represented by the r line, which illustrates the distribution of braking force on the rear wheels of the vehicle. Typically, the braking force on the rear wheels is lower than that on the front wheels to prevent the rear wheels from locking up and losing traction. The r line is designed to ensure that the braking force on the rear wheels supports the braking process without compromising the vehicle’s stability.
The lines produced by Equation (6) on roads with varying adhesive coefficients are denoted as r lines, as illustrated in Figure 4.
The ECE R13 Braking Standard, established by the United Nations Economic Commission for Europe, sets specific rules for the braking force of the front and rear wheel brakes of two-axle vehicles [21]. These standards are necessary to ensure that cars maintain directional stability and achieve satisfactory braking performance.
Equation (7) demonstrates that the rear wheels are always unlocked before the front wheels. Put simply, the actual braking force distribution curve is consistently positioned lower than the I curve. ECE also specifies the minimum braking force that must be applied to the rear wheels, as indicated by the following:
The equation implies that if the front wheels are immobilized, the rear braking force must be sufficient enough to ensure that the vehicle decelerates at a pace that is equal to or greater than the value specified in Equation (8).
3.1.2. Design of Braking Force Distribution for Front and Rear Axles
To provide the maximum front braking force while complying with the ECE R13 standards, the allocation rules for front- and rear-axle braking forces should be positioned above the ECE curve and below the I curve. The suggestion is to divide the distribution tactics into four sections based on braking strength:
where corresponds to the intersection between the ECE curve and horizontal axis. The point is the result of the intersection between the line representing the ECE curve and the lines representing the values of at = 0.6. The point of intersection between the lines at = 0.6 and the I curve is denoted as . The black line in Figure 4 represents the anticipated locus of the distribution of braking forces with an increasing braking strength.
3.2. Designing Controller Based on Fuzzy Logic
3.2.1. Design of Fuzzy Controller
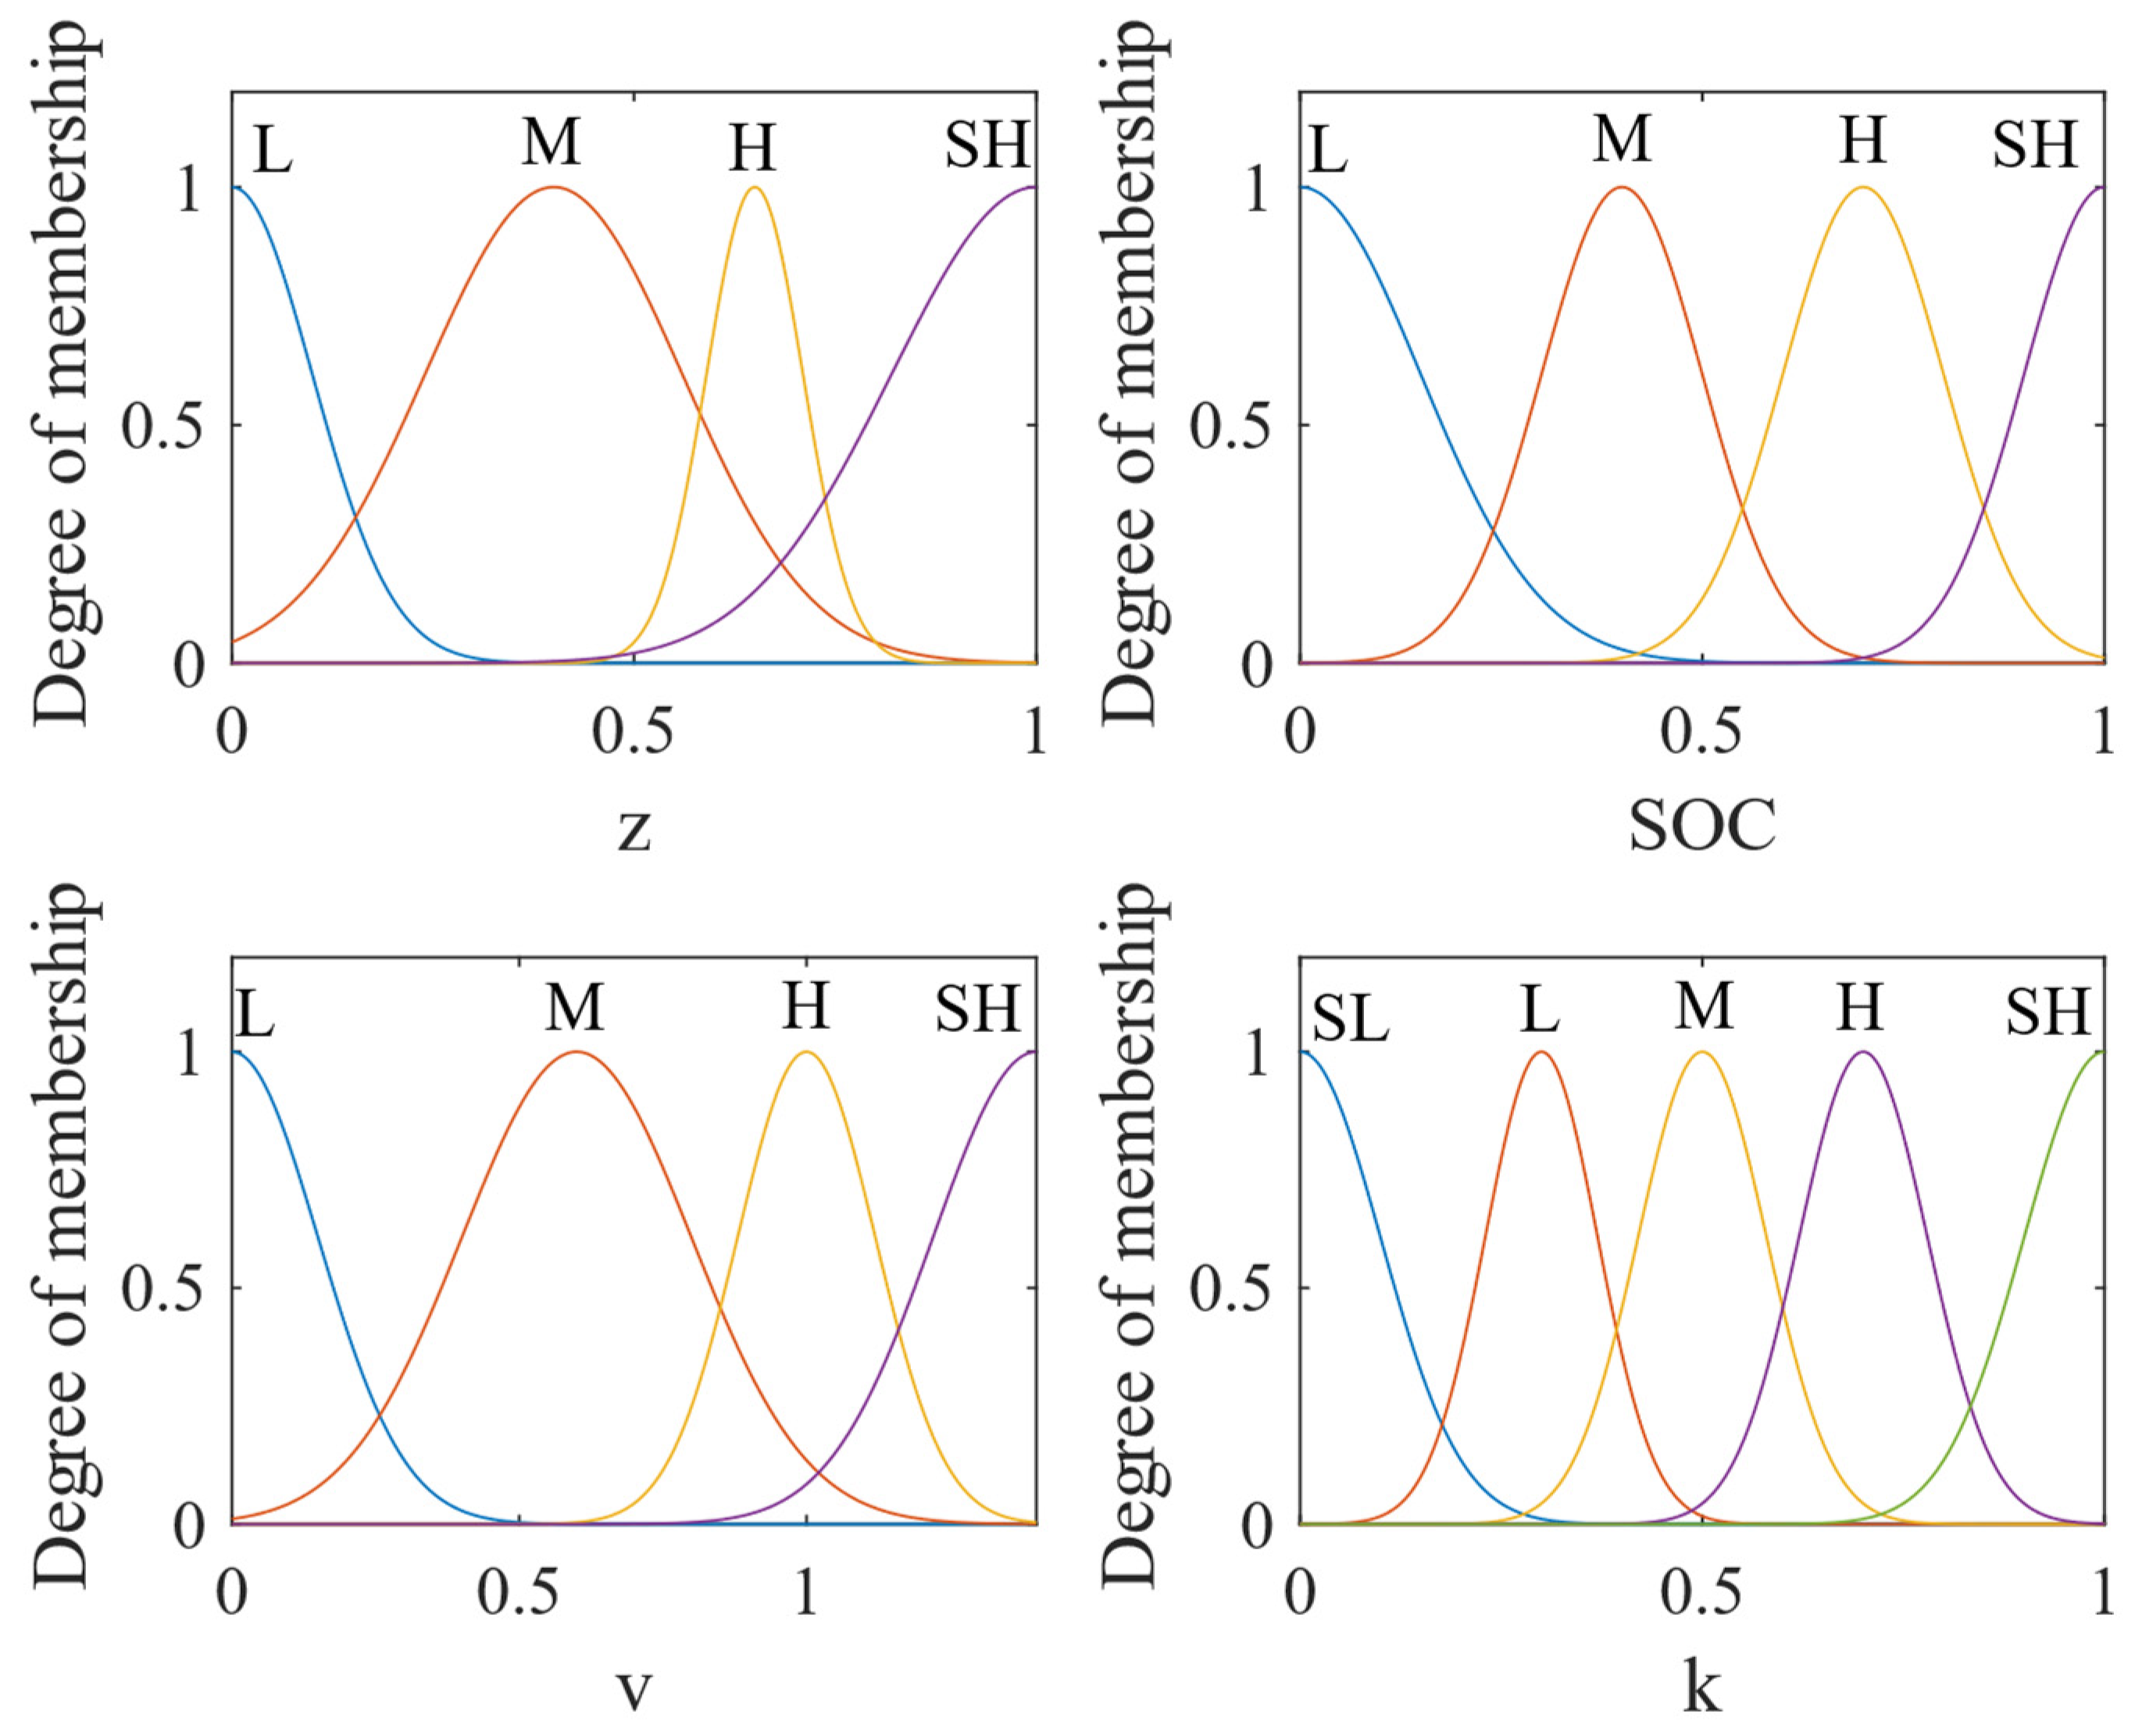
Initially, the input and output variables undergo fuzzification, during which the membership functions for each variable are determined. This paper details the development of a fuzzy reasoning system using MATLAB, with Gaussian functions chosen to represent the membership functions for both input and output variables. Gaussian functions are preferred due to their smooth and continuous nature, which allows for natural and precise transitions between different membership levels. Additionally, Gaussian functions are highly effective in modeling continuous variables and minimizing noise, ensuring that the system remains stable in response to small fluctuations in input data [22]. The Gaussian function is mathematically expressed as follows:
where denotes the shape, and indicates the central location of the curve. Figure 5 illustrates the membership functions for each fuzzy variable, providing a visual representation of how these functions are structured.

Figure 5.
Membership functions.
In this system, the braking intensity represented by the variable z ranges from 0 to 1 and can be stated as z = [0, 1]. The braking intensity fuzzy set has the terms [L, M, H, SH], which correspond to the levels of low, medium, high, and very high, respectively. The range between membership functions is determined through braking force distribution of the front and rear wheels and the value of braking strength in the specific case specified in Section 3.1.
The range of speeds at which the vehicle can operate is defined as v = [0, 140], and it is represented by the fuzzy set [L, M, H, SH], corresponding to low, medium, high, and very high, respectively. The speed limit information provided is compiled from a general understanding of traffic regulations in many different countries and regions around the world.
The normal range of SOC is from 1% to 100%. The effectiveness of braking energy recovery is compromised when SOC is either excessively high or excessively low. The SOC domain is specified as a range from 0 to 1, and its fuzzy set consists of four categories: low (L), medium (M), high (H), and super high (SH). The regulations and information provided about battery health in electric vehicles are based on a general understanding of battery technology and standard practices in the electric vehicle industry.
The coefficient of regenerative proportionality (k) is the output of the fuzzy logic control and denotes the proportion of the electric to the hydraulic braking applied to the front axles. A higher value of k corresponds to a stronger electrostatic force. The value of k can vary from 0 to 1, and it is represented as k = [0, 1]. The fuzzy set for k consists of the elements [SL, L, M, H, SH], which represent very low, low, medium, high, and very high, respectively, in relation to the regeneration constant of proportionality.
3.2.2. Fuzzy Rules
The implementation of fuzzy rules involves the integration of fuzzy languages, which relies on extensive practical engineering expertise [23]. This paper thoroughly examines the braking stability and lifespan of the power battery in a vehicle while distributing regenerative braking force to the front axle. When designing fuzzy rules, the IF-THEN logic rule is utilized. The rule is expressed in the following manner:
where , , , and are the fuzzy set, and n represents the overall quantity of fuzzy control rules.
Table 2 displaying the fuzzy rules is presented below. When the velocity (v) is high, the coefficient (k) approaches 1, and the primary method of recovering energy is through motor braking. However, when the velocity is too low, mechanical braking is primarily employed due to the low energy generated by the vehicle. Additionally, when the state of charge (SOC) of the power battery is high, the coefficient (k) is decreased, resulting in reduced energy recovery. This adjustment is made to prevent overcharging and its detrimental impact on battery lifespan. Thus, the variable k is directly proportional to the velocity v and inversely proportional to both the impedance z and the state of charge (SOC) of the power battery.

Table 2.
Fuzzy control rules.
3.2.3. Defuzzification
In fuzzy logic systems, several common defuzzification methods are used to convert fuzzy output into a precise value. The mean of maximum method, for instance, calculates the average of the values where the membership function reaches its maximum, offering simplicity and speed, though it may overlook some details of the fuzzy set [24]. The first of maximum method selects the first value where the membership function peaks, making it quick and easy to implement, but it can oversimplify the fuzzy data [25]. Among these methods, the center of gravity method, also known as the centroid method, is often preferred for its accuracy. This method considers the entire shape of the fuzzy set, calculating the center of the area under the curve to provide a more precise and balanced output. Although it requires more complex calculations, the method is ideal for applications where accuracy is crucial. Therefore, in this study, the center of gravity method is employed for defuzzification to obtain the precise value of the proportional coefficient k for regenerative braking. The formula for the center of gravity method is presented in this paper:
The variable represents the application of rule I in order to calculate results. The variable n represents the number of fuzzy rules. The variable represents the calculated proportion of the output resulting from the application of rule . Lastly, the variable represents the accuracy of the system’s output.
4. Simulation Result and Analysis
4.1. Simulation Analysis of Braking Energy Recovery Control Straregy for Electric Vehicles
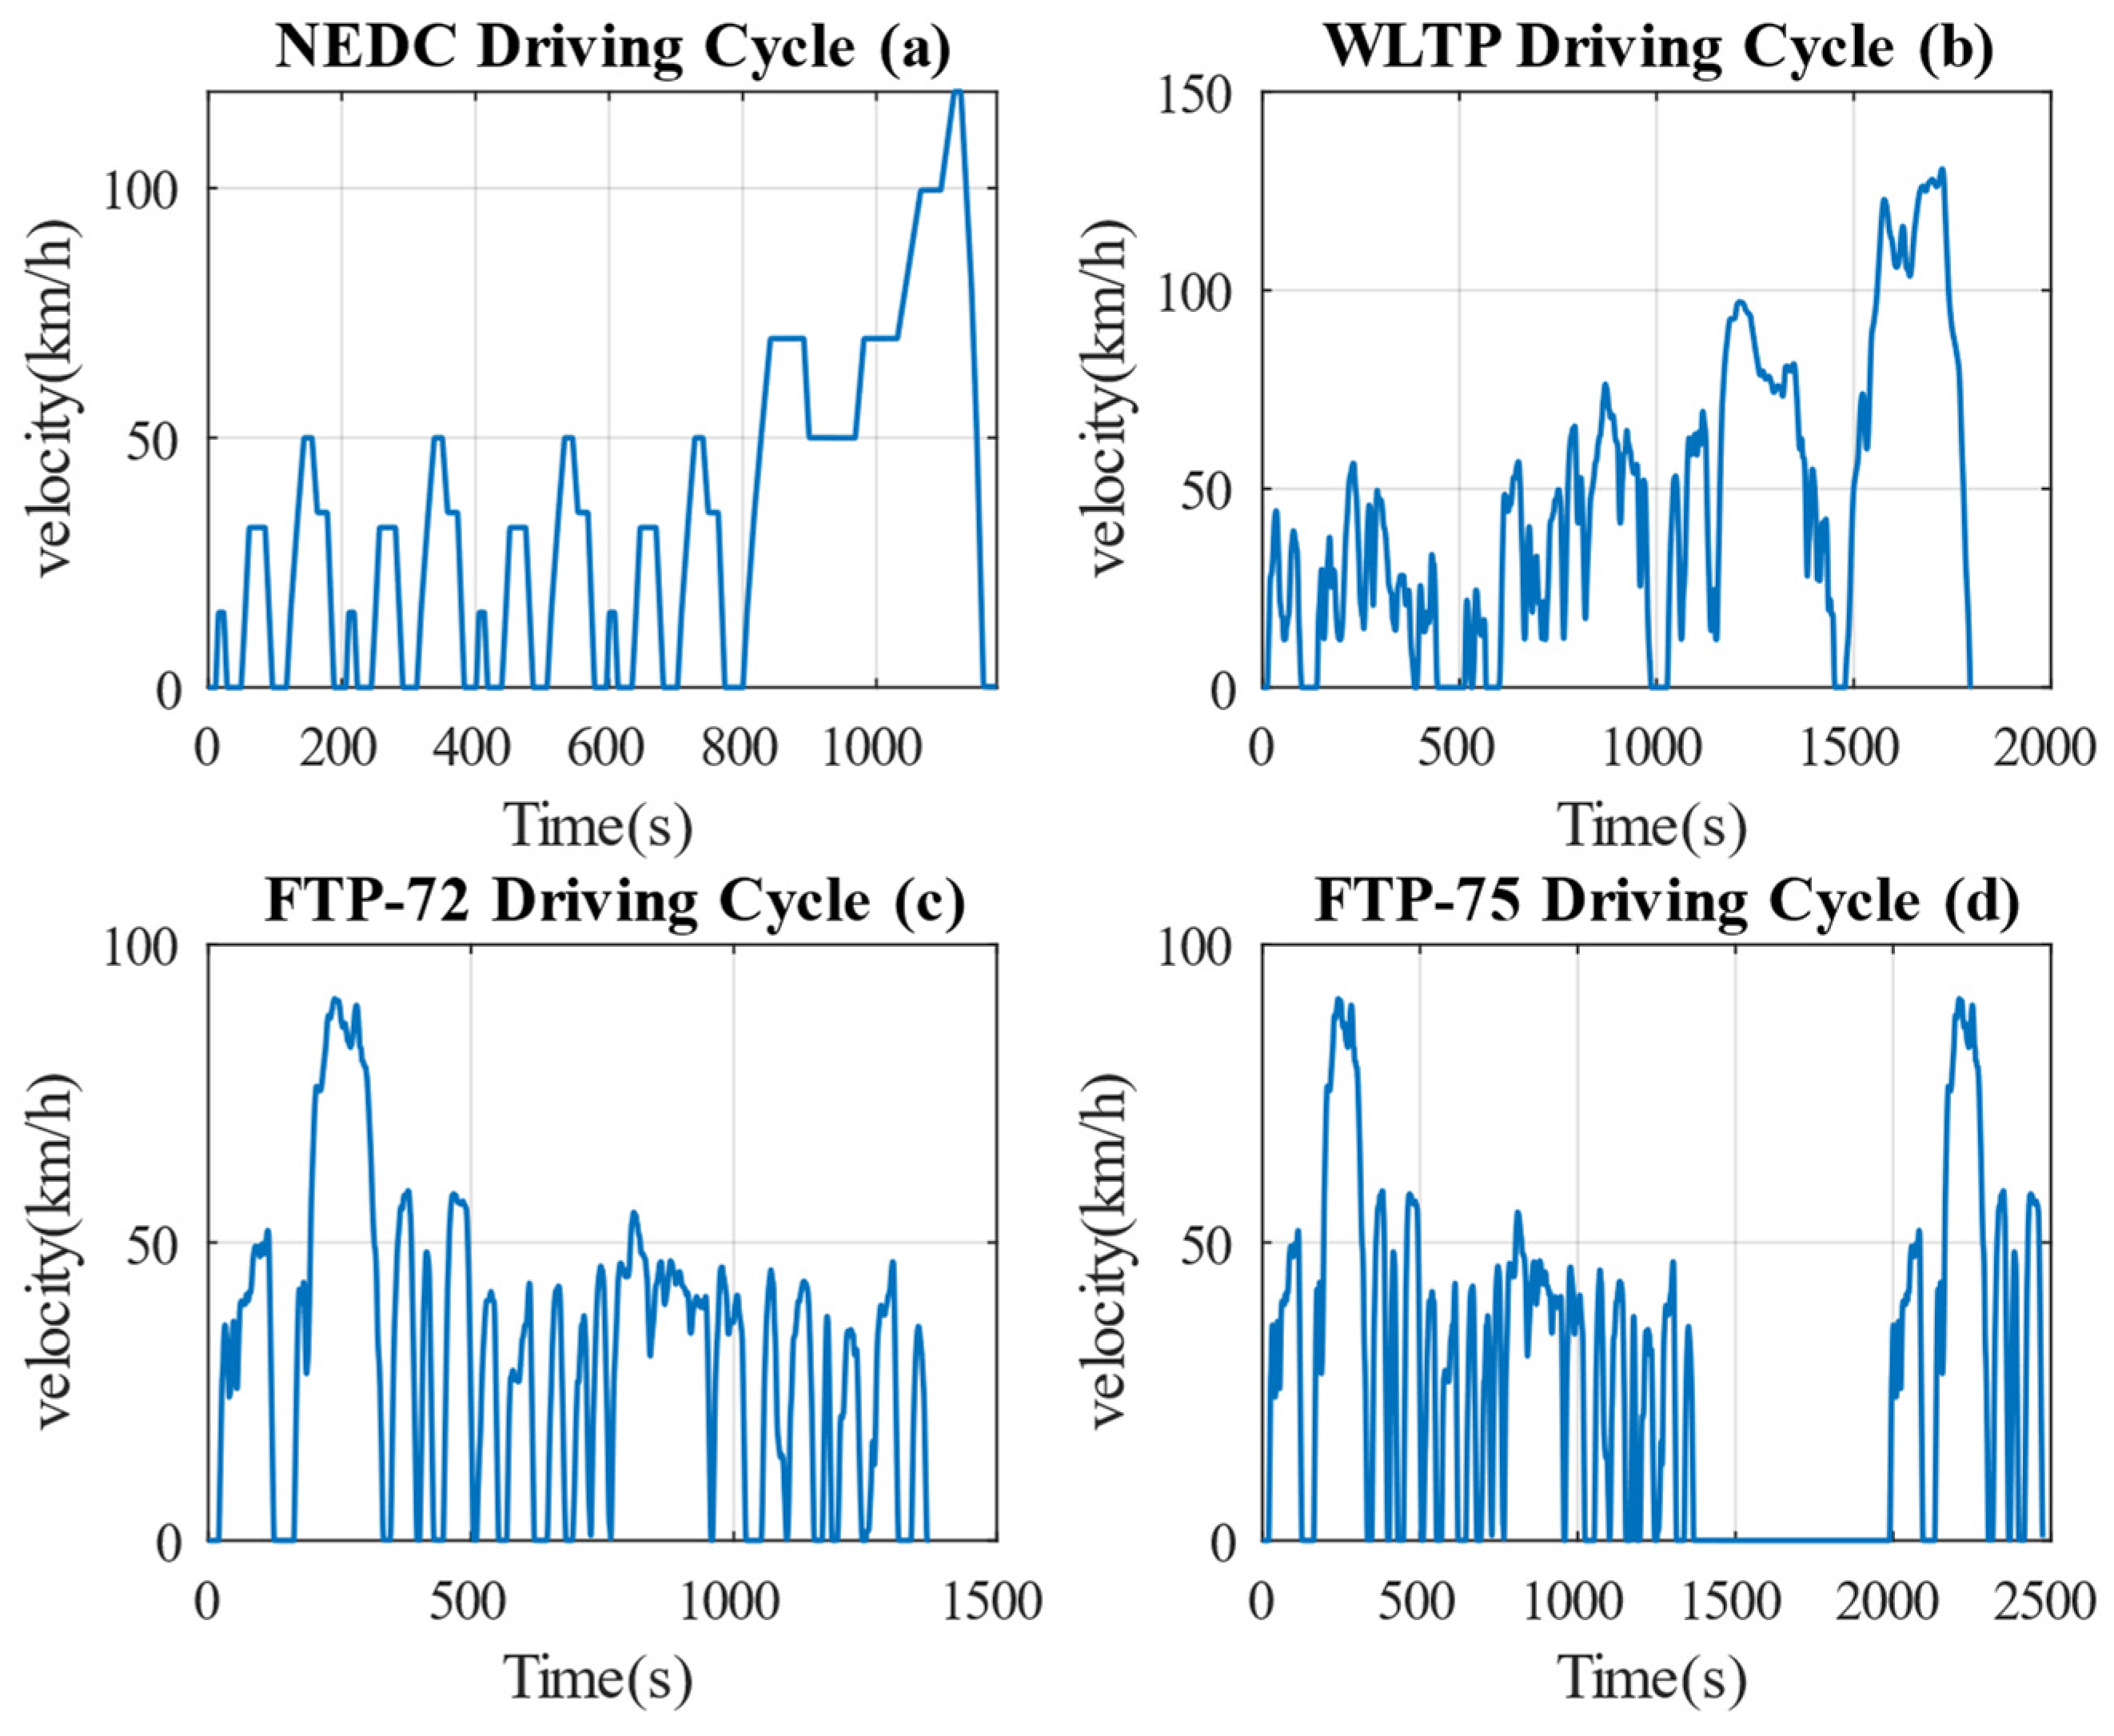
We constructed the model using the MATLAB/Simulink framework. The simulation model is composed of a MATLAB program that identifies vehicle parameters, plots them, and displays the results. The primary goal is to compare the application of a regenerative braking system with its absence. We dedicate ourselves to testing braking conditions, verifying various factors like braking forces, motor torque, wheel speed, and energy recovery, under four driving cycles: NEDC (New European Driving Cycle), WLTC (World Light Duty Vehicle Test Cycle), FTP72 (Federal Test Procedure 72), and FTP75 (Federal Test Procedure 75), as illustrated in Figure 6 [26]. The initial state of charge (SOC) of the vehicle power battery was set to 0.5.
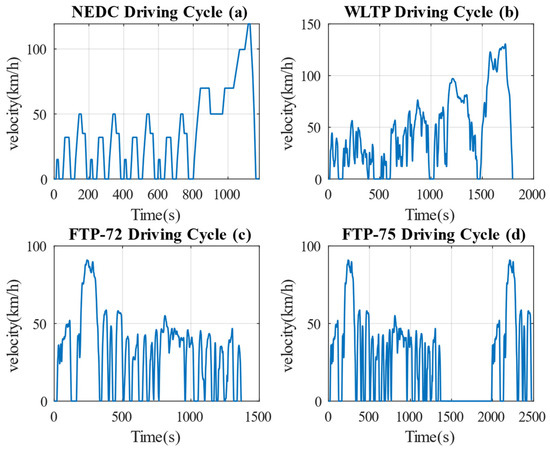
Figure 6.
Velocity curves.
To assess the efficiency of the control strategy suggested in this document, SOC, the effective energy recovery rate, and the braking energy recovery rate have been selected as the metrics for assessment. Equations (16) and (17) display the values for the effective energy recovery rate and the braking energy recovery rate [27]:
where is the energy recovered by braking; is the total braking energy; is the energy consumption of the whole vehicle; is the effective energy recovery rate in the process of vehicle braking; is the braking energy recovery rate in the process of vehicle braking.
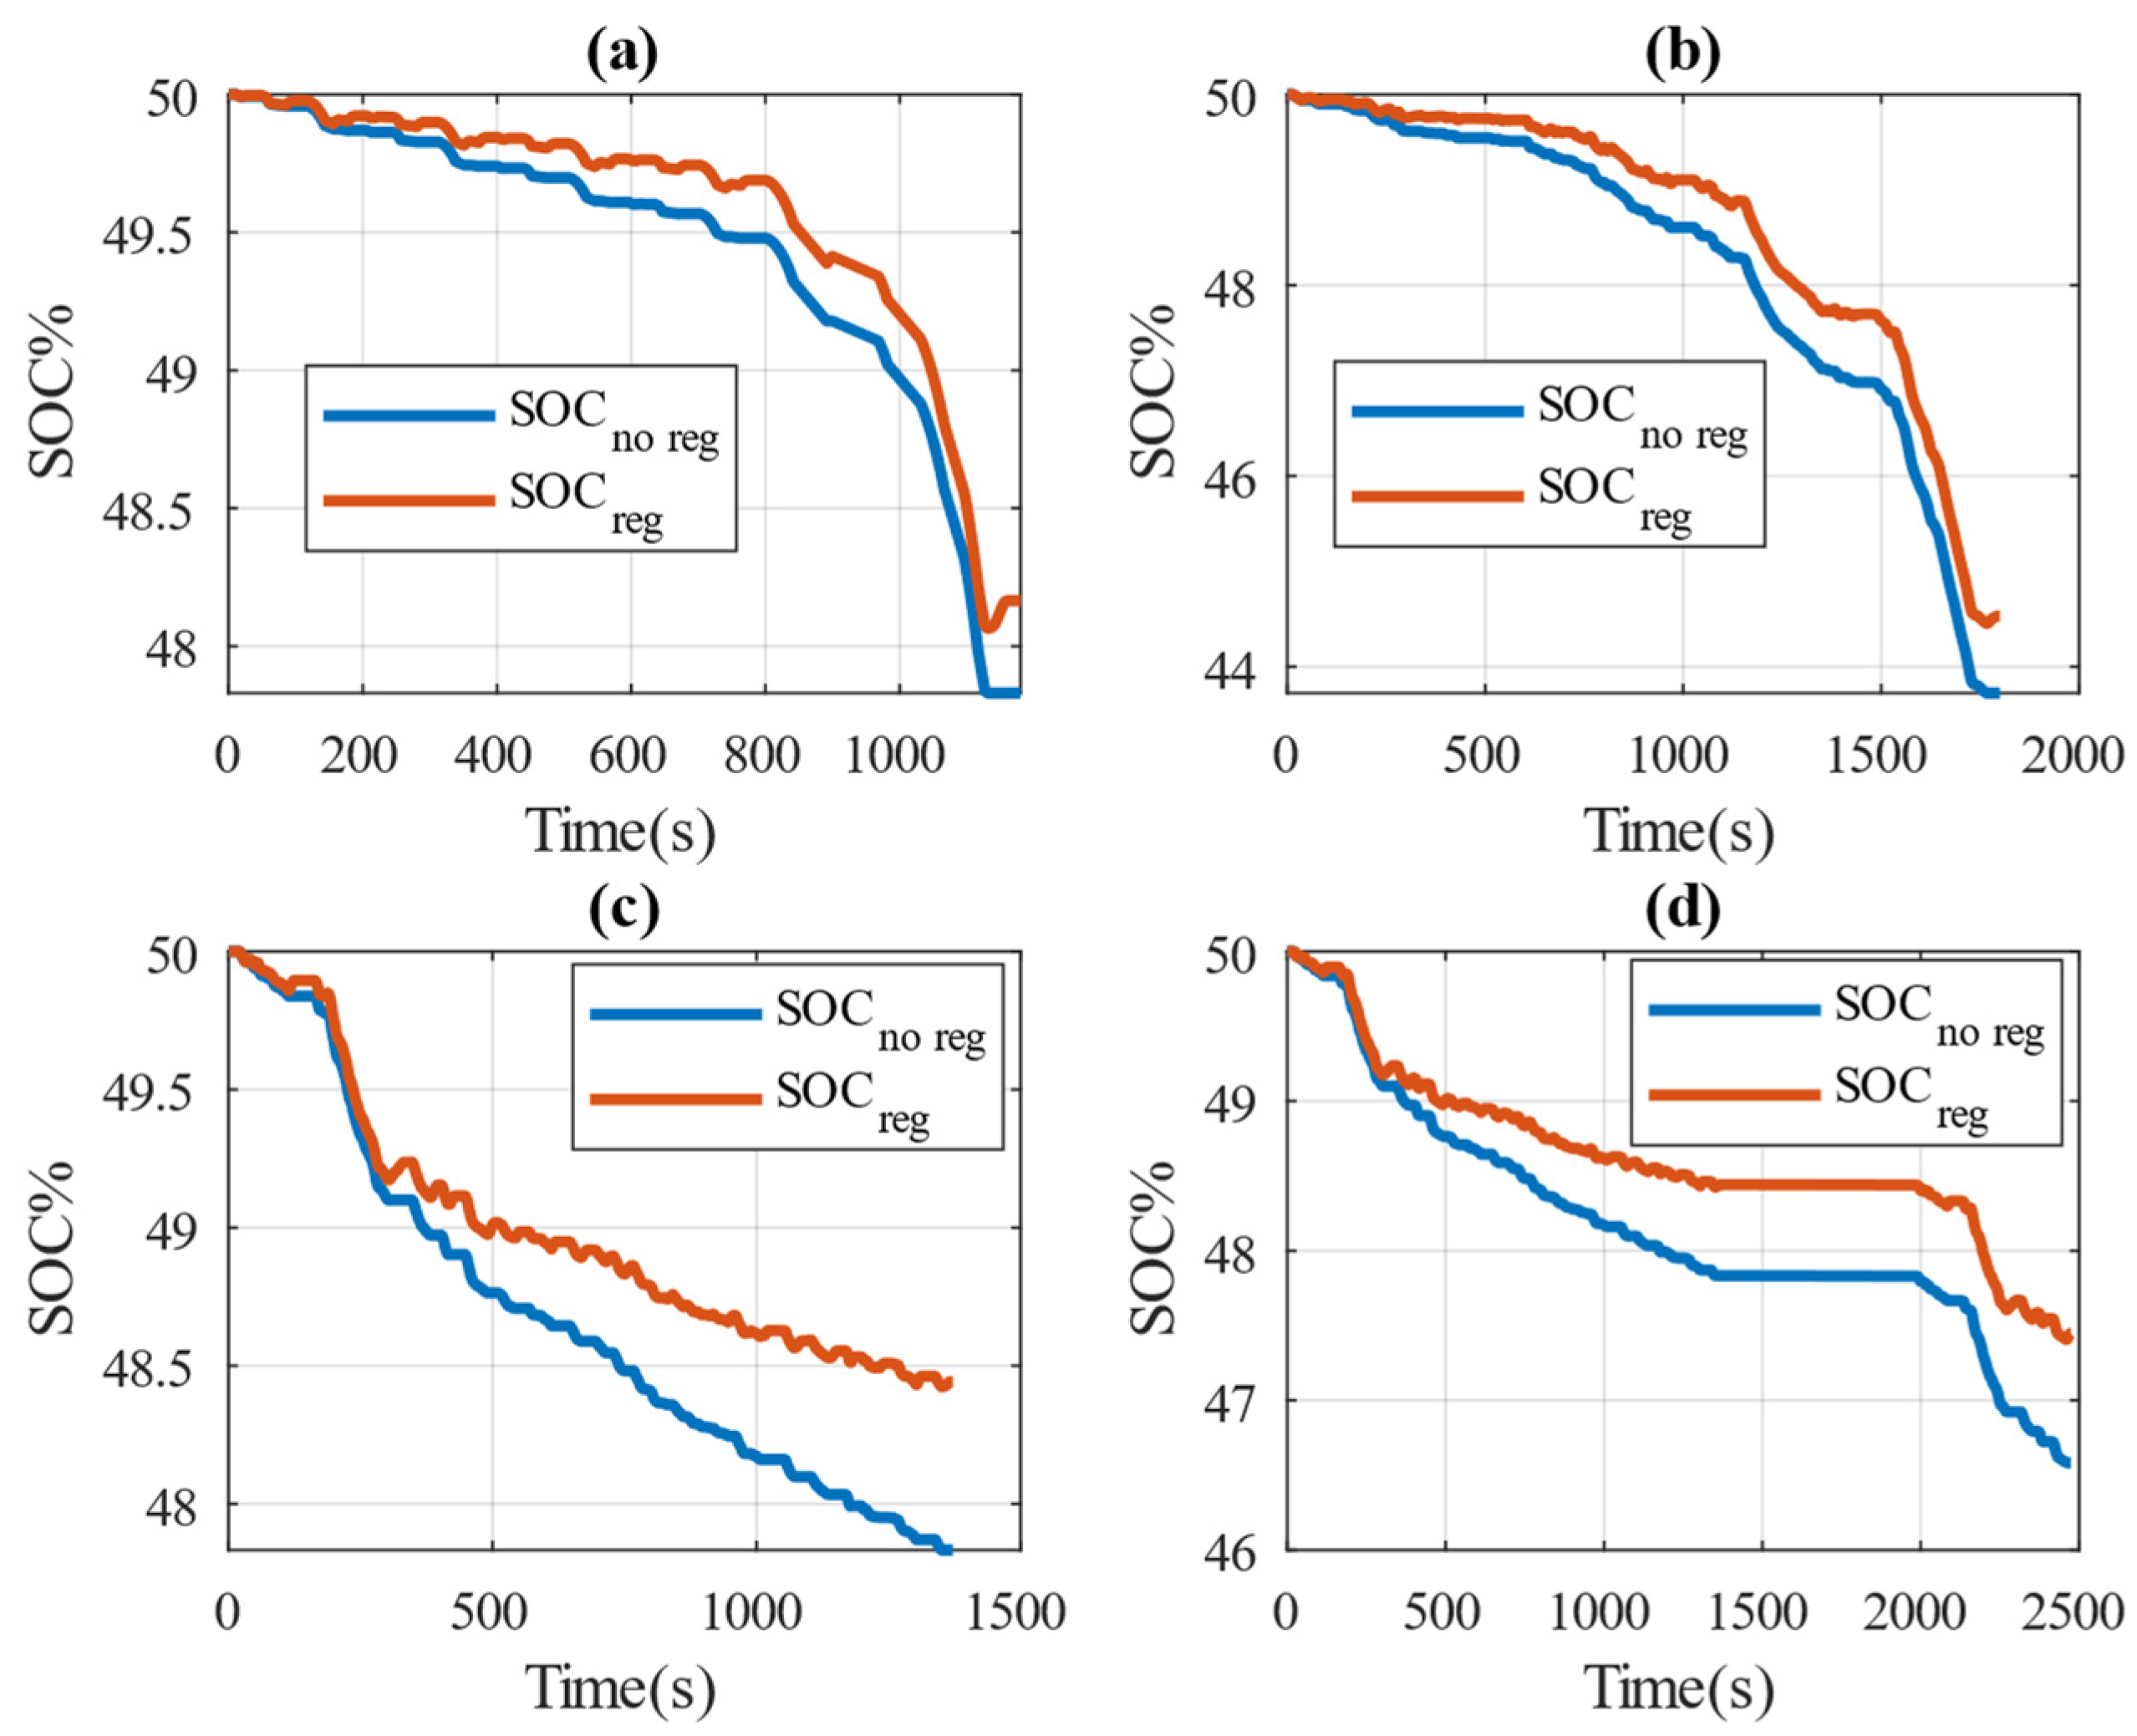
Figure 7 illustrates the analysis focusing on the fluctuations in the distance traveled when driving and the level of energy conservation across different driving cycle situations, including NEDC, WLTC, FTP72, and FTP75. Table 3 provides detailed SOC values at the end of each cycle, both with and without recovery energy, highlighting the impact of regenerative braking on energy efficiency. For the NEDC condition, although the SOC curves for both scenarios—with and without regenerative braking—appear close from 1000 s to the end of the NEDC cycle, there are still notable differences at specific comparison points. For instance, at 1100 s, the SOC is 48.5% when regenerative braking is applied, whereas it is only 48.27% without it. This indicates that the control strategy implemented in this paper performs effectively under NEDC conditions. The reason for this result could be attributed to the braking frequency and braking strength typical of the NEDC cycle, which are less frequent and intense compared to other conditions. As a result, the amount of energy recovered in this scenario is relatively lower.
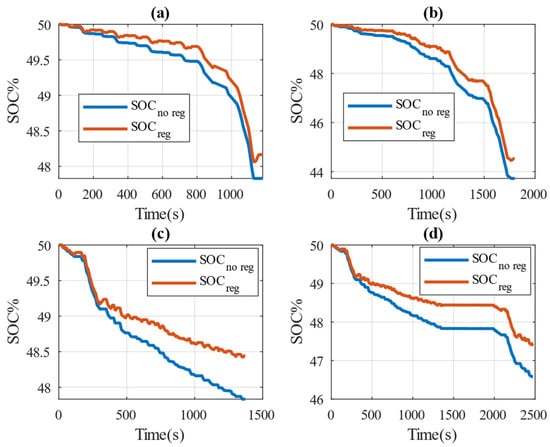
Figure 7.
SOC variation: (a) NEDC; (b) WLTP; (c) FTP72; (d) FTP75.

Table 3.
SOC comparison.
The SOC of WLTP increases from 43.72% without a regenerative braking system to 44.52% with it, a notable improvement of 0.77%. Similarly, the FTP72 cycle shows an SOC rise from 47.83% to 48.44%, a gain of 0.61%, while the FTP75 condition exhibits an SOC increase from 46.58% to 47.44%, a substantial improvement of 0.86%. These increases in SOC across different driving cycles demonstrate the effectiveness of regenerative braking in enhancing energy recovery and overall vehicle efficiency.
Regenerative braking technology effectively increases the driving range and decreases energy consumption by harnessing and recycling kinetic energy that would otherwise be wasted during braking. The consistent improvements in SOC validate the durability of their generative braking technology and its versatility in different driving circumstances. This underscores its crucial role in modern electric vehicle design, promoting sustainability and energy efficiency.
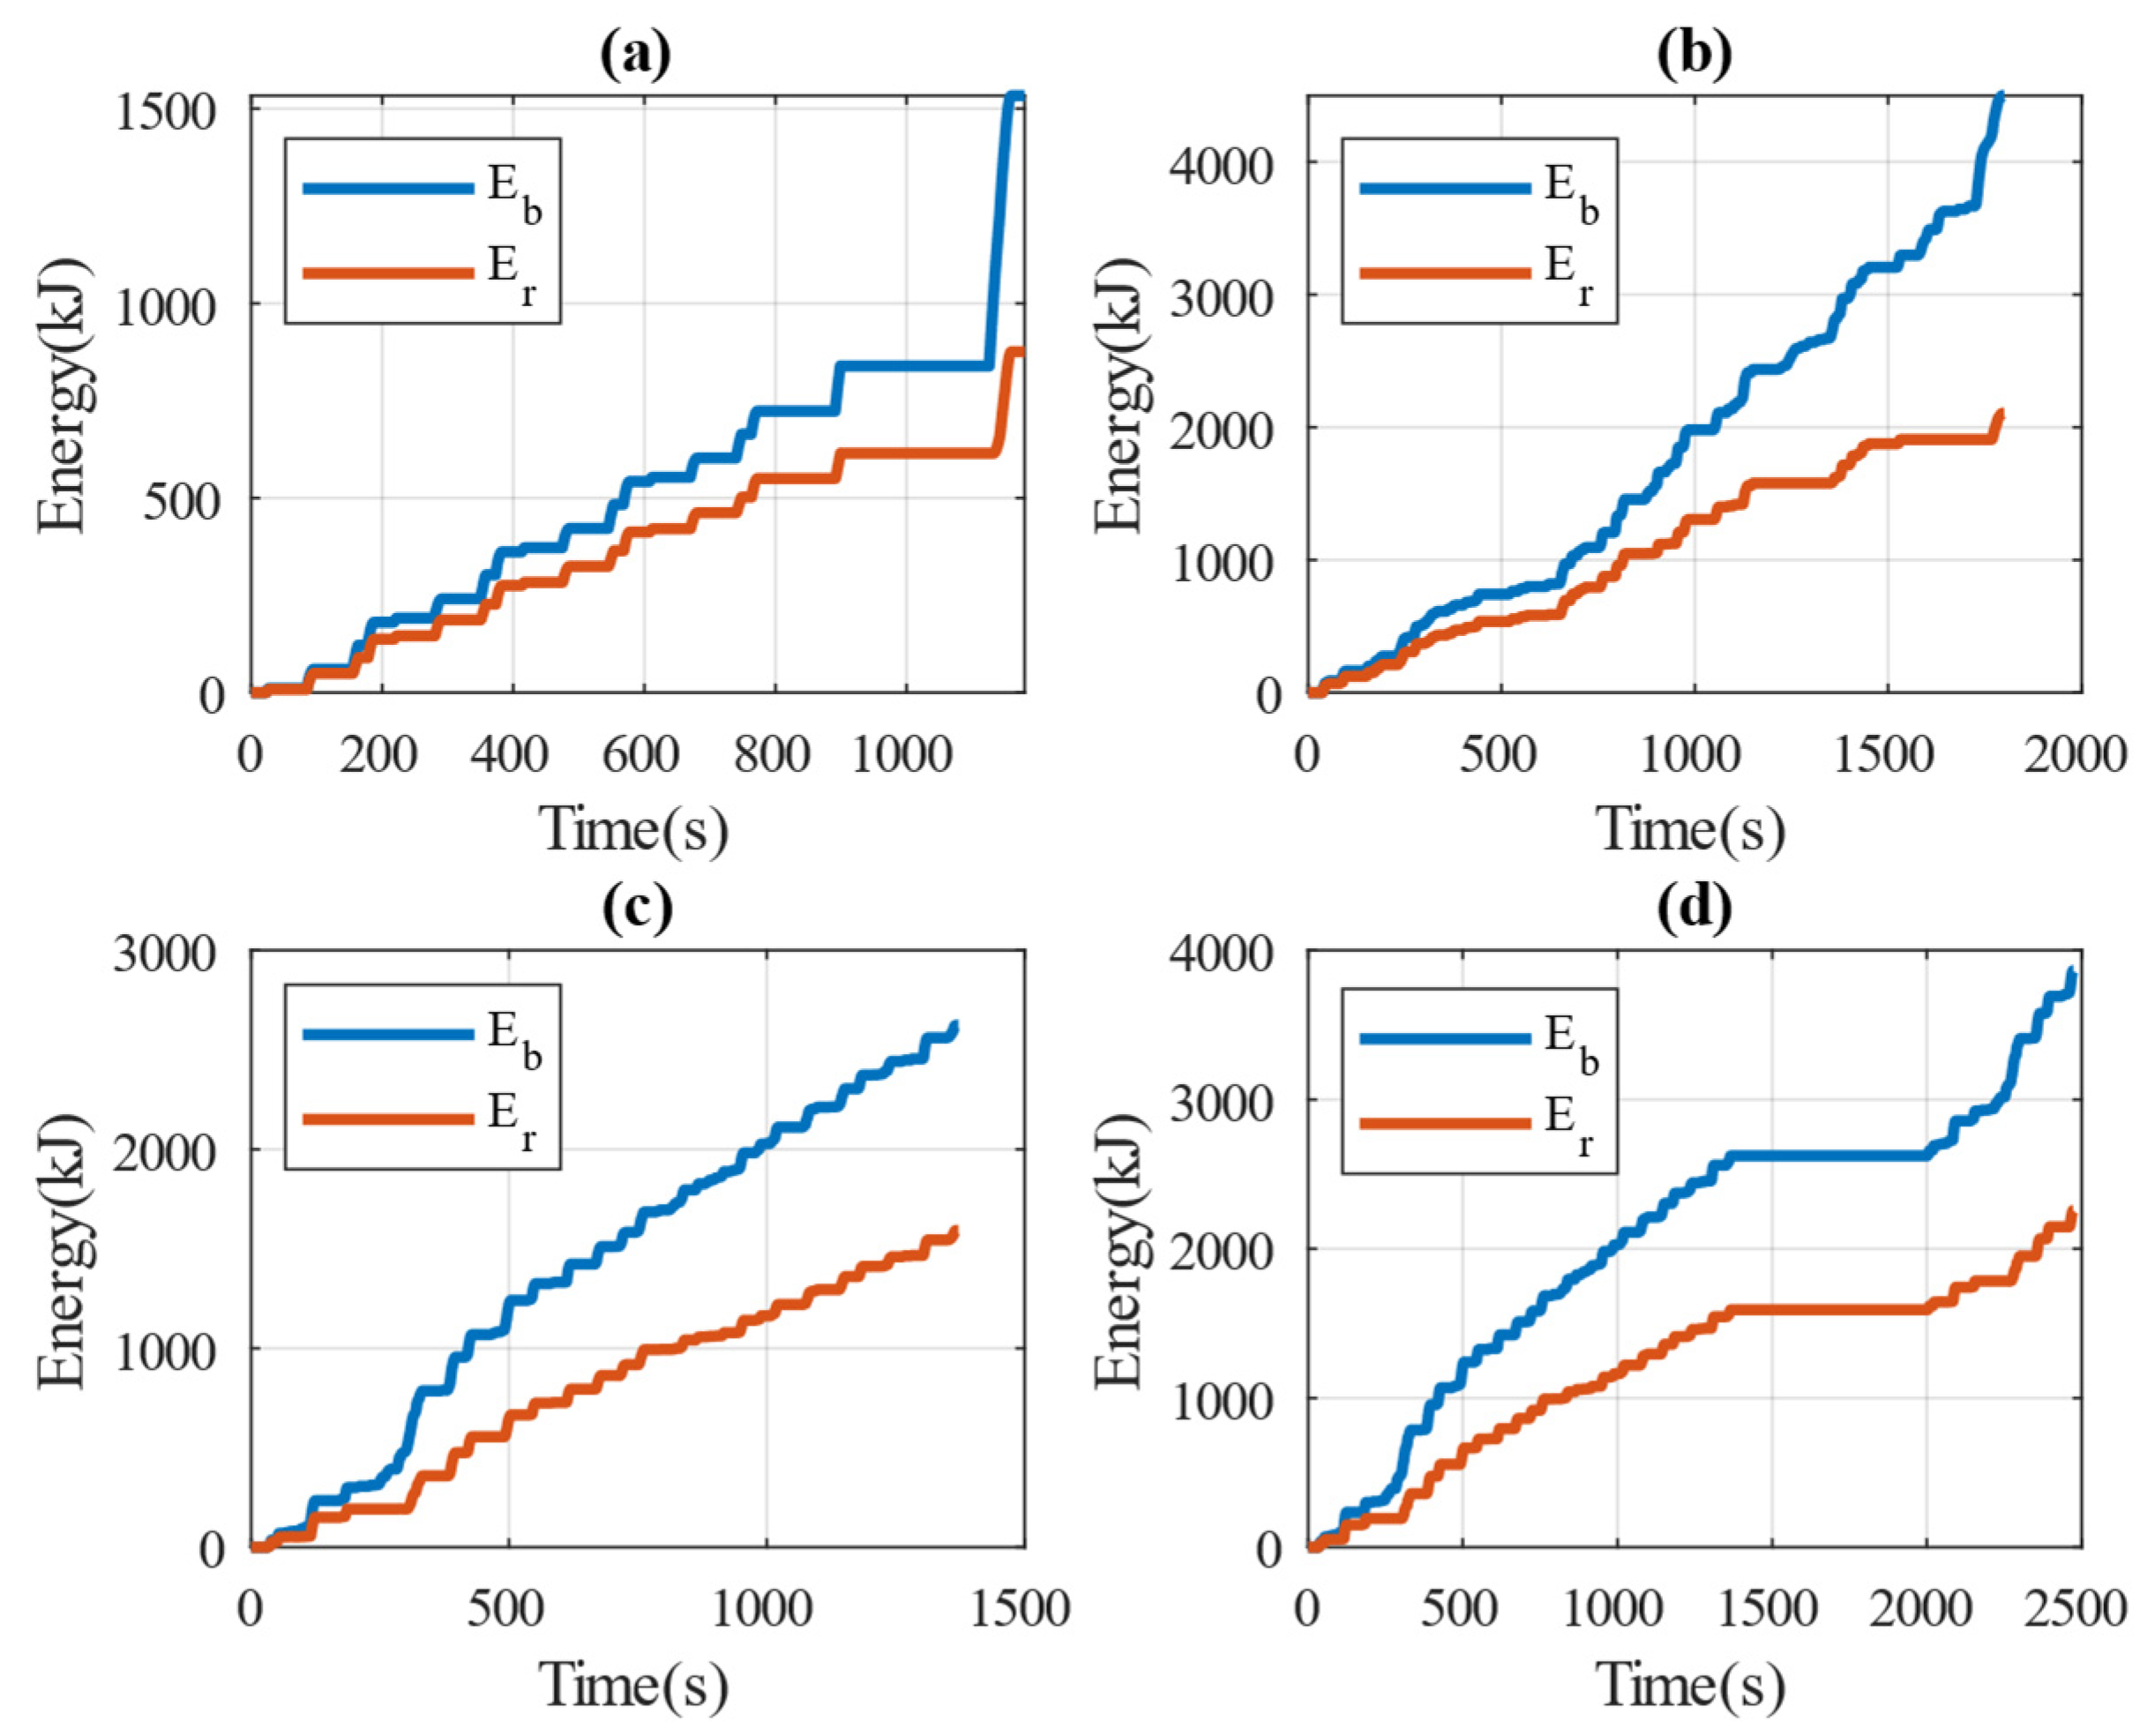
Figure 8 shows the data on energy recovery and consumption energy for four driving cycles, indicating the following: NEDC: With 875.7 kJ of energy recovery and 5337.4 kJ of energy consumption, the recovery efficiency of NEDC is 16%. While not the highest, it indicates a relatively stable energy recovery performance under moderate energy consumption conditions. WLTC: Having the highest total energy recovery (2105.37 kJ) and consumption (15,753 kJ), WLTC’s recovery efficiency is only 13%. This suggests that while the energy recovery system is active, it needs improvement to optimize efficiency under high energy consumption conditions. FTP72: With the highest recovery efficiency (35%), FTP72 shows that the energy recovery system works very effectively. The energy consumption is 4530.8 kJ with an energy recovery of 1591.56 kJ, indicating a good balance between consumption and recovery. FTP75: The recovery efficiency is 30%, which is quite high compared to other cycles. With 2256.84 kJ of energy recovery and 7401.9 kJ of energy consumption, FTP75 demonstrates effective energy recovery, second only to FTP72.
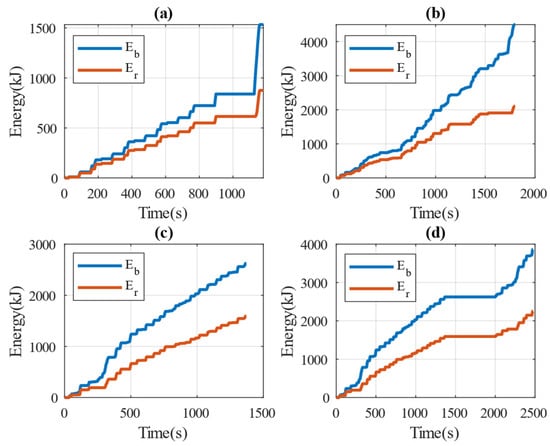
Figure 8.
Variation in total braking energy and overall energy recovery: (a) NEDC; (b) WLTP; (c) FTP72; (d) FTP75.
4.2. Comparative Simulation Results of Different Methods
This paper compares the proposed control approach with two selected braking energy recovery control systems: method A [28] and method B [29]. We compare the simulation results, using SOC and the rate of energy recovery as assessment indices to validate the control approach.
Control method A: Control is distributed between the front and rear axles in accordance with the ideal braking curve. This research applies the fuzzy control method to the distribution of braking force on the front axle.
Control method B: The system distributes the braking force between the front and rear axles similarly to this paper’s description. However, regenerative braking and hydraulic braking are distributed and transferred based on a set coefficient.
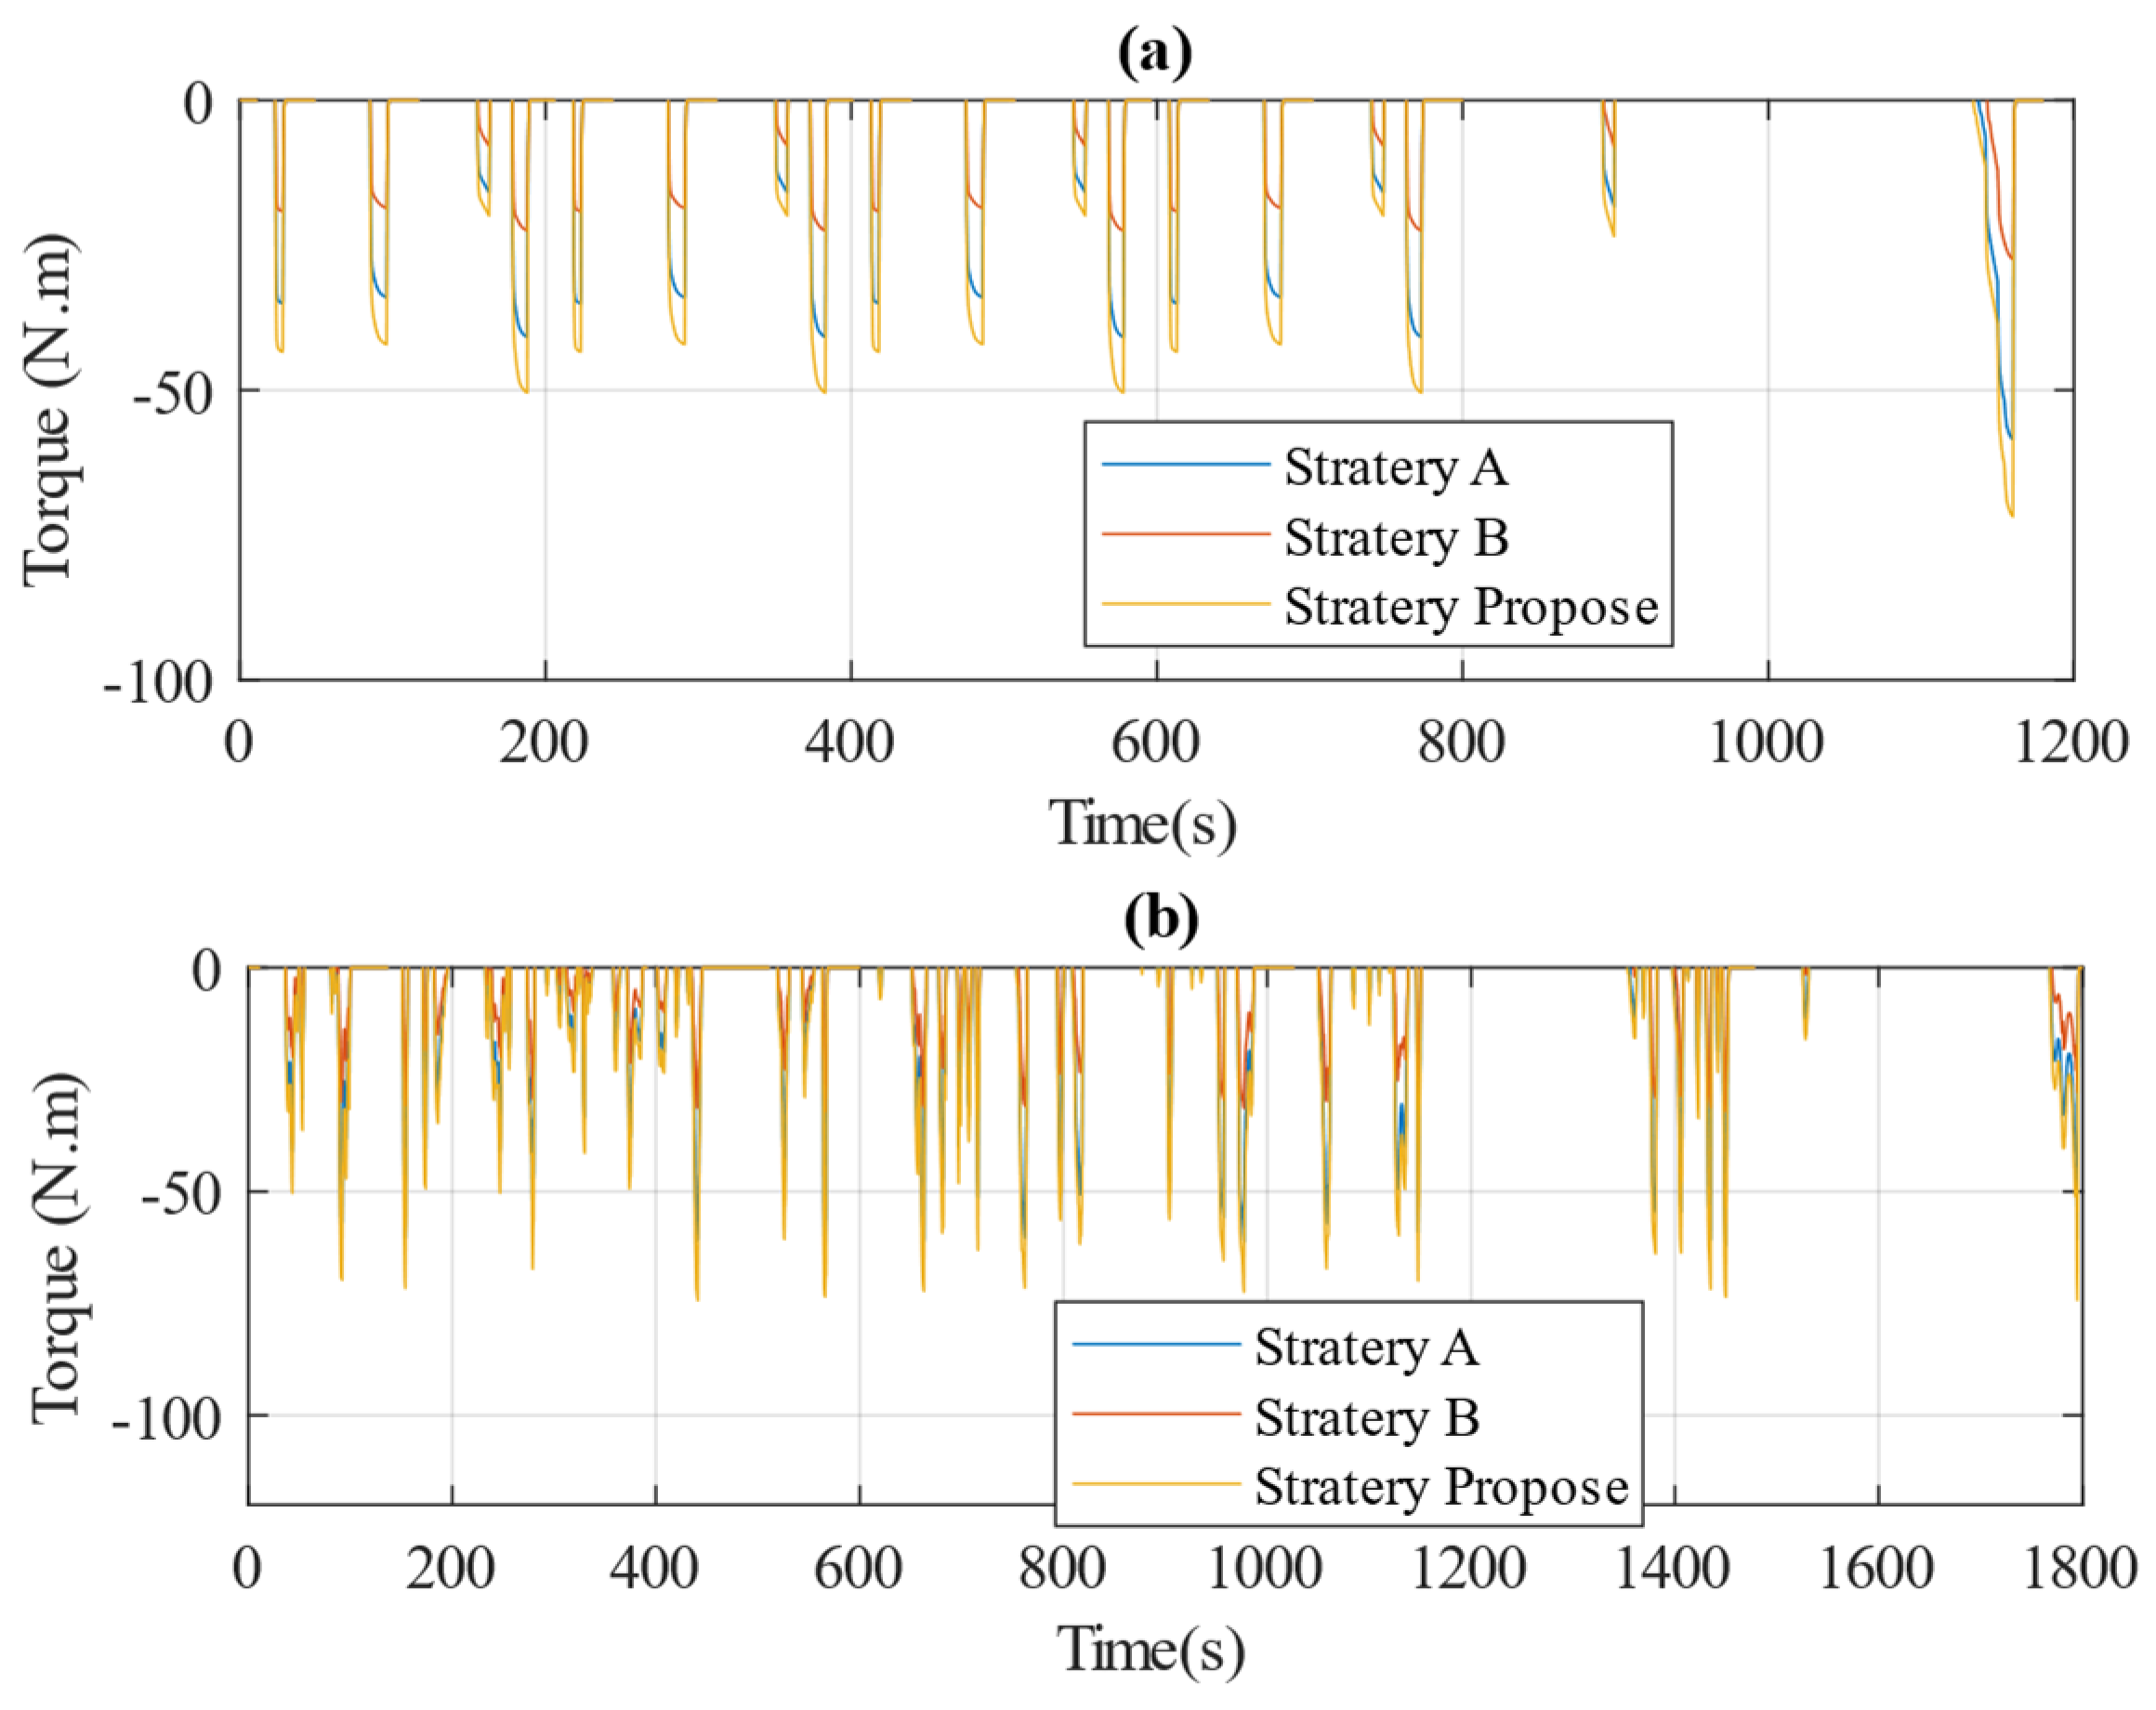
First, let us examine the regenerative brake torque of the three control strategies. Figure 9 compares these strategies during the NEDC driving cycle (chart a) and the WLTP driving cycle (chart b). Across both cycles, all three strategies—strategy A, strategy B, and the proposed strategy—show similar patterns in adjusting brake torque. However, the proposed strategy exhibits fewer fluctuations and more stable brake torque, particularly during sudden changes. The fluctuations in strategy A and strategy B seem more pronounced, potentially leading to inconsistencies in energy recovery. In contrast, “Strategy Propose” not only minimizes fluctuations but also maintains a stable level of brake torque, which could contribute to enhanced energy recovery efficiency. This improved control over brake torque may optimize the energy recovery process, leading to better overall operational efficiency. Next, we will compare the energy recovery results of these strategies.
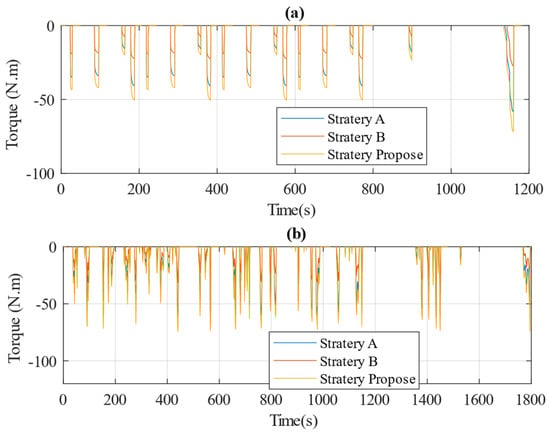
Figure 9.
Comparison of three control strategies for motor braking torque: (a) NEDC; (b) WLTP.
- (1)
- NEDC condition:
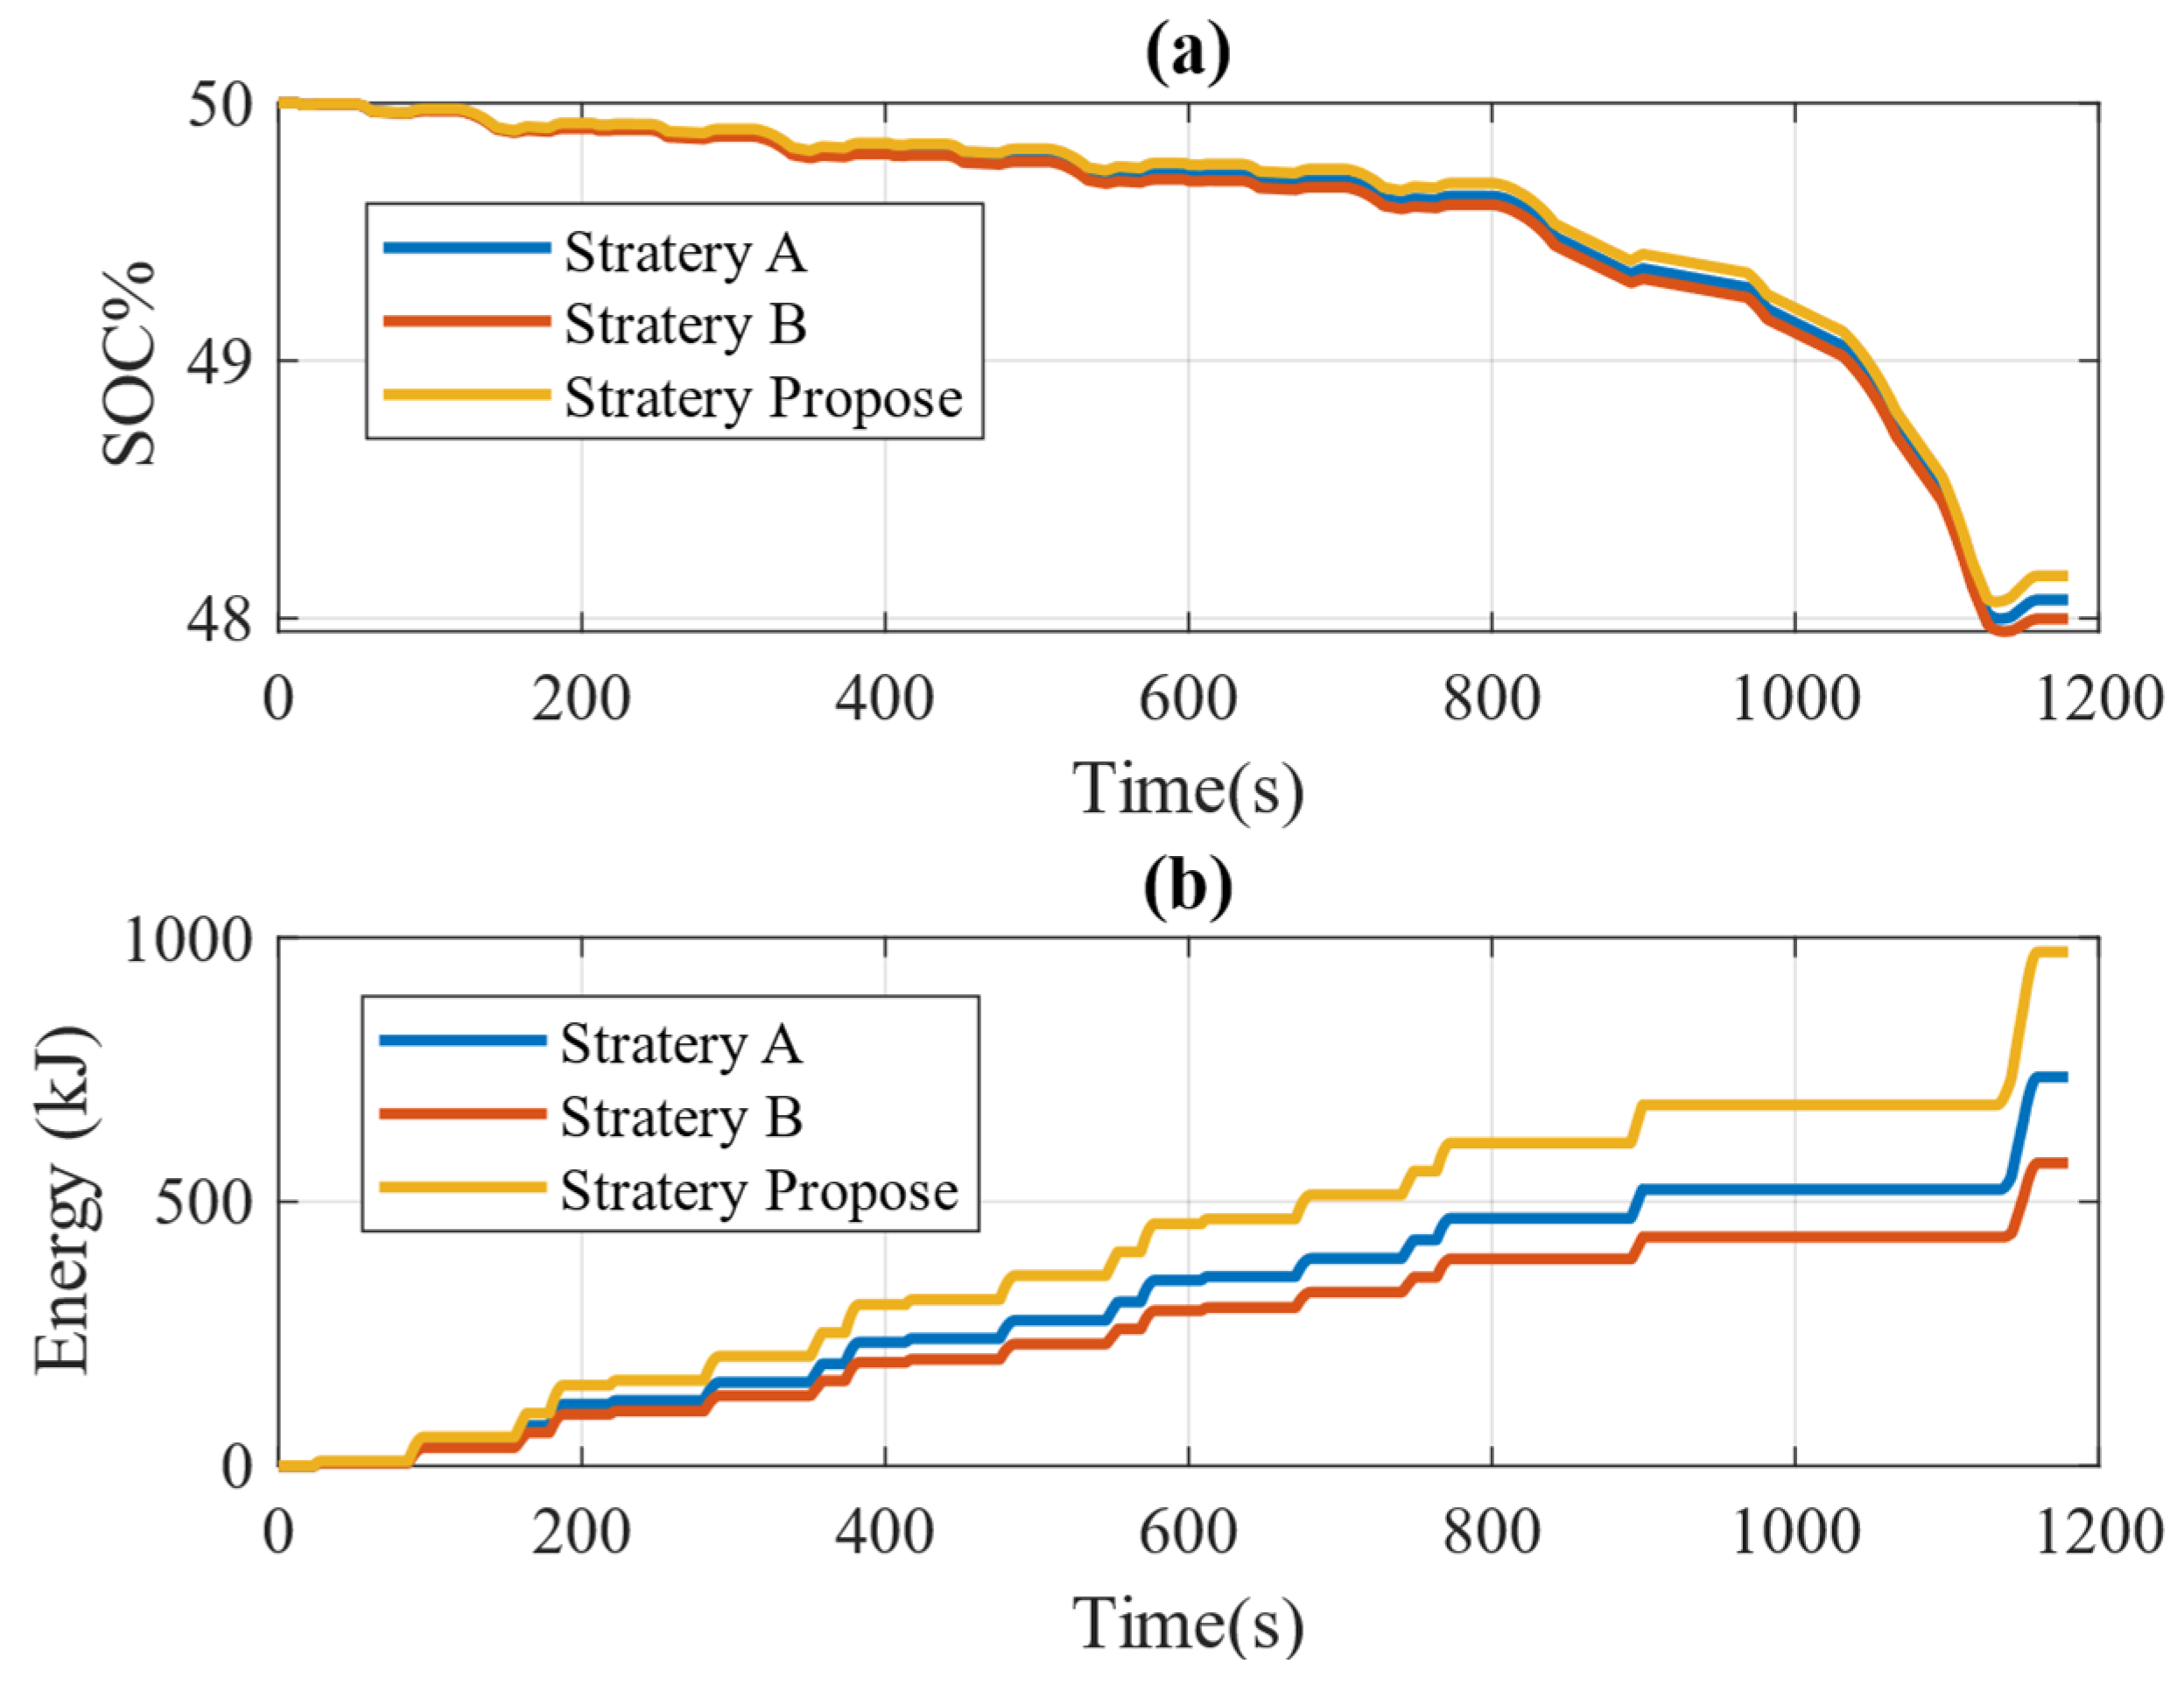
Figure 10a illustrates the initial SOC values and the values at the end of the simulation for three different control strategies in the NEDC cycle, all starting at 50%. By the end of the simulation, the SOC values are recorded as 48.16%, 48.07%, and 47.99% for the proposed strategy and control strategies A and B, respectively. The proposed strategy has the highest end SOC value at 48.16%, indicating the most effective energy recovery and utilization in NEDC conditions. Control strategy A has an end SOC of 48.07%, slightly lower than the proposed strategy but still demonstrating good performance. Control strategy B has the lowest end SOC at 47.99%, showing the least effective energy recovery among the three strategies.
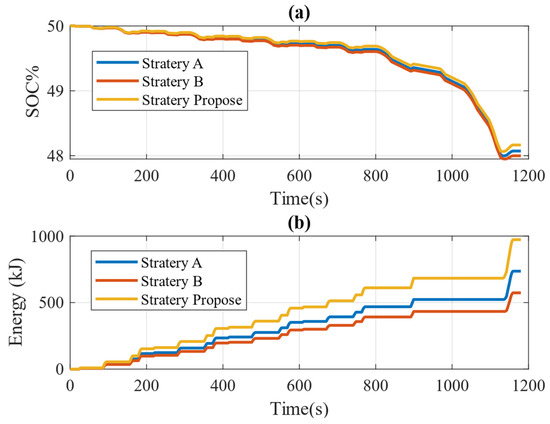
Figure 10.
Comparison of three control strategies for NEDC conditions: (a) power battery SOC; (b) energy recovery.
Figure 10b provides a comparative analysis of the energy obtained by the implementation of the three control methods specifically in the NEDC cycle. It reveals that the proposed strategy yields approximately 875.7 kJ of recovered energy, while control methods A and B recover about 662.6 kJ and 515.99 kJ, respectively. The proposed strategy achieves the highest recovered energy at 875.7 kJ, demonstrating the most effective energy recovery performance in NEDC conditions. Control method A recovers 662.6 kJ, which is significantly lower than the proposed strategy but still represents a moderate level of efficiency. Control method B has the lowest recovered energy at 515.99 kJ, indicating the least effective energy recovery among the three methods.
- (2)
- WLTC condition:
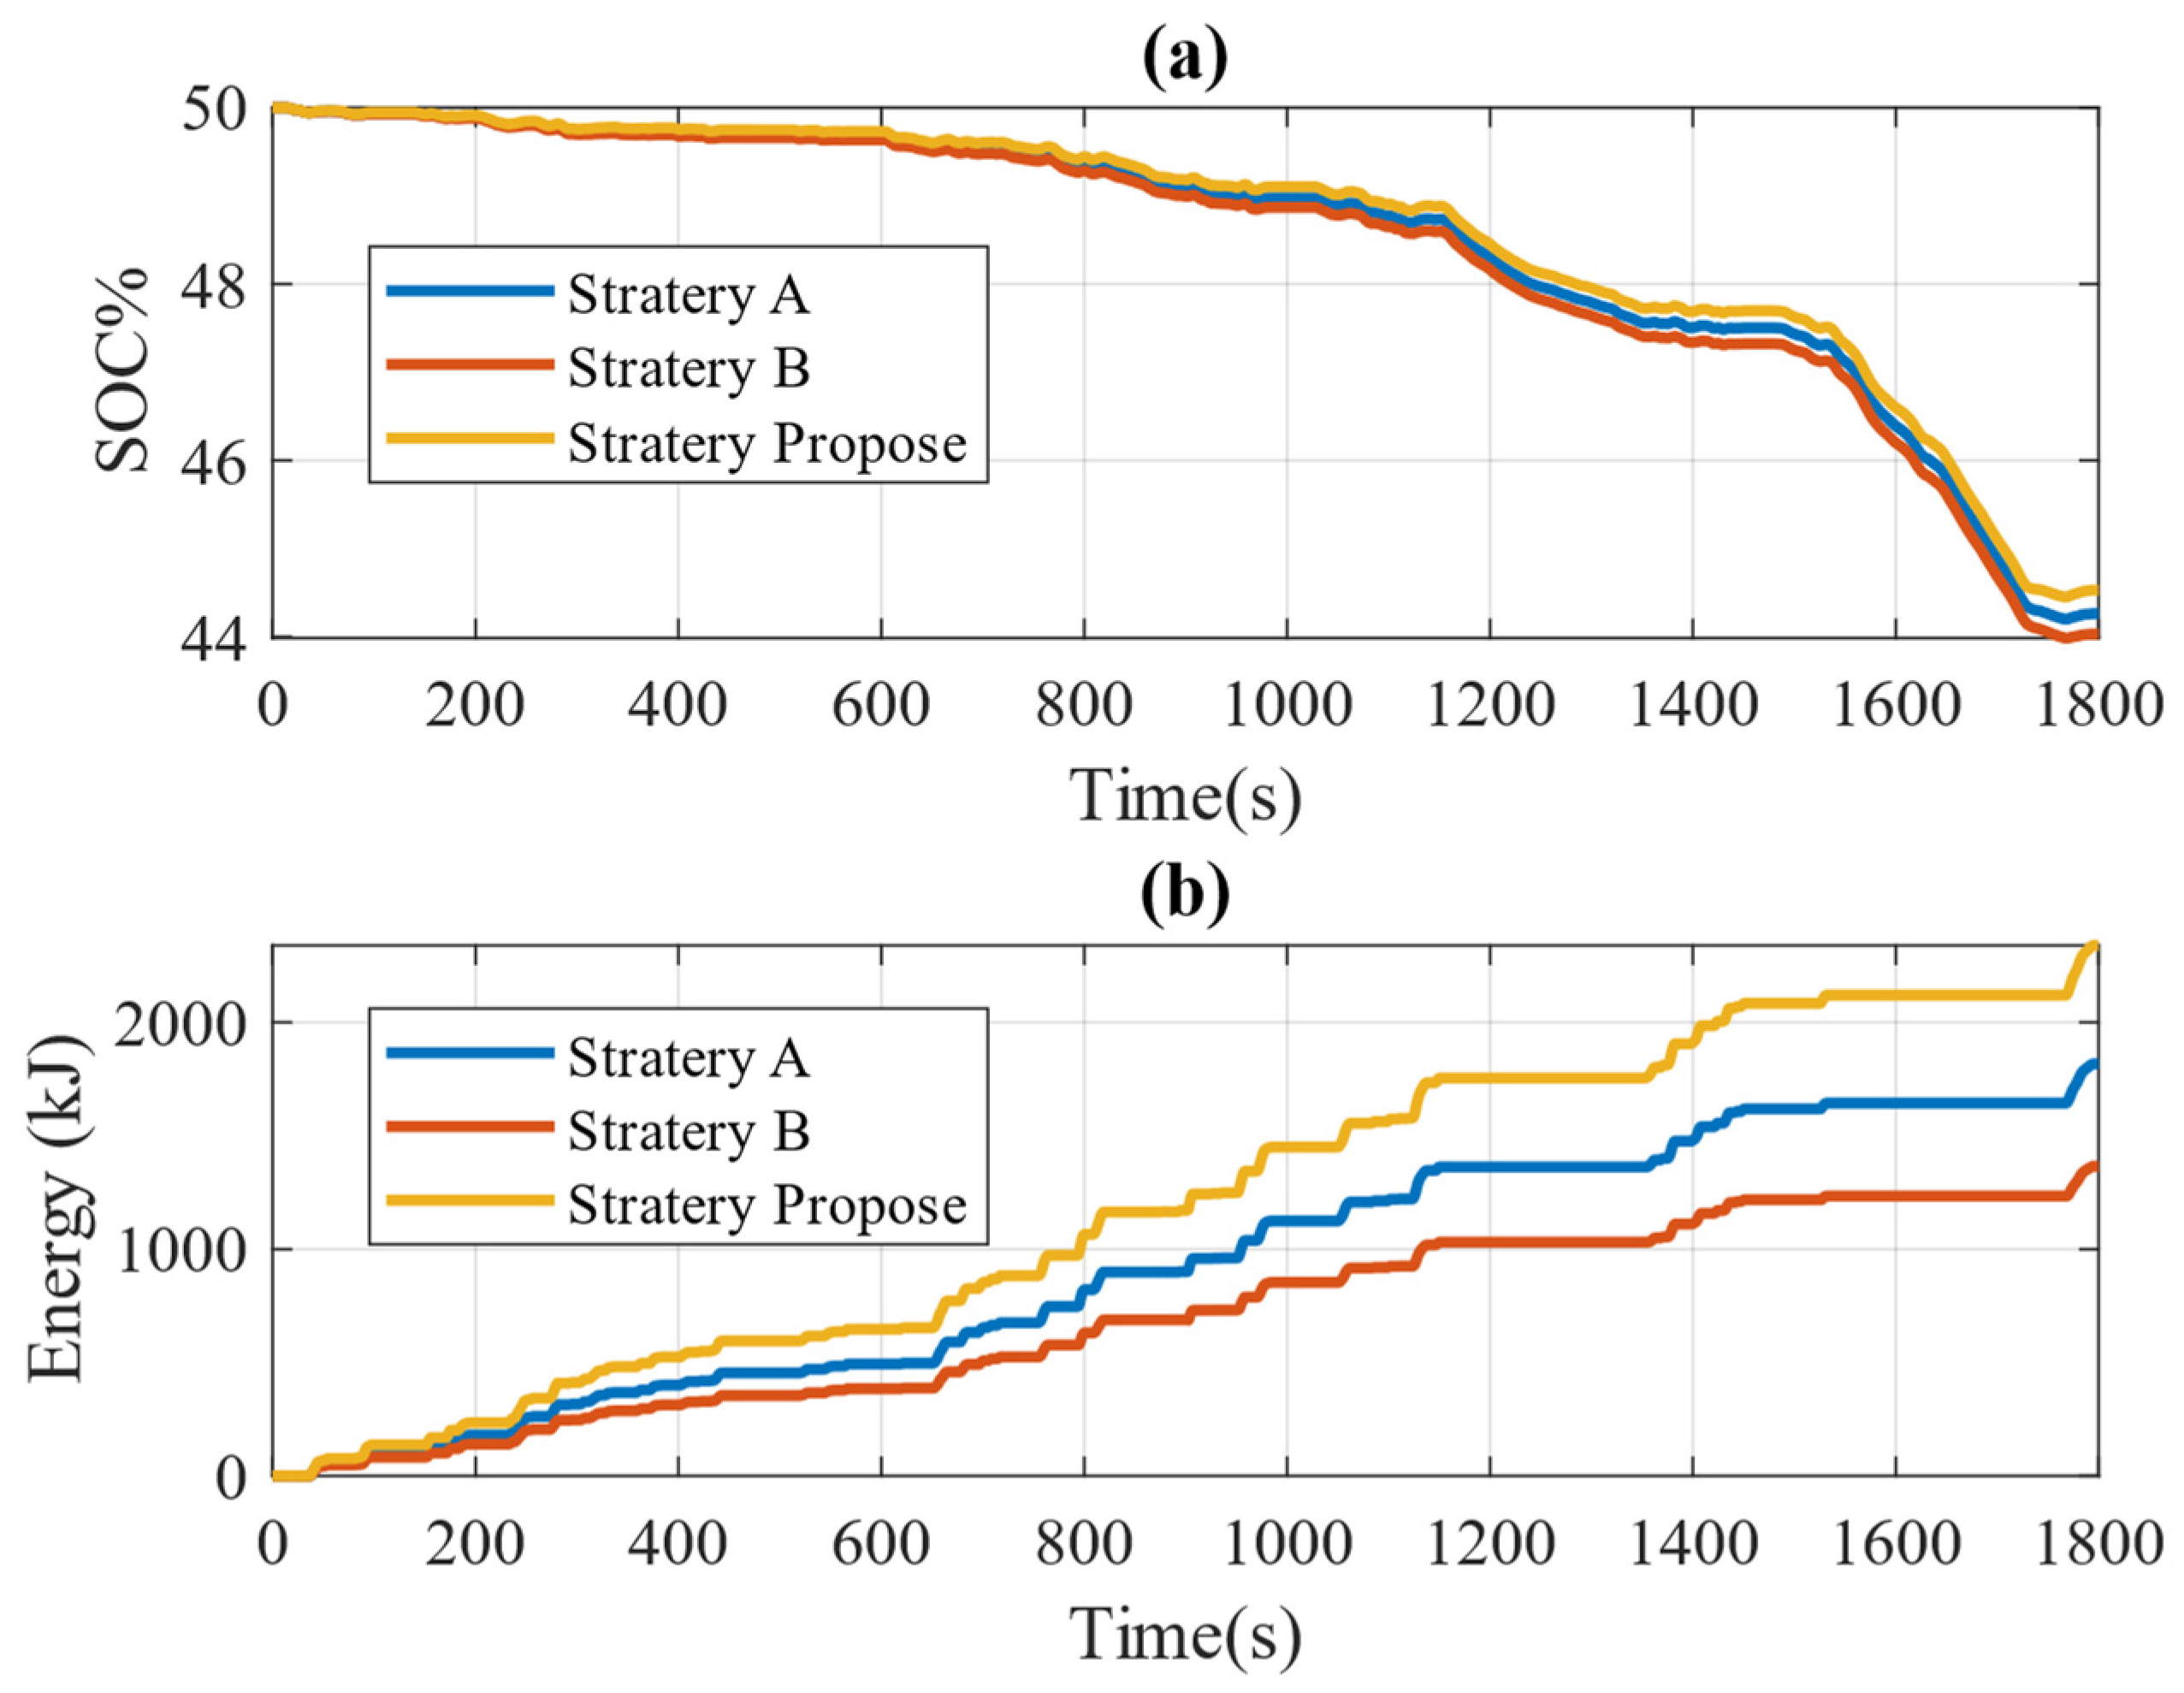
Figure 11a illustrates the analysis of the state of charge (SOC) of the power battery for three different control methods. As the car moves through the WLTP cycle, the SOC of the suggested technique reaches 44.53%, while control methods A and B achieve SOC values of 44.23% and 44.03%, respectively. The suggested technique achieves the highest SOC at 44.53%, indicating the best performance in energy recovery and utilization under the WLTP cycle conditions. Control method A reaches an SOC of 44.23%, slightly lower than the suggested technique but still demonstrating relatively good performance. Control method B has the lowest SOC at 44.03%, showing the least effective energy recovery among the three methods.
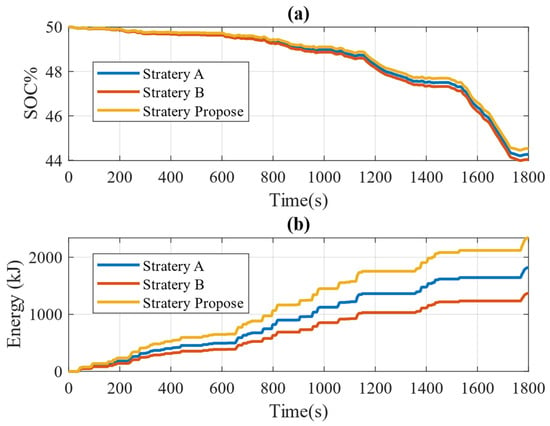
Figure 11.
Comparison of three control strategies for WLTP conditions: (a) power battery SOC; (b) energy recovery.
Figure 11b presents a comparison of the energy recovery by braking for the three control methods under WLTP conditions. The proposed strategy demonstrates an energy recovery of approximately 2105.37 kJ, while control methods A and B recover about 1635.2 kJ and 1228.75 kJ, respectively. The proposed strategy achieves the highest energy recovery at 2105.37 kJ, indicating the most effective performance in reclaiming energy through braking under WLTP conditions. Control method A recovers 1635.2 kJ, which is significantly lower than the proposed strategy but still shows a moderate level of efficiency. Control method B recovers 1228.75 kJ, indicating the least effective energy recovery among the three methods.
Under the NEDC and WLTP cycles, the suggested control technique demonstrates superior performance in maintaining a higher SOC and energy recovery compared to control methods A and B. This indicates that the suggested technique is more efficient in recovering and utilizing energy in two driving conditions. Control method A, while slightly less efficient than the suggested technique, still performs better than control method B, which shows the lowest efficiency. These results highlight the effectiveness of the suggested technique in optimizing SOC and improving energy recovery in two cycles. This is significant as the NEDC and WLTP cycles provide a comprehensive assessment of a vehicle’s energy performance under more realistic driving conditions.
Table 4 presents the evaluation of the recuperation of braking energy impacts of three control techniques under NEDC and WLTC circumstances. Under NEDC conditions, the control approach outlined in this thesis resulted in a total vehicle energy consumption of 5337.4 kJ, with 1533.4 kJ of energy generated through braking and 875.7 kJ of energy recovered during braking. Consequently, the vehicle achieved an impressive 16.4% rate of recovering energy through effective braking. This is a significant improvement compared to control methods A and B, which only saw increases of 4.3% and 7.6%, respectively. Additionally, the recovery rate of braking energy reached an impressive 57.1%, showing a substantial gain of 13.9% and 23.5%, respectively. Furthermore, under the WLTC scenario, the vehicle’s overall energy consumption amounted to 15,753 kJ, with 4498.7 kJ created through braking and 2105.37 kJ recovered through braking. Thus, the vehicle’s brake energy recovery rate reached 13.36%, representing an increase of 3.36% and 6.29% compared to control techniques A and B, respectively. The recuperation efficiency of braking energy reached 46.8%, which experienced a respective rise of 10.5% and 19.5% through comparison.

Table 4.
Comparison of braking energy recovery.
5. Conclusions
This paper proposes a two-step control approach for recovering braking energy in electric vehicles. The first step involves evenly distributing the braking force between the front and rear wheels according to different braking modes classified by braking intensity. This ensures that the vehicle maintains stability and safety under various driving conditions. A regulation plan for braking force distribution is developed for each braking mode, ensuring that the distribution adheres to braking requirements and optimizes energy recovery.
The second step involves redistributing the braking force of the front axle. This is achieved using a fuzzy logic controller designed to coordinate the regenerative and hydraulic braking systems. The fuzzy control takes into account multiple parameters, including vehicle speed, braking intensity, SOC, and the percentage of electric braking. By dynamically adjusting the distribution of regenerative and hydraulic braking forces, the system ensures optimal energy recovery while maintaining braking performance. A study shows that this method significantly improves energy recovery efficiency in electric vehicles. Specifically, it achieves an increase of 13% under the conditions of the New European Driving Cycle (NEDC) and the Worldwide Harmonized Light Vehicles Test Procedure (WLTP). Additionally, the efficiency of energy recuperation under FTP72 and FTP75 conditions has been demonstrated to reach 30%.
When compared to existing control methods (referred to as methods A and B in this study), the proposed approach shows notable enhancements. Specifically, the battery SOC increased by up to 0.5%, and the energy recovery rate improved by up to 23.5%. These improvements highlight the effectiveness of the proposed control strategy in enhancing the energy efficiency of electric vehicles. Research demonstrates significant potential for energy recovery and improving vehicle energy efficiency while meeting braking requirements. The proposed two-step control approach offers a robust solution for maximizing energy recovery in electric vehicles, contributing to the development of more efficient and sustainable transportation. This study provides a valuable reference for researchers and automotive companies focused on developing advanced energy recovery systems.
Author Contributions
N.T.A.: Writing, Software, Writing—original draft, Investigation. C.-K.C.: Supervision, Conceptualization and Editing. X.L.: Reviewing. All authors have read and agreed to the published version of the manuscript.
Funding
This research received no external funding.
Data Availability Statement
The data presented in this study are available on request from the corresponding author.
Conflicts of Interest
The authors declare no conflicts of interest.
References
- U.S. Global Warming Gas Emissions By Economic Sector. Available online: https://www.global-impact-association.org/ (accessed on 12 June 2024).
- Eckert, J.J.; Barbosa, T.P.; da Silva, S.F.; Silva, F.L.; Silva, L.C.; Dedini, F.G. Electric hydraulic hybrid vehicle powertrain design and optimization-based power distribution control to extend driving range and battery life cycle. Energy Convers. Manag. 2022, 252, 115094. [Google Scholar] [CrossRef]
- Wang, C.; Zhao, W.; Li, W. Braking sense consistency strategy of electro-hydraulic composite braking system. Mech. Syst. Signal Process. 2018, 109, 196–219. [Google Scholar] [CrossRef]
- Ko, J.W.; Ko, S.Y.; Kim, I.S.; Hyun, D.Y.; Kim, H.S. Co-operative control for regenerative braking and friction braking to increase energy recovery without wheel lock. Int. J. Automot. Technol. 2014, 15, 253–262. [Google Scholar] [CrossRef]
- De Pinto, S.; Camocardi, P.; Chatzikomis, C.; Sorniotti, A.; Bottiglione, F.; Mantriota, G.; Perlo, P. On the comparison of 2-and 4-wheel-drive electric vehicle layouts with central motors and single-and 2-speed transmission systems. Energies 2021, 13, 3328. [Google Scholar] [CrossRef]
- Ju, J.; Li, W.; Liu, Y.; Zhang, C. Research on bifurcation and control of electromechanical coupling torsional vibration for wheel-side direct-driven transmission system. Proc. Inst. Mech. Eng. Part D J. Automob. Eng. 2020, 235, 93–104. [Google Scholar] [CrossRef]
- Deepak, K.; Frikha, M.A.; Benômar, Y.; El Baghdadi, M.; Hegazy, O. In-wheel motor drive systems for electric vehicles: State of the art, challenges, and future trends. Energies 2023, 16, 3121. [Google Scholar] [CrossRef]
- Strohmaier, K.G.; Cronk, P.M.; Van de Ven, J.D. Design optimization of a hydraulic flywheel accumulator for a hydraulic hybrid vehicle. Int. J. Fluid Power 2015, 16, 149–162. [Google Scholar] [CrossRef]
- Raman, S.R.; Cheng, K.-W.; Xue, X.-D.; Fong, Y.-C.; Cheung, S. Hybrid energy storage system with vehicle body integrated super-capacitor and li-ion battery: Model, design and implementation, for distributed energy storage. Energies 2021, 14, 6553. [Google Scholar] [CrossRef]
- Garcia, F.; Ferreira, A.; Pomilio, J. Control strategy for battery-ultracapacitor hybrid energy storage system. In Proceedings of the 2009 Twenty-Fourth Annual IEEE Applied Power Electronics Conference and Exposition, Washington, DC, USA, 15–19 February 2009; pp. 826–832. [Google Scholar]
- Liang, J.; Feng, J.; Fang, Z.; Lu, Y.; Yin, G.; Mao, X.; Wu, J.; Wang, F. An energy-oriented torque-vector control framework for distributed drive electric vehicles. IEEE Trans. Transp. Electrif. 2023, 9, 4014–4031. [Google Scholar] [CrossRef]
- Berzi, L.; Delichristov, D.; Favilli, T.; Pierini, M.; Ponchant, M.; Qehajaj, A.; Pugi, L. Smart energy management of auxiliary load for electric vehicles. In Proceedings of the 2020 IEEE International Conference on Environment and Electrical Engineering and 2020 IEEE Industrial and Commercial Power Systems Europe (EEEIC/I&CPS Europe), Madrid, Spain, 9–12 June 2020; pp. 1–6. [Google Scholar]
- Wen, H.H.; Chen, W.; Hui, J. A single-pedal regenerative braking control strategy of accelerator pedal for electric vehicles based on adaptive fuzzy control algorithm. Energy Procedia 2018, 152, 624–629. [Google Scholar] [CrossRef]
- Pugi, L.; Favilli, T.; Berzi, L.; Locorotondo, E.; Pierini, M. Brake blending and torque vectoring of road electric vehicles: A flexible approach based on smart torque allocation. Int. J. Electr. Hybrid Veh. 2020, 12, 87. [Google Scholar] [CrossRef]
- Qiu, C.; Wang, G.; Meng, M.; Shen, Y. A novel control strategy of regenerative braking system for electric vehicles under safety critical driving situations. Energy 2018, 149, 329–340. [Google Scholar] [CrossRef]
- Wu, Y.; Shu, M.; Ge, H. Research on brake force distribution control strategy of electric vehicle subtitle as needed. IOP Conf. Series Mater. Sci. Eng. 2018, 452, 032054. [Google Scholar] [CrossRef]
- Xin, Y.; Zhang, T.; Zhang, H.; Zhao, Q.; Zheng, J.; Wang, C. Fuzzy logic optimization of composite brake control strategy for load-isolated electric bus. Math. Probl. Eng. 2019, 2019, 1–14. [Google Scholar] [CrossRef]
- U.S. Department of Energy. 2013 Nissan Leaf Advanced Vehicle Testing—Baseline Testing Results; United States Department of Energy: Washington, DC, USA, 2014.
- Zhou, J.; Sun, J.; He, L.; Ding, Y.; Cao, H.; Zhao, W. Control oriented prediction of driver brake intention and intensity using a composite machine learning approach. Energies 2019, 12, 2483. [Google Scholar] [CrossRef]
- Ehsani, M.; Gao, Y.; Longo, S.; Ebrahimi, K. Modern Electric, Hybrid Electric, and Fuel Cell Vehicles; CRC Press: Boca Raton, FL, USA, 2018. [Google Scholar]
- Itani, K.; de Bernardinis, A.; Khatir, Z.; Jammal, A. Comparison between Two Braking Control Methods Integrating Energy Recovery for a Two G wheel Front Driven Electric Vehicle. Energy Convers. Manag. 2016, 122, 330–343. [Google Scholar] [CrossRef]
- Ali, O.A.M.; Ali, A.Y.; Sumait, B.S. Comparison between the effects of different types of membership functions on fuzzy logic controller performance. Int. J. 2015, 76, 76–83. [Google Scholar]
- Vodovozov, V.; Raud, Z.; Petlenkov, E. Review on braking energy management in electric vehicles. Energies 2021, 14, 4477. [Google Scholar] [CrossRef]
- Bezak, N.; Brilly, M.; Šraj, M. Comparison between the peaks-over-threshold method and the annual maximum method for flood frequency analysis. Hydrol. Sci. J. 2014, 59, 959–977. [Google Scholar] [CrossRef]
- Liu, X. Parameterized defuzzification with maximum entropy weighting function—Another view of the weighting function expectation method. Math. Comput. Model. 2007, 45, 177–188. [Google Scholar] [CrossRef]
- Yin, Z.; Ma, X.; Su, R.; Huang, Z.; Zhang, C. Regenerative braking of electric vehicles based on fuzzy control strategy. Processes 2023, 11, 2985. [Google Scholar] [CrossRef]
- Geng, C.; Ning, D.; Guo, L.; Xue, Q.; Mei, S. Simulation research on regenerative braking control strategy of hybrid electric vehicle. Energies 2021, 14, 2202. [Google Scholar] [CrossRef]
- Xu, G.; Li, W.; Xu, K.; Song, Z. An intelligent regenerative braking strategy for electric vehicles. Energies 2011, 4, 1461–1477. [Google Scholar] [CrossRef]
- Guo, J.; Wang, J.; Cao, B. Regenerative braking strategy for electric vehicles. In Proceedings of the 2009 IEEE Intelligent Vehicles Symposium, Xi’an, China, 3–5 June 2009; pp. 864–868. [Google Scholar]
Disclaimer/Publisher’s Note: The statements, opinions and data contained in all publications are solely those of the individual author(s) and contributor(s) and not of MDPI and/or the editor(s). MDPI and/or the editor(s) disclaim responsibility for any injury to people or property resulting from any ideas, methods, instructions or products referred to in the content. |
© 2024 by the authors. Licensee MDPI, Basel, Switzerland. This article is an open access article distributed under the terms and conditions of the Creative Commons Attribution (CC BY) license (https://creativecommons.org/licenses/by/4.0/).

