Abstract
Nearly 3700 people are killed in broadside collisions in the U.S. every year. To reduce broadside collisions, we created and tested the CornerGuard, a prototype system that senses around a corner to alert a car driver of an impending collision with a pedestrian or automobile that is not in the line of sight (LOS). The CornerGuard leverages a microwave-transceiving radar sensor mounted on the car and a curved radio wave reflector installed at the corner to sense around the corner and detect a broadside collision threat. The car’s speed is constantly read by an onboard diagnostics (OBD) system to allow the sensor to differentiate between static objects and objects approaching around the corner. Field testing demonstrated that the CornerGuard can effectively and consistently detect threats at a consistent range without blind spots under broad weather conditions. Our proof of concept study shows that the CornerGuard can be enhanced to be readily integrated into automobile construction and street infrastructure.
1. Introduction
In the summer of 2023, three children in North Texas were fatally hit by cars. Nearly 3700 people are killed in broadside collisions in the U.S. every year, a rate equivalent to one person every two and a half hours [1]. Across the world, traffic accidents cause serious health problems; nearly 1.35 million people are killed or disabled in traffic accidents every year [2]. The two largest factors that constitute over 90% of all broadside collisions, which occur everywhere from neighborhoods to city streets and involve pedestrians and other automobiles, are driver distraction and a limited field of view for the driver [1].
To prevent broadside collisions, we built the CornerGuard, a prototype system that can sense around a corner on the right to detect a collision threat that is not in the driver’s line of sight (LOS) because of the visual obstruction by the corner. We consider only a right corner because a left corner is further away from the driver’s side with a larger field of view for the driver. We combined a transceiving Doppler radar sensor mounted on a moving car and a stationary radar wave reflector installed at a street corner to detect impending pedestrian and automobile broadside collisions. The novelty of this work includes (1) the implementation of a stationary radar wave reflector and (2) a method to distinguish an approaching target around a corner from surrounding stationary objects.
Doppler radars are widely used in various civilian and military applications to detect and track moving objects in the line of sight (LOS). In [3], a model-free approach was presented for directly detecting and tracking moving objects in street scenes from point clouds obtained via a Doppler LiDAR. This approach can collect spatial information and Doppler images by using Doppler-shifted frequencies. Two types of Doppler LiDAR were used: a static terrestrial Doppler LiDAR and a mobile Doppler LiDAR. The static terrestrial Doppler LiDAR could achieve a maximum scanning range of 1 km with a scanning frequency of 5 Hz and a scanning angle of . The mobile Doppler LiDAR could scan a maximum range of 400 m with the horizontal scanning angle of . In [4], a microwave radar sensor mounted on a moving robot was used to provide Doppler information, which could be extracted and interpreted to obtain the velocities of both the detected objects and the robot itself. As pointed out in [4], the detection and tracking of moving objects in an outdoor environment by a mobile robot is a difficult task because of the wide variety of dynamic objects and the difficulty of separating moving objects from stationary objects.
Conventional imaging, vision, and detection systems require a direct LOS of the scene of interest. However, in many applications, obtaining a direct LOS may be unsafe, challenging, or even impossible. The concept of seeing around obstacles has been a popular topic in science fiction for years. There are two main ideas for detecting objects that are not in the LOS: through-wall techniques and reflective-surface techniques.
In [5], ultra-wideband (UWB) radar operating at the L-band (1–2 GHz) with a minimum bandwidth of 500 MHz, or a fractional bandwidth of at least 20%, was used to directly sense stationary human targets behind a wall. The detection distances range from 6.5 ft to 7.5 ft in the experiments with different wall materials and thicknesses. The detection would fail in the case of a thick concrete wall. In [6], a microwave Doppler radar sensor in the S-band (2–4 GHz) was used to detect humans behind visually opaque structures, such as building walls. The distance between the radar and the target was 3 m. We initially considered a through-wall radar (TWR) detection approach. However, through-wall detection requires a very strong radar signal and suffers from the limitations of large noises and low ranges. In contrast to through-wall techniques, the CornerGuard system proposed in this paper employs a reflective surface, which greatly improves the detection range for real traffic scenarios and simplifies the detection algorithm and implementation.
Many imaging techniques use reflective surfaces to detect objects hidden behind occluding structures [7,8,9,10]. In [10], a three-dimensional image of a scene hidden behind an occluding structure was reconstructed from an ordinary photograph of a matte LOS surface illuminated by the hidden scene. Such direct-vision-based detection methods usually require good lighting and weather conditions and sophisticated computer vision algorithms. In [11], measurements of objects moving around intersections in a realistic scene were made using a static radar operating at X-band (8–12 GHz), and radar waves returned after one or two wall reflections were processed to identify the target. In [12], a radio frequency (RF)-based method was proposed to provide accurate around-corner indoor localization through a novel encoding of how RF signals bounce off walls and occlusions. The encoding is fed to a neural network along with the radio signals to localize people around corners.
In contrast to many above-mentioned methods, the CornerGuard system proposed in this paper has the following advantages: (1) It is a very simple solution that does not require sophisticated detection algorithms. (2) It can achieve a sufficient detection range for real traffic scenarios. (3) It has low latency for punctuality. (4) It is consistent even in darkness and broad weather conditions. (5) It can be easily implemented in a current vehicle. (6) It is cost-friendly.
2. Materials and Methods
In this section, we detail the detection methodology, including its underlying theory and practical implementation.
2.1. System Overview
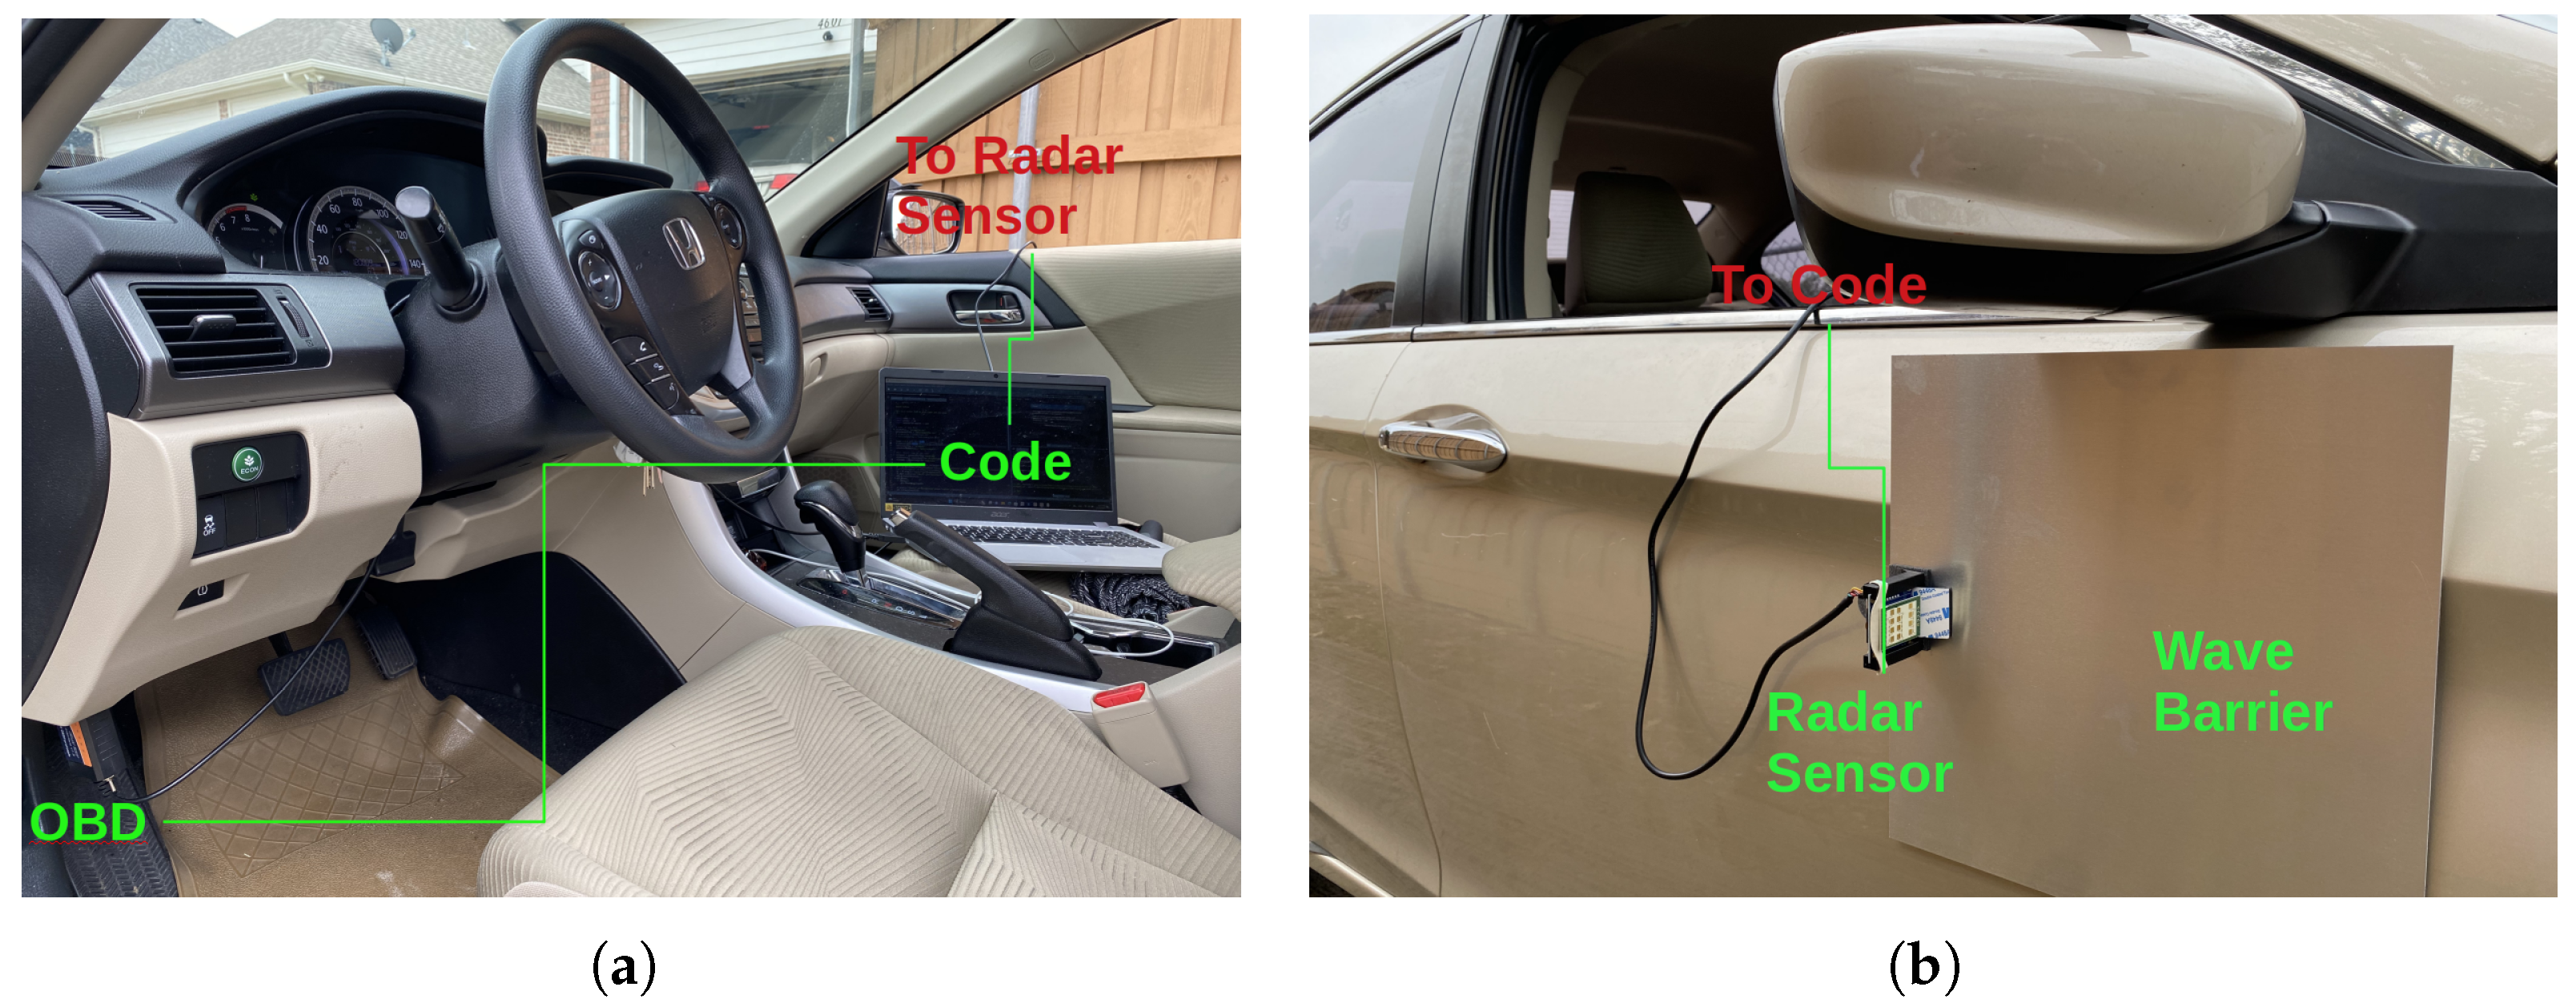
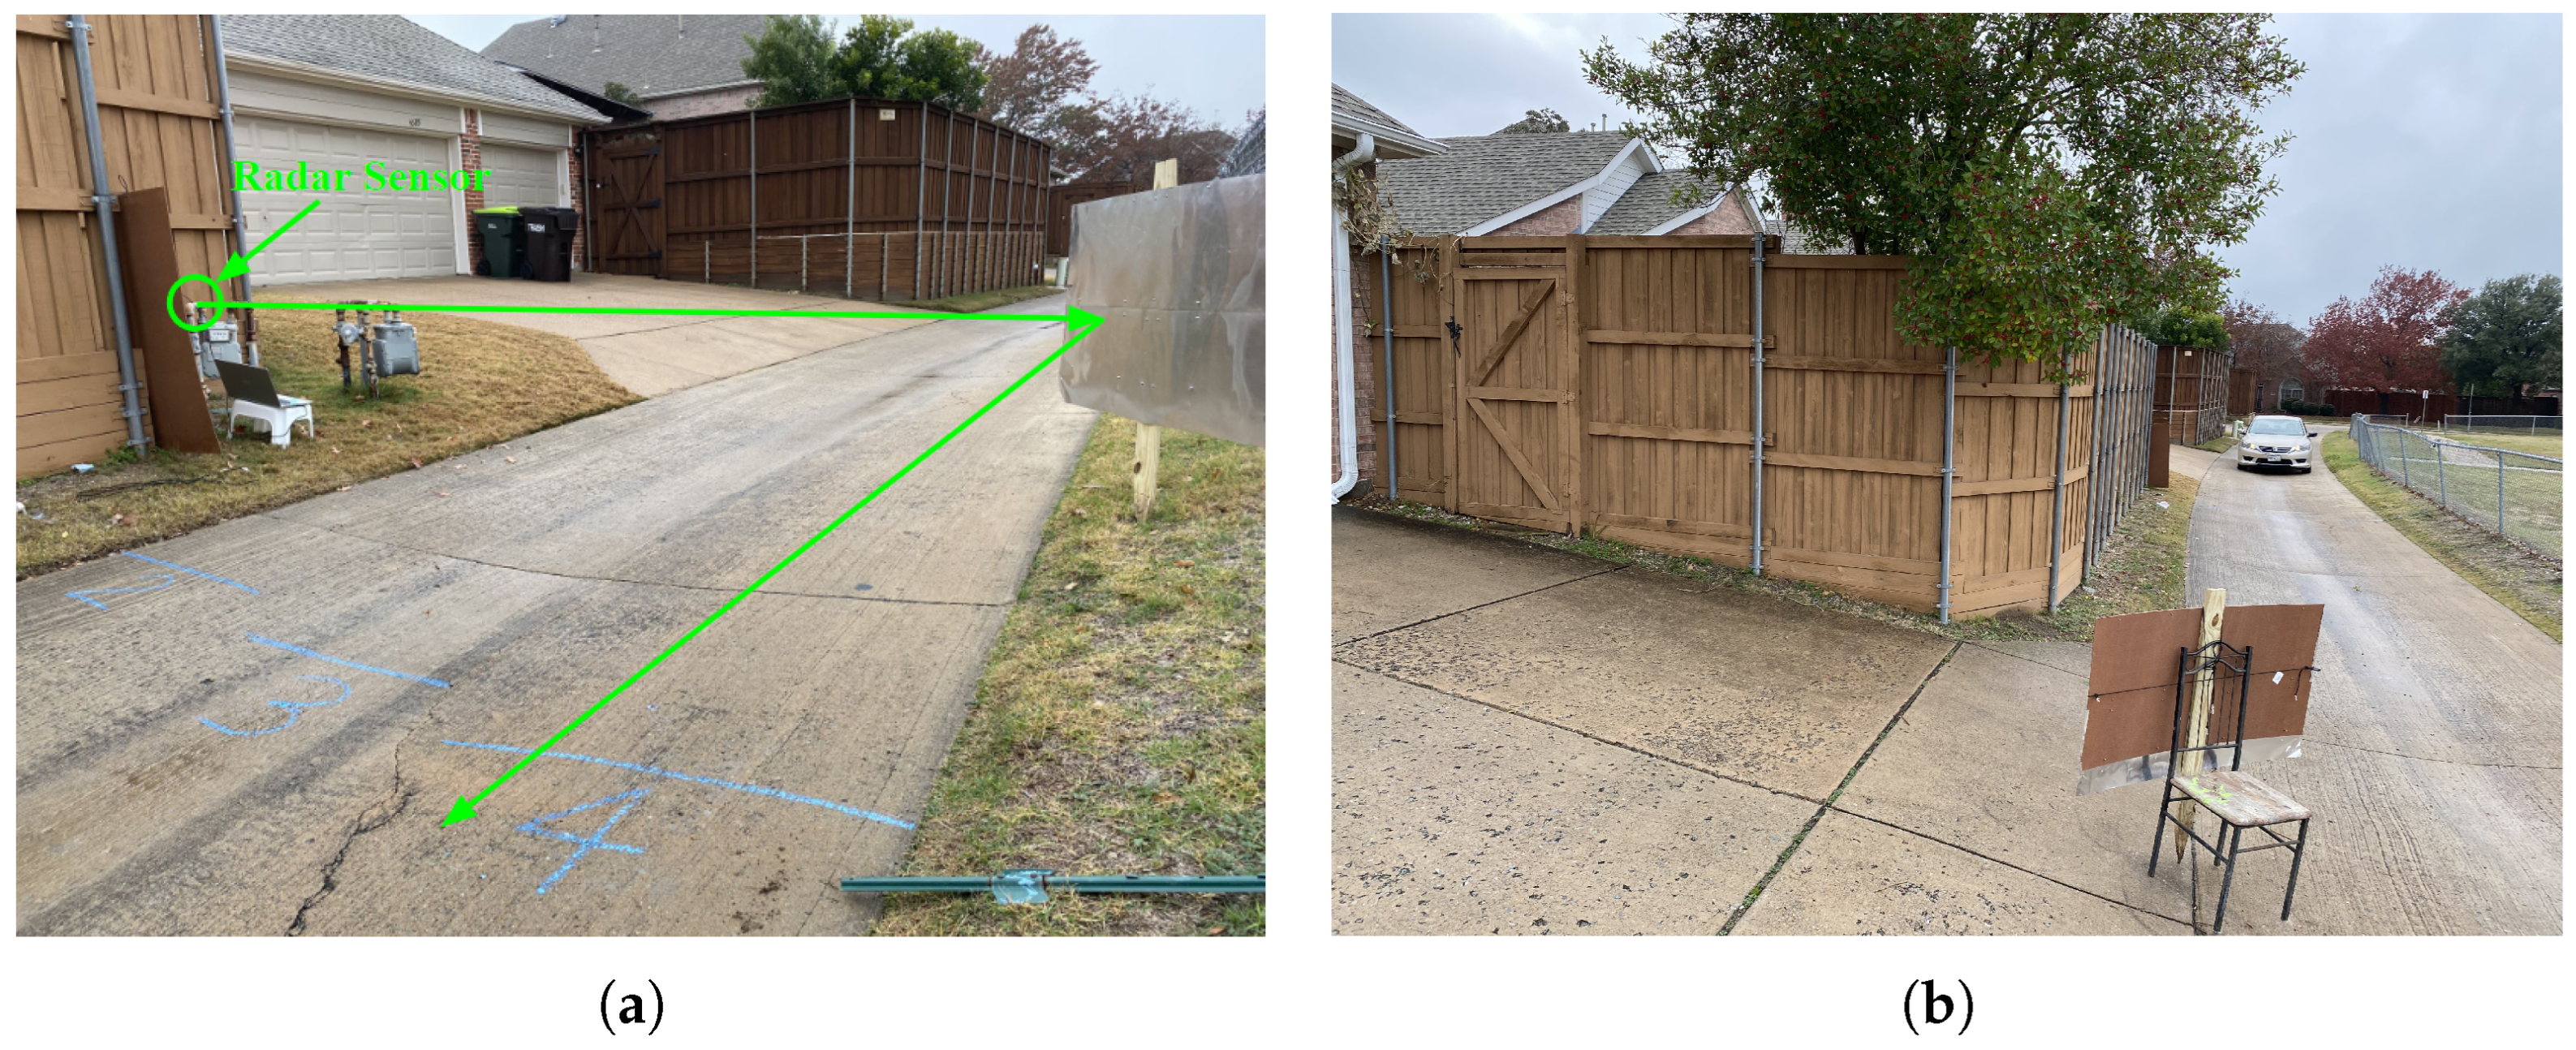
The CornerGuard consists of a radar subsystem, as shown in Figure 1, and a radar wave reflector subsystem, as shown in Figure 2. Note that the radar sensor is mounted on the right side of the car to detect only right corners, as shown in Figure 1b. The body of the car acts as a shield to avoid the detection of approaching cars from opposite lanes.
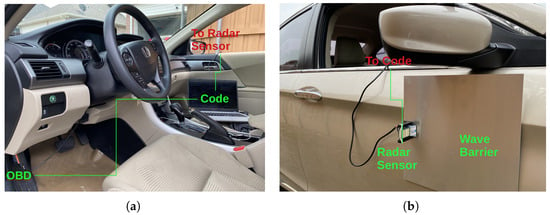
Figure 1.
An overview of the CornerGuard’s radar subsystem, which includes (a) an onboard diagnostics (OBD) device and a computer that collects and analyzes data and (b) a radar sensor.
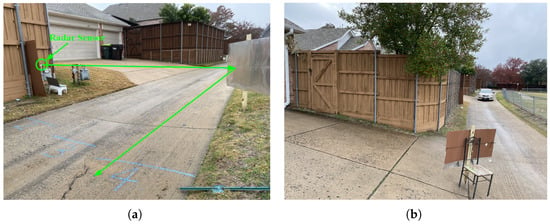
Figure 2.
The setup of the reflector in (a) blind spot tests and (b) field simulation tests.
The radar subsystem consists of a small, low-cost digital RFbeam 24 GHz K-LD7 microwave radar sensor, a laptop computer, and an onboard diagnostics (OBD) device, as shown in Figure 1. The car for our tests was a 2015 Honda Accord. Note that only a radar sensor is needed when a car manufacturer decides to implement the current detection approach, as a modern car already has a built-in computer system to read car sensor information, run detection algorithms, and send control signals.
2.2. Doppler Effect
The Doppler effect in radar detection is the change in the frequency of a radar wave in relation to an object that is moving relative to the source of the wave [13]. The frequency shift is proportional to the relative speed at which the sensor and the object approach each other. The relation is
where is the frequency of the radar waves emitted from the radar sensor and c is the speed of light.
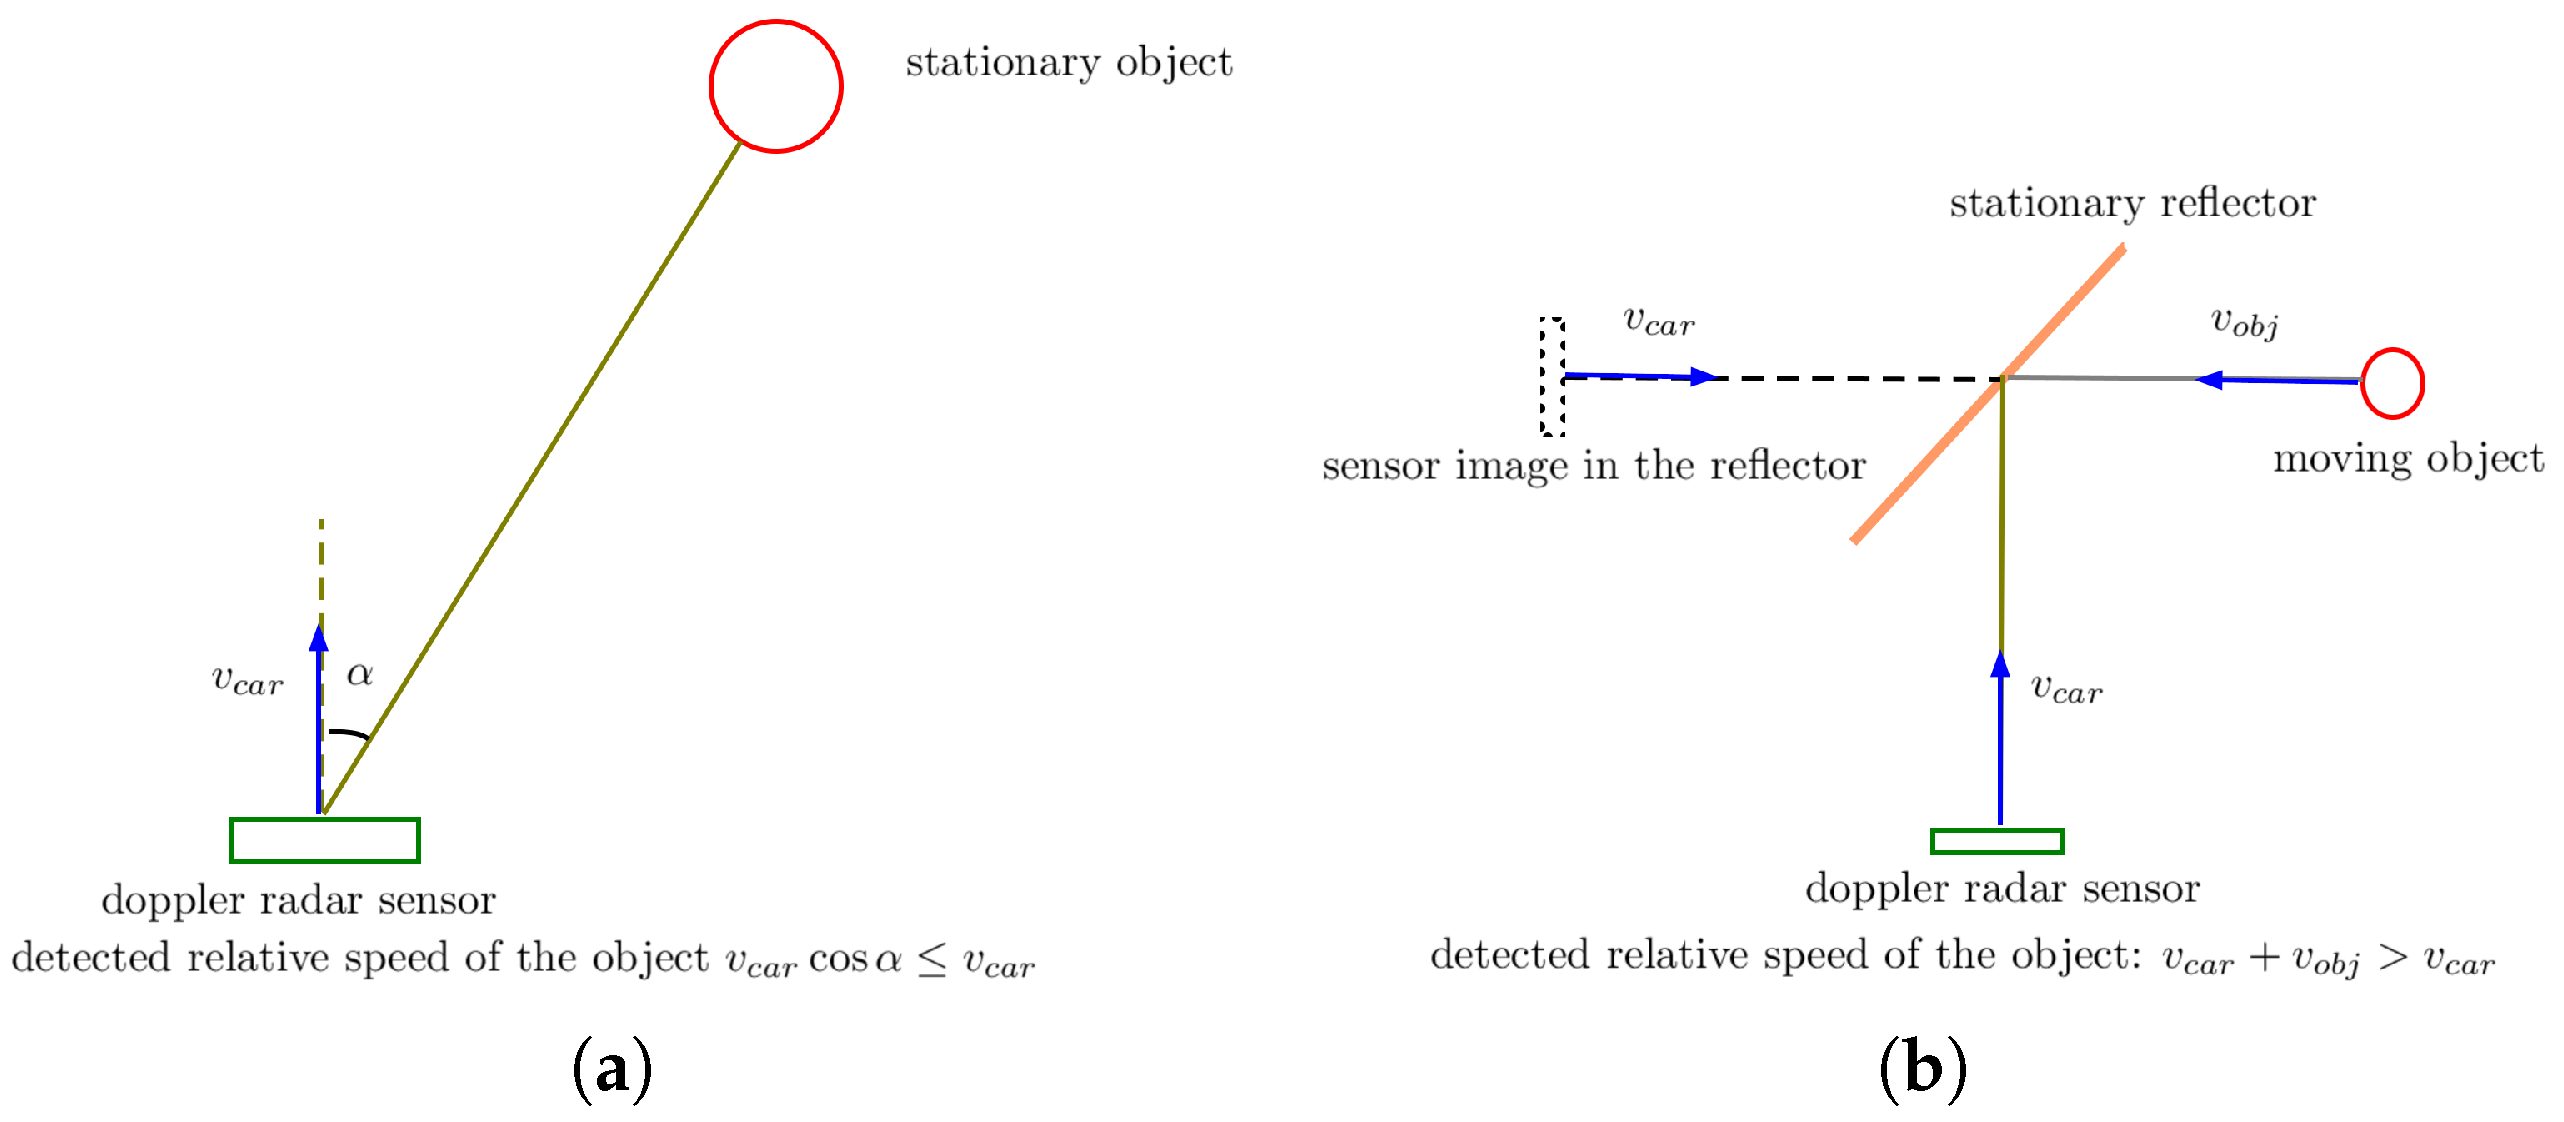
The radar sensor is mounted on a moving car and approaches surrounding stationary objects. As illustrated in Figure 3a, the relative speed at which they approach each other is , which satisfies
where is the ground speed of the car and is the angle of the object relative to the moving direction of the car.
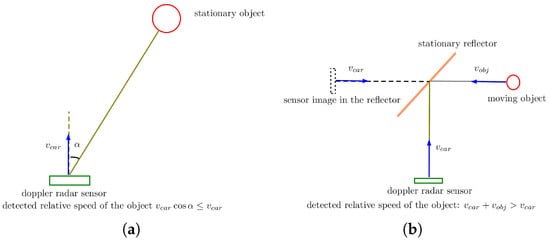
Figure 3.
The relative speed at which the radar sensor and an object approach each other. (a) A surrounding stationary object; (b) an object that approaches the sensor in the reflector.
As illustrated in Figure 3b, for an object around a right corner that is not in the line of sight (LOS) of the radar sensor but seen as a virtual image by the sensor through the reflector, the relative speed at which the object and the senor approach each other is about , which satisfies
where is the ground speed at which the object moves toward the reflector.
Compared with the ground speed of the car, the object around the corner that moves toward the intersection can be distinguished from a surrounding stationary object, as the speed of the former relative to the car is greater than the car’s speed, while the speed of the latter is slower.
2.3. The Reflector
Metal surfaces can reflect radar waves very well. The reflector of the current CornerGuard is made of an aluminum sheet 0.0078 inches thick, which can reflect more than of a radar wave with little absorption.
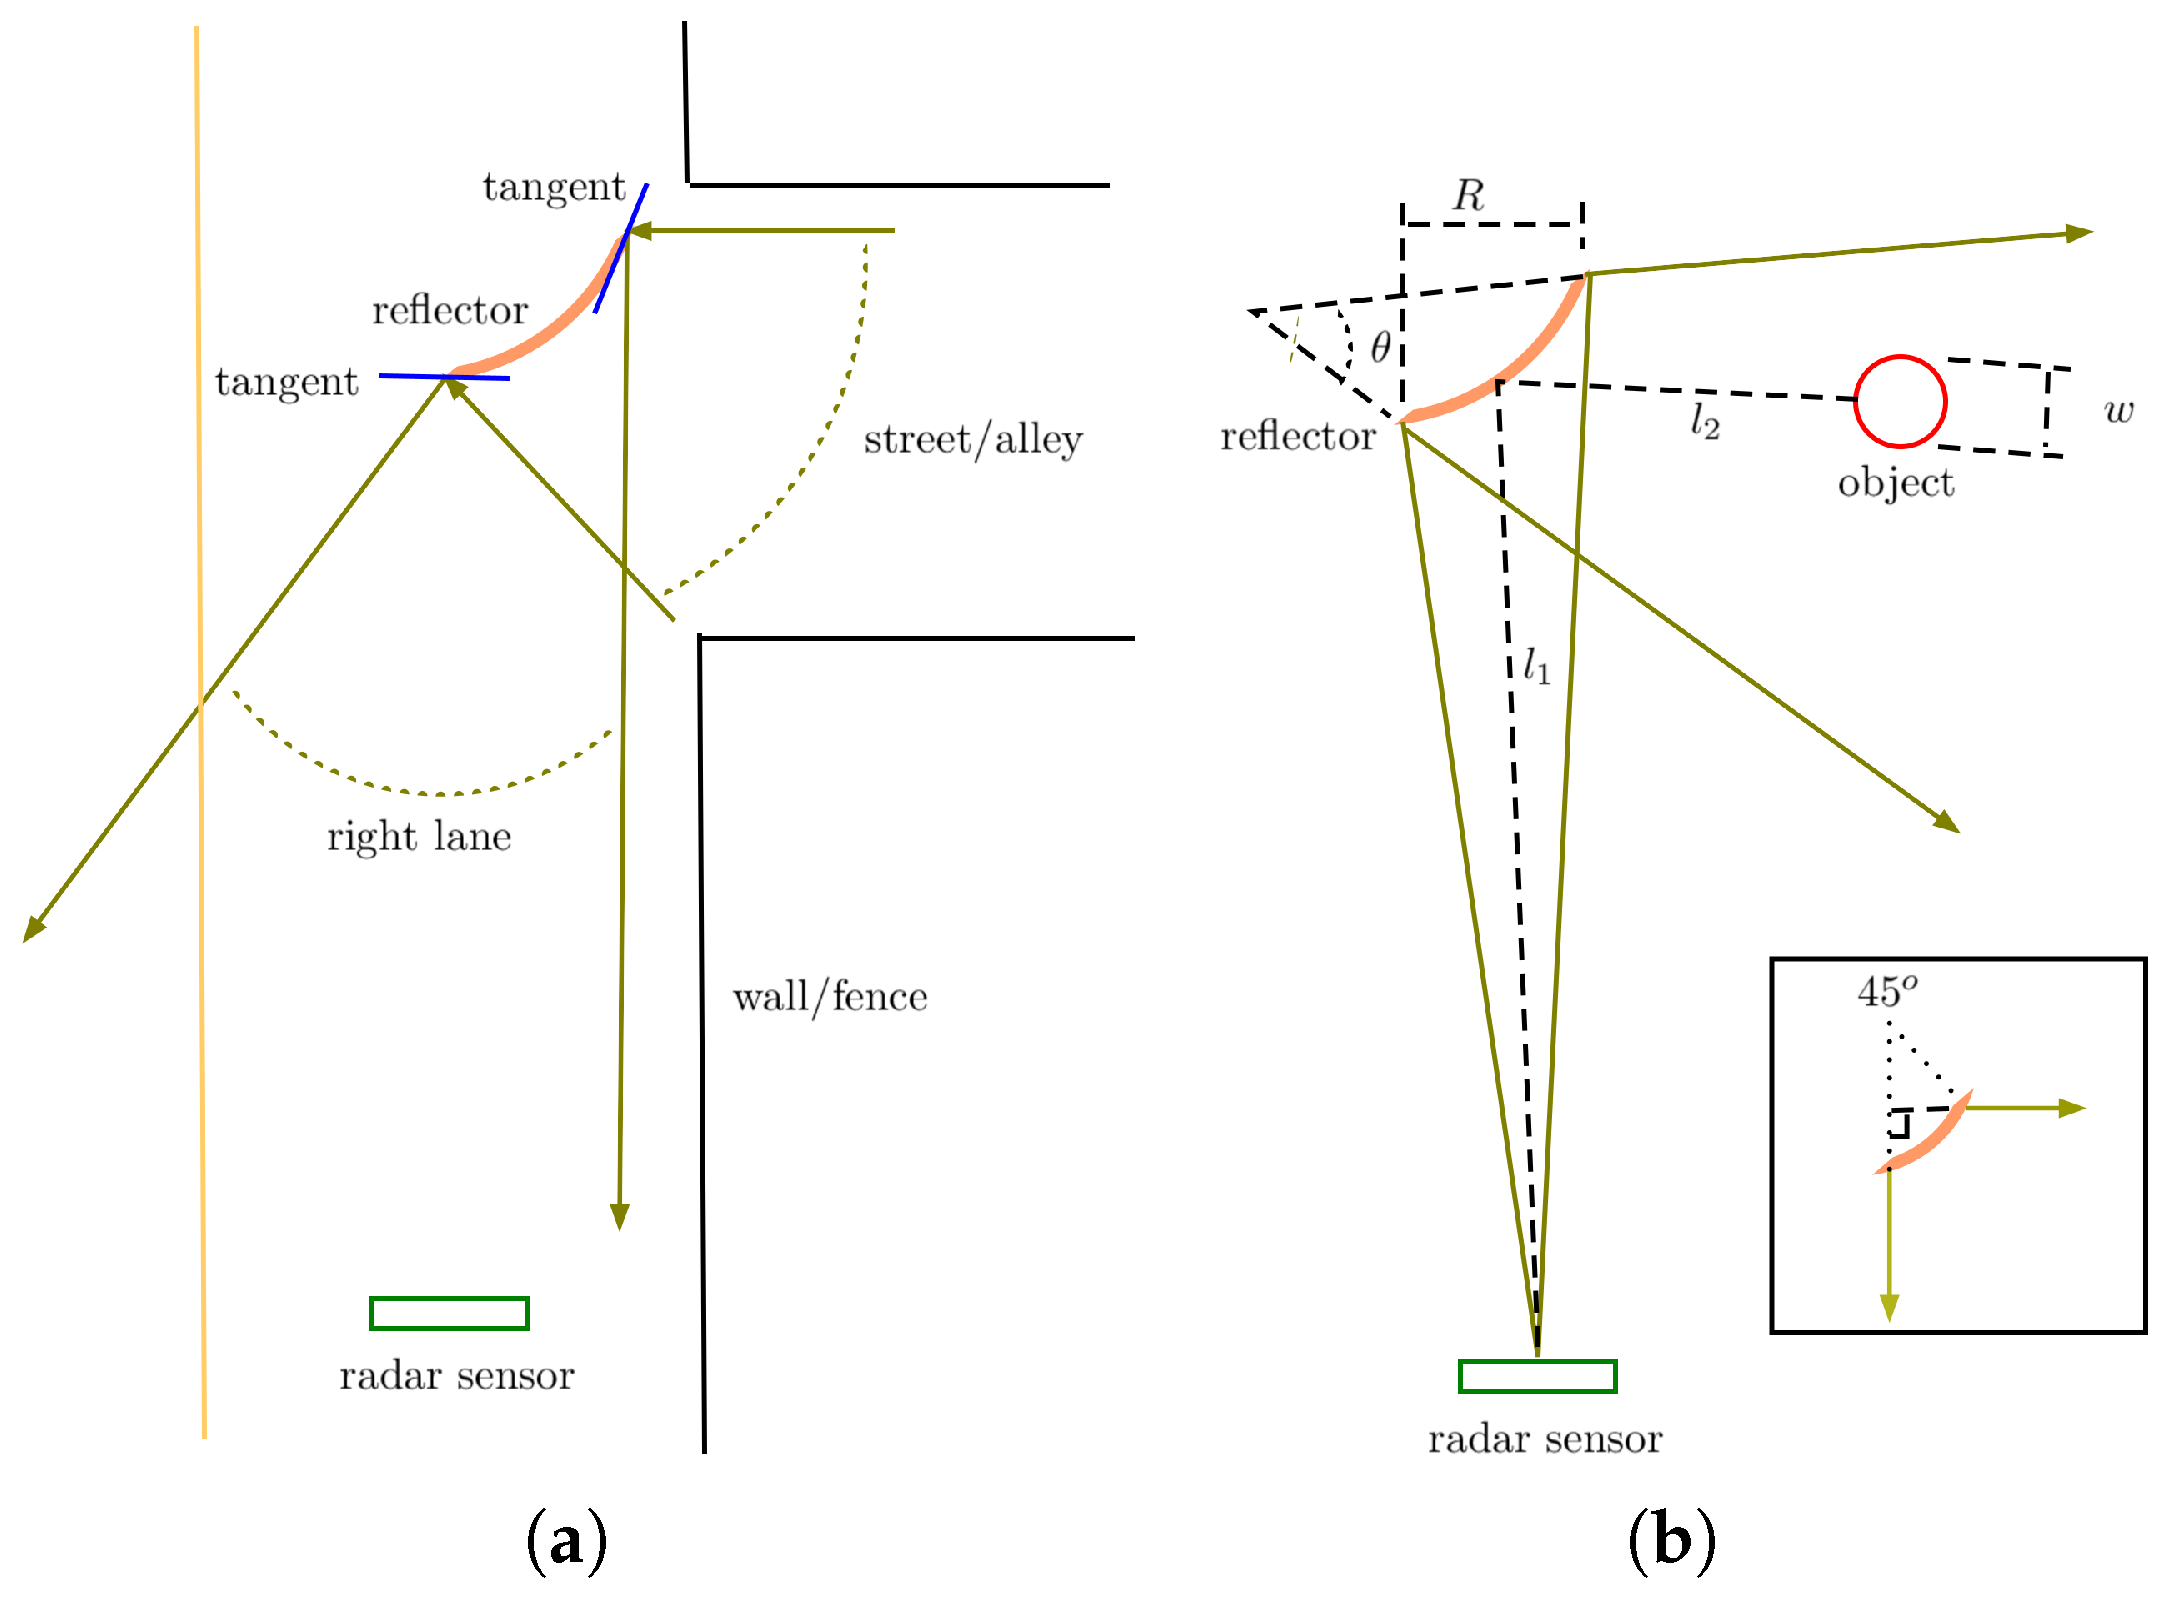
The dimensions of the surface of the reflector are 48 inches by 30 inches. The center of the reflector is about the same height as the radar sensor, which is about 3 ft, the typical height of a toddler. In this way, the reflector surface does not need to be vertically curved to have no vertical blind spots for the target detection. As shown in Figure 4a, the surface of the reflector needs to be smoothly curved in the horizontal direction parallel to the ground to avoid horizontal blind spots. As shown in the inset of Figure 4b, the radar beams are directed by a reflective arc to a coverage if the beams hit the reflector vertically. A bend, therefore, should suffice for most intersections.
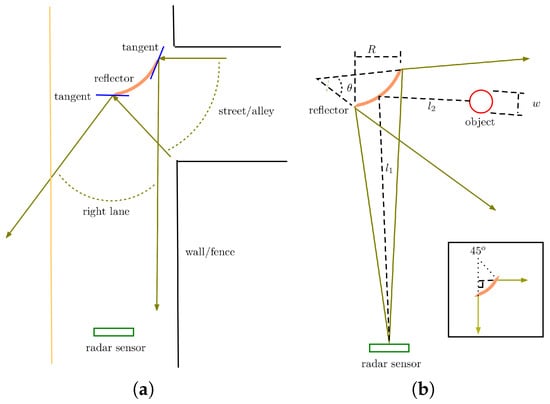
Figure 4.
(a) The geometric design of the reflector to avoid blind spots. (b) The geometric analysis of radar detection range reduction due to reflector curvature.
The loss of radar wave energy due to reflection about the reflector may be neglected. However, the curvature of the reflector reduces the detection range of the radar sensor. Below, we estimate the range loss due to the curvature in the horizontal direction.
Without a reflector, the energy intensity received from the sensor by an object of horizontal width w at a distance is proportional to w and inversely proportional to as
where is the energy intensity received by the object, is the emitted energy intensity at the sensor, and k is a constant.
In the case illustrated in Figure 4b, the energy intensity received by the object is
where R is the horizontal dimension of the reflector and (in radians) is the angle defined in Figure 4b, which is about .
The ratio is
which is the detection range reduction factor. To have a larger detection range, we need a stronger radar sensor (with larger ) and a wider reflector (with larger R).
2.4. Procedure
The following is the procedure for practical implementation:
- Programming and integrating the radar sensor. Connect a radar sensor and an OBD device to a laptop computer (Figure 1). Write a Python program to communicate with the radar sensor and OBD via USB communication ports.
- Designing and building the stationary reflector. Secure a flexible aluminum sheet to a hardboard with screws to form the reflective surface, and bend it using paracord as bowstrings to form a arc surface (Figure 2). Secure the surface to a sharpened wooden plank to form a stake.
- Collecting and analyzing data. Record the speeds, distances, and angles of objects detected by the radar sensor in tests. Use an OBD package to constantly read the car’s speed. Compare the reading with the speeds of the objects detected by the radar sensor in the program. Save all data to a text file. If the speed of an object detected by the radar sensor is greater than the instantaneous speed of the car read by the OBD, save the detection data to a separate text file.
The code for programming the radar sensor and OBD to collect and analyze data is given in the Appendix A.
3. Results and Discussions
The setup of the field experiment is shown in Figure 2. In addition to being tested in clear and sunny conditions, the CornerGuard was also tested in dark and misty conditions.
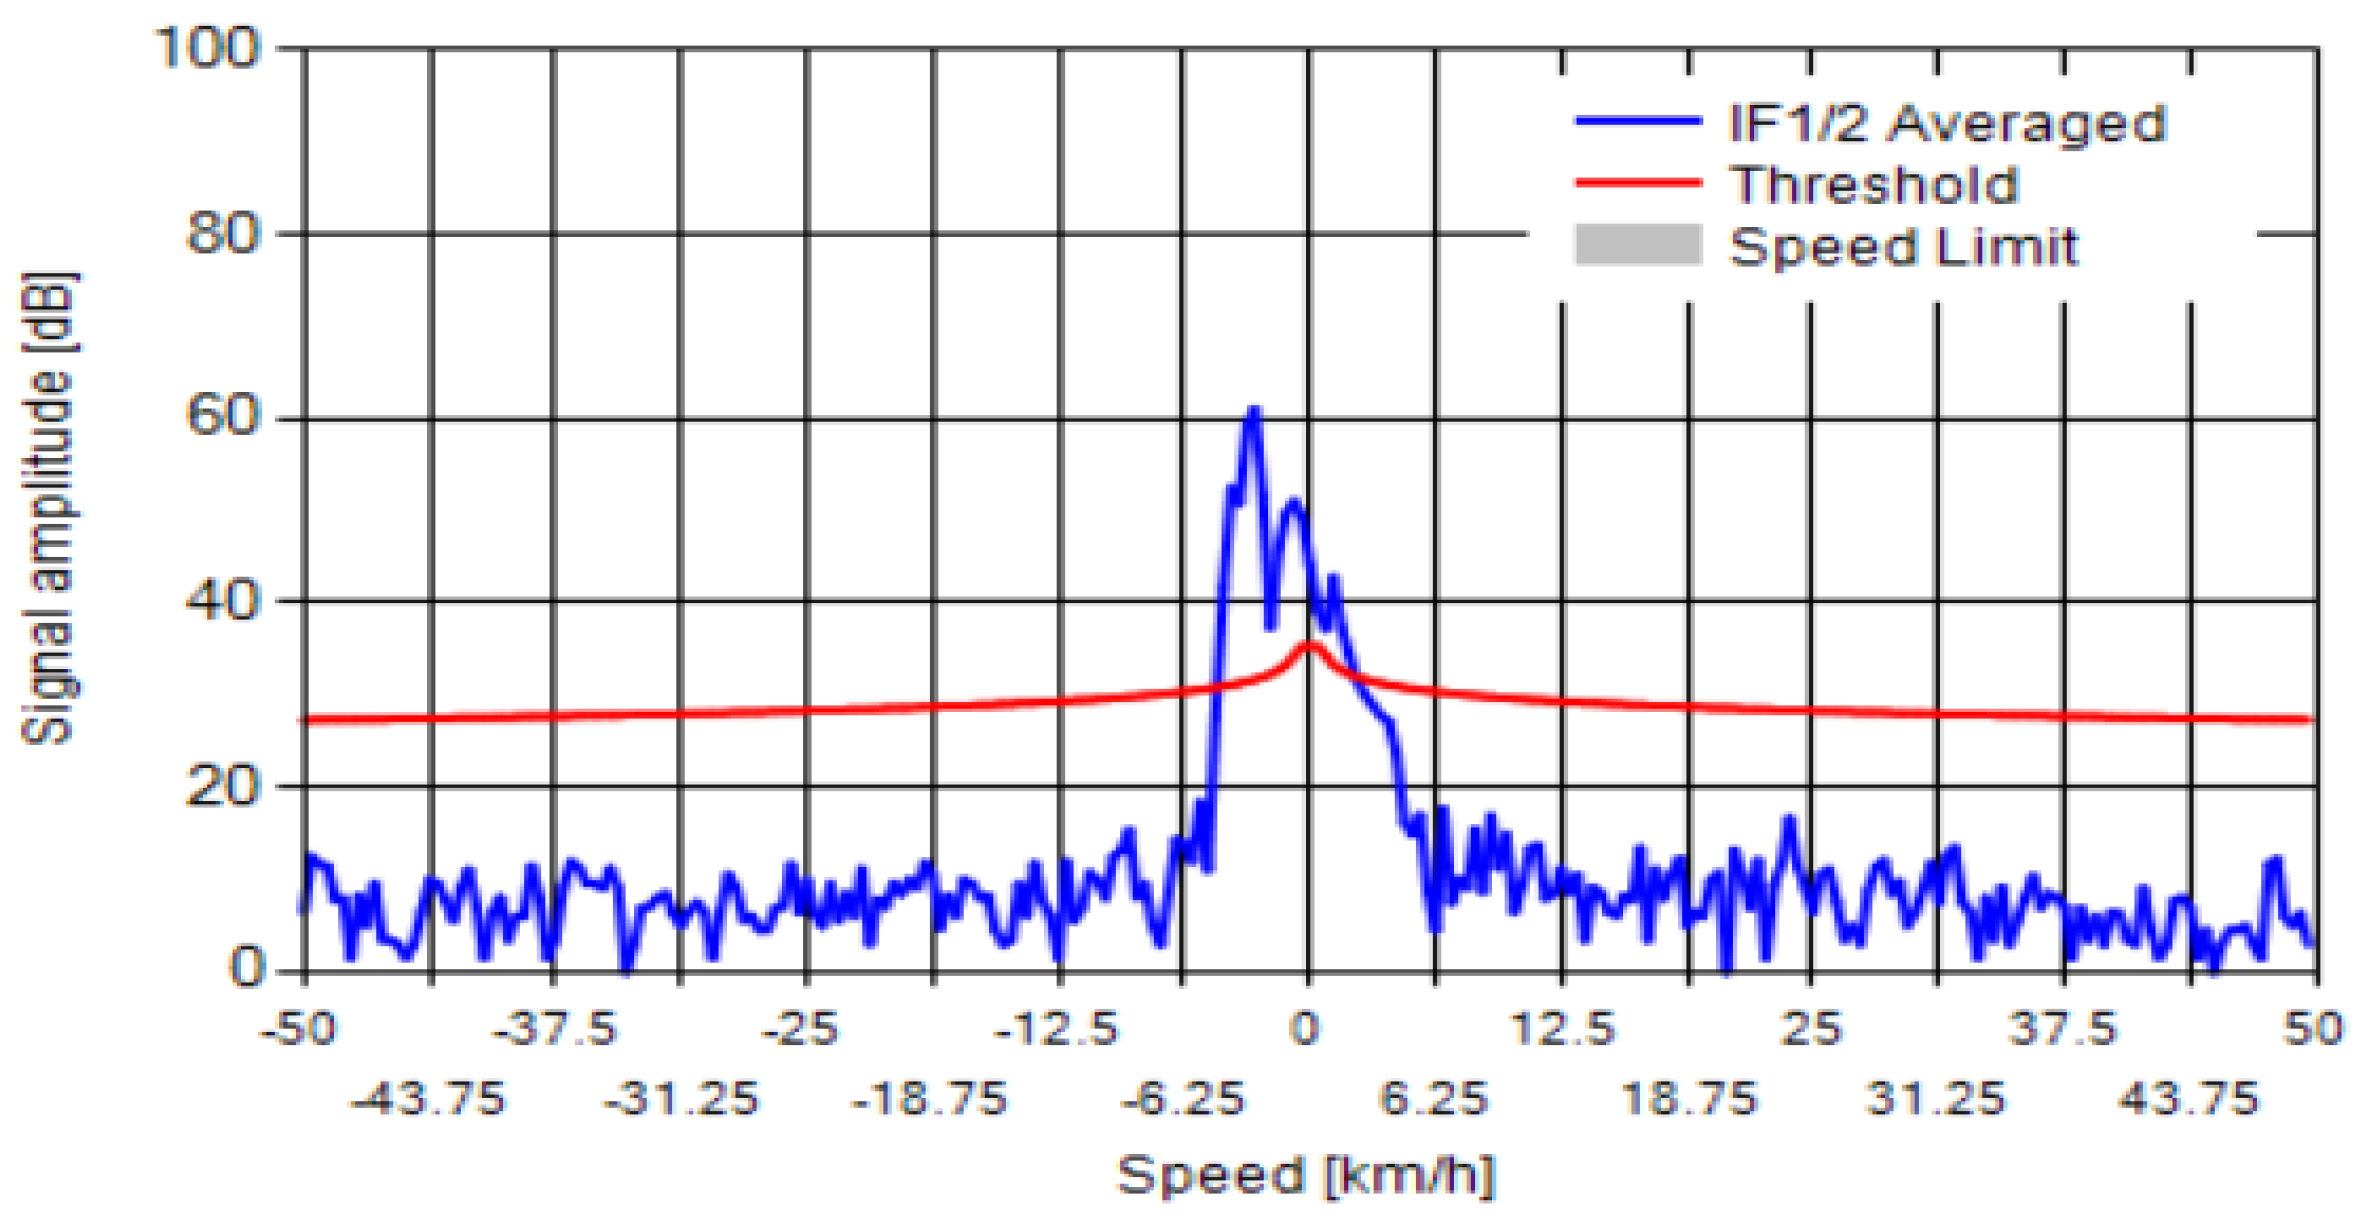
When an object is moving relative to the sensor, the frequency of the received radar waves reflected from the object is different from the radar waves transmitted by the sensor because of the Doppler effect. This frequency difference gives the relative speed of the object. In Figure 5, the fast Fourier transform (FFT) is used to convert raw sensor readings into a frequency difference spectrum plotted as signal amplitude versus speed (frequency difference). Additionally, the constant offset of 20 dB is plotted as a threshold line to filter out unwanted noise.
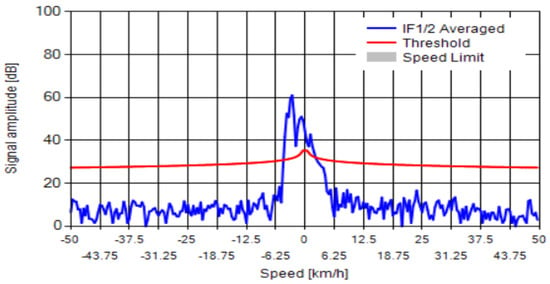
Figure 5.
A spectrum obtained by the FFT (fast Fourier transform), plotted as signal magnitude vs. object speed, including a red 20 dB noise threshold line.
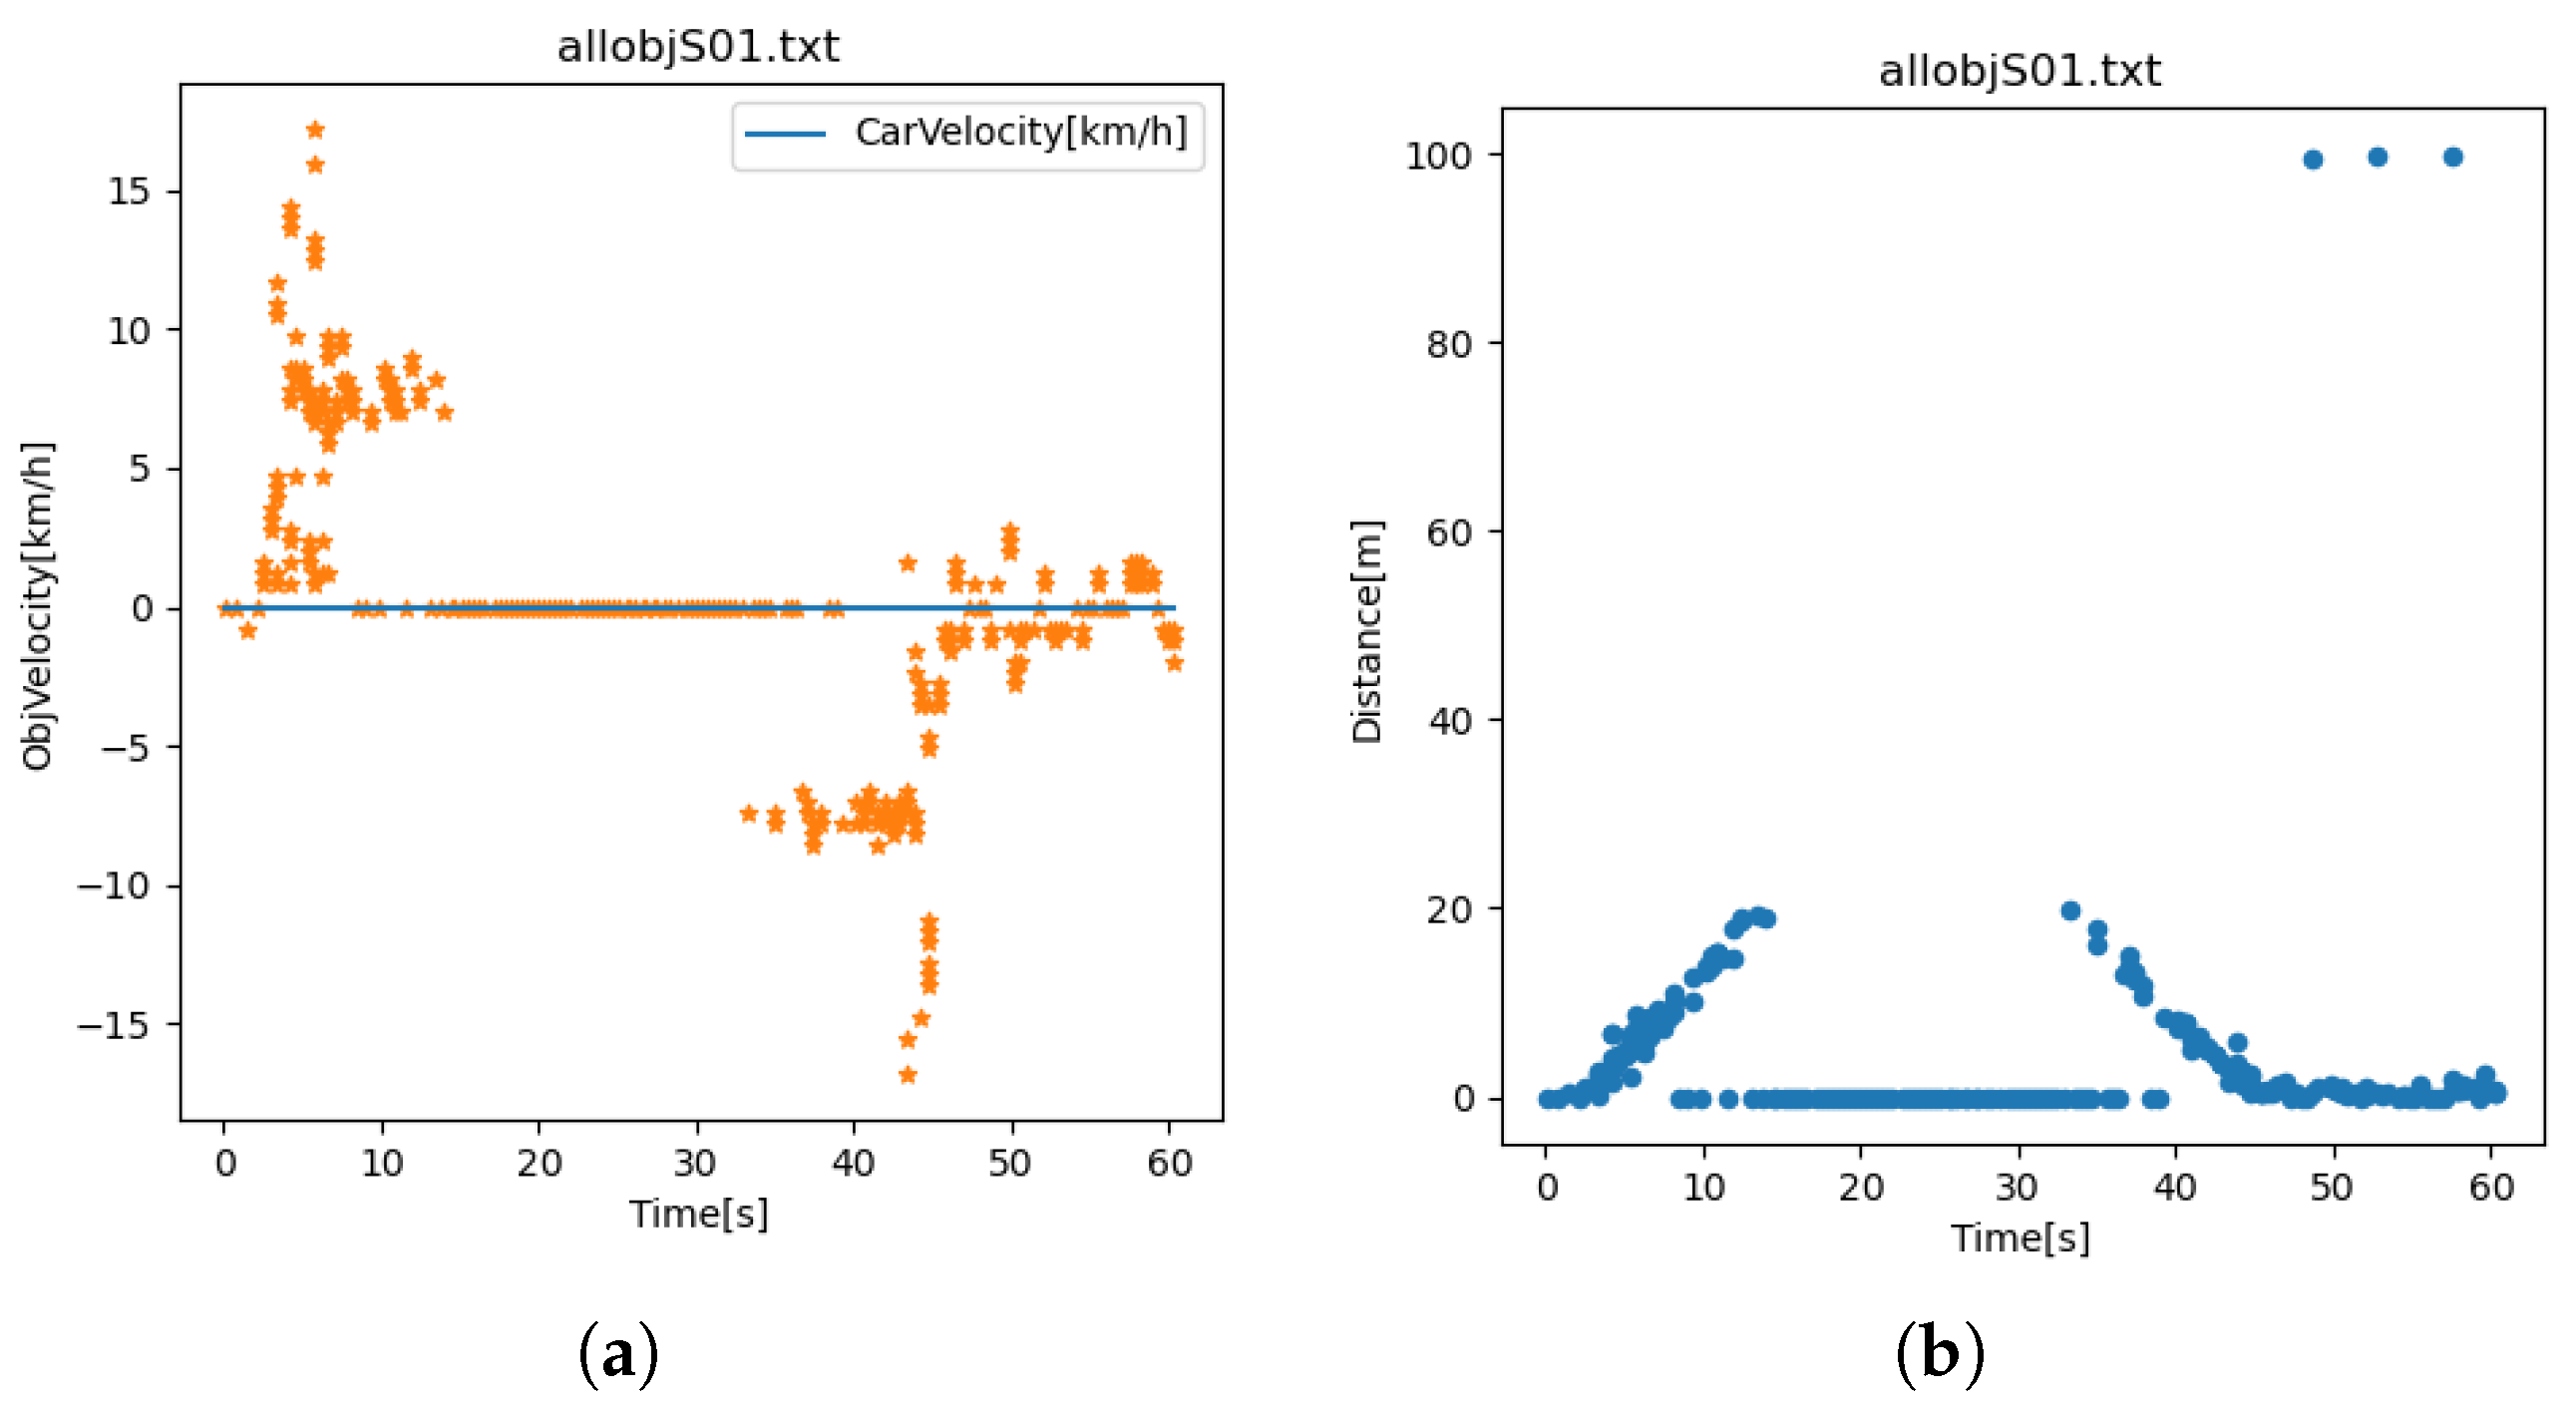
In the figures below, negative velocities indicate approaching targets, and positive velocities indicate receding targets. For example, in Figure 6a, from the time 0 to 10 s, the targets were receding from the sensor. Detection was then lost from time 10 to 30 s. Afterward, during the time 30 to 50 s, the targets were approaching the sensor.
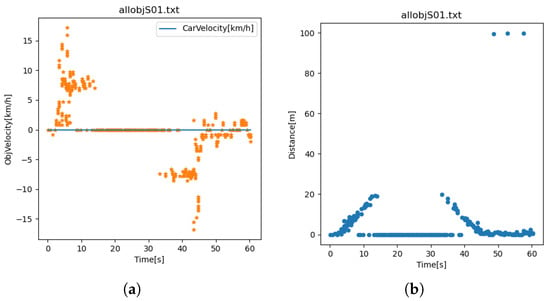
Figure 6.
Range assessment through a straightaway test: (a) speed vs. time; (b) range vs. time.
3.1. Range and Blind Spot Assessment
Before starting simulation scenario tests, we ran tests to assess the range of the sensor and the coverage of the reflector.
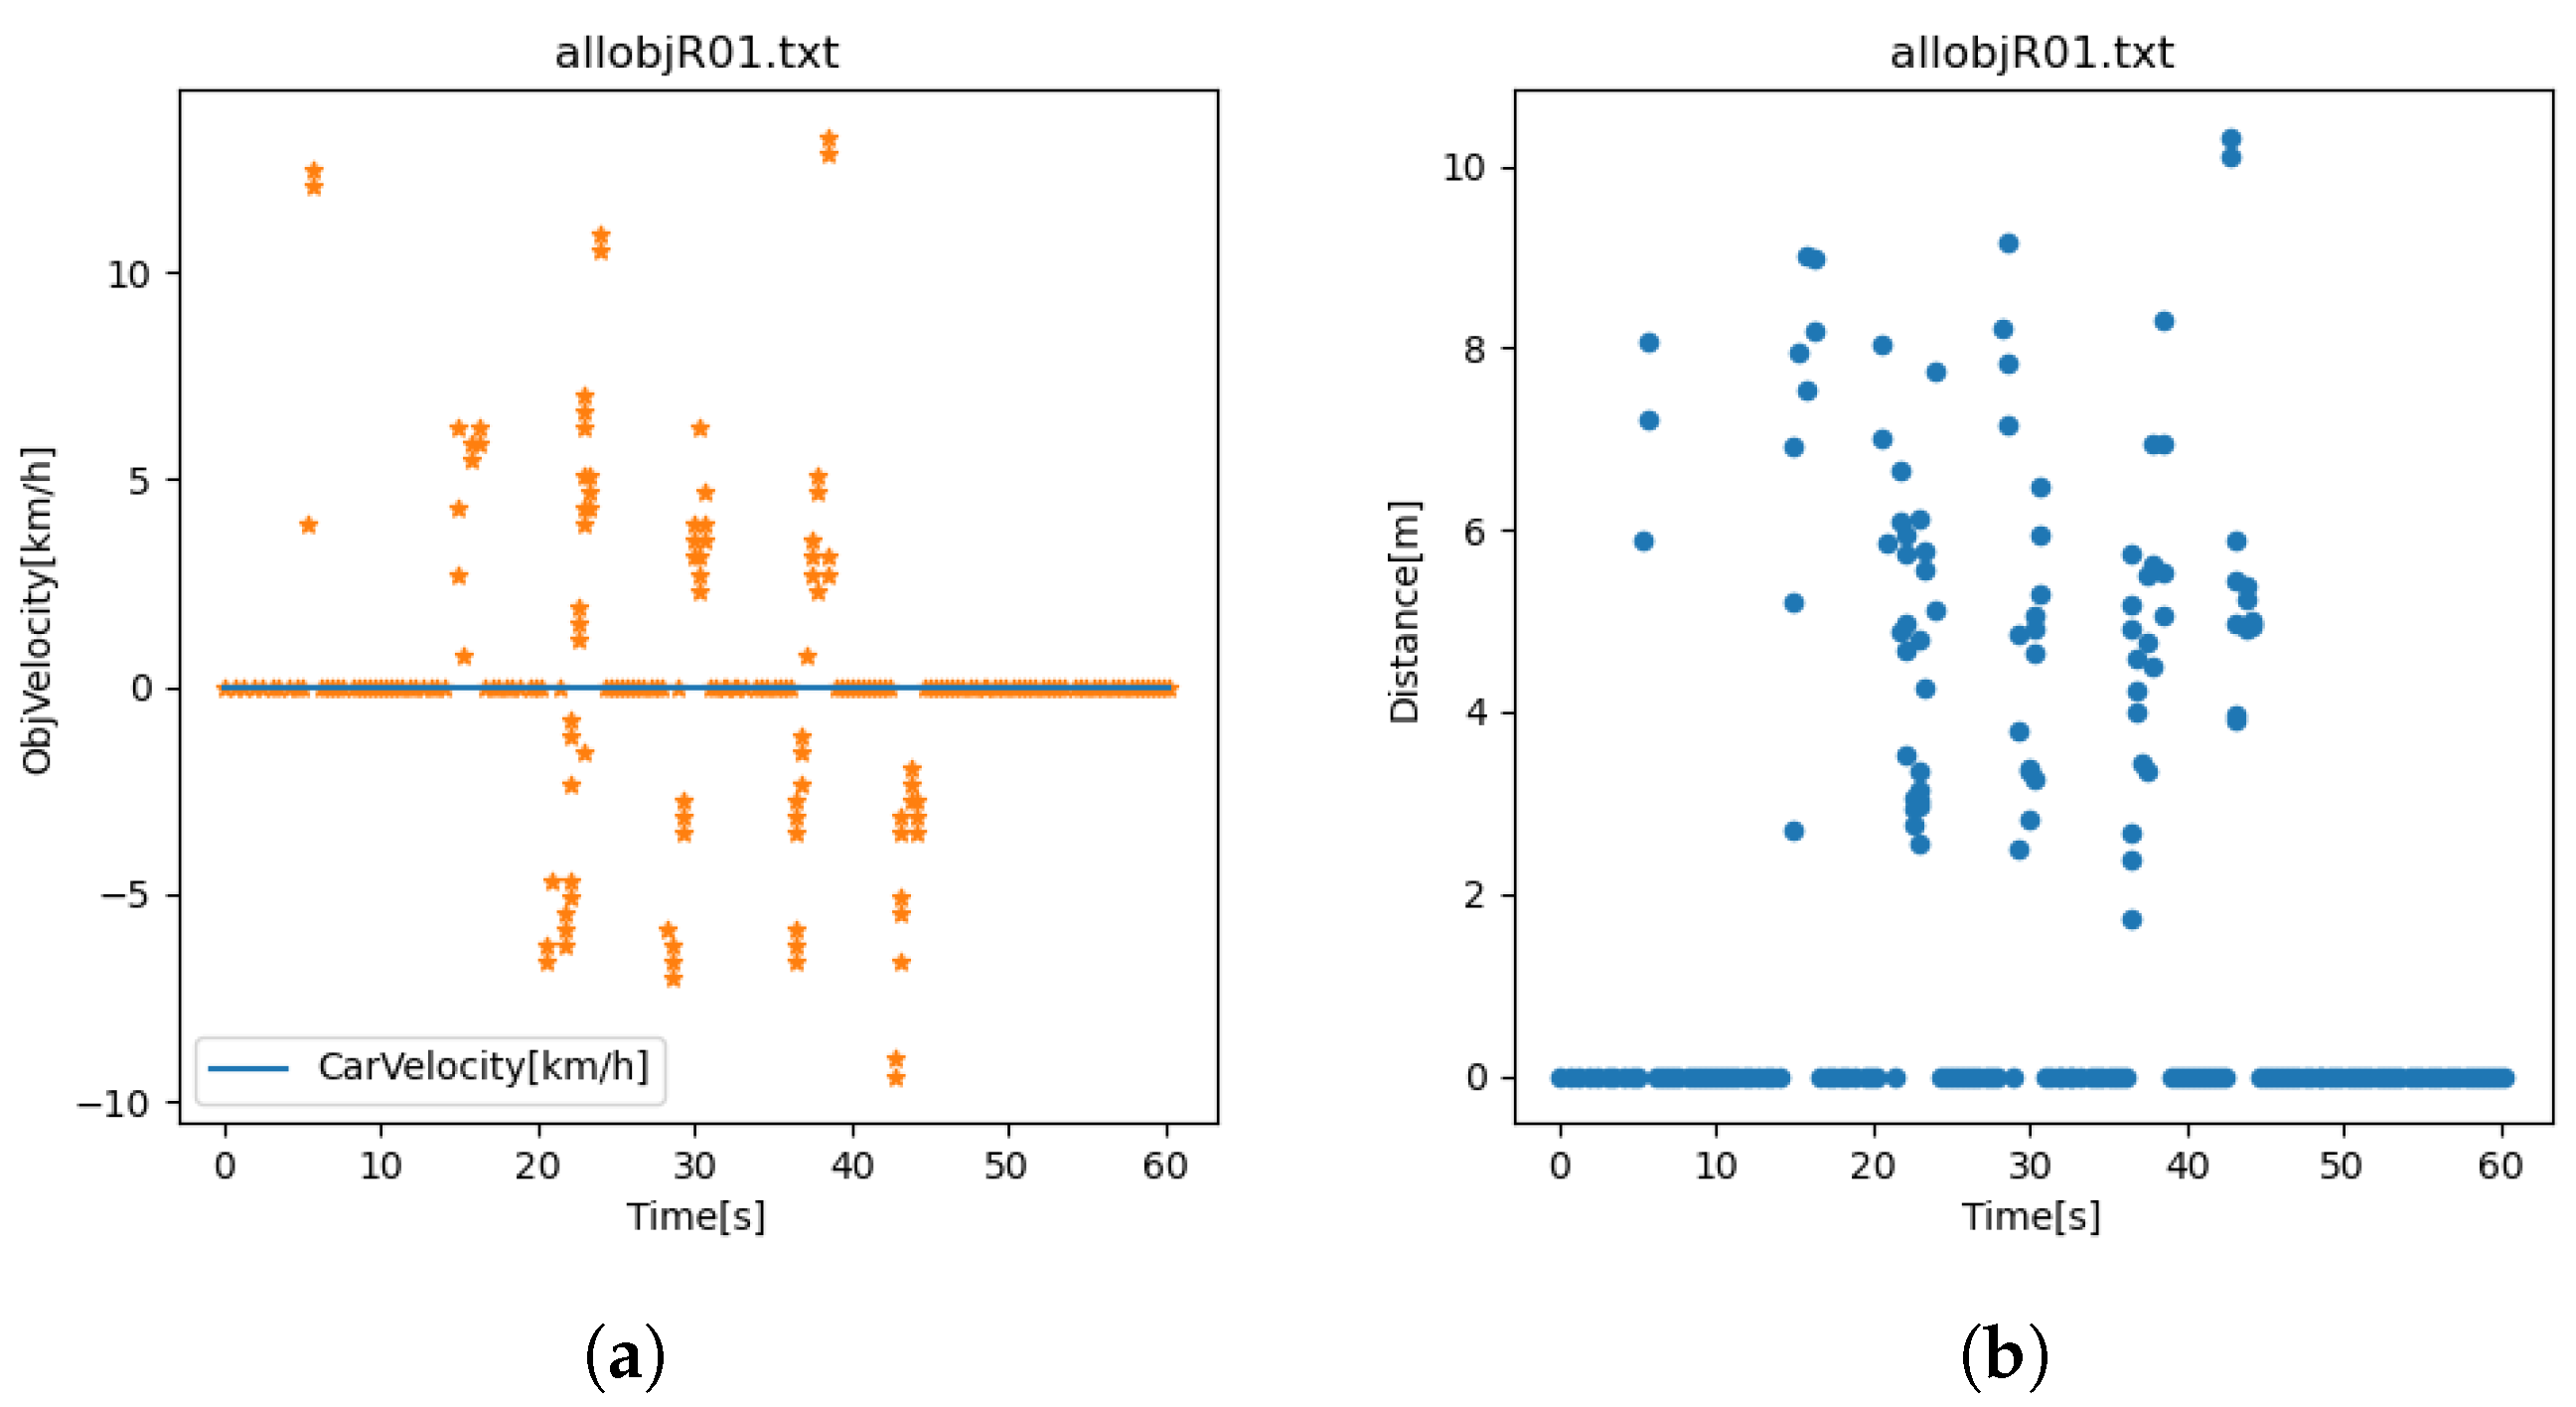
In the range assessment test, an author walked away from the sensor in the direct LOS of the sensor until detection was lost and then walked back toward the sensor, as shown in Figure 6a. As shown in Figure 6b, the maximum detection range to detect a human being was about 20 m. We then placed the sensor perpendicular to the alleyway behind a corner fence and staked the reflector in front of the sensor to direct radar waves down the alleyway, as shown in Figure 2a and Figure 4. A similar range assessment test was run. To avoid false positives, we made sure not to come into the direct LOS of the sensor, so lines were drawn on the ground to mark the end of the sensor’s direct LOS coverage, as shown in Figure 2a. The maximum detection range was reduced to about 10 m, as shown in Figure 7b.
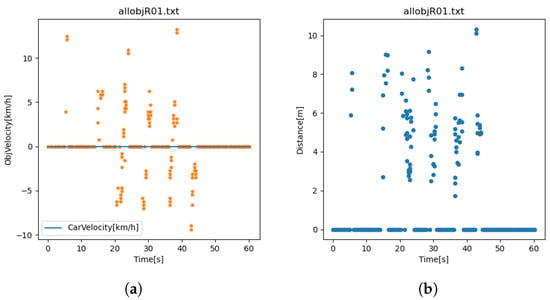
Figure 7.
Blind spot assessment through a reflector test: (a) speed vs. time; (b) range vs. time.
Using the latter setup with the reflector above, we also ran a test to assess the area coverage of the reflector and identify any blind spots. We divided the alleyway into five lanes, as shown in Figure 2a, and one author walked back and forth in each lane in front of the reflector within the detection range. Each point peak in Figure 7a represents a detection in a specific lane. There were no blind spots.
3.2. Simulation Assessment
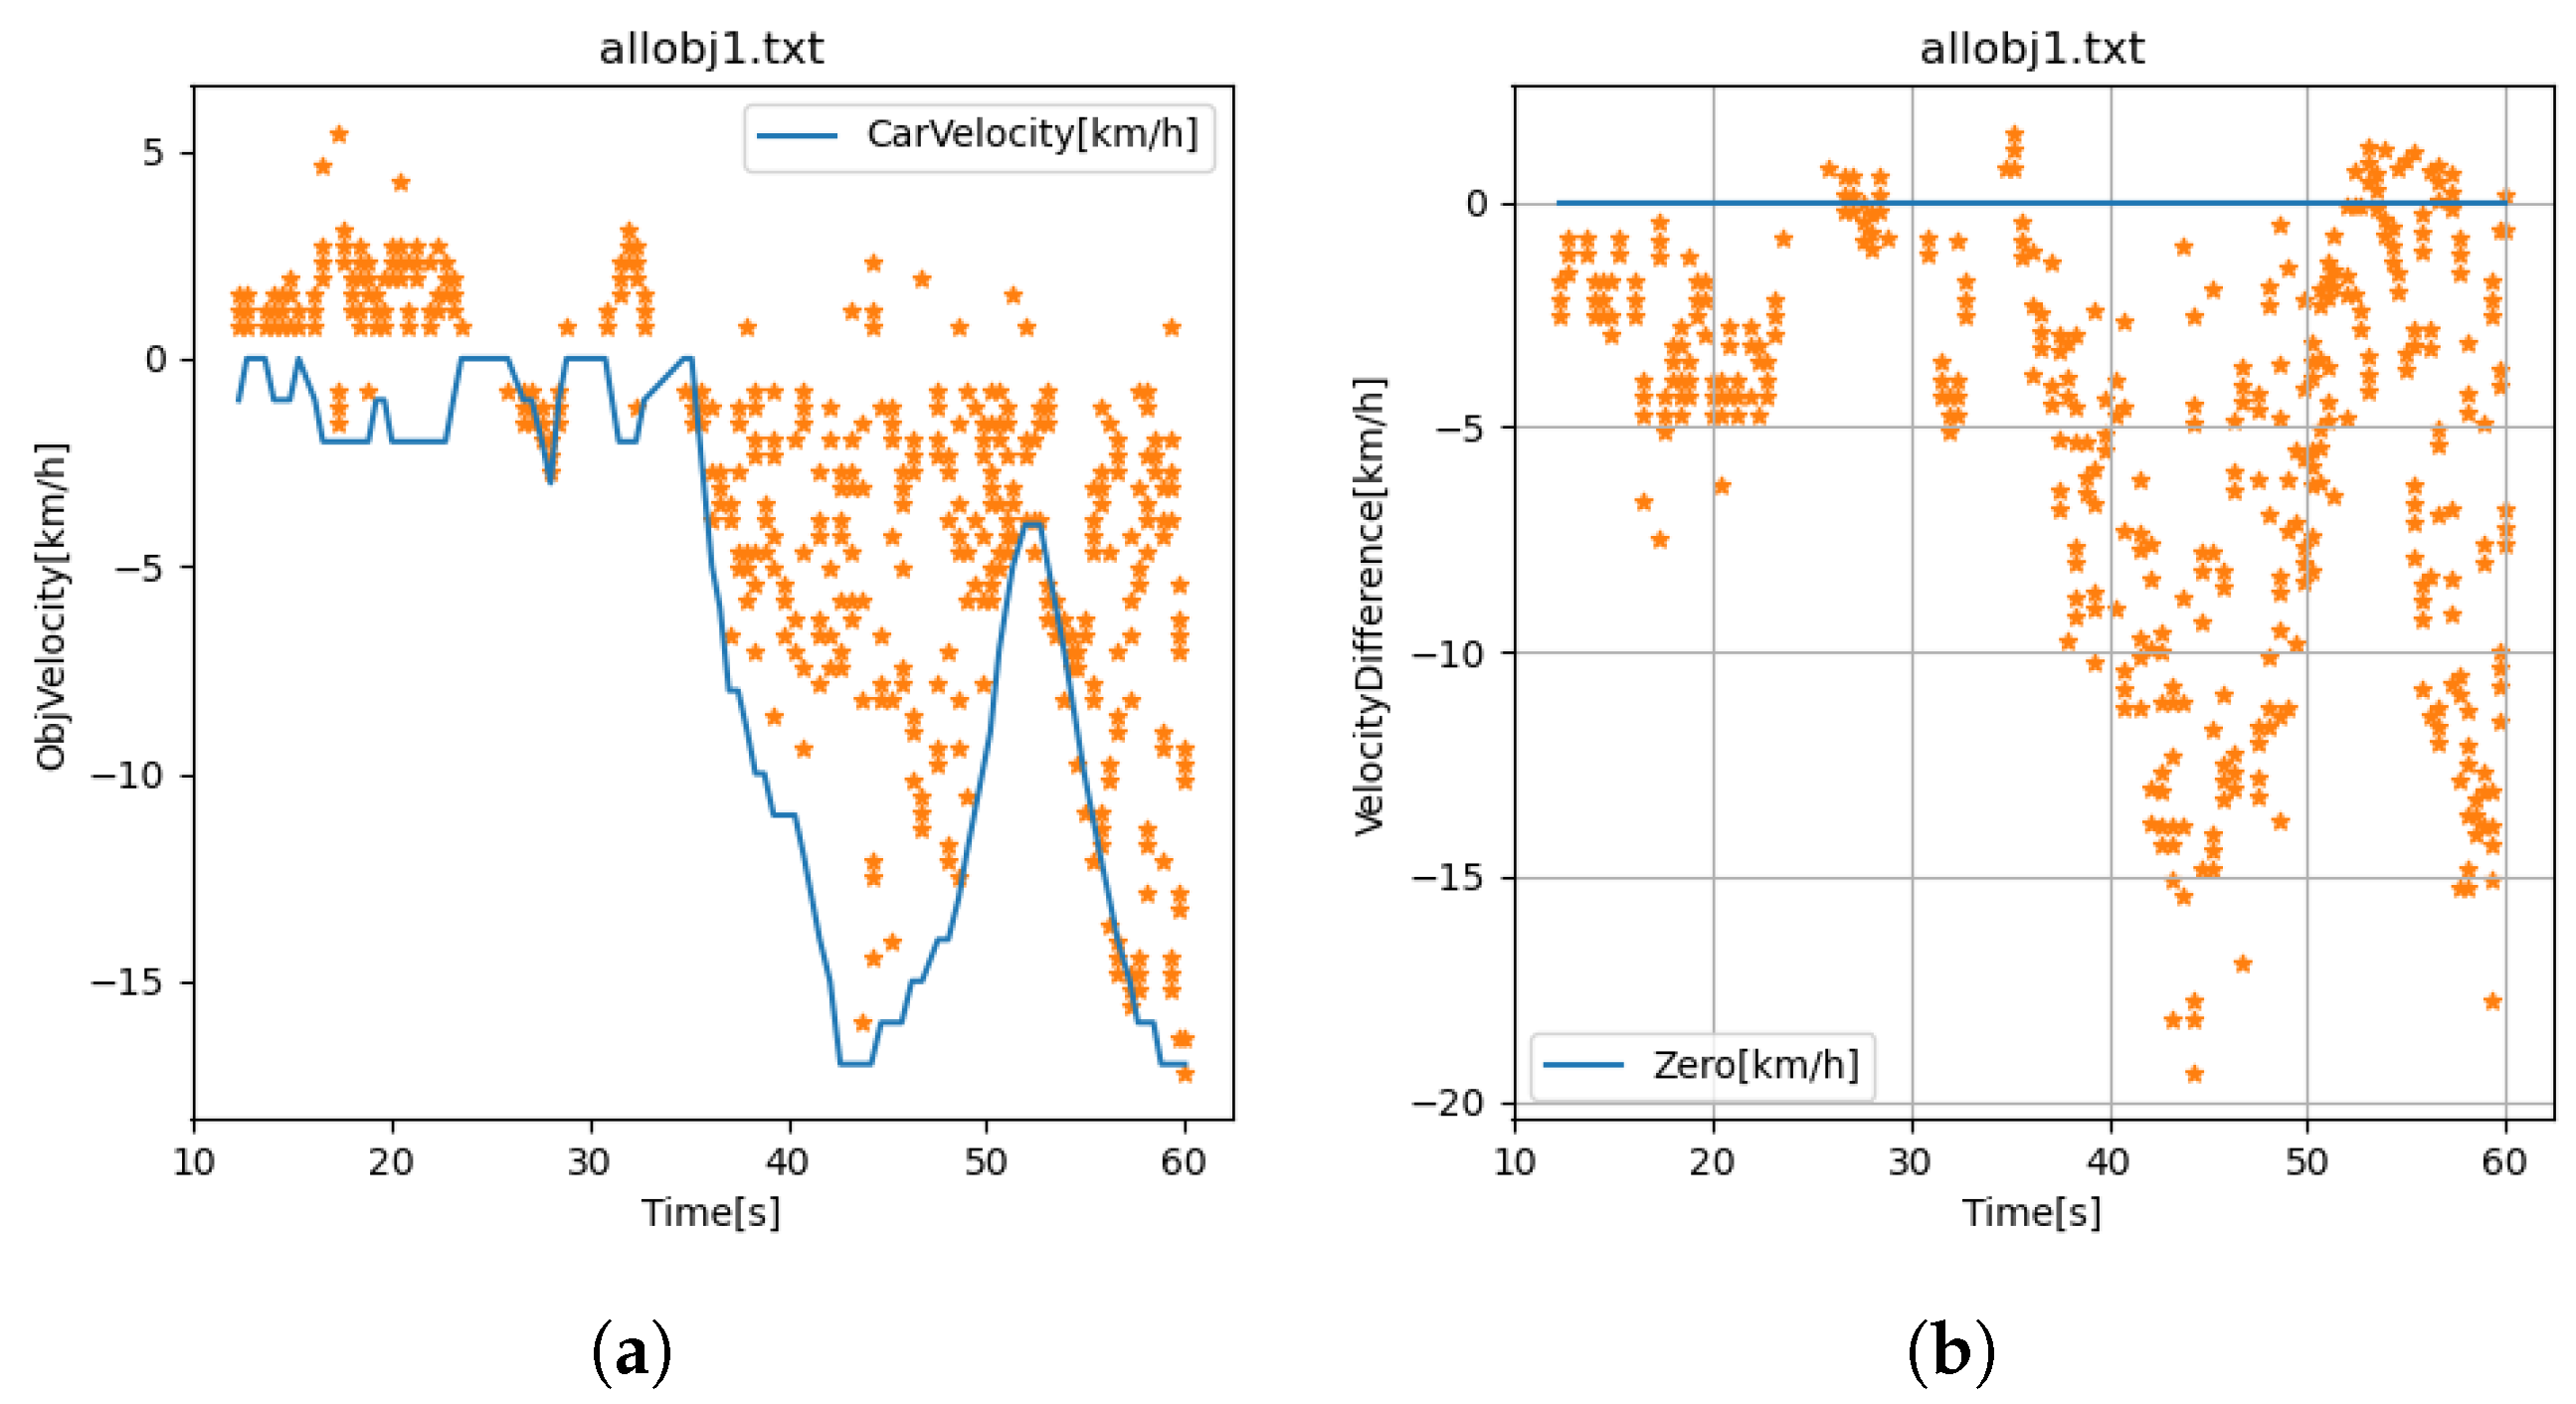
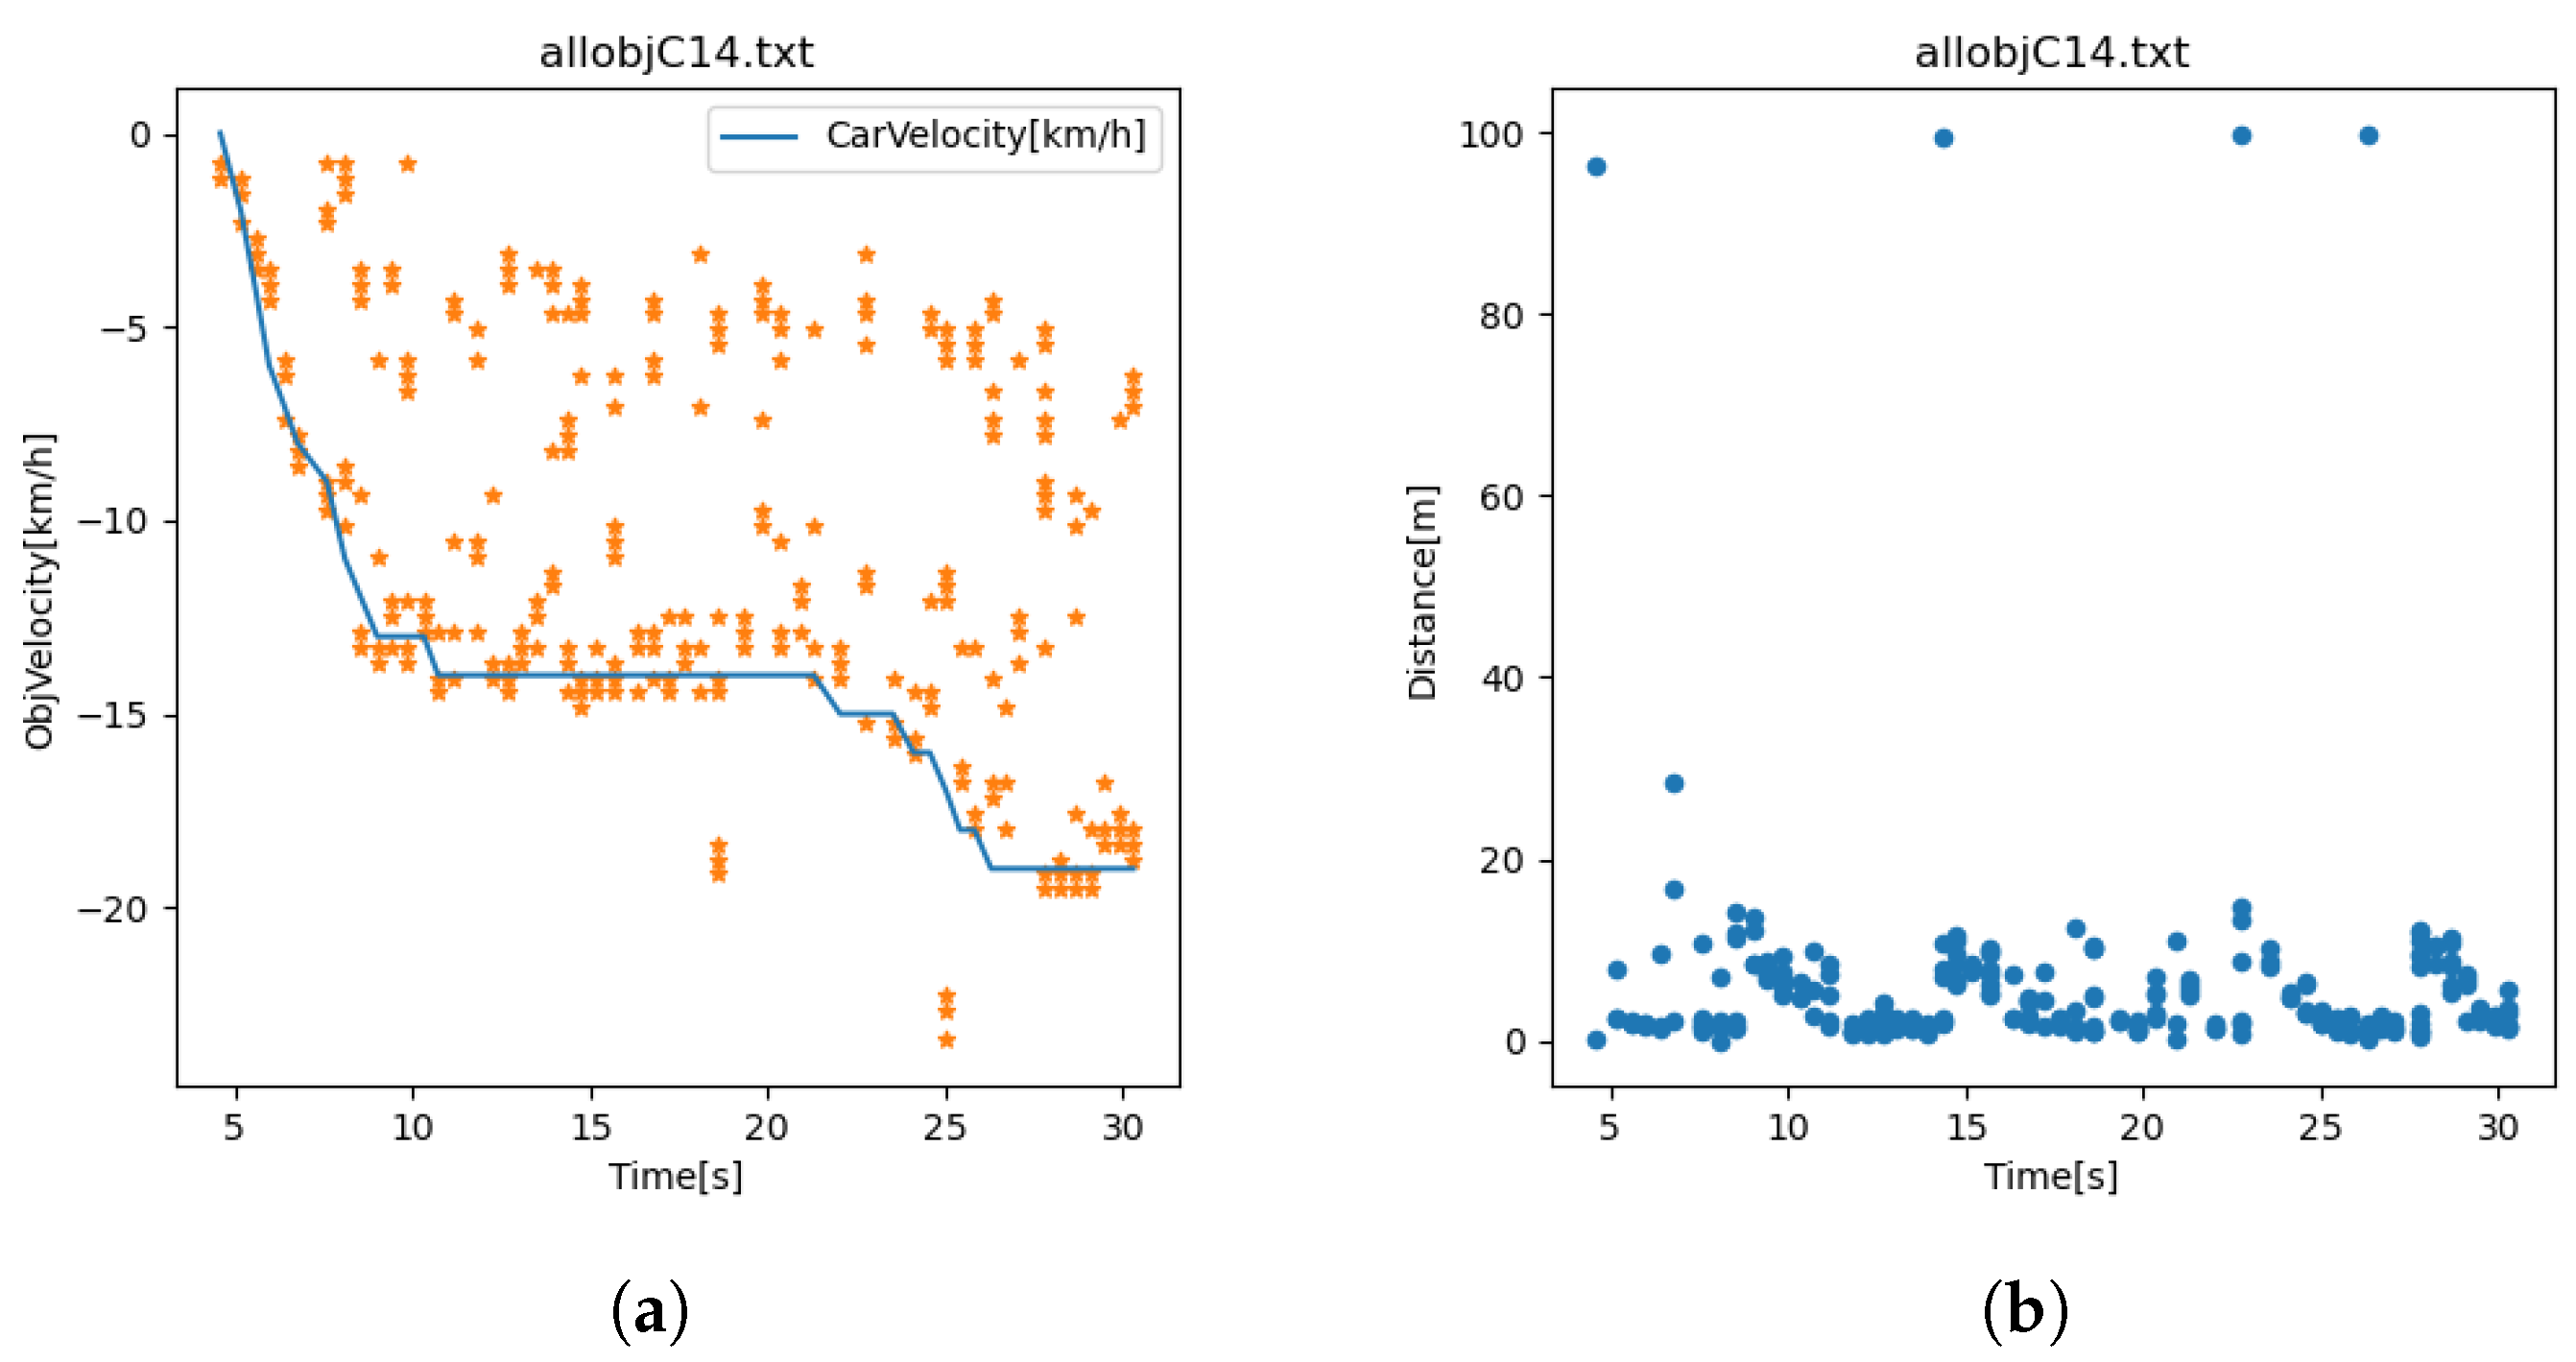
We first drove the car on a road to test the detection of stationary objects on the right side of the road. Shown in Figure 8a are the instantaneous velocity of the car read by the OBD and the velocities of multiple surrounding stationary objects detected by the radar sensor. As indicated in Figure 3a, the detected speeds of surrounding stationary objects should be less than or equal to the car’s speed in theory. However, this may not be the case in practice because of errors in the readings of the OBD and radar sensor, as shown in Figure 8b. As indicated by Figure 8b, the speed of a surrounding stationary object detected by the radar could be up to 2 km/h larger than the car’s speed read by the OBD, so to account for the errors, a collision threat as illustrated in Figure 3b was detected only when its speed was at least 3 km/h larger than the car’s speed.
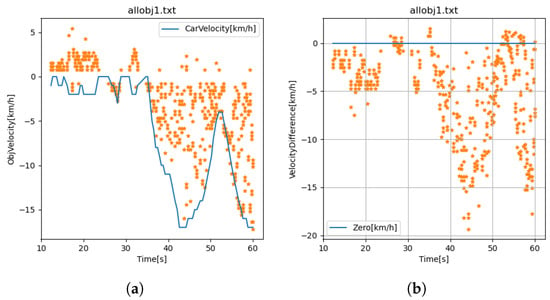
Figure 8.
Error assessment of the radar sensor and OBD mounted on a car driving in stationary surroundings: (a) velocity vs. time; (b) velocity difference vs. time, where the velocity difference is the car’s velocity minus the velocity of a detected object.
With all preliminary tests complete, we began running field simulation tests. The field setup is shown in Figure 2b, which is a scaled-down simulation. The car approached the reflector from the alleyway, and one author walked back and forth in front of the reflector from the house’s back driveway, orthogonal to the alleyway.
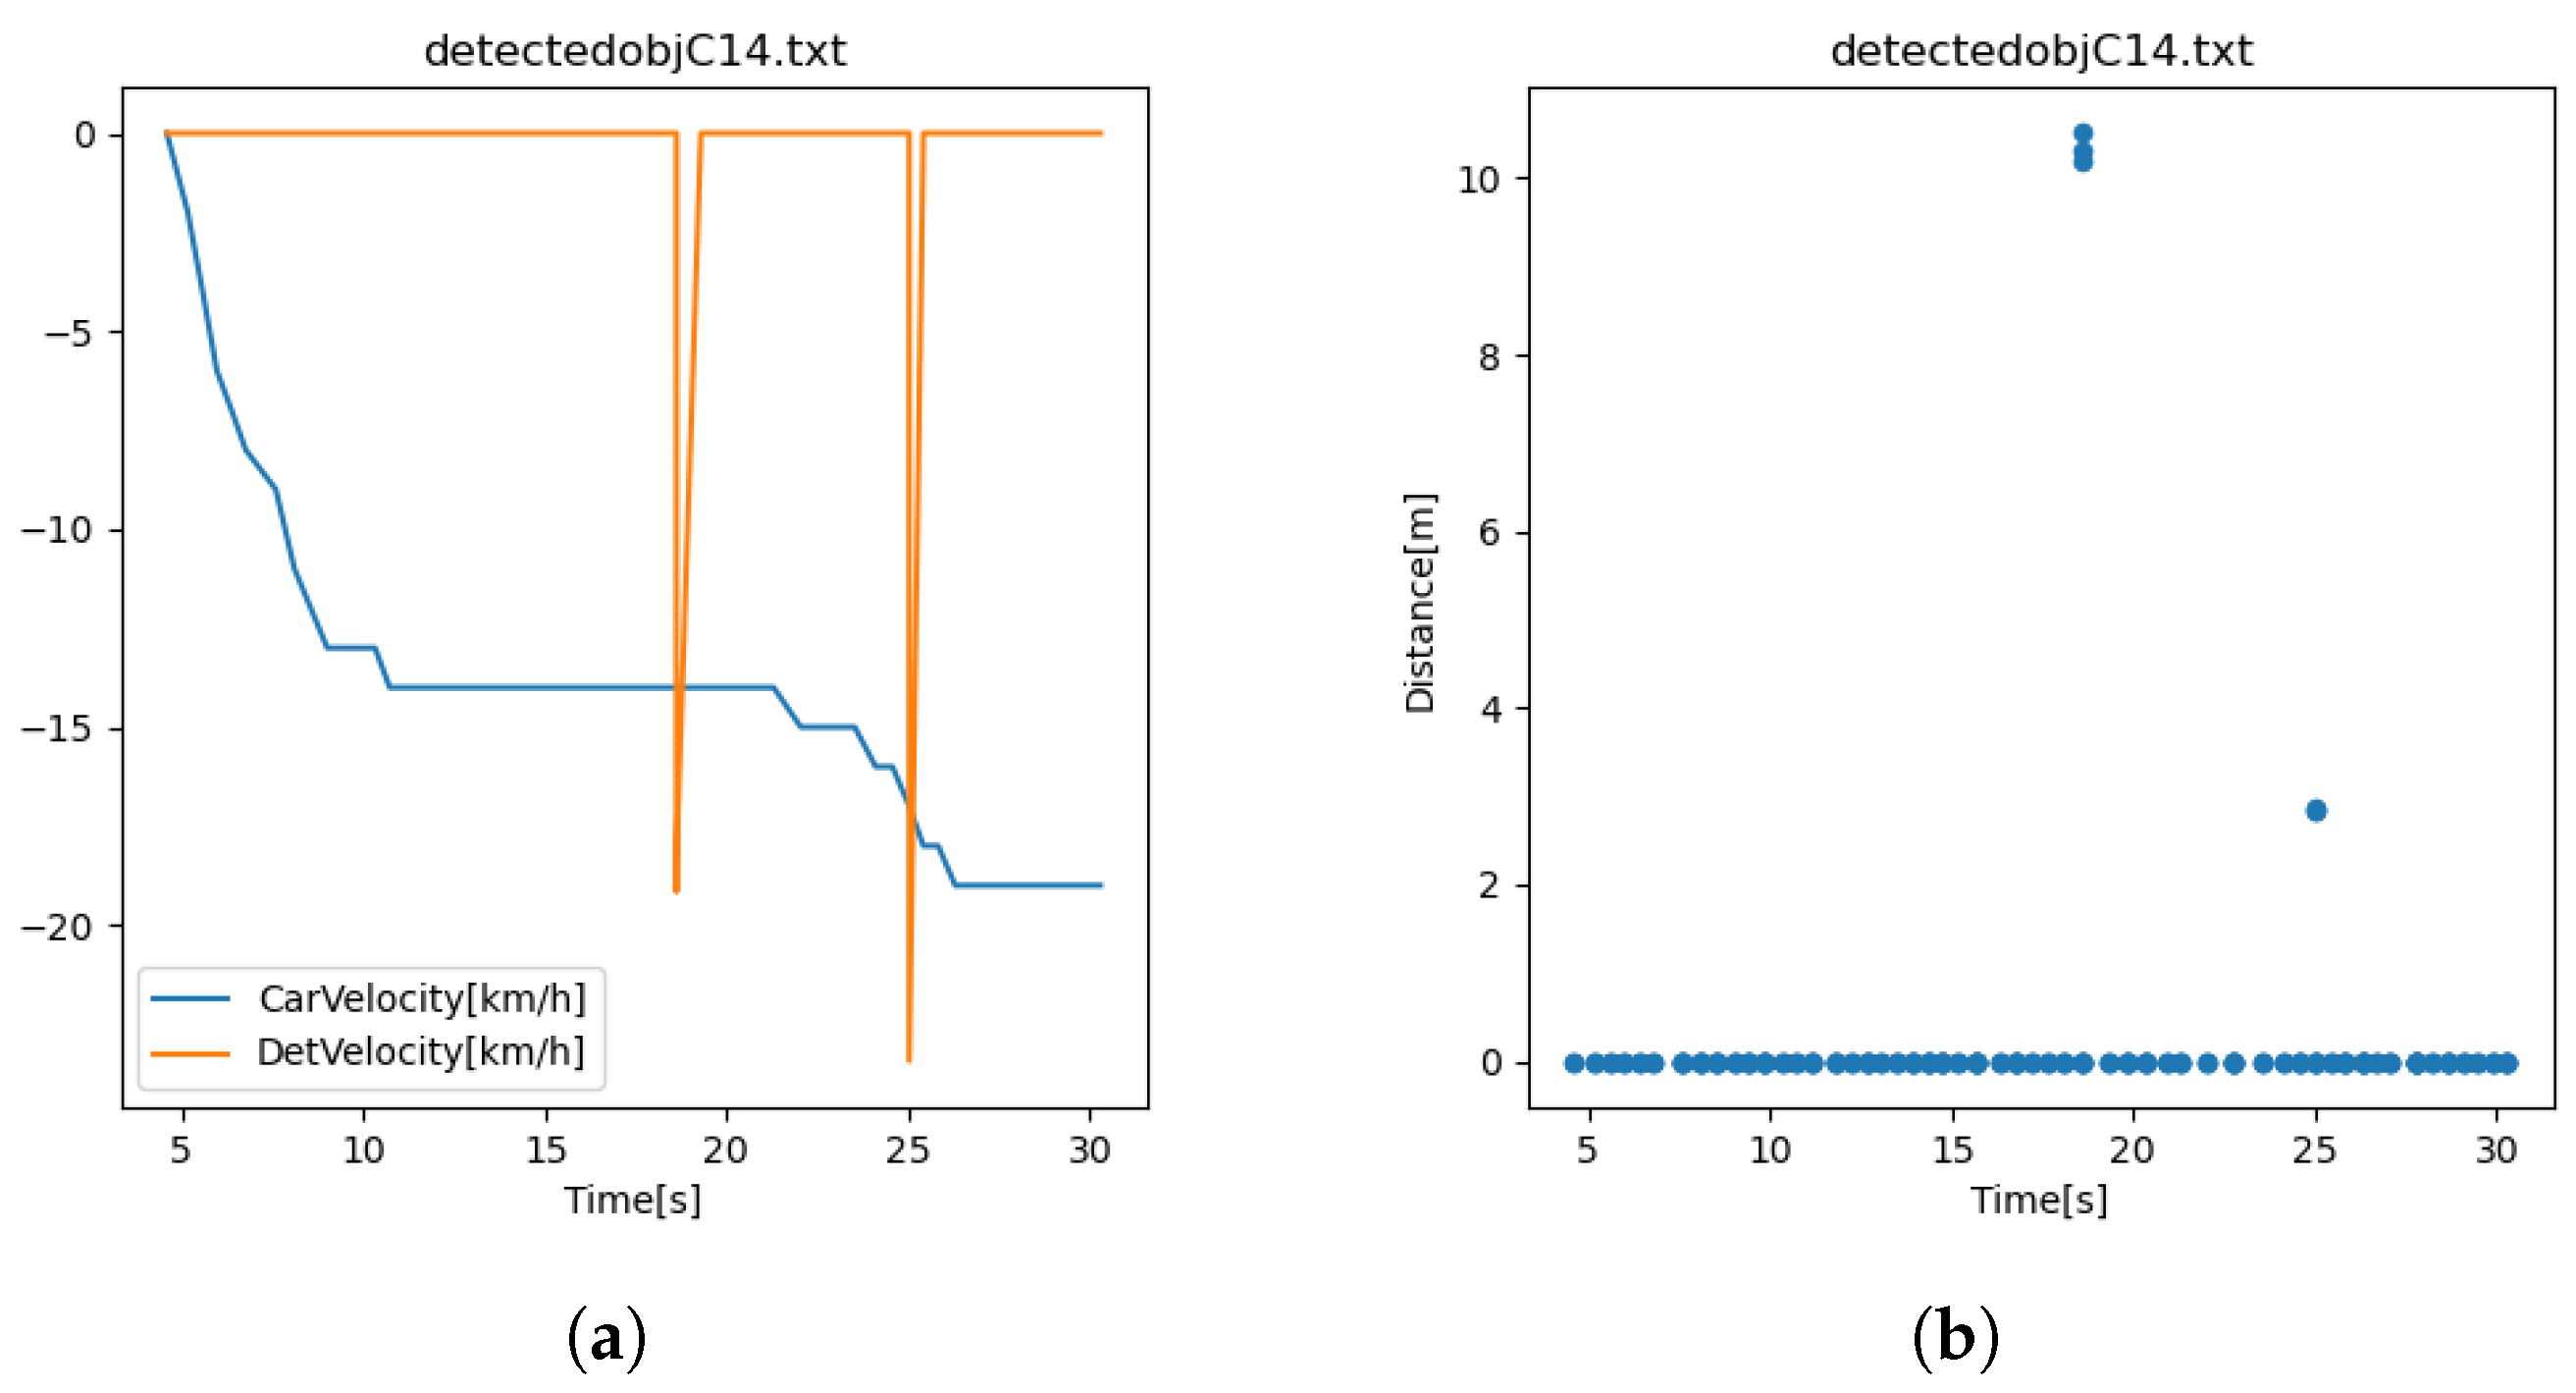
The blue line in Figure 9a is the instantaneous velocity of the car as read by the OBD. The orange points represent all detected objects. Figure 9b shows the corresponding detection ranges. Figure 10a shows two detected collision threats, as the author walked back and forth twice in front of the reflector when the car approached the reflector. Figure 10b shows that the detection distance decreased from the first to the second threat.
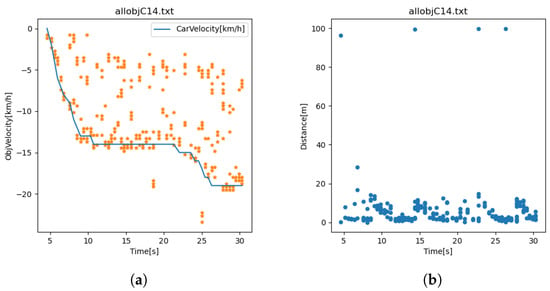
Figure 9.
Detection of all objects: (a) velocity vs. time; (b) range vs. time.
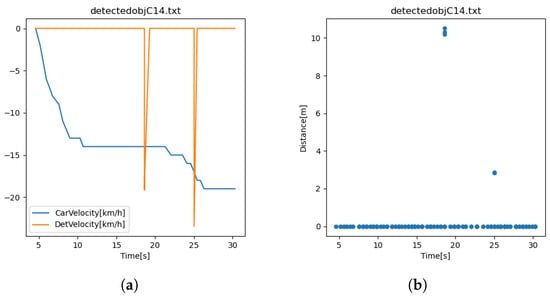
Figure 10.
Detection of an approaching object: (a) velocity vs. time; (b) range vs. time.
Because radar detection does not rely on lighting conditions, the CornerGuard worked equally well when tested in dark and misty weather conditions.
The latency of the system is the time taken for data to go from the radar source to the detection algorithm output. It depends on the radar sensor, the baud rate, and the data processing algorithm. It was difficult to measure the latency. In broad terms, one might expect 40 ms latency at the analog acquisition and buffering stage, followed by a few milliseconds of processing latency, some non-deterministic network latency of maybe 5 ms [14], and finally a few milliseconds latency at the algorithm end. These numbers combine to give a total of around 50 ms. In most situations, it was reasonable to assume a latency of around 50 ms as a good working value. If the car speed is 50 mph, the distance traveled by the car in a latency of 50 ms is about 1 m.
4. Conclusions
The objective of the proof-of-concept work presented in this paper was to create a device to alert a driver of an impending collision with a non-LOS pedestrian or automobile around a corner at right. The devised solution, the CornerGuard, involved using a stationary radar wave reflector to reflect emitted radar waves to detect impending broadside collision threats.
Field trials and simulations demonstrated that the prototype CornerGuard can operate effectively and consistently in a range with no blind spots. It works well in darkness and broad weather conditions. It is also cost-friendly.
In future work, an even stronger radar sensor with a larger range and more sensitivity can be implemented, and the radar wave reflector’s geometry can be further refined.
The CornerGuard can readily be implemented. By integrating the radar sensor and detection logic with car construction and strategically installing reflectors in collision-prone intersections, the rate of broadside collisions due to distraction and limited visibility can be reduced to save lives.
Author Contributions
Conceptualization, V.X.; methodology, V.X.; software, V.X. and S.X.; investigation, V.X. and S.X.; formal analysis, V.X. and S.X.; writing—original draft preparation, V.X.; writing—review and editing, S.X.; visualization, V.X. and S.X.; supervision, S.X.; project administration, S.X. All authors have read and agreed to the published version of the manuscript.
Funding
This research recieved no external funding.
Data Availability Statement
The raw data supporting the conclusions of this article will be made available by the authors on request.
Conflicts of Interest
The authors declare no conflicts of interest.
Appendix A. Code
Below is the code to communicate with the radar sensor, analyze the data, and implement the detection algorithm.
- # Script to read out raw target data from RFbeam K-LD7 and speed of car
- $ from OBD2, detect approaching object around corner, and save data
- # to files
- #
- # Author: Victor Xu, Sheng Xu
- # Date: Nov and Dec 2023
- # Python Version: 3#
- # Notes: Use correct COM Port (specifed by port properties
- # in device manager (in Windows) for each serial device
- # and make sure all modules are installed before executing
- import time
- import serial
- import matplotlib.pyplot as plt
- import numpy as np
- import math
- import obd
- import re
- import winsound
- print(’Start tracking!’)
- # specify runtime, data file names
- runtime = 0.5 # minutes
- speederror = -3 # km/h
- dur = 1000 # milisecond, duration of alerting sound
- allobjfile = ’allobj282.txt’ # all objects
- detectedobjfile = ’detectedobj282.txt’ # target object
- # specify correct COM USB ports for serial devices
- COM_Port = ’COM8’ # port for radar sensor
- OBD_Port = ’COM9’ # port for OBD2
- # create serial object with corresponding COM Port and open it
- com_obj=serial.Serial(COM_Port)
- print(com_obj)
- com_obj.baudrate=115200
- com_obj.parity=serial.PARITY_EVEN
- com_obj.stopbits=serial.STOPBITS_ONE
- com_obj.bytesize=serial.EIGHTBITS
- # connect to sensor and set baudrate
- payloadlength = (4).to_bytes(4, byteorder=’little’)
- value = (0).to_bytes(4, byteorder=’little’)
- header = bytes(“INIT”, ’utf-8’)
- cmd_init = header+payloadlength+value
- com_obj.write(cmd_init)
- # get response
- response_init = com_obj.read(9)
- if response_init[8] != 0:
- print(’Error during initialisation for K-LD7’)
- else:
- print(’K-LD7 successfully initialized!’)
- # delay 75ms
- time.sleep(0.075)
- # change to higher baudrate
- com_obj.baudrate = 115200
- # change max speed to 50km/h
- value = (2).to_bytes(4, byteorder=’little’)
- header = bytes(“RSPI”, ’utf-8’)
- cmd_frame = header+payloadlength+value
- com_obj.write(cmd_frame)
- # get response
- response_init = com_obj.read(9)
- if response_init[8] != 0:
- print(’Error: Command not acknowledged’)
- else:
- print(’Max speed successfully set!’)
- # change max range to 100m
- value = (3).to_bytes(4, byteorder=’little’)
- header = bytes(“RRAI”, ’utf-8’)
- cmd_frame = header+payloadlength+value
- com_obj.write(cmd_frame)
- # get response
- response_init = com_obj.read(9)
- if response_init[8] != 0:
- print(’Error: Command not acknowledged’)
- else:
- print(’Max distance successfully set!’)
- # create figure for real-time plotting
- fig = plt.figure(figsize=(10,5))
- plt.ion()
- plt.show()
- starttime=time.time()
- connection = obd.OBD(OBD_Port) # create connection with USB 0
- print(’OBD2 successfully connected!’)
- detobj = open(detectedobjfile,’w’)
- allobj = open(allobjfile,’w’)
- # readout and plot PDAT data continuously
- # for ctr in range(100):
- while 1:
- # request next frame data
- PDAT = (4).to_bytes(4, byteorder=’little’)
- header = bytes(“GNFD”, ’utf-8’)
- cmd_frame = header+payloadlength+PDAT
- com_obj.write(cmd_frame)
- # get acknowledge
- resp_frame = com_obj.read(9)
- if resp_frame[8] != 0:
- print(’Error: Command not acknowledged’)
- # get header
- resp_frame = com_obj.read(4)
- # get payload len
- resp_len = com_obj.read(4)
- # initialize arrays
- distances_x = np.zeros(100)
- distances_y = np.zeros(100)
- speeds = np.zeros(100)
- distances = np.zeros(100)
- angles = np.zeros(100)
- i = 0
- length = resp_len[0]
- # get data, until payloadlen is zero
- while length > 0:
- PDAT_Distance = np.frombuffer(com_obj.read(2), dtype=np.uint16)
- PDAT_Speed = np.frombuffer(com_obj.read(2), dtype=np.int16)/100
- PDAT_Angle = math.radians(np.frombuffer(com_obj.read(2),\
- dtype=np.int16)/100)
- PDAT_Magnitude = np.frombuffer(com_obj.read(2), dtype=np.uint16)
- distances_x[i] = -(PDAT_Distance * math.sin(PDAT_Angle))/100
- distances_y[i] = PDAT_Distance * math.cos(PDAT_Angle)/100
- distances[i] = PDAT_Distance/100
- speeds[i] = PDAT_Speed
- angles[i] = math.degrees(PDAT_Angle)
- i = i + 1
- # subtract stored datalen from payloadlen
- length = length - 8
- # current time
- lapsedtime = time.time()-starttime
- # read car speed from obd and convert it to float
- cmd = obd.commands.SPEED # select an OBD command (sensor)
- response = connection.query(cmd) # send the command,
- # and parse the response
- speedstring = str(response.value)
- print(speedstring) # in km/h
- speedstr=re.findall(r"[-+]?\d*\.?\d+|[-+]?\d+",speedstring)[0]
- carspeed=-float(speedstr)
- print(carspeed)
- # clear figure
- plt.clf()
- # plot speed/distance
- if np.count_nonzero(distances)==0:
- print(lapsedtime,carspeed,0.0,0.0,0.0,sep=’,’,end=’\n’,file=allobj)
- print(lapsedtime,carspeed,0.0,0.0,0.0,sep=’,’,end=’\n’,file=detobj)
- sub1 = plt.subplot(121)
- for j in range(np.count_nonzero(distances)):
- print(lapsedtime,carspeed,speeds[j],distances[j],angles[j],\
- sep=’,’,end=’\n’,file=allobj)
- if speeds[j]<carspeed+speederror:
- print(“Approaching object around corner detected!”)
- freq = 1000
- if distances[j]<5:
- freq = 3000 # Hz, sound frequency
- winsound.Beep(freq,dur)
- print(lapsedtime,carspeed,speeds[j],distances[j],angles[j],\
- sep=’,’,end=’\n’,file=detobj)
- else:
- print(lapsedtime,carspeed,0.0,0.0,0.0,sep=’,’,end=’\n’,\
- file=detobj)
- point_Sub1, = sub1.plot(speeds[j],distances[j],\
- marker=’o’,markersize=15, markerfacecolor=’b’,\
- markeredgecolor=’k’)
- plt.grid(True)
- plt.axis([-75, 75, 0, 100])
- plt.title(’Distance / Speed’)
- plt.xlabel(’Speed [km/h]’)
- plt.ylabel(’Distance [m]’)
- # plot distance/distance
- sub2 = plt.subplot(122)
- for y in range(np.count_nonzero(distances_x)):
- if speeds[y] > 0 :
- point_Sub2, = sub2.plot(distances_x[y], distances_y[y],\
- marker=’o’, markersize=15,markerfacecolor=’g’,\
- markeredgecolor=’k’)
- else:
- point_Sub2, = sub2.plot(distances_x[y], distances_y[y],\
- marker=’o’,markersize=15,markerfacecolor=’r’,\
- markeredgecolor=’k’)
- plt.grid(True)
- plt.axis([-10, 10, 0, 100])
- plt.title(’Distance / Distance \n (Green: Receding, Red: Approaching)’)
- plt.xlabel(’Distance [m]’)
- plt.ylabel(’Distance [m]’)
- # draw no. of targets
- plt.text(0.8, 0.95,’No. of targets: ’ +
- \str(np.count_nonzero(distances)), horizontalalignment=’center’,\
- verticalalignment=’center’, transform = sub2.transAxes)
- # draw figure
- fig.canvas.draw()
- fig.canvas.flush_events()
- # reset arrays
- distances_x = np.zeros(100)
- distances_y = np.zeros(100)
- speeds = np.zeros(100)
- distances = np.zeros(100)
- i = 1
- # exit when time is up
- if lapsedtime>runtime*60: #lapsed time>runtime in minutes
- print(’Trial ends!’)
- break
- # close files
- detobj.close()
- allobj.close()
- # disconnect from sensor
- payloadlength = (0).to_bytes(4, byteorder=’little’)
- header = bytes(“GBYE”, ’utf-8’)
- cmd_frame = header+payloadlength
- com_obj.write(cmd_frame)
- # get response
- response_gbye = com_obj.read(9)
- if response_gbye[8] != 0:
- print(“Error during disconnecting with K-LD7”)
- # close connection to COM port
- com_obj.close()
References
- Kilduff, E. Where Do Broadside Collisions Most Commonly Occur? 2021. Available online: https://emrochandkilduff.com/where-broadside-collisions-occur/ (accessed on 12 June 2024).
- Ahmed, S.K.; Mohammed, M.G.; Abdulqadir, S.O.; El-Kader, R.G.A.; El-Shall, N.A.; Chandran, D.; Rehman, M.E.U.; Dhama, K. Road traffic accidental injuries and deaths: A neglected global health issue. Health Sci. Rep. 2023, 6, e1240. [Google Scholar] [CrossRef]
- Ma, Y.; Anderson, J.; Crouch, S.; Shan, J. Moving Object Detection and Tracking with Doppler LiDar. Remote Sens. 2019, 11, 1154. [Google Scholar] [CrossRef]
- Vivet, D.; Checchin, P.; Chapuis, R.; Faure, P.; Rouveure, R.; Monod, M.O. A mobile ground-based radar sensor for detection and tracking of moving objects. EURASIP J. Adv. Signal Process. 2012, 2012, 45. [Google Scholar] [CrossRef]
- Singh, S.; Liang, Q.; Chen, D.; Sheng, L. Sense through wall human detection using UWB radar. EURASIP J. Wirel. Commun. Netw. 2011, 2011, 20. [Google Scholar] [CrossRef]
- Gennarelli, G.L.; Soldovieri, F. Real-Time Through-Wall Situation Awareness Using a Microwave Doppler Radar Sensor. Remote Sens. 2016, 8, 621. [Google Scholar] [CrossRef]
- Gariepy, G.; Tonolini, F.; Henderson, R.; Leach, J.; Faccio, D. Detection and tracking of moving objects hidden from view. Nat. Photonics 2016, 10, 23–26. [Google Scholar] [CrossRef]
- Chan, S.; Warburton, R.E.; Gariepy, G.; Leach, J.; Faccio, D. Non-line-of-sight tracking of people at long range. Opt. Express 2017, 25, 10109–10117. [Google Scholar] [CrossRef] [PubMed]
- Faccio, D.; Velten, A.; Wetzstein, G. Non-line-of-sight imaging. Nat. Rev. Phys. 2020, 2, 318–327. [Google Scholar] [CrossRef]
- Czajkowski, R.; Murray-Bruce, J. Two-edge-resolved three-dimensional non-line-of-sight imaging with an ordinary camera. Nat. Commun. 2024, 15, 1162. [Google Scholar] [CrossRef] [PubMed]
- Johansson, T.; Örbom, A.; Sume, A.; Rahm, J.; Nilsson, S.; Herberthson, M.; Gustafsson, M.; Andersson, Å. Radar measurements of moving objects around corners in a realistic scene. Proc. SPIE 2014, 9077, 90771Q. [Google Scholar] [CrossRef]
- Yue, S.; He, H.; Cao, P.; Zha, K.; Koizumi, M.; Katabi, D. CornerRadar: RF-Based Indoor Localization Around Corners. Proc. ACM Interact. Mob. Wearable Ubiquitous Technol. 2022, 6, 1–24. [Google Scholar] [CrossRef]
- Wolf, G.; Gasper, E.; Stoke, J.; Kretchman, J.; Anderson, D.; Czuba, N.; Oberoi, S.; Pujji, L.; Lyublinskaya, I.; Ingram, D.; et al. Section 17.4: The Doppler Effect. In College Physics 2e. for AP Courses; OpenStax, Rice University: Houston, TX, USA, 2022; ISBN-13: 978-1-951693-61-9; Available online: https://openstax.org/details/books/college-physics-ap-courses-2e (accessed on 12 June 2024).
- Helliar, R. Measuring Latency from Radar Interfacing to Display. 2024. Available online: https://www.unmannedsystemstechnology.com/feature/measuring-latency-from-radar-interfacing-to-display/ (accessed on 12 June 2024).
Disclaimer/Publisher’s Note: The statements, opinions and data contained in all publications are solely those of the individual author(s) and contributor(s) and not of MDPI and/or the editor(s). MDPI and/or the editor(s) disclaim responsibility for any injury to people or property resulting from any ideas, methods, instructions or products referred to in the content. |
© 2024 by the authors. Licensee MDPI, Basel, Switzerland. This article is an open access article distributed under the terms and conditions of the Creative Commons Attribution (CC BY) license (https://creativecommons.org/licenses/by/4.0/).

