Impacts of a Toll Information Sign and Toll Lane Configuration on Queue Length and Collision Risk at a Toll Plaza with a High Percentage of Heavy Vehicles
Abstract
1. Introduction
2. Literature Review
2.1. Impacts on Lane Changes
2.2. Impacts on Collisions
2.3. Impacts on Risk of Collision
2.4. Impacts on Traffic Performance
2.5. Research Gaps
3. Methods and Data
3.1. Description of Data
3.2. VISSIM Traffic Simulation
3.3. Estimation of Collision Risk
4. Results and Discussion
4.1. Experiment 1—Impacts of the Presence and Location of the Toll Information Sign
4.2. Experiment 2—Impacts of New Toll Lane Configurations on Estimated Traffic Demand
4.3. Experiment 3—Impacts of Current and New Toll Lane Configurations for Different Percentages of HVs
5. Conclusions and Recommendations
Author Contributions
Funding
Data Availability Statement
Acknowledgments
Conflicts of Interest
References
- National Transportation Safety Board. 2023. Available online: http://www.ntsb.gov (accessed on 22 June 2022).
- Abdelwahab, H.T.; Abdel-Aty, M. Artificial neural networks and logit models for traffic safety analysis of toll plazas. Transp. Res. Rec. J. Transp. Res. Board 2022, 1784, 115–125. [Google Scholar] [CrossRef]
- Coelho, M.C.; Farias, T.L.; Rouphail, N.M. Measuring and modeling emission effects for toll facilities. Transp. Res. Rec. J. Transp. Res. Board 2005, 1941, 136–144. [Google Scholar] [CrossRef]
- Yang, H.; Ozbay, K.; Bartin, B.; Ozturk, O. Assessing the safety effects of removing highway mainline barrier toll plazas. J. Transp. Eng. 2014, 140, 04014038. [Google Scholar] [CrossRef]
- Valdés, D.; Colucci, B.; Fisher, D.L.; Ruiz, J.; Colón, E.; García, R. Driving simulation of the safety and operation performance at a freeway toll plaza. Transp. Res. Rec. J. Transp. Res. Board 2016, 2602, 129–137. [Google Scholar] [CrossRef]
- Zhang, H.; Zhang, C.; Zhang, Y.; Ma, J.; He, J.; Liu, Z.; Yan, X.; Hong, Q. Calculation model of preposition distance of electronic toll collection signs based on lane changing behavior. MATEC Web Conf. 2020, 325, 01003. [Google Scholar] [CrossRef]
- Saad, M.; Abdel-Aty, M.; Lee, J. Analysis of driving behavior at expressway toll plazas. Transp. Res. Part F Traffic Psychol. Behav. 2019, 61, 163–177. [Google Scholar] [CrossRef]
- Abuzwidah, M.; Abdel-Aty, M. Crash risk analysis of different designs of toll plazas. Saf. Sci. 2018, 107, 77–84. [Google Scholar] [CrossRef]
- Chakraborty, M.; Stapleton, S.Y.; Ghamami, M.; Gates, T.J. Safety effectiveness of all-electronic toll collection systems. Adv. Transp. Stud. 2020, 2, 127–142. [Google Scholar]
- Xing, L.; He, J.; Abdel-Aty, M.; Cai, Q.; Li, Y.; Zheng, O. Examining traffic conflicts of upstream toll plaza using vehicles’ trajectory data. Accid. Anal. Prev. 2019, 125, 174–187. [Google Scholar] [CrossRef]
- Jehad, A.E.; Ismail, A.; Borhan, M.N.; Ishak, S.Z. Modelling and optimizing of Electronic Toll Collection (ETC) at Malaysian toll plazas using microsimulation models. Int. J. Eng. Technol. 2018, 7, 2304–2308. [Google Scholar] [CrossRef]
- McKinnon, I. Operational and Safety-Based Analyses of Varied Toll Lane Configurations. Master’s Thesis, University of Massachusetts, Amherst, MA, USA, 2013. [Google Scholar]
- Bains, M.S.; Arkatkar, S.S.; Anbumani, K.S.; Subramaniam, S. Optimizing and modeling tollway operations using microsimulation. Transp. Res. Rec. J. Transp. Res. Board 2017, 2615, 43–54. [Google Scholar] [CrossRef]
- Hamid, A.H.A. Simulation of traffic operation and management at Malaysian toll plazas using VISSIM. Malays. Univ. Transp. Res. Forum Conf. 2011, 13–21. [Google Scholar]
- Mittal, H.; Sharma, N. Operational optimization of toll plaza queue length using microscopic simulation VISSIM model. J. Algebr. Stat. 2022, 13, 418–425. [Google Scholar]
- Bari, C.; Gupta, U.; Chandra, S.; Antoniou, C.; Dhamaniya, A. Examining the effect of the Electronic Toll Collection (ETC) system on queue delay using a microsimulation approach at toll plaza—A case study of Ghoti toll plaza, India. In Proceedings of the 7th IEEE International Conference on Models and Technologies for Intelligent Transportation Systems (MT-ITS), Online, 16–17 June 2021; pp. 1–6. [Google Scholar]
- Windsor-Detroit Bridge Authority. Annual Report 2019–2020. 2022. Available online: https://www.gordiehoweinternationalbridge.com/en/corporate-reports (accessed on 22 June 2022).
- PTV AG. PTV VISSIM 2021 User Manual; PTV AG: Karlsruhe, Germany, 2021. [Google Scholar]
- WSP. Supplemental Travel Demand Modeling Technical Report Gordie Howe International Bridge; Michigan Department of Transportation: Lansing, MI, USA, 2018.
- Wang, H.; Zou, F.; Tian, J.; Guo, F.; Cai, Q. Analysis on lane capacity for expressway toll station using toll data. J. Adv. Transp. 2022, 2022, 9277000. [Google Scholar] [CrossRef]
- Al-Deek, H.M.; Mohammed, A.; Radwan, A.E. Operational benefits of electronic toll collection: Case study. J. Transp. Eng. 1997, 123, 467–477. [Google Scholar] [CrossRef]
- Woo, T.H.; Hoel, L.A. Toll plaza capacity and level of service. Transp. Res. Rec. 1991, 1320, 119–127. [Google Scholar]
- 407 Express Toll Route. 407 ETR Heavy Multiple Unit Vehicle Rate Chart. 2022. Available online: https://www.407etr.com/en/tolls/tolls/rate-chart-multi.html (accessed on 22 June 2022).
- IBI Group. Traffic and Revenue Forecaster: Windsor Gateway Project Origin-Destination Travel Surveys Summary Report; Transport Canada: Ottwa, ON, Canada, 2008.
- Liang, H.; Yang, S.; Pan, B. Probability model of driver’s choice behavior in toll plaza. IOP Conf. Ser. Earth Environ. Sci. 2019, 371, 052051. [Google Scholar] [CrossRef]
- Parmar, H.; Chakroborty, P.; Kunduc, D. Modelling automobile drivers toll-lane choice behaviour at a toll plaza using mixed logit model. In Proceedings of the 2nd Conference of Transportation Research Group of India (2nd CTRG), Kolkata, India, 12–15 December 2013. [Google Scholar]
- Durrani, U.; Lee, C.; Maoh, H. Calibrating the Wiedemann’s vehicle-following model using mixed vehicle-pair interactions. Transp. Res. Part C Emerg. Technol. 2016, 67, 227–242. [Google Scholar] [CrossRef]
- CDM Smith. US 231 Scottsville Road Scoping and Traffic Operations Study. Appendix B: VISSIM Development and Calibration Report; KYTC Item No. 3-8702.00; KKentucky Transportation Cabinet, Division of Planning: Warren County, KY, USA, 2014. [Google Scholar]
- Chrysler, S.T.; Williams, A.A.; Fitzpatrick, K. Driver Comprehension of Signing and Marking for Toll Facilities; Report No. FHWA/TX-08/0-5446-2; Texas Transportation Institute, The Texas A&M University System: College Station, TX, USA, 2008. [Google Scholar]
- Hydén, C. The Development of a Method for Traffic Safety Evaluation: The Swedish Traffic Conflict Techniques; Lund Institute of Technology, Department of Traffic Planning and Engineering: Lund, Sweden, 1987. [Google Scholar]
- Wang, C.; Stamatiadis, N. Surrogate safety measure for simulation-based conflict study. Transp. Res. Rec. J. Transp. Res. Board 2013, 2386, 72–80. [Google Scholar] [CrossRef]
- Gettman, D.; Pu, L.; Sayed, T.; Shelby, S. Surrogate Safety Assessment Model and Validation: Final Report; Report No. FHWA-HRT-08-051; Federal Highway Administration: McLean, VA, USA, 2008. [Google Scholar]
- Neuman, T.R. New approach to design for stopping sight distance. Transp. Res. Rec. 1989, 1208, 14–22. [Google Scholar]
- Mahdi, M.B.; Leong, L.V.; Sadullah, A.F.M. Use of Microscopic Traffic Simulation Software to Determine Heavy-Vehicle Influence on Queue Lengths at Toll Plazas. Arab. J. Sci. Eng. 2019, 44, 7297–7311. [Google Scholar] [CrossRef]
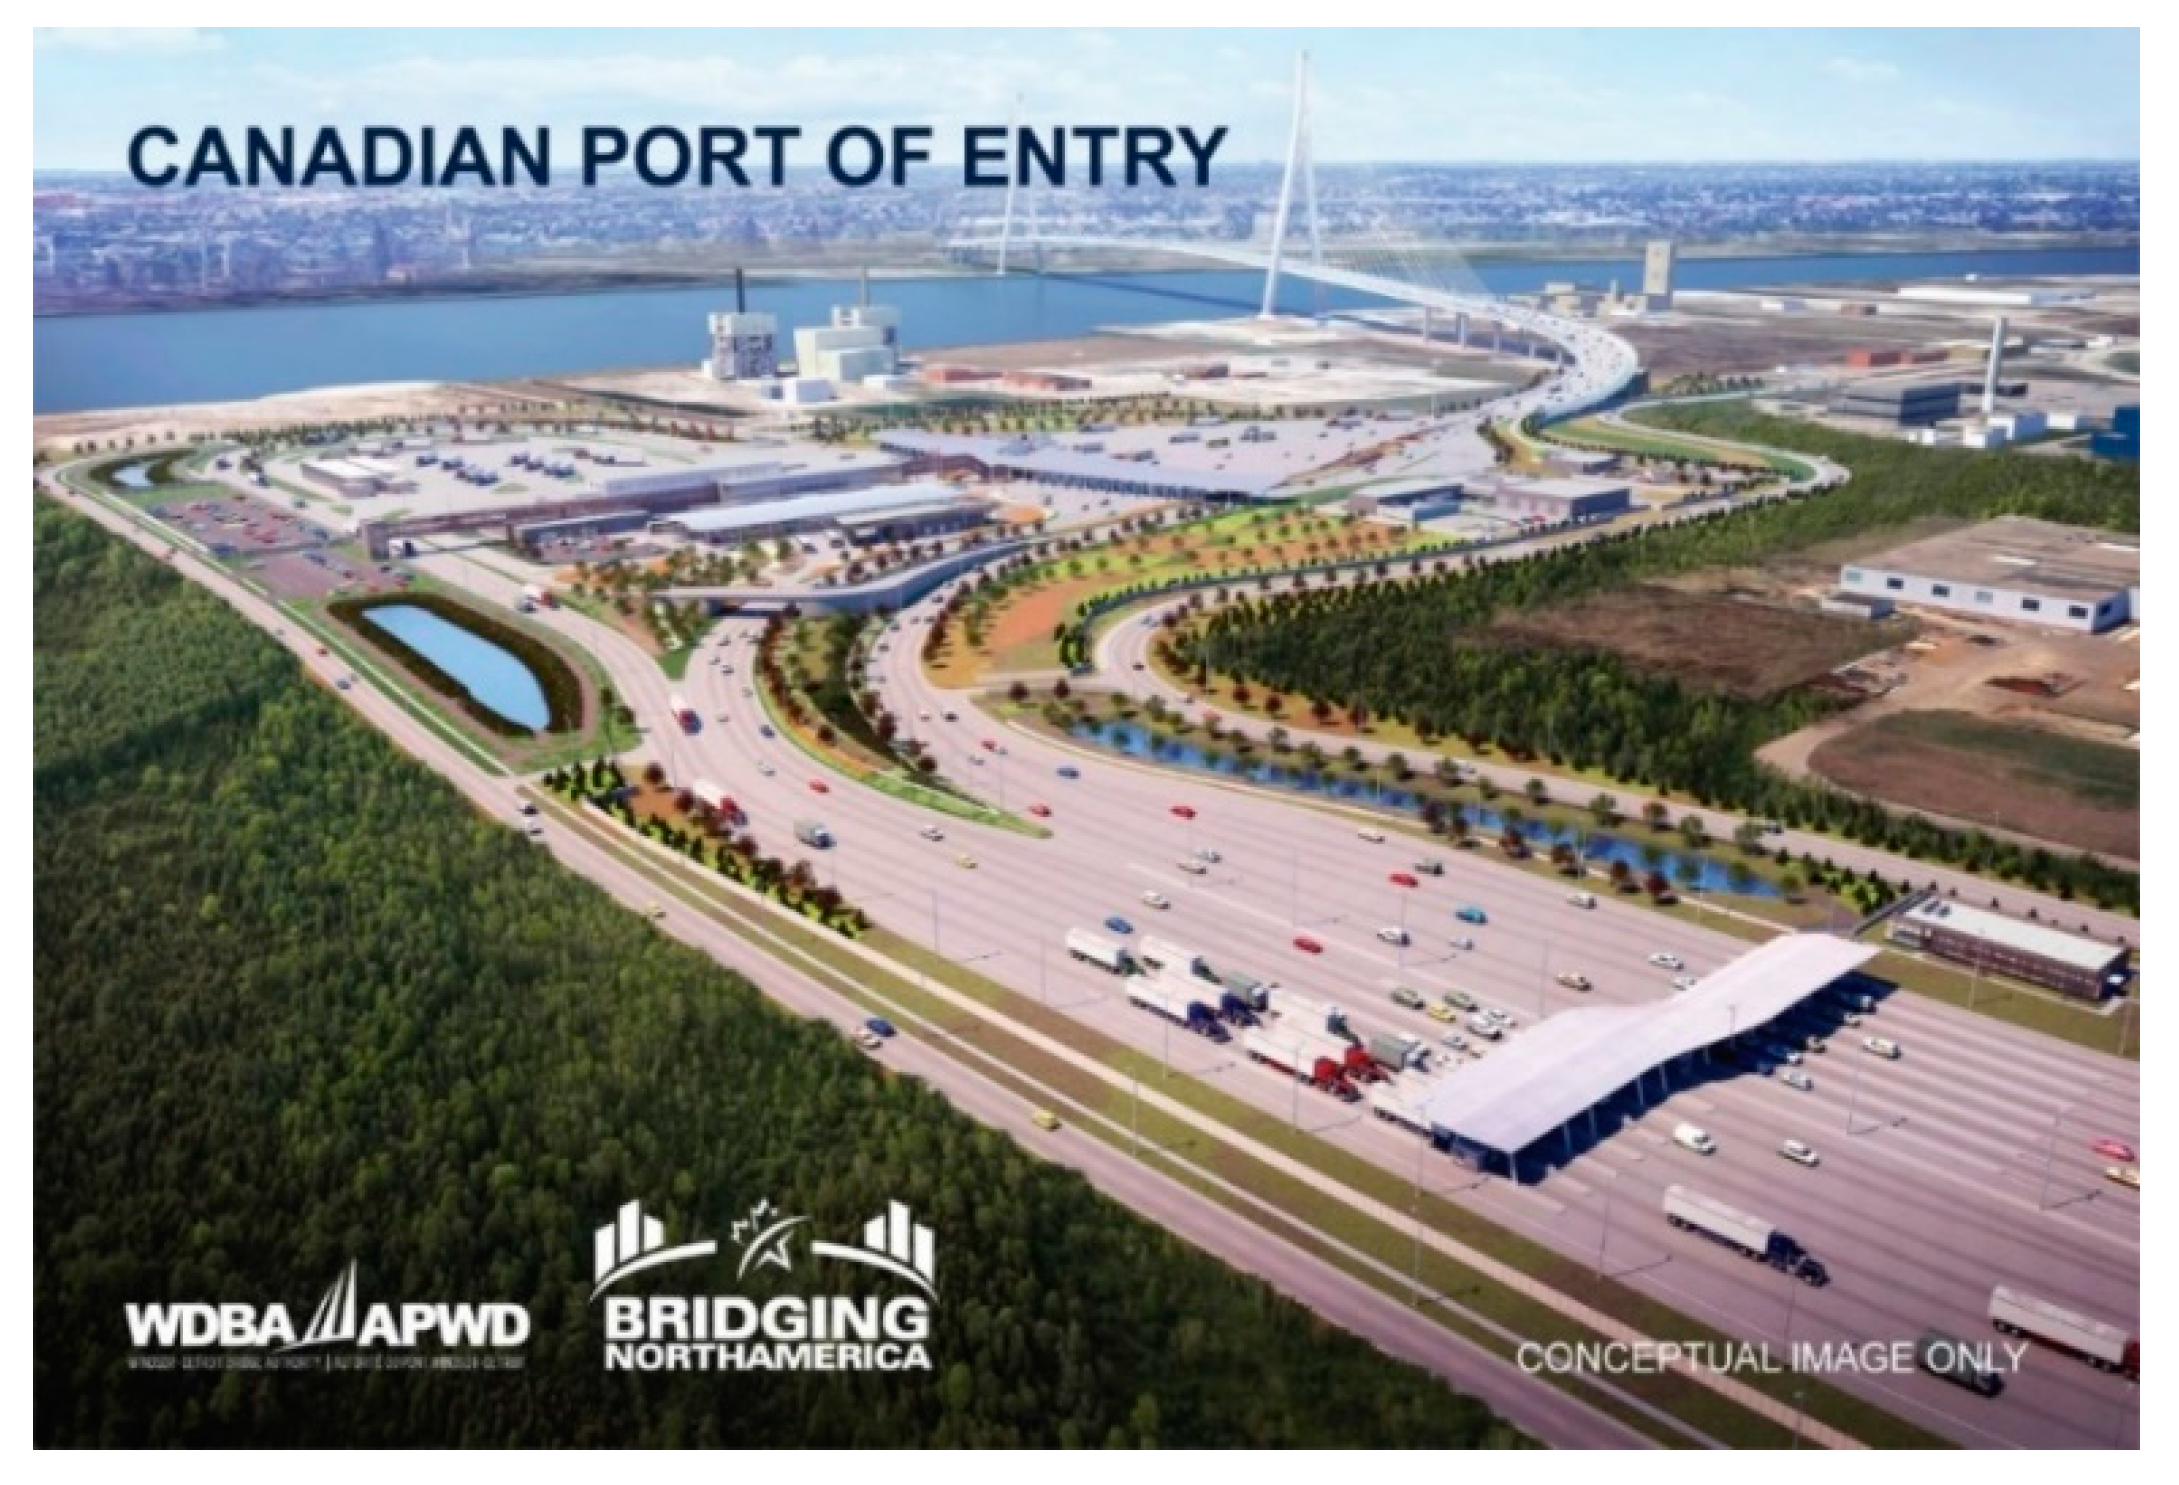

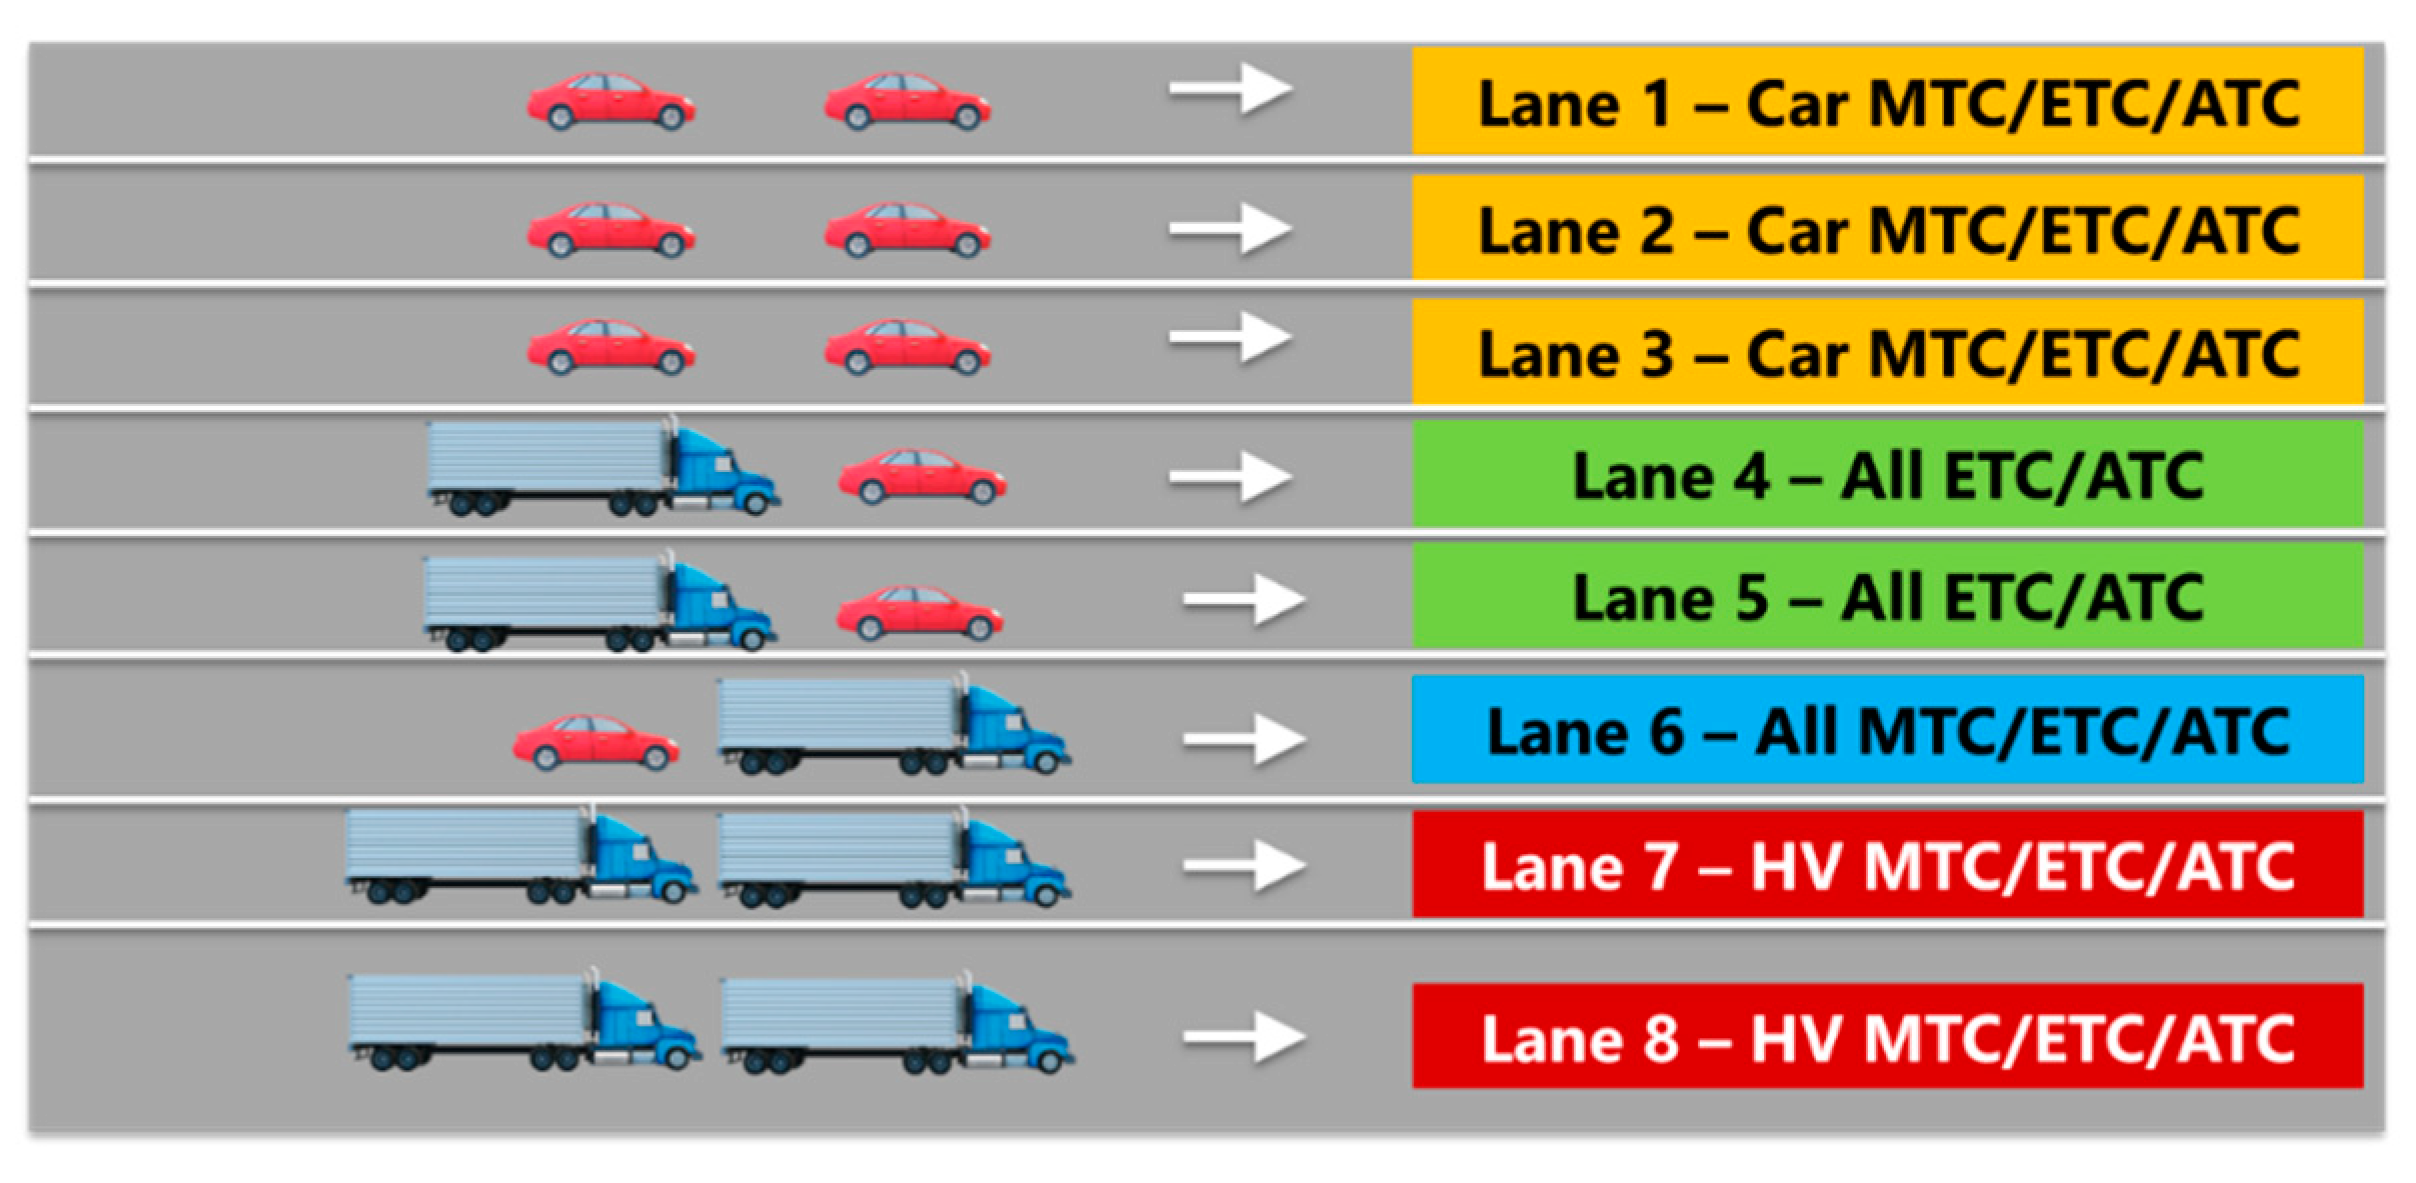
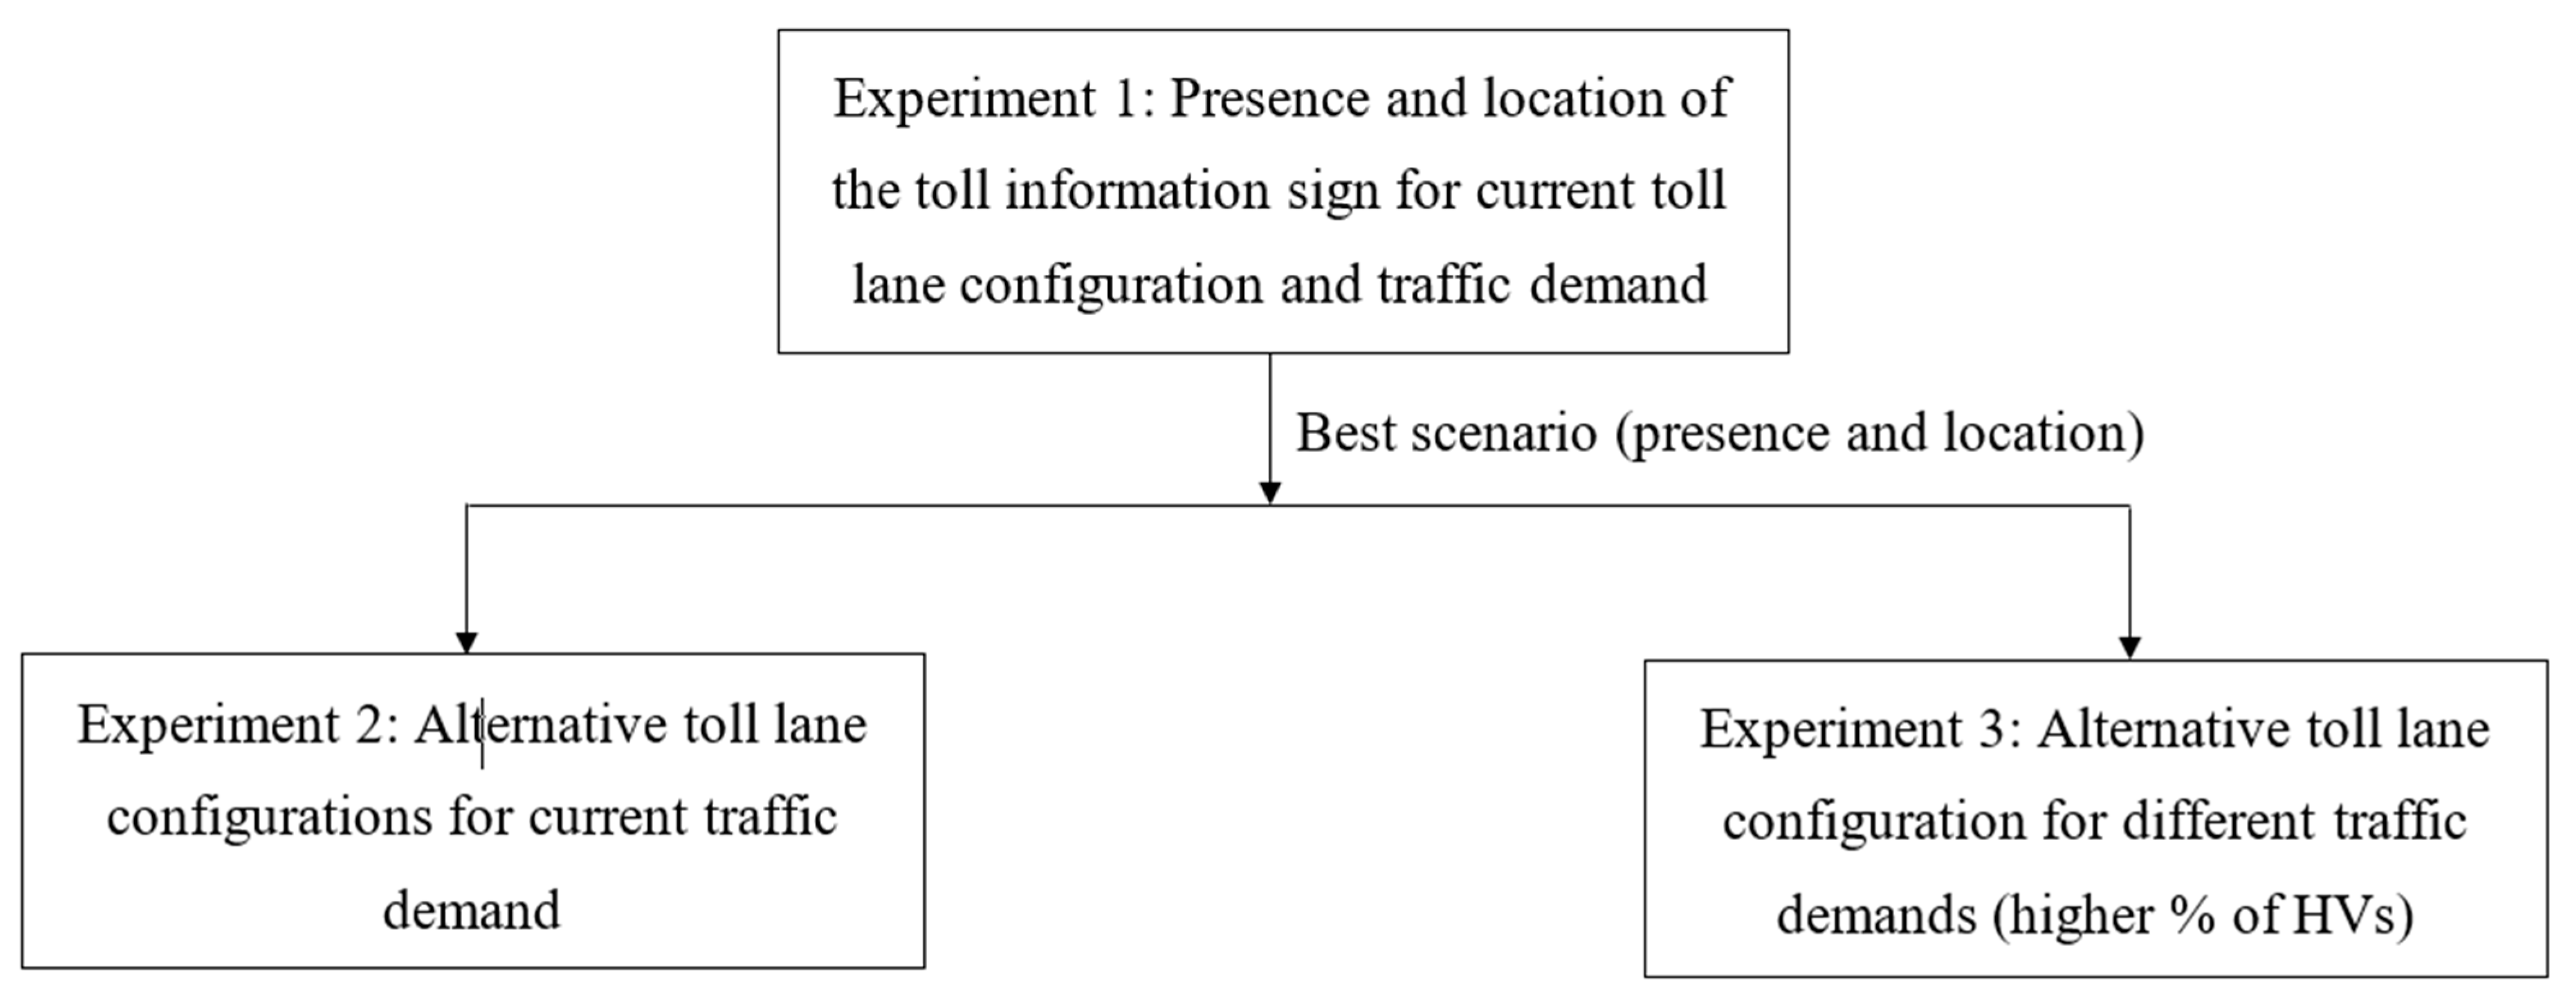
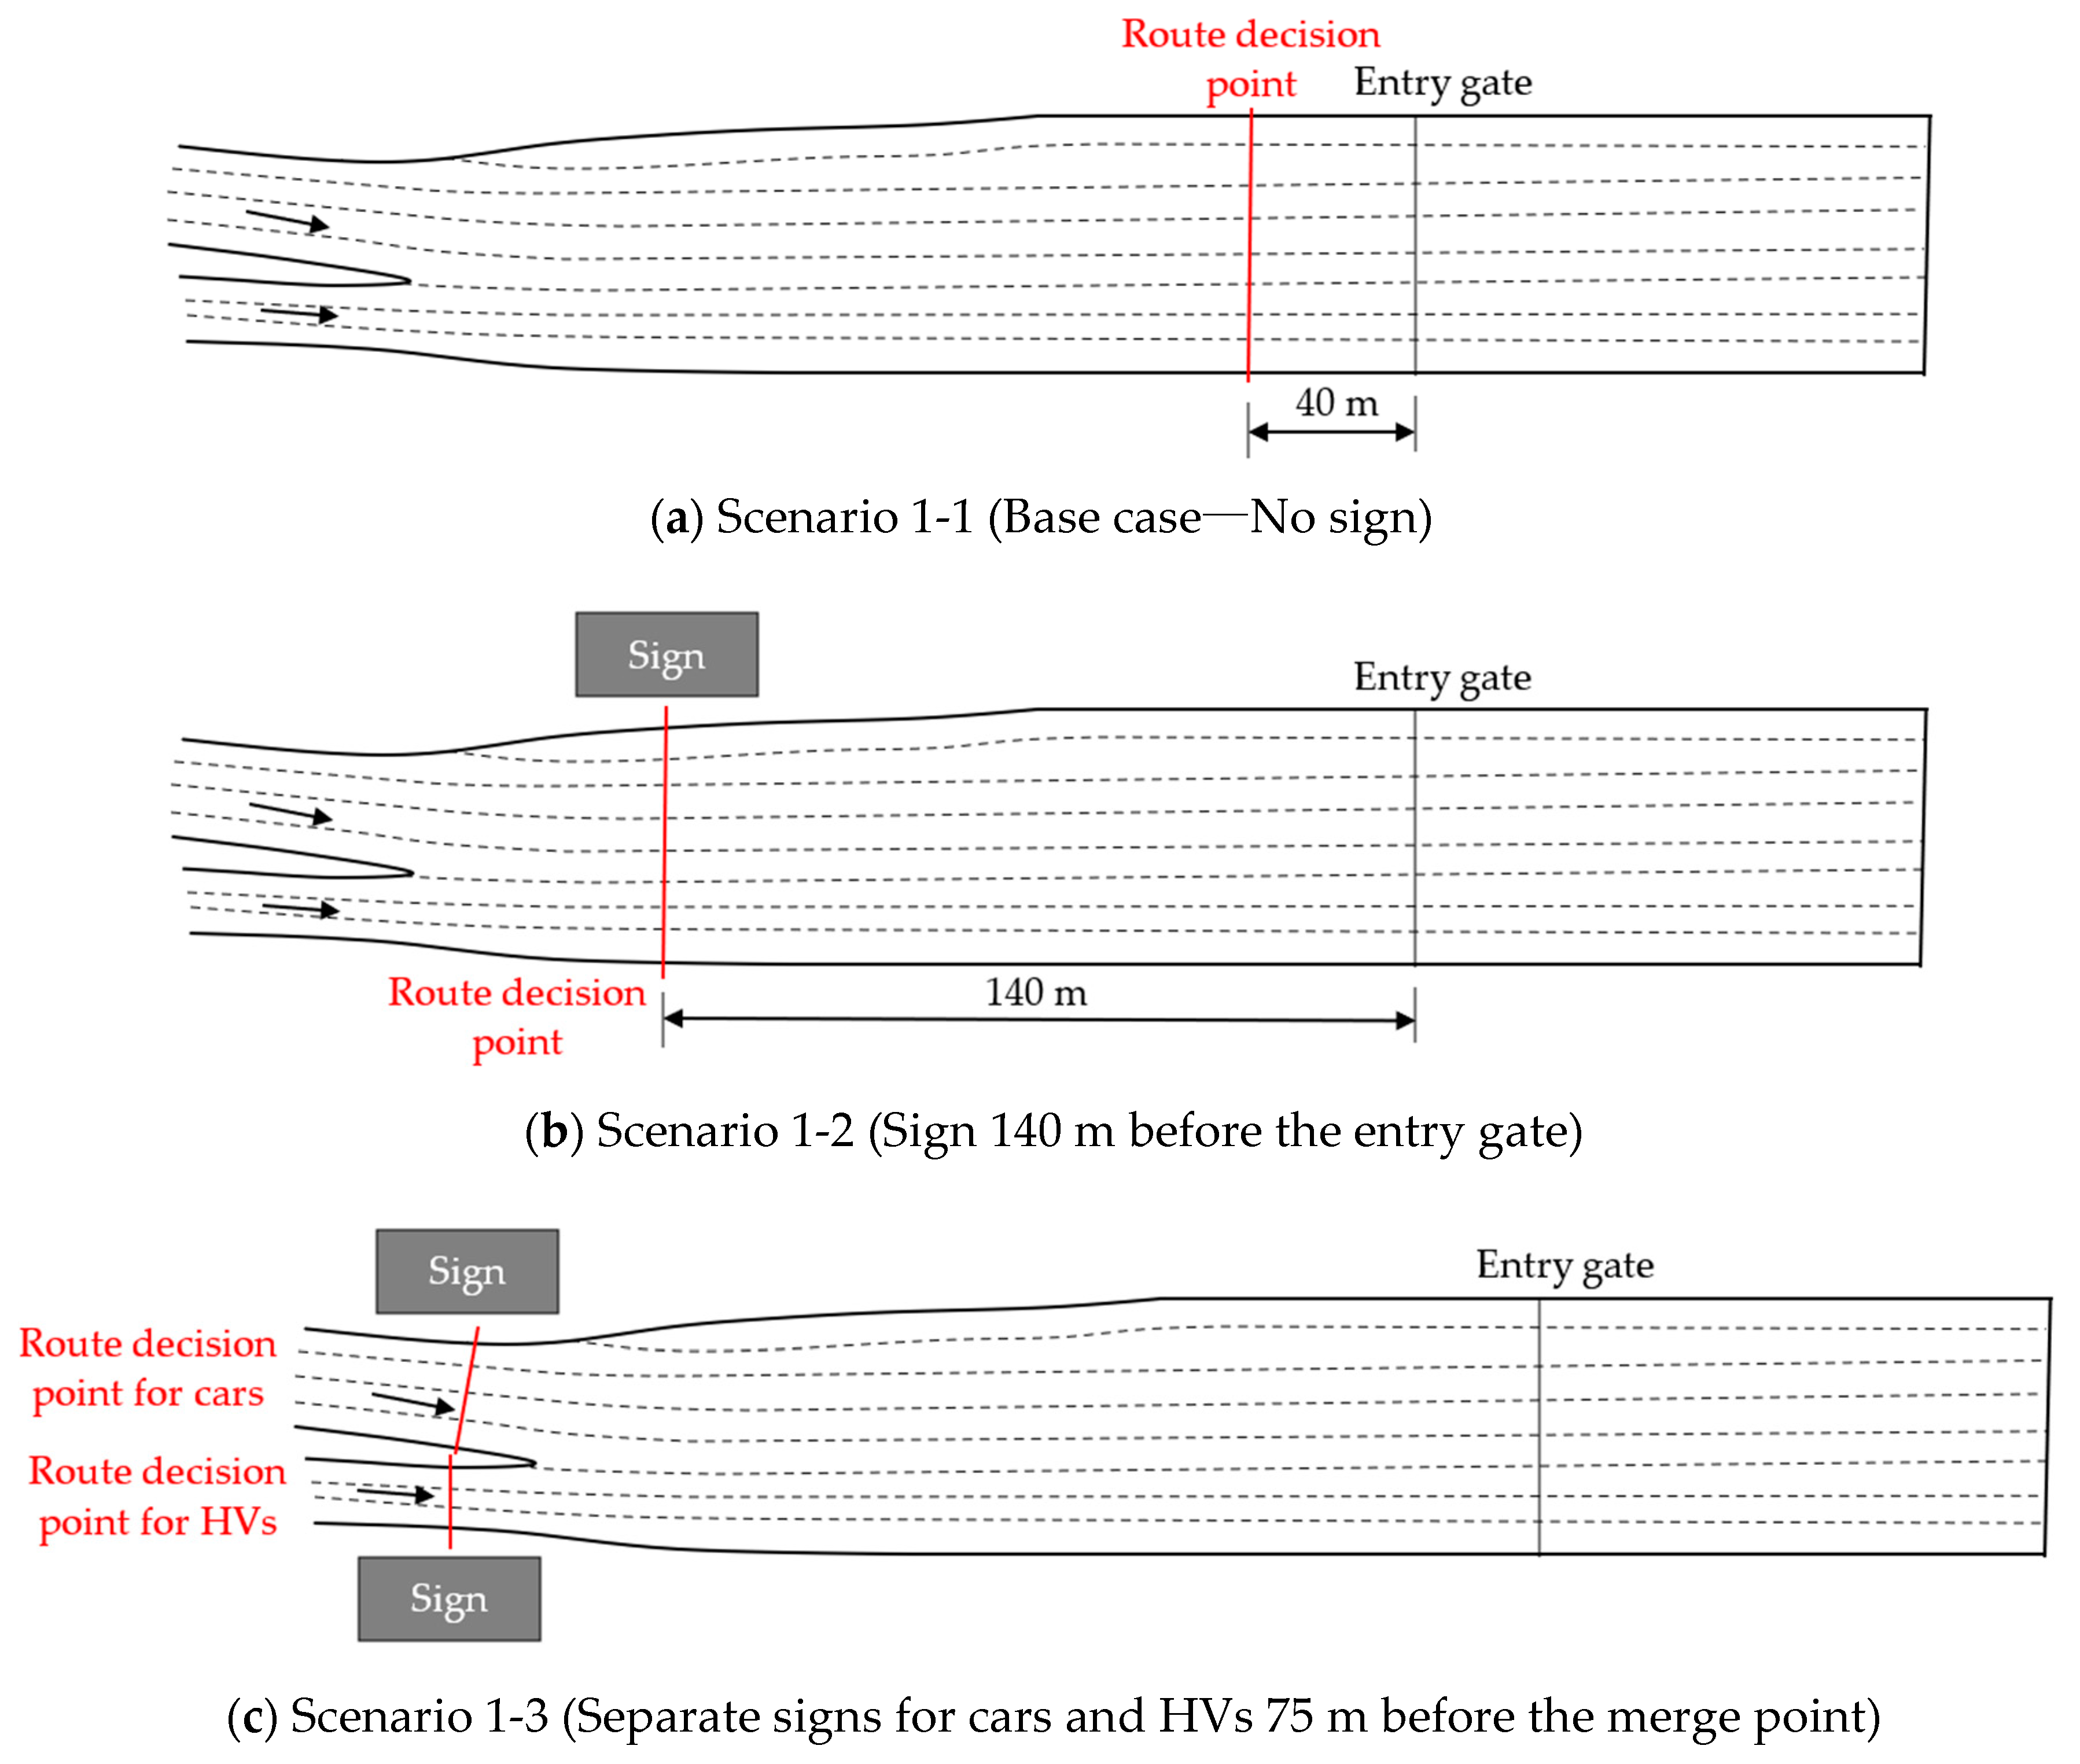


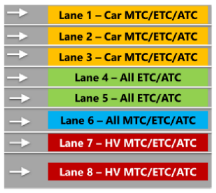
| Toll Lane | ||||||||
|---|---|---|---|---|---|---|---|---|
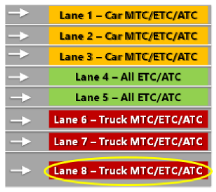
| Car MTC/ETC/ATC | All ETC/ATC | All | HV MTC/ETC/ATC | |||||
| Vehicle Type | 1 | 2 | 3 | 4 | 5 | 6 | 7 | 8 |
| MTC Car | 95% | N/A | 5% | N/A | ||||
| ETC/ATC Car | 35% | 60% | 5% | N/A | ||||
| MTC HV | N/A | N/A | 30% | 70% | ||||
| ETC/ATC HV | N/A | 40% | 10% | 50% | ||||
| (a) Car-following parameters (Source: Durrani et al. [27]) | |||
| Model Parameters | Unit | Car | Heavy Vehicle |
| CC0 | m | 4.15 | 4.69 |
| CC1 | m | 1.5 | 2.7 |
| CC2 | m | 11.58 | 14.02 |
| CC3 | s | −4 | −4.55 |
| CC4 | m/s | −1.65 | −2.07 |
| CC5 | m/s | 1.65 | 2.07 |
| CC6 | m/s | 11.44 | 11.44 |
| CC7 | m/s2 | 0.09 | 0.1 |
| CC8 | m/s2 | 0.49 | 0.27 |
| CC9 | m/s2 | 0.45 | 0.25 |
| (b) Description of car-following parameters (Source: PTV AG [18]) | |||
| Parameters | Description | ||
| CC0 | This is the average desired standstill distance between two vehicles and it has no variation. | ||
| CC1 | Time distribution of the speed-dependent part of the desired safety distance. Shows the number and name of the time distribution. Each time distribution may be empirical or normal. Each vehicle has an individual random safety variable which is considered as CC1. | ||
| CC2 | This restricts the distance difference (longitudinal oscillation) or how much further than the desired safety distance a driver allows before he intentionally moves closer to the car in front. | ||
| CC3 | This controls the start of the deceleration process, i.e., the number of seconds before reaching the safety distance. At this stage, the driver recognizes a preceding slower vehicle. | ||
| CC4 | This defines the negative speed difference during the following process. Low values result in a more sensitive driver reaction to the acceleration or deceleration of the preceding vehicle. | ||
| CC5 | This defines the positive speed difference. Enter a positive value for CC5 which corresponds to the negative value of CC4. Low values result in a more sensitive driver reaction to the acceleration or deceleration of the preceding vehicle. | ||
| CC6 | This is the influence of distance on speed oscillation. For value 0, the speed oscillation is independent of the distance and a larger value leads to greater speed oscillation with increasing distance. | ||
| CC7 | This is the oscillation during acceleration. | ||
| CC8 | This is the desired acceleration when starting from a standstill (limited by maximum acceleration defined within the acceleration curves). | ||
| CC9 | This is the desired acceleration at 80 km/h (limited by maximum acceleration defined within the acceleration curves). | ||
| (c) Lane-changing parameters (Source: CDM Smith [28]) | |||
| Unit | Lane-change vehicle | Trailing vehicle in the target lane | |
| Maximum deceleration | ft/s2 | −10 | −8 |
| −1 ft/s2 per distance | ft | 100 | 100 |
| Accepted deceleration | ft/s2 | −3.28 | −3.28 |
| Waiting time before diffusion | s | 60 | |
| Minimum front-to-rear headway | ft | 1.64 | |
| Safety distance reduction factor | - | 0.65 | |
| (d) Description of lane-changing parameters (Source: PTV AG [18]) | |||
| Parameters | Description | ||
| Maximum Deceleration | Thi is the maximum deceleration for changing lanes based on the specified routes for own vehicle overtaking and the trailing vehicle. | ||
| Cooperative Lane changing | If vehicle A observes that a leading vehicle B on the adjacent lane wants to change to his lane A, then vehicle A will try to change lanes itself to the next lane in order to facilitate lane changing for vehicle B. | ||
| Front-to-rear headway | This is the minimum distance between two vehicles that must be available after a lane change, so that the change can take place (default value 0.5 m). A lane change during normal traffic flow might require a greater minimum distance between vehicles in order to maintain the speed-dependent safety distance. | ||
| Safety distance reduction factor | This parameter concerns the safety distance of the trailing vehicle on the new lane for determining whether a lane change will be carried out, the safety distance of the lane changer itself, and the distance to the preceding, slower lane changer. During the lane change, Vissim reduces the safety distance to the value that results from the following multiplication:Original safety distance × safety distance reduction factorThe default value of 0.6 reduces the safety distance by 40%. Once a lane change is completed, the original safety distance is taken into account again. | ||
| Waiting time before diffusion | This period of time is defined as the time a car sits waiting for a gap to change lanes in order to stay on its route before it is removed from the network. | ||
| Input Data | Output Data |
|---|---|
|
|
 |  |  | ||||
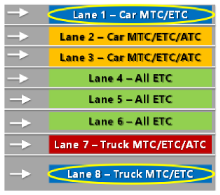
| Scenario 1-1 No Sign | Scenario 1-2 Sign 140 m before Gate | Scenario 1-3 Signs 75 m before Merge | ||||
| (a) Queue length by toll lane | ||||||
| Scenario 1-1 | Scenario 1-2 | Scenario 1-3 | ||||
| Toll lanes | Average queue length | Maximum queue length | Average queue length | Toll lanes | Average queue length | Maximum queue length |
| Toll lanes | 14.3 | 94.8 | 16.8 | 103.5 | 12.9 | 81.7 |
| Car MTC/ETC/ATC lanes (Lanes 1, 2, 3) | 35.0 | 108.7 | 35.2 | 119.3 | 31.9 | 100.7 |
| All ETC/ATC lanes (Lanes 4, 5) | 7.0 | 93.5 | 8.2 | 96.1 | 6.2 | 71.8 |
| All MTC/ETC/ATC lanes (Lane 6) | 27.4 | 113.6 | 27.1 | 112.9 | 24.1 | 101.4 |
| (b) Average TTC by toll lane (s) | ||||||
| Toll lane | Scenario 1-1 | Scenario 1-2 | Scenario 1-3 | |||
| Lane 1 | 6.6 | 6.1 | 7.9 | |||
| Lane 2 | 13.5 | 12.8 | 9.4 | |||
| Lane 3 | 9.4 | 14.9 | 13.9 | |||
| Lane 4 | 11.5 | 12.9 | 13.7 | |||
| Lane 5 | 12.5 | 12.9 | 14.8 | |||
| Lane 6 | 14.3 | 18.2 | 23.6 | |||
| Lane 7 | 15.8 | 23.4 | 20.9 | |||
| Lane 8 | 13.4 | 12.2 | 10.7 | |||
| Average | 12.4 | 14.8 | 14.6 | |||
| (c) Average required braking rates during lane changes (m/s2) | ||||||
| Lane-changing/trailing vehicles | Sideswipe conflict | Rear-end conflict | ||||
| Scenario 1-1 | Scenario 1-2 | Scenario 2-2 | Scenario 1-1 | Scenario 1-2 | Scenario 2-2 | |
| Car–Car | 0.24 | 0.21 | 0.26 | 0.23 | 0.14 | 0.27 |
| Car–HV | 0.64 | 0.53 | 0.56 | 0.44 | 0.29 | 0.21 |
| HV–HV | 0.47 | 0.26 | 0.40 | 0.26 | 0.28 | 0.24 |
| HV–Car | 0.64 | 0.22 | 0.48 | 1.73 | 0.19 | 0.34 |
| Average | 0.38 | 0.25 | 0.34 | 0.45 | 0.22 | 0.19 |
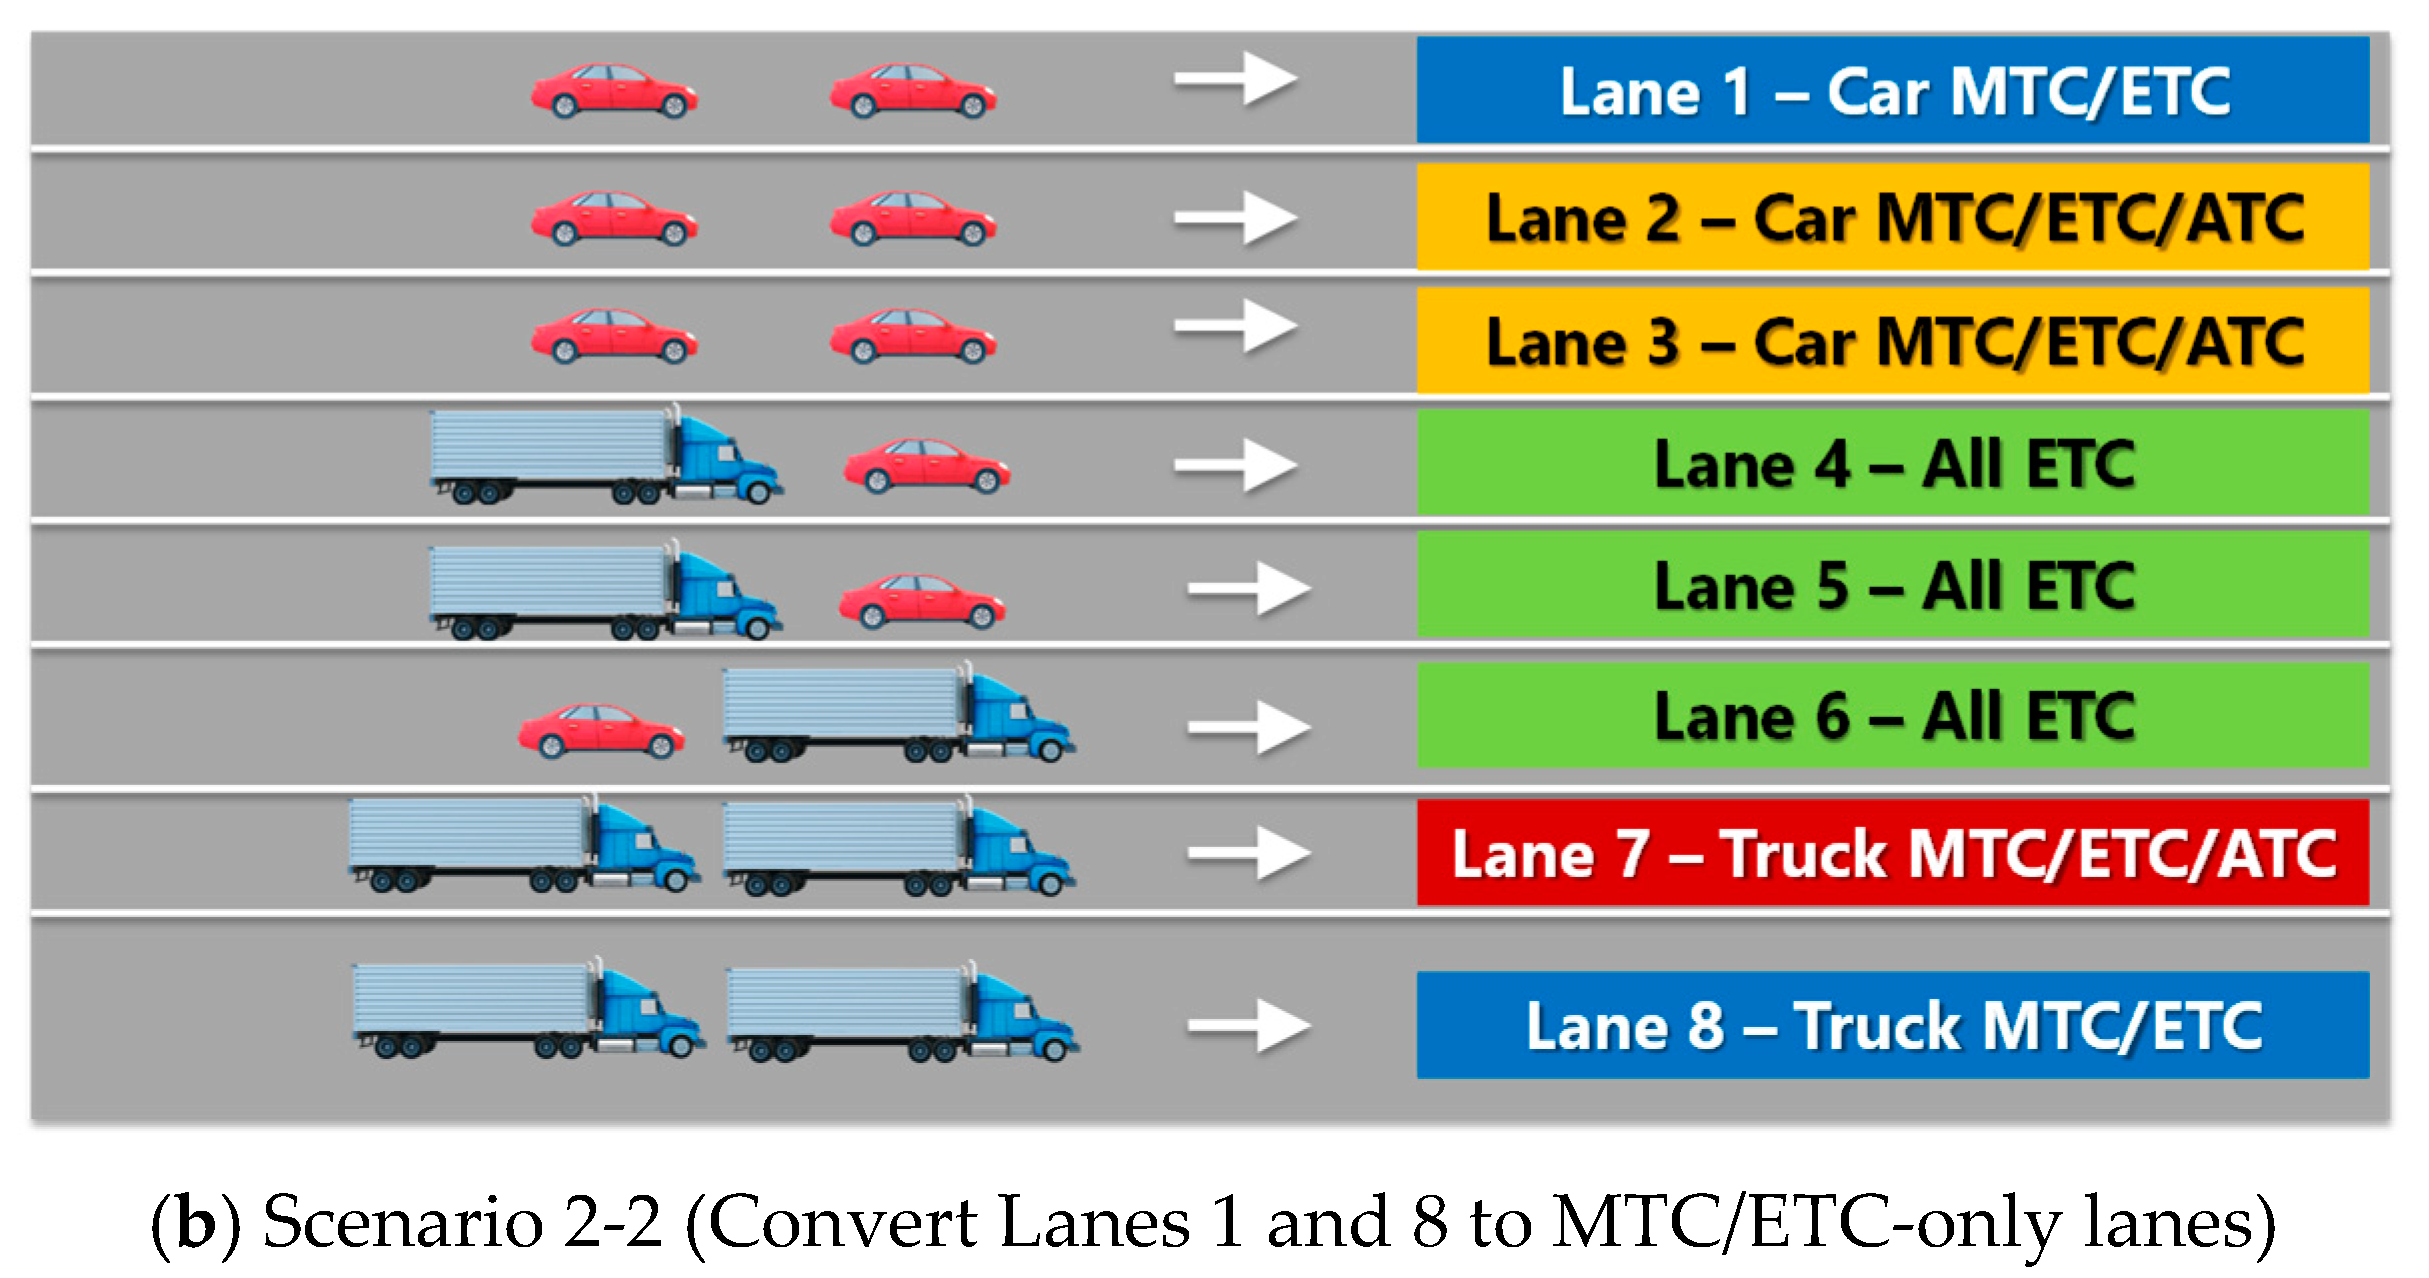
 | 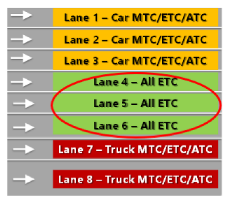 |  | ||||
| Base Case (Scenario 1-3) Current Toll Lane Configuration | Scenario 2-1 Convert Lanes 4 to 6 to ETC-Only Lanes | Scenario 2-2 Convert Lanes 1 to 8 to MTC/ETC-Only Lanes | ||||
| (a) Queue length by toll lane | ||||||
| Base case (Scenario 1-3) | Scenario 2-1 | Scenario 2-2 | ||||
| Toll lanes | Average queue length | Maximum queue length | Average queue length | Maximum queue length | Average queue length | Maximum queue length |
| Lanes 1, 2, 3 | 12.9 | 81.7 | 16.3 | 76 | 13.1 | 68.8 |
| Lanes 4, 5 | 31.9 | 100.7 | 24.0 | 92.7 | 24.6 | 90.7 |
| Lane 6 | 6.2 | 71.8 | 10.4 | 81.8 | 7.5 | 67.5 |
| Lanes 7, 8 | 24.1 | 101.4 | 15.0 | 87.4 | 20.1 | 83.6 |
| (b) Average TTC by toll lane | ||||||
| Toll lane | Scenario 1-3 | Scenario 2-1 | Scenario 2-2 | |||
| Lane 1 | 7.9 | 25.9 | 15.7 | |||
| Lane 2 | 9.4 | 28.2 | 27.3 | |||
| Lane 3 | 13.9 | 11.3 | 21 | |||
| Lane 4 | 13.7 | 20.2 | 11.1 | |||
| Lane 5 | 14.8 | 22 | 12 | |||
| Lane 6 | 23.6 | 33.8 | 20.5 | |||
| Lane 7 | 20.9 | 21.9 | 24.9 | |||
| Lane 8 | 10.7 | 13.7 | 11.4 | |||
| Average | 14.6 | 21.3 | 14.9 | |||
| (c) Average required braking rates during lane changes (m/s2) | ||||||
| Lane-changing/trailing vehicles | Sideswipe conflict | Rear-end conflict | ||||
| Scenario 1-3 | Scenario 2-1 | Scenario 2-2 | Scenario 1-3 | Scenario 2-1 | Scenario 2-2 | |
| Car–Car | 0.26 | 0.16 | 0.13 | 0.27 | 0.14 | 0.12 |
| Car–HV | 0.56 | 0.17 | 0.32 | 0.21 | 0.11 | 0.22 |
| HV–HV | 0.40 | 0.41 | 0.32 | 0.24 | 0.49 | 0.48 |
| HV–Car | 0.48 | 0.24 | 0.38 | 0.34 | 0.16 | 0.22 |
| Average | 0.34 | 0.24 | 0.30 | 0.19 | 0.21 | 0.31 |
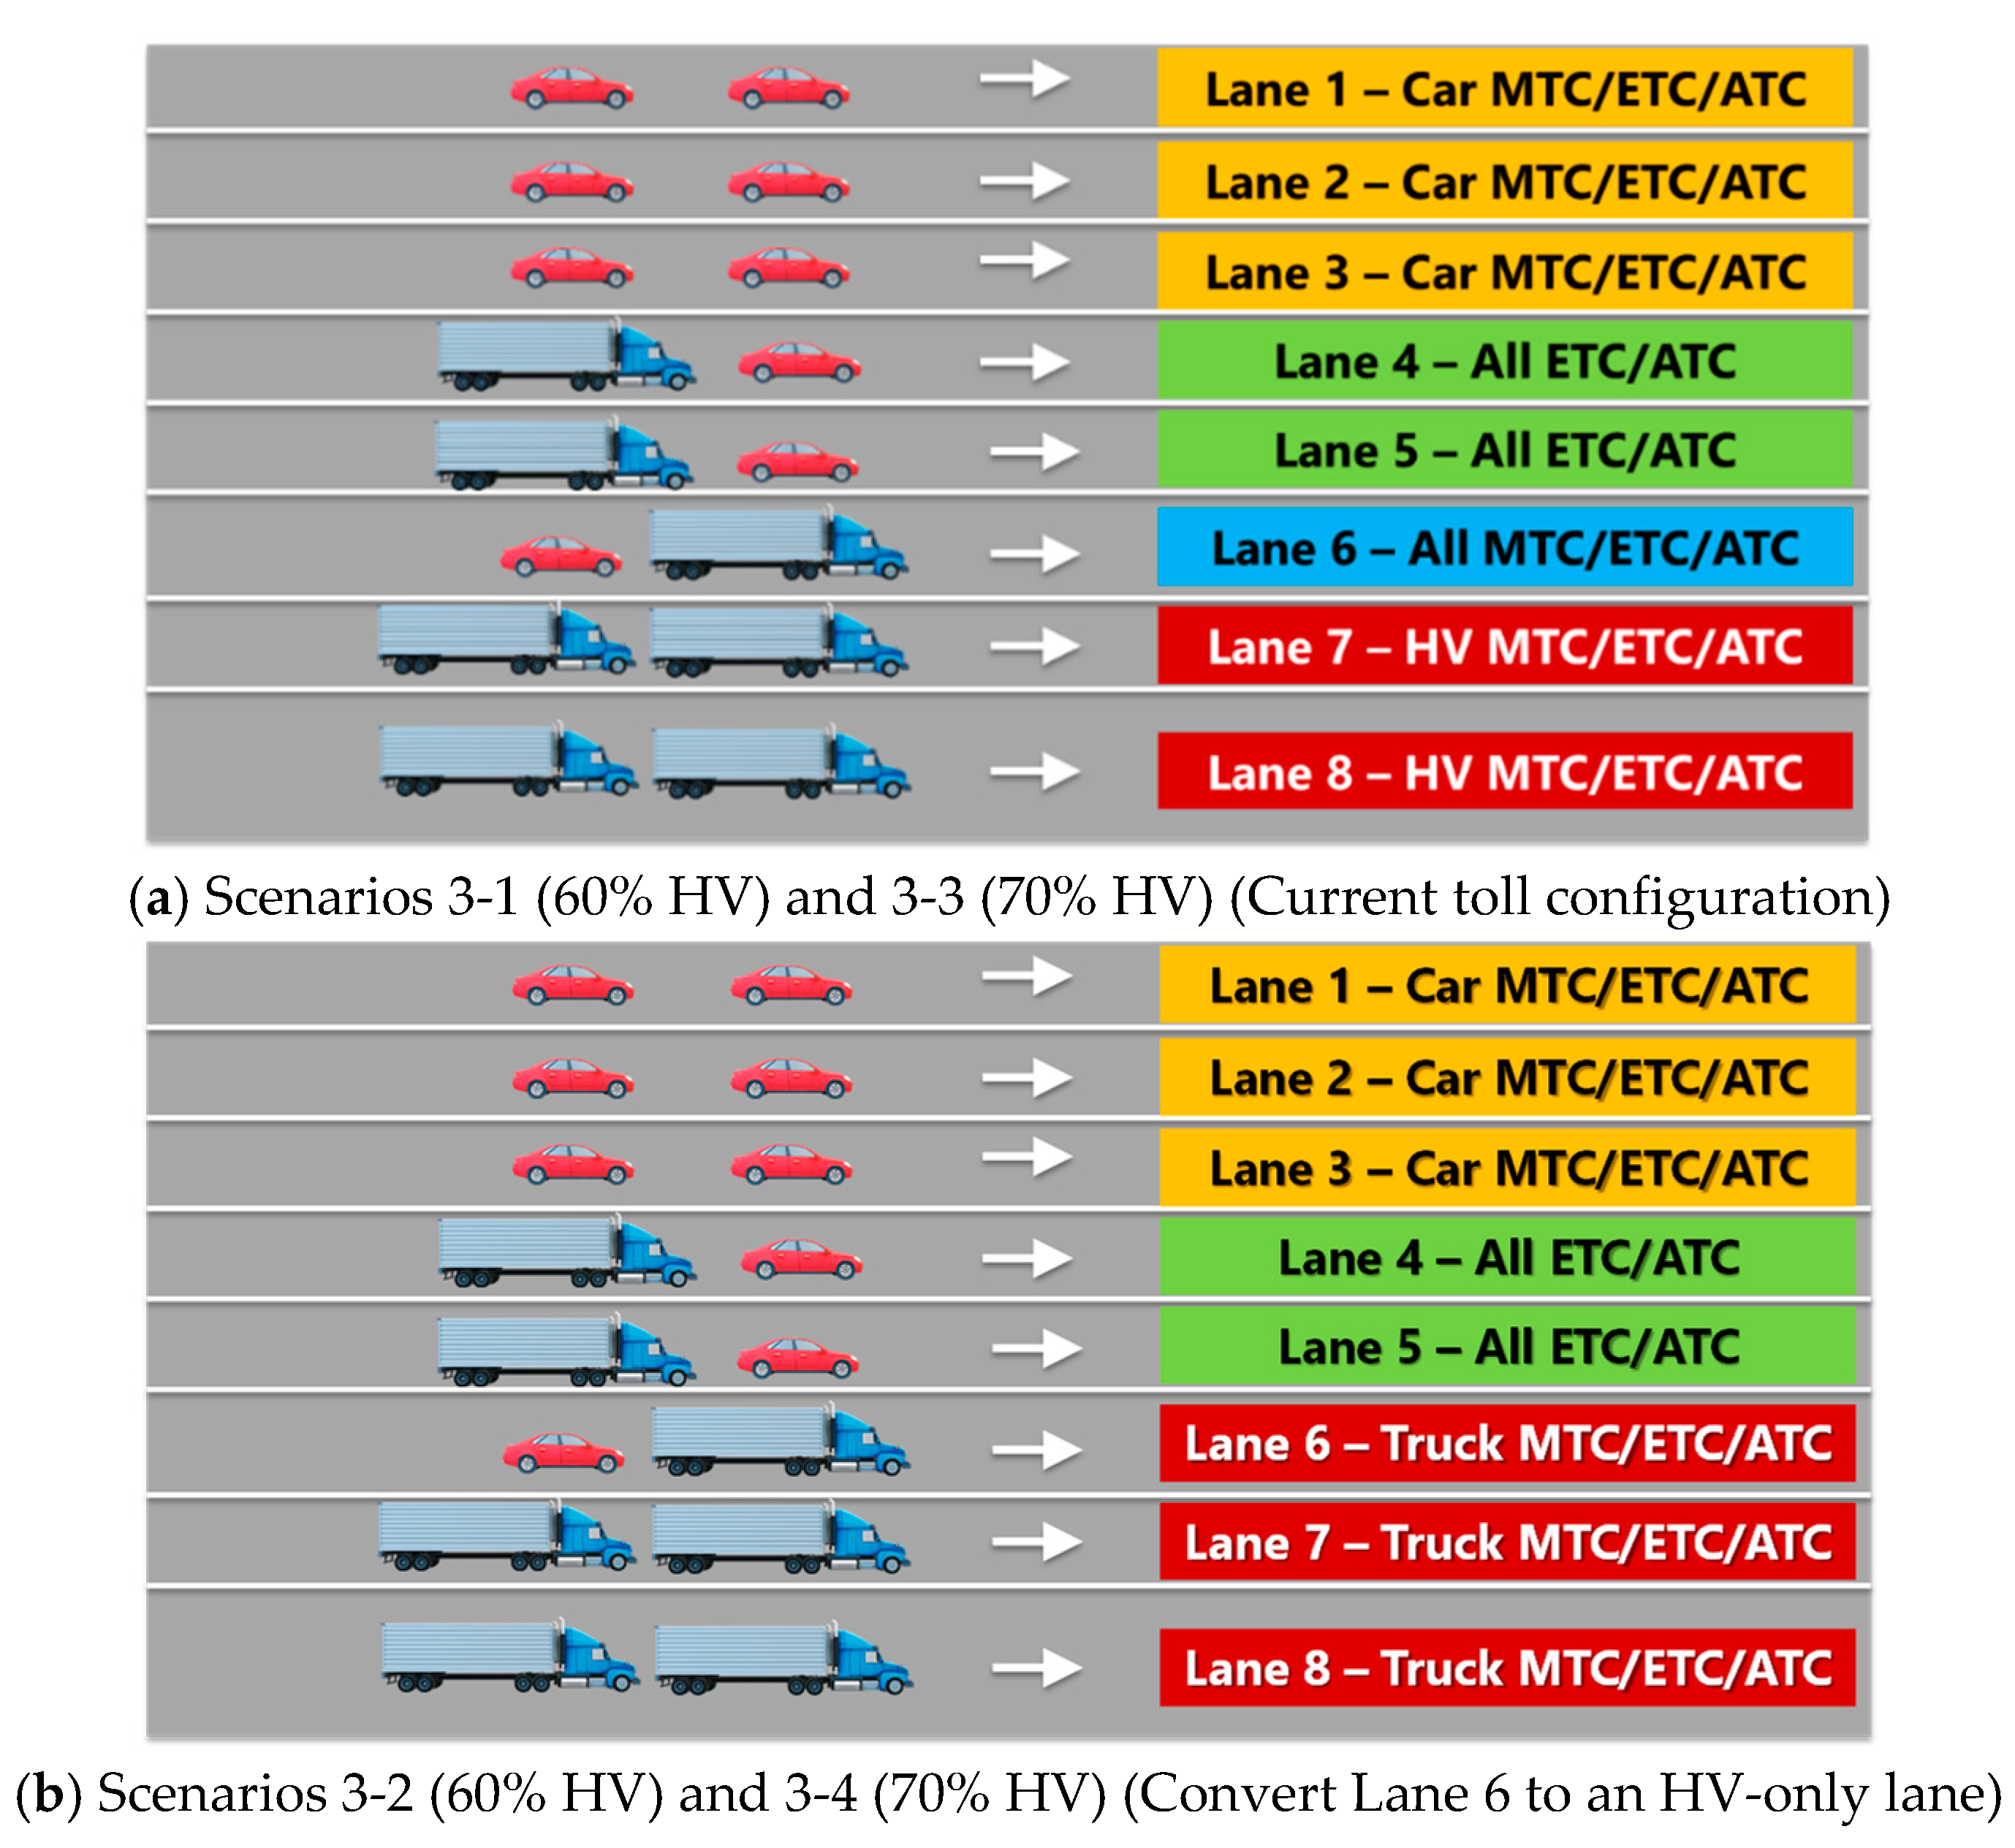
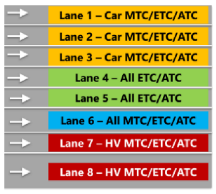 | 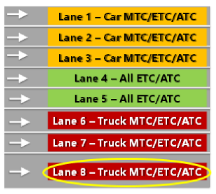 | 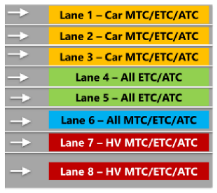 |  | |||||
| Scenario 3-1 Current Toll Lane Configuration for 60% HV | Scenario 3-2 Convert Lanes 6 to HV-only Lanes for 60% HV | Scenario 3-3 Current Toll Lane Configuration for 70% HV | Scenario 3-4 Convert Lanes 6 to HV-only Lanes for 70% HV | |||||
| (a) Queue length by toll lane | ||||||||
| Scenario 3-1 Current toll lane configuration for 60% HV | Scenario 3-2 Convert Lane 6 to an HV-only lane for 60% HV | Scenario 3-3 Current toll lane configuration for 70% HV | Scenario 3-4 Convert Lane 6 to an HV-only lane for 70% HV | |||||
| Toll lanes | Ave. queue length | Max. queue length | Ave. queue length | Max. queue length | Ave. queue length | Max. queue length | Ave. queue length | Max. queue length |
| Lanes 1, 2, 3 | 10.7 | 81 | 10.6 | 81.2 | 10 | 83.1 | 10.2 | 83 |
| Lanes 4, 5 | 32.7 | 103.2 | 31.2 | 107.6 | 34.6 | 108.4 | 31.4 | 109.8 |
| Lane 6 | 7 | 75.7 | 10 | 86 | 8 | 81.4 | 12.4 | 93.2 |
| Lanes 7, 8 | 29.1 | 105.7 | 30.5 | 114.6 | 32.7 | 111.3 | 33.2 | 118 |
| (b) Average TTC by toll lane | ||||||||
| Toll lane | Scenario 3-1 | Scenario 3-2 | Scenario 3-3 | Scenario 3-4 | ||||
| Lane 1 | 8 | 8 | 7.8 | 7.7 | ||||
| Lane 2 | 10.1 | 10.6 | 11.1 | 11 | ||||
| Lane 3 | 10.2 | 12 | 8.6 | 8.5 | ||||
| Lane 4 | 12 | 12 | 11.9 | 12.5 | ||||
| Lane 5 | 15.6 | 11.6 | 16.8 | 16.8 | ||||
| Lane 6 | 20.6 | 19.2 | 25.2 | 26.3 | ||||
| Lane 7 | 26.2 | 30 | 29.4 | 32.5 | ||||
| Lane 8 | 14.6 | 14.7 | 19.5 | 20.3 | ||||
| Average | 16.0 | 16.4 | 19.1 | 20.8 | ||||
| (c) Average required braking rates during lane changes (m/s2) | ||||||||
| Lane-changing/trailing vehicles | 60% HV | 70% HV | ||||||
| Sideswipe conflict | Rear-end conflict | Sideswipe conflict | Rear-end conflict | |||||
| Scenario 3-1 | Scenario 3-2 | Scenario 3-1 | Scenario 3-2 | Scenario 3-3 | Scenario 3-4 | Scenario 3-3 | Scenario 3-4 | |
| Car–Car | 0.12 | 0.13 | 0.07 | 0.09 | 0.12 | 0.07 | 0.12 | 0.07 |
| Car–HV | 0.62 | 0.89 | 0.24 | 0.83 | 0.83 | 0.45 | 0.72 | 0.3 |
| HV–HV | 0.48 | 0.37 | 0.45 | 0.26 | 0.54 | 0.56 | 0.87 | 1.12 |
| HV–Car | 0.40 | 0.41 | 0.32 | 0.42 | 0.29 | 0.34 | 0.22 | 0.77 |
| Average | 0.42 | 0.37 | 0.30 | 0.30 | 0.42 | 0.44 | 0.56 | 0.60 |
Disclaimer/Publisher’s Note: The statements, opinions and data contained in all publications are solely those of the individual author(s) and contributor(s) and not of MDPI and/or the editor(s). MDPI and/or the editor(s) disclaim responsibility for any injury to people or property resulting from any ideas, methods, instructions or products referred to in the content. |
© 2024 by the authors. Licensee MDPI, Basel, Switzerland. This article is an open access article distributed under the terms and conditions of the Creative Commons Attribution (CC BY) license (https://creativecommons.org/licenses/by/4.0/).
Share and Cite
Zahedieh, F.; Lee, C. Impacts of a Toll Information Sign and Toll Lane Configuration on Queue Length and Collision Risk at a Toll Plaza with a High Percentage of Heavy Vehicles. Vehicles 2024, 6, 1249-1267. https://doi.org/10.3390/vehicles6030059
Zahedieh F, Lee C. Impacts of a Toll Information Sign and Toll Lane Configuration on Queue Length and Collision Risk at a Toll Plaza with a High Percentage of Heavy Vehicles. Vehicles. 2024; 6(3):1249-1267. https://doi.org/10.3390/vehicles6030059
Chicago/Turabian StyleZahedieh, Farnaz, and Chris Lee. 2024. "Impacts of a Toll Information Sign and Toll Lane Configuration on Queue Length and Collision Risk at a Toll Plaza with a High Percentage of Heavy Vehicles" Vehicles 6, no. 3: 1249-1267. https://doi.org/10.3390/vehicles6030059
APA StyleZahedieh, F., & Lee, C. (2024). Impacts of a Toll Information Sign and Toll Lane Configuration on Queue Length and Collision Risk at a Toll Plaza with a High Percentage of Heavy Vehicles. Vehicles, 6(3), 1249-1267. https://doi.org/10.3390/vehicles6030059


