Abstract
In response to the EU’s stringent zero-carbon emission standards for 2035 and global initiatives to phase out fossil-fuel-powered vehicles, there is an urgent need for innovative solutions in vehicle propulsion systems. While much of the current research focuses on electric passenger cars, commercial vehicles remain relatively underexplored despite their significant potential impact on carbon neutrality goals. This study presents an open-source Simulink model specifically tailored for the analysis of electric commercial trucks, concentrating on the 6.5-ton category. Developed to assess the influence of various power components and control strategies on driving range, the model incorporates three validated powertrain configurations and features such as regenerative braking and one-pedal drive. Simulations are conducted under two real-world driving scenarios in the city of Taipei in Taiwan to evaluate different configurations’ effects on energy consumption and efficiency. Results indicate that optimizing the vehicle configuration can reduce power consumption by 26.3% and extend driving range by an additional 25.1 km on a single battery charge. By making the model and its source code publicly available, this research not only fills a critical gap in specialized evaluation tools for electric commercial vehicles but also serves as a valuable resource for both industrial assessments and educational purposes in the field of vehicle electrification.
1. Introduction
Vehicle technology has made significant strides, with internal combustion engine (ICE) vehicles evolving to comply with increasingly stringent emissions regulations. Innovations such as engine downsizing, turbocharging, and electrification offer multiple pathways to improve fuel economy [1]. However, achieving compliance requires more efficient vehicle propulsion systems. The European Parliament’s “Fit for 55” policy aims to eliminate fossil-fuel-powered vehicles from EU sales by 2035, promoting only fully electric and e-fuel vehicles. Similar regulations in other major countries highlight an irreversible shift toward electrified vehicle propulsion systems.
In collaboration with FedEx Express, NERL evaluated emissions reductions between gasoline hybrid electric vehicles (HEVs) and diesel-powered parcel delivery trucks. The study found that HEVs reduced nitrogen oxide (NOx) emissions by 75–89% and particulate matter emissions by 99% compared to diesel trucks while maintaining similar fuel economy [2]. Although HEVs provide significant improvements, they still fall short of stringent regulations, particularly for commercial vehicles. Research indicates that the cost of battery electric vehicles (BEVs) will drop by 25% by 2050 compared to 2020, while ICE vehicle costs will exceed those of BEVs by 2030 [3]. These trends underscore the need for efficient propulsion systems in commercial vehicles.
Key technologies such as regenerative braking capture and reuse kinetic energy lost during braking, potentially extending electric vehicle (EV) driving range by 8–25% [4]. One-pedal drive (OPD) technology, often found in EVs, enhances driving efficiency by combining energy recuperation and braking. Studies have demonstrated that OPD can yield up to 22% energy savings in urban driving scenarios for passenger vehicles compared to standard driving modes [5,6]. As OPD matures, its application has expanded beyond passenger vehicles, and when implemented in electric buses, it has improved energy savings by 10–13% during urban traffic [7]. Despite these advances, real-world testing faces challenges in reproducing results due to the influences of temperature, traffic, road conditions, and driver behavior.
Therefore, evaluating the efficiency and energy consumption of commercial vehicles necessitates reliable models and simulation tools that can offer controlled environments. Precise modeling, simulation, and validation of electric vehicle (EV) powertrains are vital for making crucial design and control decisions in high-performance vehicle designs [8].
EV modeling requires a multidisciplinary approach integrating both electric components and powertrain systems to enhance energy control strategies and reduce energy consumption [9]. For example, Adegbohun et al. [8] describes a method that combines software simulation with real vehicle testing to boost development efficiency, reliability, and performance. Similarly, Rus et al. [10] discusses the use of MATLAB Simulink for the design and mathematical modeling of an electric vehicle driveline, aiming to optimize efficiency, performance, and safety in a small off-road vehicle. Moreover, Schaltz and Soylu [11] details a method for designing an EV power system to meet driving range and acceleration requirements while minimizing energy consumption and costs.
Additionally, Rodriguez [12] investigated the impact of driving behavior on the energy consumption of battery electric vehicles (BEVs) in different traffic conditions. The results indicated that adjusting driving aggressiveness based on traffic conditions maximizes battery life and vehicle range.
Existing models emphasize vehicle performance, dynamics, and fuel efficiency, addressing the limitations of on-road tests. Table 1 outlines various vehicle models and their specialized capabilities in vehicle simulations. As electrification becomes crucial for commercial vehicles, precise assessment of power consumption and energy efficiency is essential for meeting future emissions standards.

Table 1.
Comparison of existing vehicle models.
Despite the range of existing vehicle models, none provide an open-source framework with the flexibility to incorporate emerging technologies. This research addresses this gap by developing an open-source vehicle model using MATLAB/Simulink R2022b Update 4 to simulate overall power consumption and the driving mileage achievable in a battery electric truck under various configurations. Detailed parameters of the truck will be introduced in subsequent sections. The model is based on three validated powertrain systems for the target electric truck and simulates two customized daily drive scenarios across multiple configuration combinations. By blending commercial vehicle analysis, open-source modeling, and scenario-based simulation, this approach serves as an illustrative example for both educational and commercial applications.
In the following sections, Section 2, Model Construction, provides an overview of the target vehicle and its Simulink model. Section 3, Simulation Scenarios, describes the proposed configurations and driving scenarios. Section 4, Vehicle Model Validation, introduces the scenarios used to validate vehicle models and controllers, which provide test conditions for validation testing of vehicle performance and control strategies and show the validation results of the proposed vehicle model. Section 5, Results and Observations, presents the simulation outcomes and emphasizes mileage improvements achieved through optimized configurations. Section 6, Conclusion and Discussions, summarizes the findings on enhancing electric truck efficiency and explores the in-the-loop applications of the model. The open-source model data are included in Appendix A.
2. Model Construction
2.1. Target Vehicle
The overview of the target vehicle, depicted in Figure 1, showcases a battery electric truck powered by a water-cooled motor with a maximum power output of 110 kW and a torque output of 950 N-m. This vehicle is equipped with an 83 kWh lithium iron phosphate (LFP) battery, which offers a variable driving range spanning from approximately 170 to 350 km when fully charged. It is important to note that the actual driving range may vary based on factors such as environmental conditions, cargo loads, and driver behavior. This truck is specifically designed to accommodate goods with a maximum gross weight of 6495 kg and comprises four main components: the chassis frame, powertrain, braking system, and control systems. Detailed vehicle parameters are listed in Table 2.
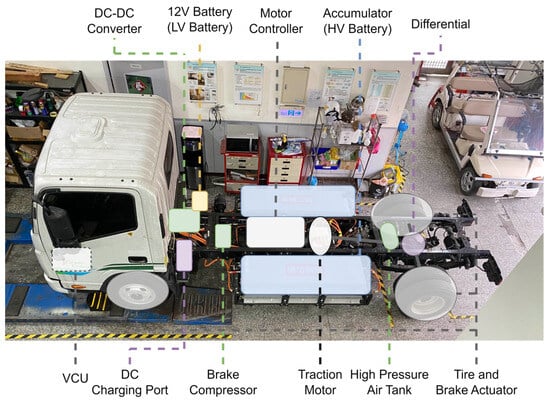
Figure 1.
Target vehicle with basic components.

Table 2.
Specifications of the target vehicle.
2.2. Powertrain System
In addition to the original powertrain system, this study introduces three alternative powertrain options to assess the disparities in performance under simulation conditions. These additional powertrain options provide maximum power outputs of 95 kW, 132 kW, and 190 kW, respectively. Table 3 illustrates the specifications of these powertrain configurations. It is important to highlight that the maximum power outputs of these configurations are capped at 150 kW to prevent excessive drain on the accumulator system. To acquire performance data and develop powertrain models within the Simulink environment, the study employs a dynamometer testbed, as depicted in Figure 2. This setup is used to conduct experiments that capture indices such as the torque and power contour (T-N curve) and efficiency distribution.

Table 3.
Specifications of powertrain configurations.
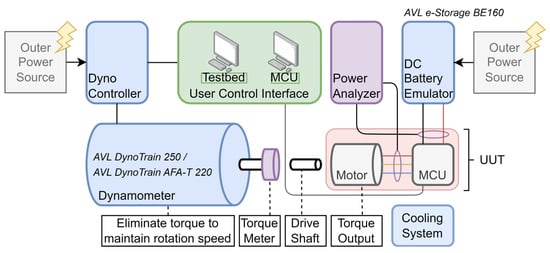
Figure 2.
Dynamometer testbed structure for powertrain validation.
2.3. Simulink Model
The vehicle model in this study is built within the MATLAB/Simulink environment and is organized into three control layers: upper, middle, and lower control layers. These layers correspond to the visualized feedback dashboard with the driver model, the vehicle control unit (VCU) model, which is responsible for integrated control strategies, and the hardware model for vehicle components, including the powertrain, vehicle body, and communication systems. The overall control hierarchy of the vehicle model is depicted in Figure 3.
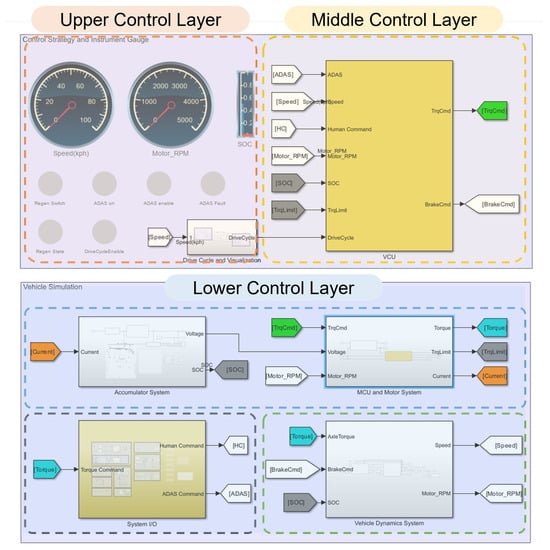
Figure 3.
Control hierarchy and overview of Simulink vehicle model.
The upper control layer incorporates cluster gauges that present signal feedback from other control layers to the dashboard. Key signals, such as vehicle and motor speed, state of charge (SOC), and vehicle status, are displayed for the driver’s information. These signals are pivotal for the 3D visualization function and the driver model.
The middle control layer centers on the virtual VCU and acts as the bridge between driver input and vehicle status control and monitoring. It integrates strategies like regenerative braking, OPD, and adaptive cruise control, enhancing the functionality of the VCU. The VCU also collects control signals from various devices and processes driver commands (ignition switch, gear selection, acceleration, and brake pedals) and translates them into torque and brake commands for the downstream vehicle model. The subsequent section will delve into the control architecture and the integration of regenerative braking and OPD functions.
The lower control layer embodies the target research vehicle in four components: the accumulator system (HV battery), MCU and motor system (powertrain), vehicle dynamics system (vehicle body), and system input/output (I/O), as shown in Figure 4. These systems represent the comprehensive hardware architecture of the target vehicle. The accumulator system comprises 1008 LFP20100140A-30Ah battery cells in a configuration of 168 series and 6 parallel. The system I/O serves as a platform for gathering signals from various sources, including driver commands, the Simulink environment, XInput devices like controllers or driving simulators, and the CAN bus connected to the dedicated vehicle. The following sections will detail the powertrain and vehicle dynamics systems.
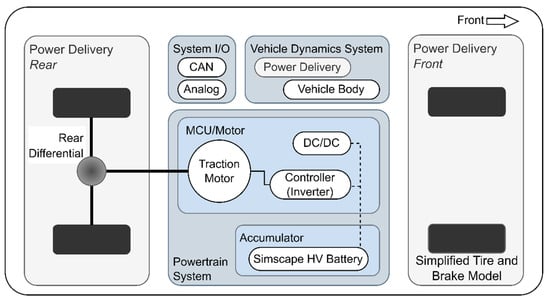
Figure 4.
Vehicle model structure.
2.3.1. Virtual Vehicle Control Unit
The virtual VCU is a simplified controller with two primary functions. First, it is responsible for delivering torque and brake commands to the downstream vehicle dynamics system: specifically, to the MCU and motor system and vehicle dynamics system. The controller determines the vehicle’s status based on feedback from the downstream control layers. Second, to assess the effectiveness of control strategies like regenerative braking and OPD, the virtual VCU must execute these functions when activated. Figure 5 illustrates the simplified workflow of the virtual VCU, including driver commands such as throttle, brake pedal, and gear selection commands. The mapping curve for the ordinary driving mode is presented in Figure 6 in the subsequent section.
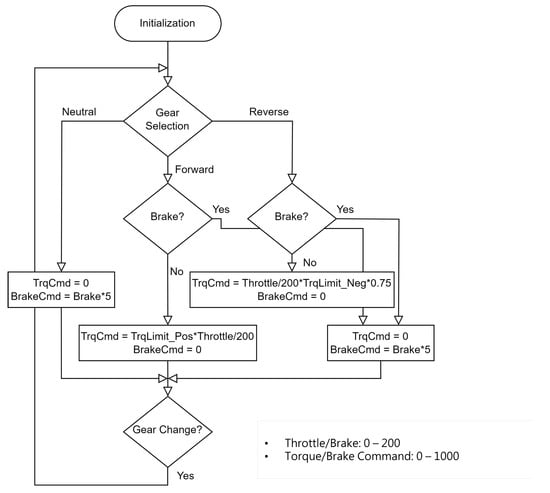
Figure 5.
Simplified workflow of the virtual VCU under driver commands.
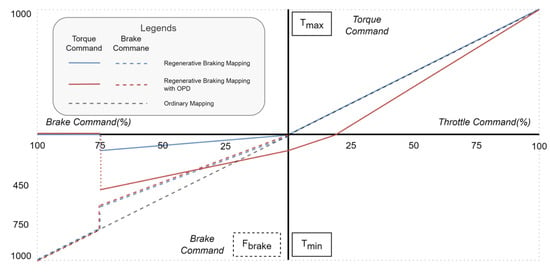
Figure 6.
Mapping curve of torque and brake commands versus driver inputs.
2.3.2. Regenerative Braking and One-Pedal Drive
In addition to the basic functions, this study integrates multiple functions into the vehicle model. In this section, we will focus on two integrated functions: regenerative braking and one-pedal drive. As mentioned earlier, these functions are capable of reducing overall power consumption and extending driving mileage by recovering kinetic energy during braking and converting it into usable energy. The following content will primarily address the algorithms utilized for these functions.
Regenerative braking in this study leverages the motor torque output curve and applies specific reverse torque to recover kinetic energy into electricity, thus optimizing power usage and increasing driving mileage. This function also contributes to reducing wear and tear on braking pads/shoes since the motor provides a portion of the braking force during the braking process. OPD enhances the mapping curve of the regenerative braking mode by advancing the neutral point of the command by 20%. By providing a more radical command mapping, OPD benefits drivers by reducing the frequency of switching between the accelerator and brake pedals. To prevent jerks in the transmission axles, both regenerative braking and OPD functions conclude when more than 75% braking is engaged. Figure 6 illustrates the detailed torque mapping curves for the ordinary driving mode, regenerative braking, and the OPD mode.
2.3.3. Powertrain Model
Moving on to the powertrain model, it is constructed based on data obtained from the testbench mentioned in the previous section on the powertrain system. The earlier section introduced the motor testbench’s architecture and experimentation procedures. This chapter continues by outlining the powertrain model’s construction process. Two essential factors are required to develop the powertrain model.
First, the torque output’s boundaries depend on various factors, such as the design, cooling, and supplied voltage. To establish these boundaries, experiments with dynamometers are crucial for the observation and recording of torque output limit data. The torque output data can be sourced from the torque meter depicted in Figure 2. By acquiring these data, the vehicle model can simulate torque output within these boundaries. Second, to evaluate the overall power consumption of the powertrain system, the efficiency contour is indispensable for determining energy losses during the transformation between electrical and mechanical energy. The efficiency contour is generated using the power analyzer in Figure 2 to assess the overall efficiency across various operating points under the torque output curve, as shown in Figure 7.
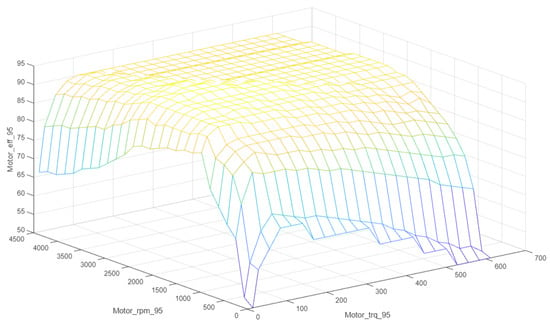
Figure 7.
Example of efficiency distribution of motor configuration A.
The operation of the vehicle model begins with the torque command from the virtual VCU and passes through the MCU limiter, which restricts the actual torque output via the motor controller. Subsequently, based on the output torque value in conjunction with the current motor speed, the model returns the powertrain system’s efficiency and overall power consumption through a power and efficiency estimator process. For a more detailed illustration, refer to Figure 8. These two functions collectively represent the workflow from the torque command to the actual torque output, taking into account the torque output boundaries and efficiency contours. The outputs from this stage are further utilized by the vehicle model in the subsequent sections.
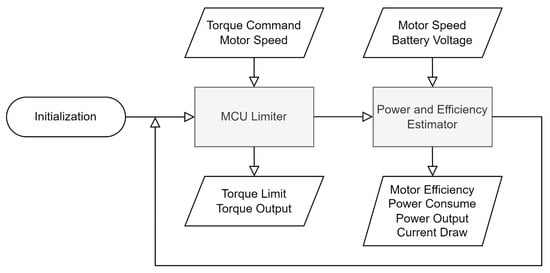
Figure 8.
Workflow of the powertrain model.
2.3.4. Vehicle Model
Like most vehicle models introduced in the Introduction section, this study develops a one-degree-of-freedom (DOF) vehicle model using a forward-facing approach. This is necessary for 3D visualization and the interconnection of the target vehicle’s hardware via the CAN network. This function is carried out by the vehicle dynamics system within the lower control layer, with the aim of simulating the vehicle’s motion based on the forces applied to the front and rear driving axles in the driving direction. The detailed free-body diagram of the one-DOF vehicle model is illustrated in Figure 9. Equations (1)–(3) represent the equations used for the net force and moment equilibrium under the vehicle frame coordinate system.
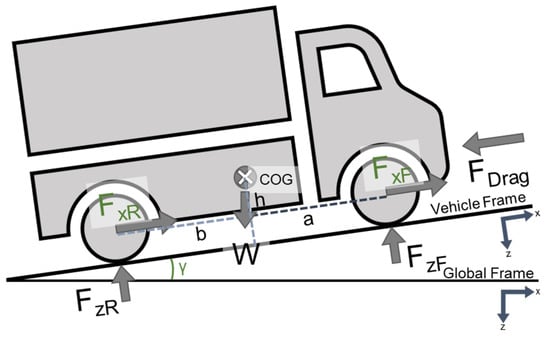
Figure 9.
Free-body diagram of the vehicle body.
The first equation describes the overall vehicle motion in the longitudinal direction relative to the vehicle frame. It calculates the vehicle’s acceleration based on longitudinal forces on the front and rear axles (, ), air drag (FD), road incline angle (), and vehicle mass (m). Similarly, the second equation determines the vertical motion by equating the vertical forces on the front and rear axles (, ) to the vehicle’s weight (W) and road incline angle (). The third equation calculates the overall moment based on the position of the center of gravity.
3. Simulation Scenarios
Various factors can significantly affect driving mileage and overall power consumption in electric trucks. To gain a comprehensive understanding of electric vehicle (EV) performance and range, this study conducts simulations and analyses by investigating factors related to EV setup and driving scenarios. We categorize these factors into two main groups: vehicle setup and driving scenarios.
3.1. Vehicle Setup
In order to evaluate the overall power consumption during daily driving tasks, we consider several vehicle setup configurations in our simulations, refer to Table 4. These configurations include powertrain options, total vehicle mass settings, driving modes, and auxiliary power usage.

Table 4.
Compositions of vehicle setup configurations.
- Powertrain configuration: We consider three powertrain configurations as mentioned in the “Powertrain System” section. These different configurations may exhibit variations in efficiency, which can impact overall power consumption.
- Vehicle mass configuration: Vehicle mass is determined based on cargo loading situations, which are divided into two settings: 3000 kg under empty load and 6500 kg under maximum load. These configurations help us assess how cargo loads influence power consumption.
- Driving modes: We include standard and regenerative braking driving modes, as introduced previously and shown in Figure 6. These modes allow us to capture and analyze the effects of energy recuperation.
- Auxiliary power usage: We account for auxiliary power usage, such as infotainment systems, lighting, heating, ventilation, air conditioning (HVAC) systems, and accessories, all of which consume electrical power while driving. For simulations under maximum load, we set auxiliary power usage to 4750 watts based on experiments conducted on the target vehicle.
3.2. Driving Scenarios
To create simulation scenarios that closely mimic real-world road usage, we utilize two sets of route and speed data collected from full-day delivery trucks in the Greater Taipei metropolitan area in Taiwan. These scenarios serve as a reference for our simulations and are constructed using vehicle onboard units and global positioning system (GPS) receivers. Table 5 provides specifications for the two driving scenarios, while Figure 10 illustrates the selected routes for reconstructing these scenarios, and Figure 11 documents the velocity profile of these scenarios. By combining vehicle setup configurations and driving scenarios, we conduct a total of 24 test runs for simulation and analysis, and the test run numbers for the simulation configurations are shown in Table 6.

Table 5.
Two driving scenarios.
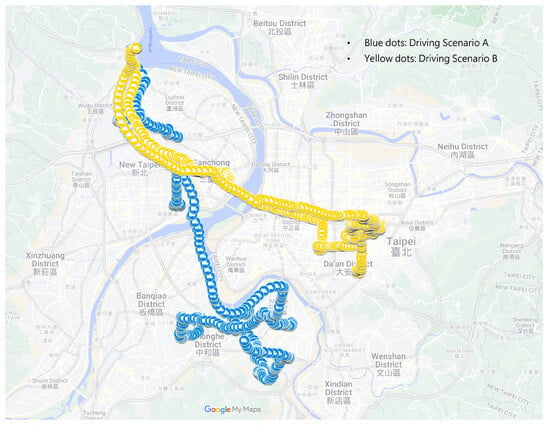
Figure 10.
Two simulation scenarios in the Greater Taipei metropolitan area; map data Google.
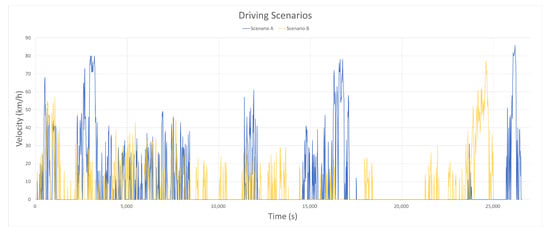
Figure 11.
Velocity profile of driving scenarios.

Table 6.
Simulation configurations versus run numbers.
4. Vehicle Model Validation
Before evaluating mileage among different powertrain and controller strategies, we must verify the vehicle and controller models’ basic availability and reliability. The following test scenario is proposed.
Drive–brake test: This verifies the vehicle body’s integration with the powertrain options. The maneuver starts with full-throttle acceleration for 24 s, followed by full braking after a one-second transition until the end of the simulation, as shown in Figure 12. Six test runs with different powertrain configurations and vehicle masses are conducted. Detailed configurations are in Table 7 and Table 8.
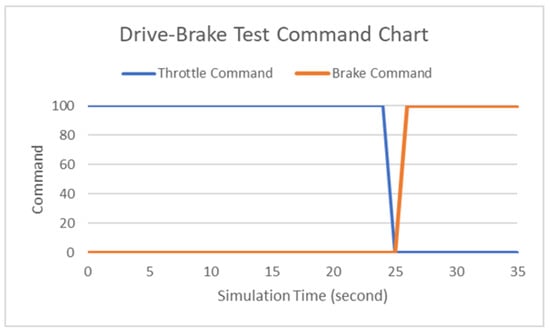
Figure 12.
Test profile of drive–brake simulation.

Table 7.
Drive–brake test simulation configuration.

Table 8.
Drive–brake test simulation configuration.
Six test runs were conducted to validate the vehicle model. The analysis was based on indices such as maximum velocity, time to maximum velocity, time to stop, power consumption, and total driving distance. The results aligned with expectations for different powertrain configurations. Powertrains with higher power output achieved better acceleration. Under full load, maximum velocity decreased by around 5 kph and time to full stop doubled. The vehicle’s mass impacted acceleration and deceleration performance. These results confirmed the vehicle model’s ability to accurately simulate the actual vehicle’s behavior and performance under different conditions. Detailed results are in Figure 13 and Table 9, Table 10, Table 11, Table 12 and Table 13.
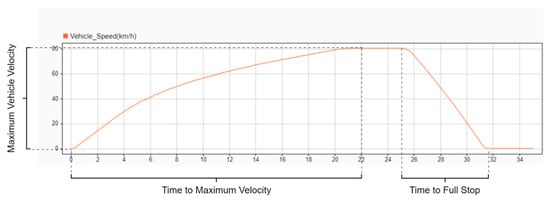
Figure 13.
Example of velocity profile of drive–brake test result indices.

Table 9.
Maximum vehicle velocity (kph).

Table 10.
Time to maximum velocity (s).

Table 11.
Time span to full stop (s).

Table 12.
Total power consumption (kWh).

Table 13.
Total driving distance (km).
5. Results and Observations
This section presents an analysis of the simulation results, focusing on overall power consumption, regenerative braking energy recuperation, and mileage estimation. The analysis considers various factors, including driving scenarios, regenerative braking options, total vehicle mass setups, and powertrain configurations.
5.1. Driving Scenarios and Powertrain Configurations
The study compares power consumption and mileage under different driving scenarios (Scenarios A and B) and powertrain configurations (Configurations A, B, and C). Six test runs are analyzed, focusing on power consumption per kilometer for scenarios with the same vehicle configuration (3000 kg of vehicle mass with regenerative braking disabled). The results are summarized in Table 14 and as follows:

Table 14.
Results comparison for power consumption between powertrains and driving scenarios.
- Scenario B consumes 9.3% to 10.9% more energy compared to Scenario A with the same vehicle configuration. Scenario A provides an estimated 10.5 km of extra driving range on average.
- Powertrain Configuration A consumes the least energy among the three options, resulting in savings of up to 1.8% and 3.0% compared to the average power consumption of Configuration C under Scenarios A and B, respectively.
5.2. Regenerative Braking and Vehicle Mass
The study investigates the impact of regenerative braking and total vehicle mass configurations (3.0 tons and 6.5 tons) on power consumption and energy recuperation. Four test runs are selected for analysis. The results are summarized in Table 15 and as follows: When regenerative braking is activated, overall power consumption decreases by up to 6.7%, and the recuperated energy increases with higher total vehicle mass. This suggests that regenerative braking can mitigate the impact of increased mass on power consumption and mileage.

Table 15.
Results comparison of power consumption between different driving scenarios.
5.3. Optimized Vehicle Configuration
Four simulation test runs—two per each driving scenario—are chosen to investigate the gaps in power consumption and mileage between different vehicle configurations. The results are summarized as Table 16. As can be seen under optimized vehicle configuration, the difference in power consumption between the best and worst scenarios can be up to 25.1% in Scenario A, resulting in 26.3 km more mileage available under a single charge. In Scenario B, the gap in power consumption is reduced, resulting in a difference of 19.3% between the best and worst scenarios.

Table 16.
Comparison between the best and the worst simulation results.
6. Concluding Remarks
This study developed a versatile electric truck model in MATLAB/Simulink featuring multiple powertrain options and advanced vehicle controls, including regenerative braking, one-pedal drive (OPD), and adaptive cruise control. The simulation results demonstrate the significant impact of vehicle configurations on power consumption and mileage across various scenarios. Notably, regenerative braking offers enhanced energy economy, reduces mechanical brake wear, and shows promise for integration with OPD. However, optimizing regenerative braking algorithms to accommodate diverse powertrain options and maximize efficiency remains a challenge. The simulations incorporate real-world driving scenarios to align closely with actual conditions, enhancing the model’s applicability.
The effectiveness of this open-source vehicle model in evaluating performance and energy consumption is confirmed. It also facilitates the verification of user-developed functions and algorithms through its visualization interface. The in-the-loop functionalities, depicted in Figure 14, extend its capabilities. The driver-in-the-loop (DiL) concept allows for the simulation of vehicle controllers with virtual drivers in an interactive environment, streamlining the validation process and enabling the development of controllers via user feedback. This approach is safer, more cost-effective, and more controlled compared to real-world vehicle tests.
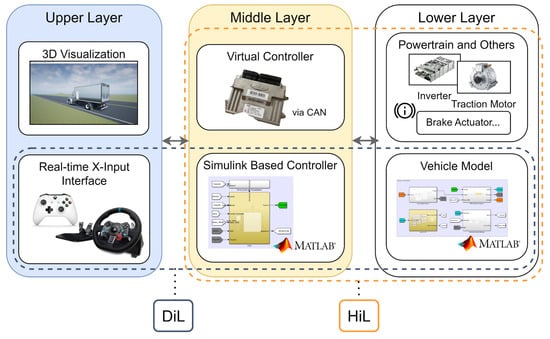
Figure 14.
Schematic of driver-in-the-loop and hardware-in-the-loop concept.
Additionally, the hardware-in-the-loop (HiL) method supports real-time validation of adaptive cruise control algorithms by integrating actual sensors and a Simulink-based controller model with the physical vehicle body. Utilizing CAN bus communication for system control, this setup bridges the gap from model-in-the-loop simulations to real-time hardware testing, enabling comprehensive assessment of user-defined controllers with minimal hardware requirements. The HiL methodology enhances the co-simulation capabilities across various driver profiles and hardware configurations using a real-world test bench.
In conclusion, the developed vehicle model and its robust in-the-loop functionalities provide a powerful tool for evaluating vehicle performance, energy consumption, and advanced control algorithms, effectively bridging the gap between theoretical simulations and practical implementation. This open-source model stands to significantly shorten research and development cycles for vehicles, particularly commercial trucks, within the research community.
7. Access to the Vehicle Model
Readers can access the vehicle model utilized in this study via GitHub to explore additional functions and configurations. This includes 3D visualization, manual driving via XInput devices, hardware-in-the-loop simulation through the CAN interface, sensor integration for automotive driving tests, and the ability to customize vehicle configurations for simulation in preferred environments. For access to the vehicle model, please refer to the URL below: Available online: https://github.com/Rchi666/EV_Truck_Model.git (access on 15 September 2023).
Author Contributions
Methodology, C.-J.P. and K.-Y.C.; Software, C.-J.P. and Y.-T.L.; Validation, C.-J.P. and Y.-T.L.; Investigation, C.-J.P.; Resources, K.-Y.C.; Data curation, C.-J.P., Y.-T.L. and K.-Y.C.; Writing—original draft, C.-J.P.; Writing—review & editing, C.-J.P., Y.-T.L. and K.-Y.C.; Supervision, K.-Y.C.; Project administration, C.-J.P. and K.-Y.C.; Funding acquisition, K.-Y.C. All authors have read and agreed to the published version of the manuscript.
Funding
This work is partially supported by the National Science and Technology Council in Taiwan under grant NSTC 110-2221-E002-136-MY3.
Data Availability Statement
The data and models used in this work are open-source and are available to the public. Detailed information about the data and instructions for using the model can be found in Appendix A.
Conflicts of Interest
The authors declare no conflicts of interest.
Appendix A. GitHub Repository
- EV truck model: A battery electric truck model based on MATLAB/Simulink environment by CJ. Peng, SOLAB, National Taiwan University. Available online: https://github.com/Rchi666/EV_Truck_Model.git (access on 15 September 2023).
- Simulation process: Users can select which driving profile to conduct for simulation in the following context; examples of a pre-defined driving profile and an NEDC driving cycle are shown for selection. The simplified flowchart is as follows:
- (a)
- Open selected .m file in MATLAB;
- (b)
- Set user-defined parameters such as total mass, initial state of charge, powertrain;
- (c)
- Open vehicle model in Simulink;
- (d)
- Select and set drive cycle in Drive Cycle and Visualization Block;
- (e)
- Update simulation time;
- (f)
- Check solver and step size in Simulink at the bottom-right;
- (g)
- Enable fast restart if multiple simulations are required to decrease the time for compiling;
- (h)
- Run simulation in MATLAB;
- (i)
- Select proper template in Simulink data inspector;
- (j)
- Save results after end of simulation.
- How to run simulation: Users can change the following parameters in the .m files (if other parameters have to be changed, please go to the Simulink model). Note: the whole process may take several hours according to the processing ability of your hardware
- Veh_mass: total vehicle mass in kg;
- Power_option: three powertrain options available;
- Batt_soc_init: initial state of charge of the vehicle, set between 0 to 100%;
- Elec_aux_sw: choose whether to activate auxiliary power components, which affects the driving mileage available;
- Elec_rgn_sw: choose whether to activate regenerative braking—users can re-define this function in the virtual VCU;
- Run_number: numbers of iterations.
- User pre-defined driving profile:
- (a)
- Open automation_REAL.m in MATLAB Pre-defined Files folder
- (b)
- Add both MATLAB Pre-defined Files and Simulink Vehicle Model to the path by selecting both folders in the Current Folder on the left-hand side in MATLAB; select both folders, right click, and choose Add to Path for the selected folders and subfolders to ensure MATLAB can access the files required during simulation;
- (c)
- Run the simulation by pressing the Run button on the EDITOR page; the process should proceed in few minutes;
- (d)
- After the Simulink data inspector pops out, select the proper template on the Visualization and layouts page, Saved views, Open saved views;
- (e)
- Save results after end of simulation.
- For NEDC driving cycles:
- (a)
- Open automation_NEDC.m in MATLAB Pre-defined Files folder;
- (b)
- Add both MATLAB Pre-defined Files and Simulink Vehicle Model to the path by selecting both folders in the Current Folder on the left-hand side in MATLAB; select both folders, right click, and choose Add to Path for selected folders and subfolders to ensure MATLAB can access files required during simulation;
- (c)
- Open Simulink model EV_Truck_Model.slx;
- (d)
- Change the driving cycle using the Drive Cycle and Visualization block; reconnect the bus from the user pre-defined profile to the Drive Cycle Source;
- (e)
- Open Drive Cycle Source, change Drive Cycle Source to NEDC, and Update simulation time and save;
- (f)
- Enable Fast Restart;
- (g)
- Go back to MATLAB and run the simulation by pressing the Run button on the EDITOR page; the process should proceed in a few minutes;
- (h)
- After the Simulink data inspector pops out, select the proper template: TempleteNEDC.mldatx in the page Visualization and layouts, Saved views, Open saved views;
- (i)
- A single simulation run may take a while according to the capability of your hardware. A total of 48 cycles are conducted for a single run, and you may change the configuration in the loop of the .m file;
- (j)
- Save results after end of simulation.
Please contact pengcj@solab.me.ntu.edu.tw for further discussion.
References
- Ricardo, M.; Apostolos, P.; Yang, M. Overview of Boosting Options for Future Downsized Engines. Sci. China Technol. Sci. 2011, 54, 318–331. [Google Scholar] [CrossRef]
- Barnitt, R. FedEx Express Gasoline Hybrid Electric Delivery Truck Evaluation: 12-Month Report; Technical Report; National Renewable Energy Lab: Golden, CO, USA, 2011. [Google Scholar]
- Grube, T.; Kraus, S.; Reul, J.; Stolten, D. Passenger car cost development through 2050. Transp. Res. Part D Transp. Environ. 2021, 101, 103110. [Google Scholar] [CrossRef]
- Yoong, M.; Gan, Y.; Gan, G.; Leong, C.; Phuan, Z.; Cheah, B.; Chew, K. Studies of regenerative braking in electric vehicle. In Proceedings of the 2010 IEEE Conference on Sustainable Utilization and Development in Engineering and Technology, Kuala Lumpur, Malaysia, 20–21 November 2010; pp. 40–45. [Google Scholar]
- Boekel, J.; Besselink, I.; Nijmeijer, H. Design and realization of a One-Pedal-Driving algorithm for the TU/e Lupo EL. World Electr. Veh. J. 2015, 7, 226–237. [Google Scholar] [CrossRef]
- Wang, J.; Besselink, I.; van Boekel, J.; Nijmeijer, H. Evaluating the Energy Efficiency of a One Pedal Driving Algorithm. In Proceedings of the 2015 European Battery, Hybrid and Fuel Cell Electric Vehicle Congress (EEVC 2015), Brussels, Belgium, 1–4 December 2015. [Google Scholar]
- Cuma, M.; Ünal, C.; Savrun, M. Design and implementation of algorithms for one pedal driving in electric buses. Int. J. Eng. Sci. Technol. 2021, 24, 138–144. [Google Scholar] [CrossRef]
- Adegbohun, F.; Von Jouanne, A.; Phillips, B.; Agamloh, E.; Yokochi, A. High performance electric vehicle powertrain modeling, simulation and validation. Energies 2021, 14, 1493. [Google Scholar] [CrossRef]
- Mapelli, F.L.; Tarsitano, D. Modeling of full electric and hybrid electric vehicles. In New Generation of Electric Vehicles; IntechOpen: London, UK, 2012. [Google Scholar]
- Rus, C.; Leba, M.; Risteiu, M.N.; Marcus, R. Modeling and Simulation of Electric Vehicle Driveline. In Proceedings of the 2023 18th Iberian Conference on Information Systems and Technologies (CISTI), Aveiro, Portugal, 20–23 June 2023; IEEE: Piscataway, NJ, USA, 2023; pp. 1–6. [Google Scholar]
- Schaltz, E.; Soylu, S. Electrical vehicle design and modeling. Electr. Veh.-Model. Simul. 2011, 1, 1–24. [Google Scholar]
- Rodriguez, R. A Study on the Impact of Driver Behavior on the Energy Consumption of Electric Vehicles in a Virtual Traffic Environment. Ph.D. Thesis, University of Michigan, Ann Arbor, MI, USA, 2020. [Google Scholar]
- Gao, W.; Mi, C.; Emadi, A. Modeling and Simulation of Electric and Hybrid Vehicles. Proc. IEEE 2007, 95, 729–745. [Google Scholar] [CrossRef]
- Markel, T.; Brooker, A.; Hendricks, T.; Johnson, V.; Kelly, K.; Kramer, B.; O’Keefe, M.; Sprik, S.; Wipke, K. ADVISOR: A systems analysis tool for advanced vehicle modeling. J. Power Sources 2002, 110, 255–266. [Google Scholar] [CrossRef]
- An, F.; Rousseau, A. Integration of a Modal Energy and Emissions Model into a PNGV Vehicle Simulation Model, PSAT 2001-01-0954; SAE Transactions; SAE International: Warrendale, PA, USA, 2001. [Google Scholar]
- Kongjeen, Y.; Bhumkittipich, K. Modeling of electric vehicle loads for power flow analysis based on PSAT. In Proceedings of the 13th International Conference on Electrical Engineering/Electronics, Computer, Telecommunications and Information Technology (ECTI-CON), Chiang Mai, Thailand, 28 June–1 July 2016; pp. 1–6. [Google Scholar]
- Butler, K.; Ehsani, M.; Kamath, P. A Matlab-based modeling and simulation package for electric and hybrid electric vehicle design. IEEE Trans. Veh. Technol. 1999, 48, 1770–1778. [Google Scholar] [CrossRef]
- Vehicle & Mobility Systems Department, Argonne National Laboratory. Simulate State-of-the-Art Vehicle Energy Consumption, Performance, and Cost with Autonomie. Available online: https://vms.taps.anl.gov/tools/autonomie/ (accessed on 17 June 2024).
- López-Ibarra, J.; Gaztañnaga, H.; Joel, A.; Rahkola, P.; Ranta, M.; Pihlatie, M. Electric Bus Forward and Backward Models Validation Methodology Based on Dynamometer Tests Measurements. In Proceedings of the 2020 IEEE Vehicle Power and Propulsion Conference (VPPC), Gijon, Spain, 18 November–16 December 2020; pp. 1–7. [Google Scholar]
- dSPACE GmbH. Hadware-in-the-Loop Testing; dSPACE GmbH: Paderborn, Germany, 2012. [Google Scholar]
- dSPACE GmbH. Model Desk; dSPACE GmbH: Paderborn, Germany, 2023. [Google Scholar]
Disclaimer/Publisher’s Note: The statements, opinions and data contained in all publications are solely those of the individual author(s) and contributor(s) and not of MDPI and/or the editor(s). MDPI and/or the editor(s) disclaim responsibility for any injury to people or property resulting from any ideas, methods, instructions or products referred to in the content. |
© 2024 by the authors. Licensee MDPI, Basel, Switzerland. This article is an open access article distributed under the terms and conditions of the Creative Commons Attribution (CC BY) license (https://creativecommons.org/licenses/by/4.0/).