1. Introduction
The development of vehicle drive systems aims to achieve high customer benefits while maximizing profits [
1]. Such high customer benefits can be represented, for example, by a high range, which depends on the size of the energy storage unit but is also influenced by the efficiency of the drive system [
2,
3]. Furthermore, a high usable driving performance also serves the customer benefit but is usually in conflict with high efficiency due to the characteristics of drive systems [
4]. At the same time, the development process strives to minimize costs, both in terms of purchase prices from the customer and production costs for the manufacturer. In addition, a compact and lightweight design of the power unit is desirable.
To achieve these target criteria, a variety of different drive concepts can be considered. Thus, the development of vehicle drive systems constantly involves new concepts that differ from one another in terms of technology, design, execution, and more [
5]. This results in an almost unlimited variety of concept variants that require a suitable approach for processing. While [
6], for example, dealt with a simplified evaluation of costs and performances based on scaled and optimized drive components, this work serves the holistic evaluation with respect to initially defined criteria. The unique contributions of this study include the freely selectable evaluation criteria and independence from specific drive technology.
In order to evaluate these concepts, suitable methods are needed that reflect the individual strengths and weaknesses of the concepts. The derivation of key indicators for evaluation enables the selection of the best system based on defined evaluation criteria. The methodological approaches of this work represent a framework for the evaluation of vehicle drive systems, composed of key figures from relevant criteria. In doing so, the evaluation method is defined in a universally valid way so that every type of drive system can be compared with and evaluated holistically.
2. Methodological Approach
When considering the overall process of developing drive systems, the evaluation methods presented in this paper are placed at the end. Once the specifications and requirements are defined, the design process for the drive components begins. The drive system is then available in its entirety for a system evaluation.
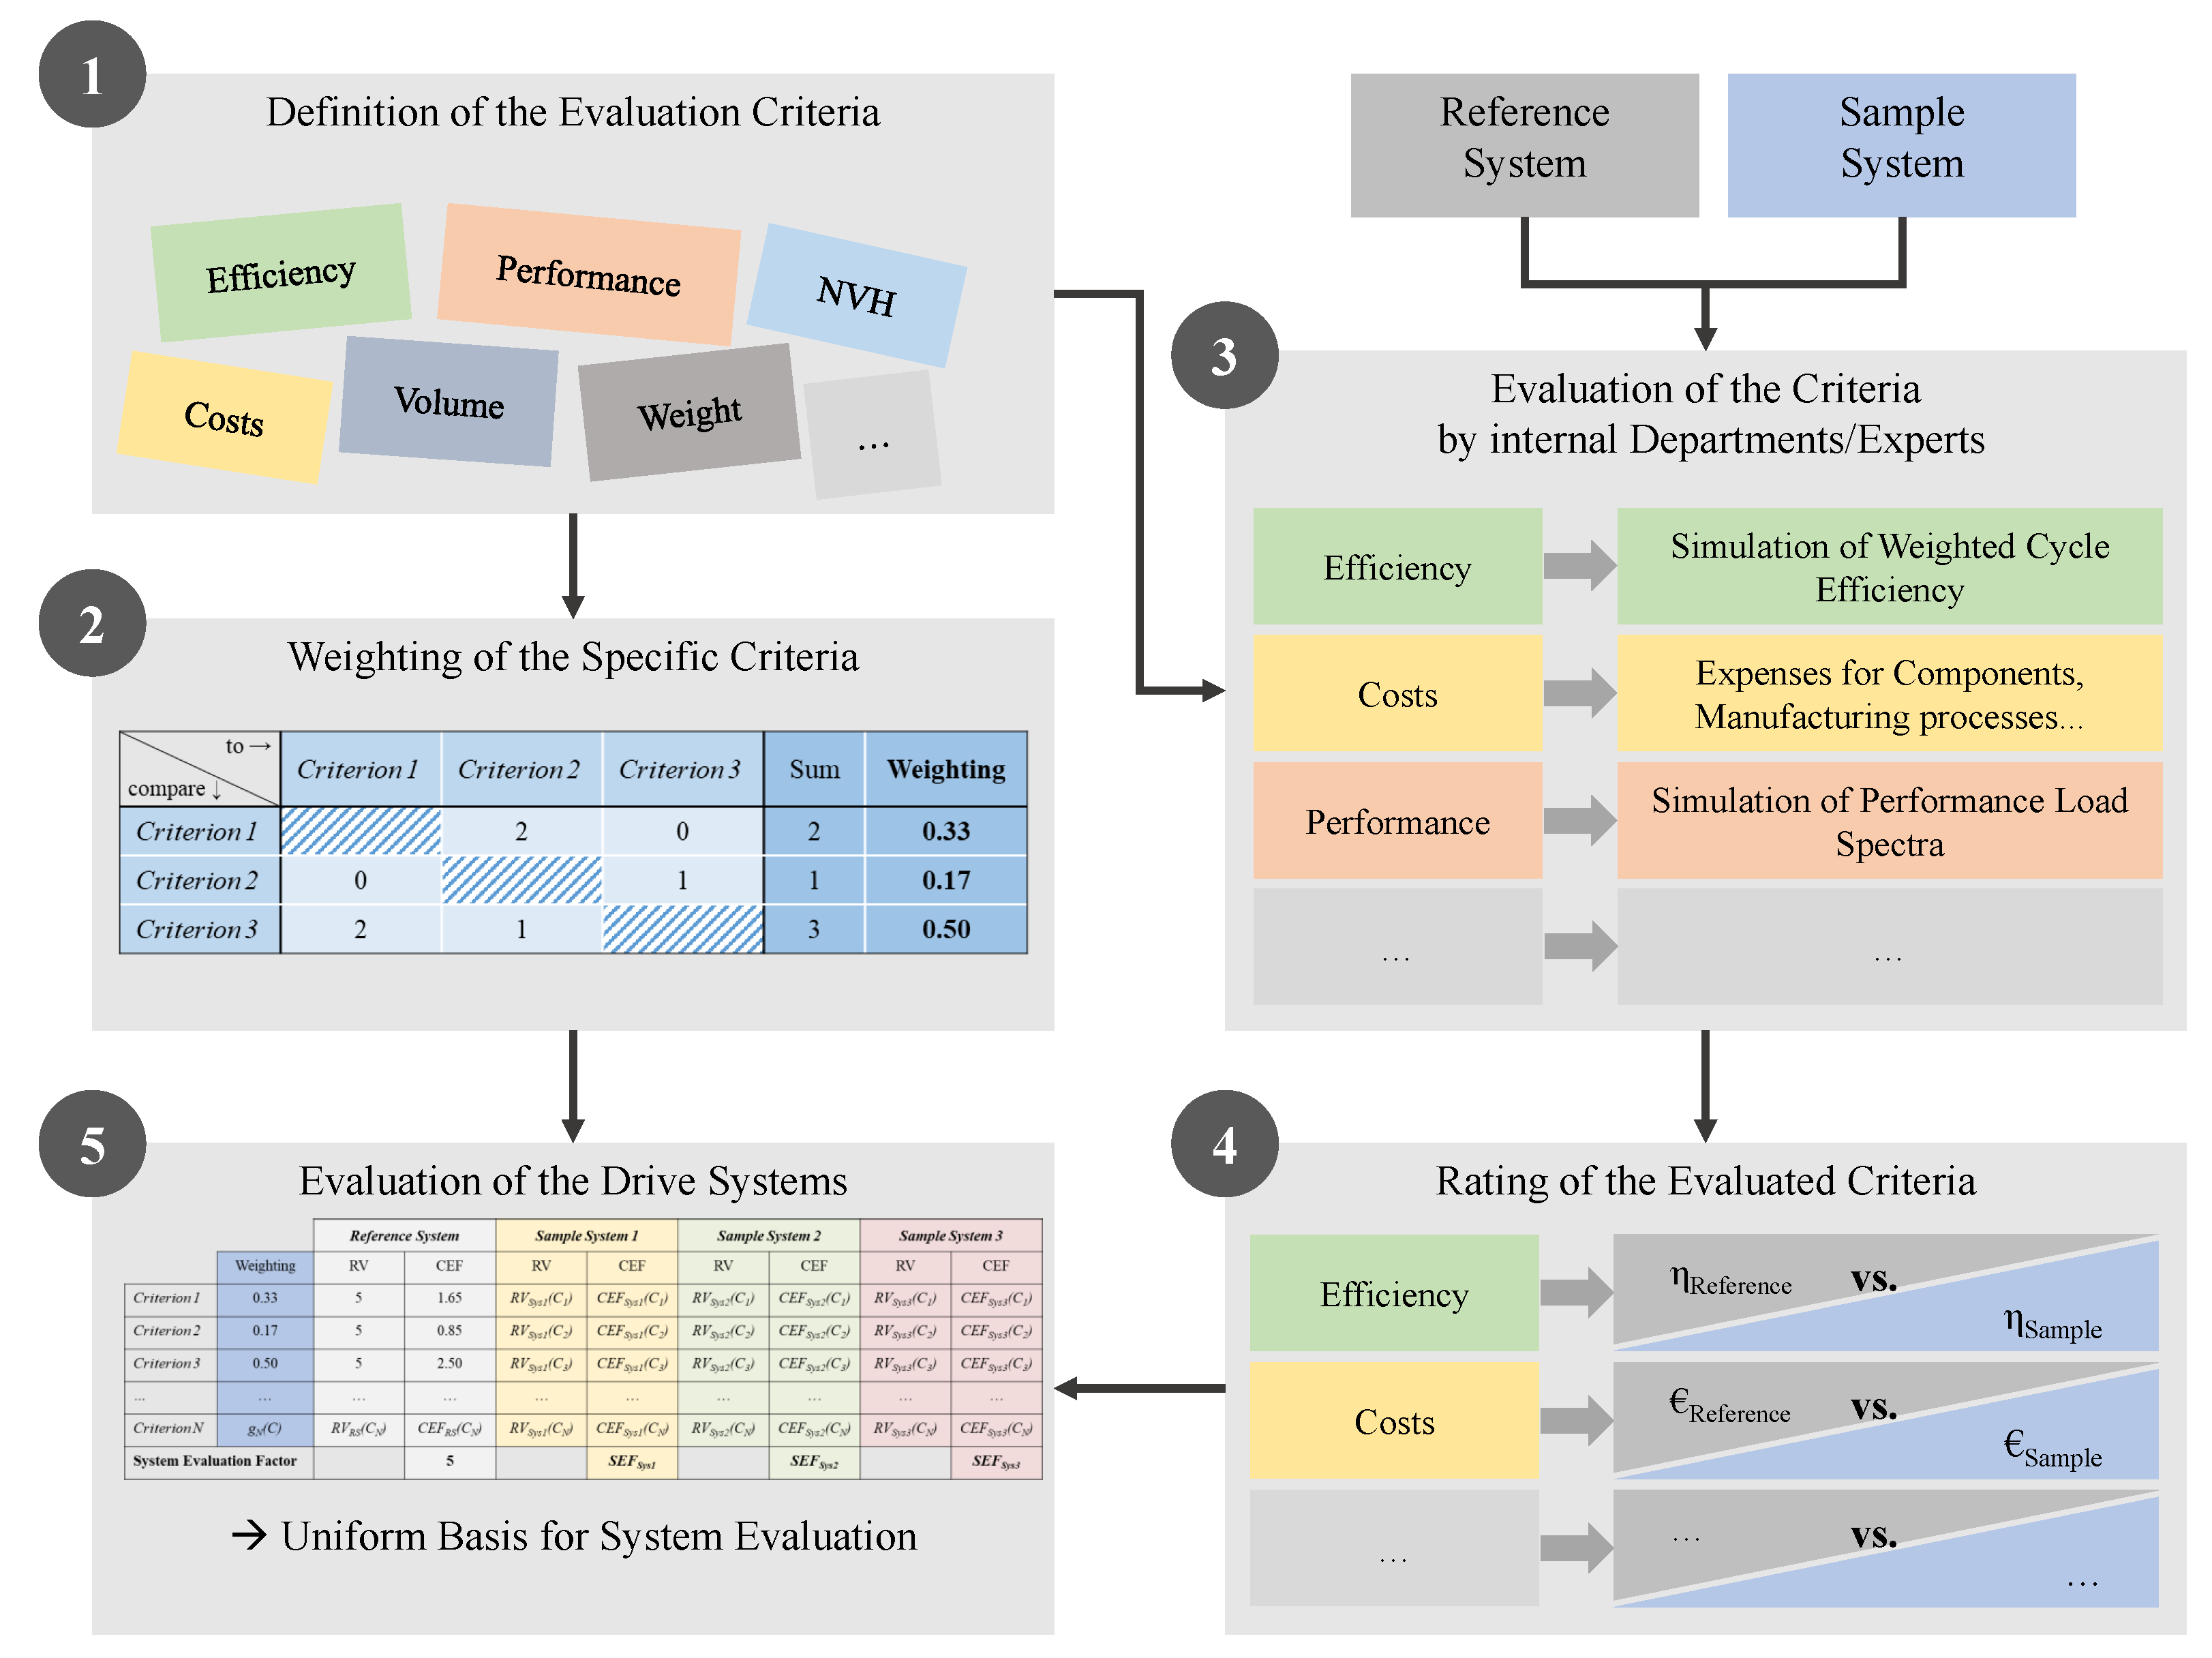
As visualized in
Figure 1, the methodological approach of this work begins with the definitions of specific evaluation criteria, such as efficiency or costs. These defined criteria are then weighted in relation to each other, and weighting factors are determined. With the support of experts from internal departments, these criteria can be evaluated for both a reference drive system and a sample drive system. For example, efficiency can be determined using simulated cycle efficiencies, costs are made up of material and manufacturing costs, and simulations of performance load spectra quantify the overall performance of the drives. These investigations produce concrete results, e.g., how efficient or expensive the drive systems are. In the fourth step, the calculated values, such as the cycle efficiency and determined costs, are compared with the respective values of the reference system, and rated. The final system evaluation is carried out together with the weighting factors from Step 2. Comparing it with a reference drive establishes a uniform basis for comparison.
3. Criteria for the Evaluation
In order to assess different drive systems comparably, concrete criteria for the evaluations must be defined. In this case, five criteria are chosen: efficiency, performance, cost, volume, and weight. However, these indicators can be freely chosen, and other technical aspects (such as thermal behavior and NVH) or even non-technical factors (such as environmental impacts or customer acceptance) could also be taken into account.
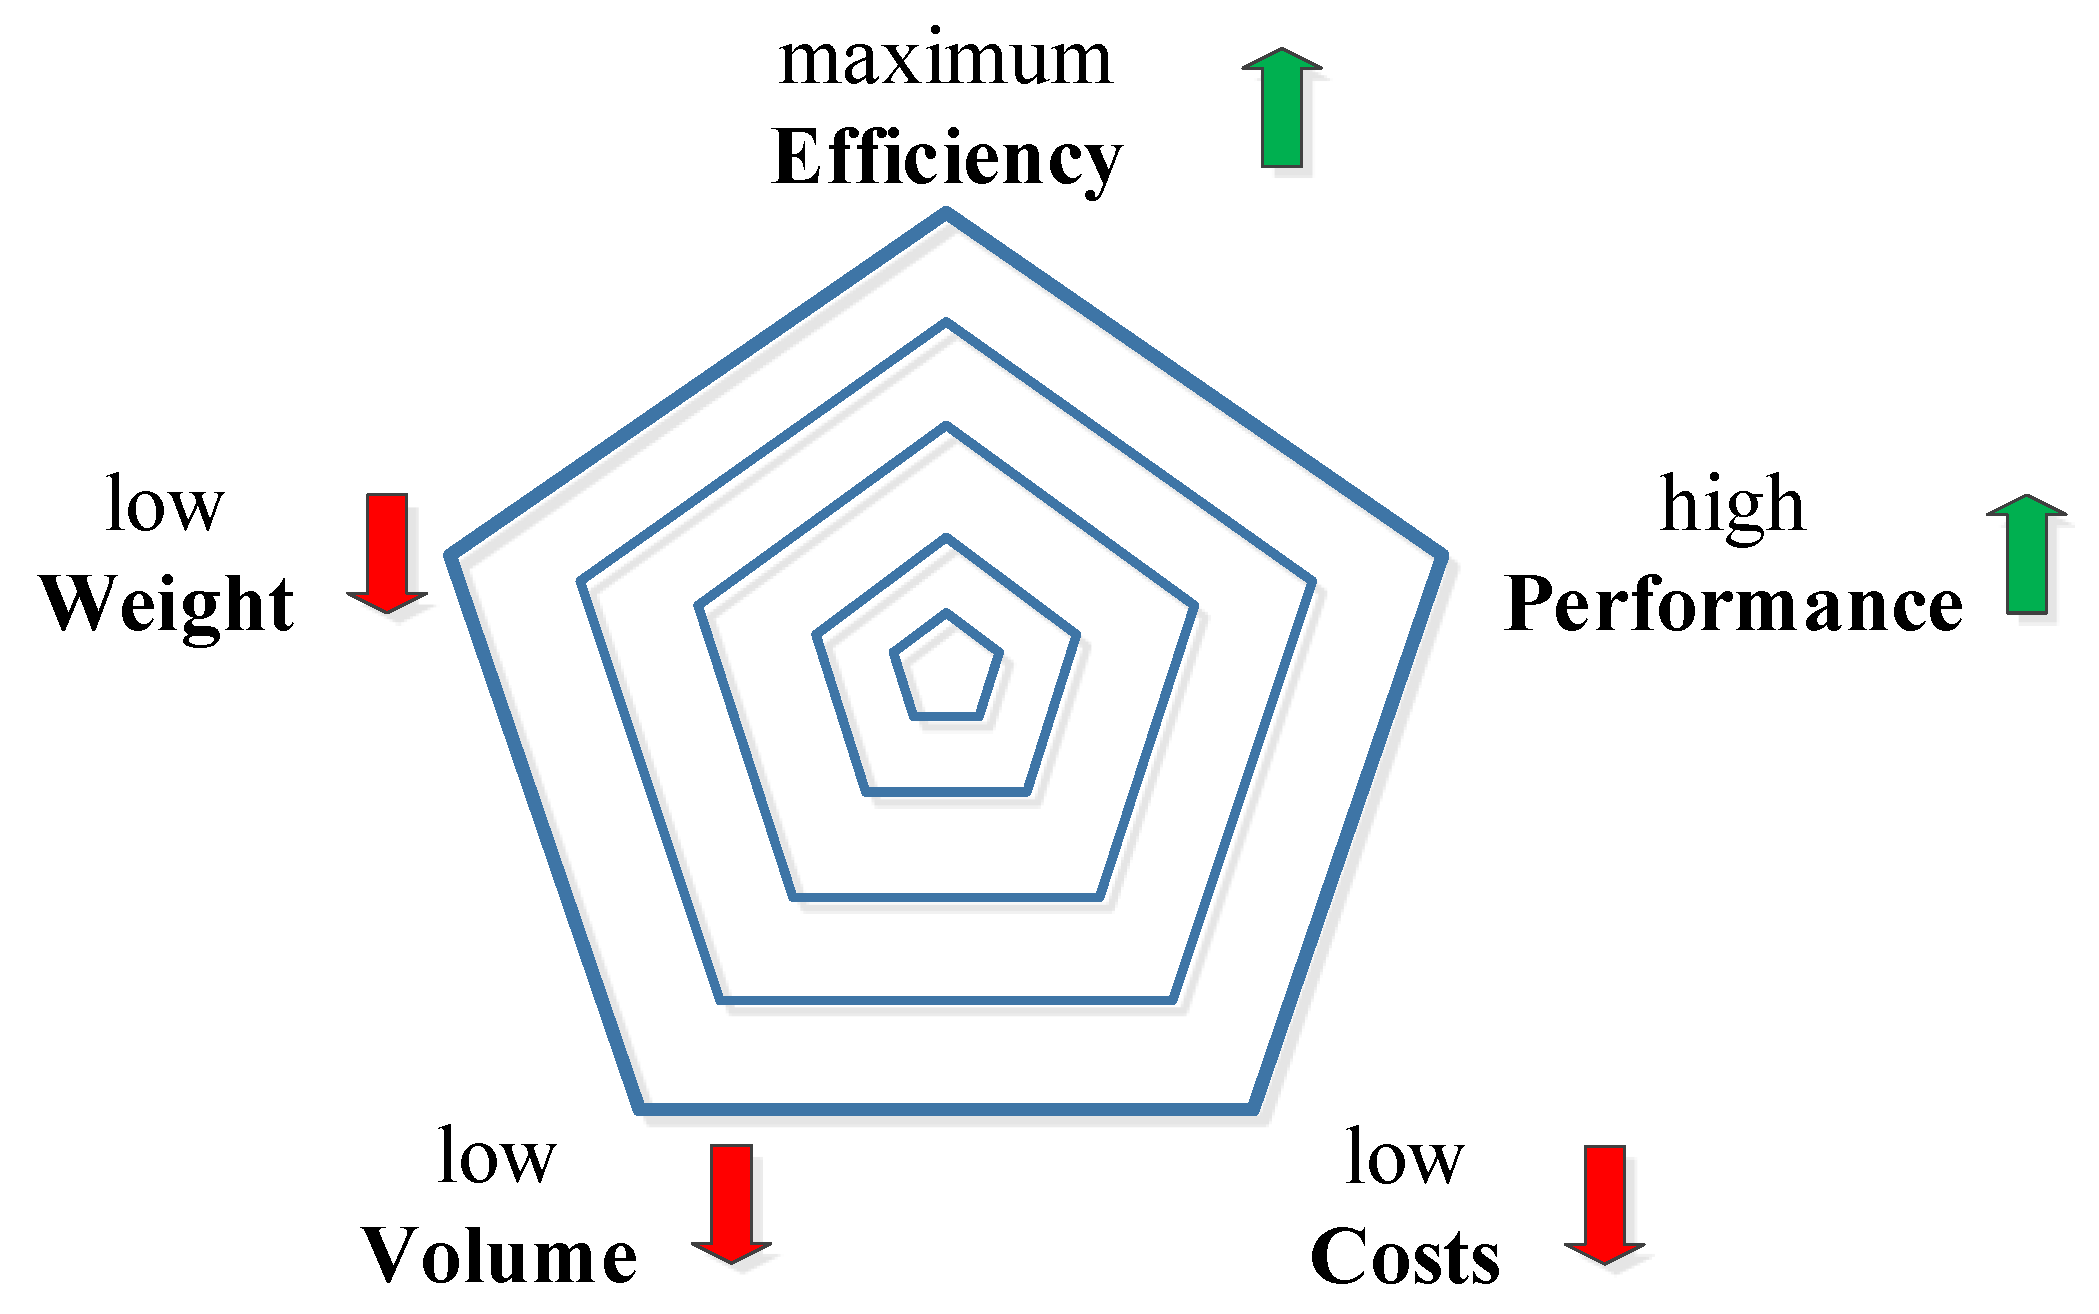
The initial aim is to deliver the greatest possible and tangible benefit for the customer in terms of efficiency and driving performance. High efficiency correlates with low consumption and, thus, a long range. The performance, on the other hand, can be measured by the maximum achievable power and torque of the powertrain.
At the same time, the weight and volume of the drive system need to be reduced as much as possible. Also, costs—including both purchase prices for the customer and production costs for the manufacturer—should be minimized. Since both high efficiency and high performance tend to correlate with increases in weight, volume, and cost, there is a conflict of objectives. This trade-off of opposing goals is visualized using a radar chart in
Figure 2. An ideal drive system would combine high efficiency and great performance with the lowest possible costs, weight, and volume.
To evaluate drive systems with regard to these criteria, all the required parameters must be available in a comparable form. Comparing two drives of different maturity levels may erroneously lead to wrong conclusions. In terms of efficiency, this means that the same system boundaries and system losses must be considered. Performance, such as output power, can be measured and, therefore, evaluated relatively easily. A level playing field must also be created for costs, e.g., by ensuring that both raw material and manufacturing costs, as well as expenses for tools, are taken into account.
The determination of these evaluation indicators is not discussed further in this work; instead, the focus is on the evaluation method and its exemplary application.
4. Methods
The described conflict of opposing goals represents a multi-objective optimization problem, which is addressed by established methods in the literature, e.g., [
7] and [
8]. Apart from these or other well-known approaches mentioned in [
9], this multi-criteria problem requires a suitable method of analysis that leads to rational decision-making.
While simultaneously optimizing multiple objects increases the complexity in decision-making, comparing only two criteria can reduce the complexity and, thus, facilitate the decision [
10]. This approach of comparing only two objects at a time is the basis of pairwise comparisons. This process of mutual evaluation of the objects leads to prioritization and ultimately to a hierarchy among the criteria. This priority can be interpreted as a weighting of the specific criterion and used for a multi-criteria decision-making (MCDM) method. In this context, [
11] provides a good overview of existing MCDM methods in the literature. Furthermore, [
12] analyzes the characteristics and utilities of individual methodological approaches. These utility analyses, such as the weighted sum model, divide an overall problem into smaller subproblems. This type of fragmentation allows the overall problem to be captured holistically yet stated in a simplified manner, facilitating decision-making on complex problems [
13].
In decision theory, pairwise comparison and utility analysis are common methods. Both are simple yet effective approaches, the combination of which is suitable for the given optimization problem, serving as a methodological basis. Furthermore, this work builds a framework for evaluating drive systems on the aforementioned methods.
4.1. Pairwise Comparison Method
A pairwise comparison (PWC) is a method of comparing entities or objects in order to judge which one has the greater amount of a quantitative property. These objects are contrasted and evaluated in pairs, with a rating score determining which of the two entities is preferred [
14]. The above-mentioned evaluation criteria can serve as such objects. By juxtaposing the criteria, every criterion is assigned a priority. Based on this prioritization, a weighting factor is determined for all criteria, representing the importance of the individual criterion. Two tasks set up the approach: comparing all combinations with respect to each criterion and computing the weights of the attributes [
15].
According to Formula (
1), this weighting factor for each criterion
C corresponds to the relative weighting
, which is defined as the ratio of absolute weighting
to the sum of weighting factors for
N criteria.
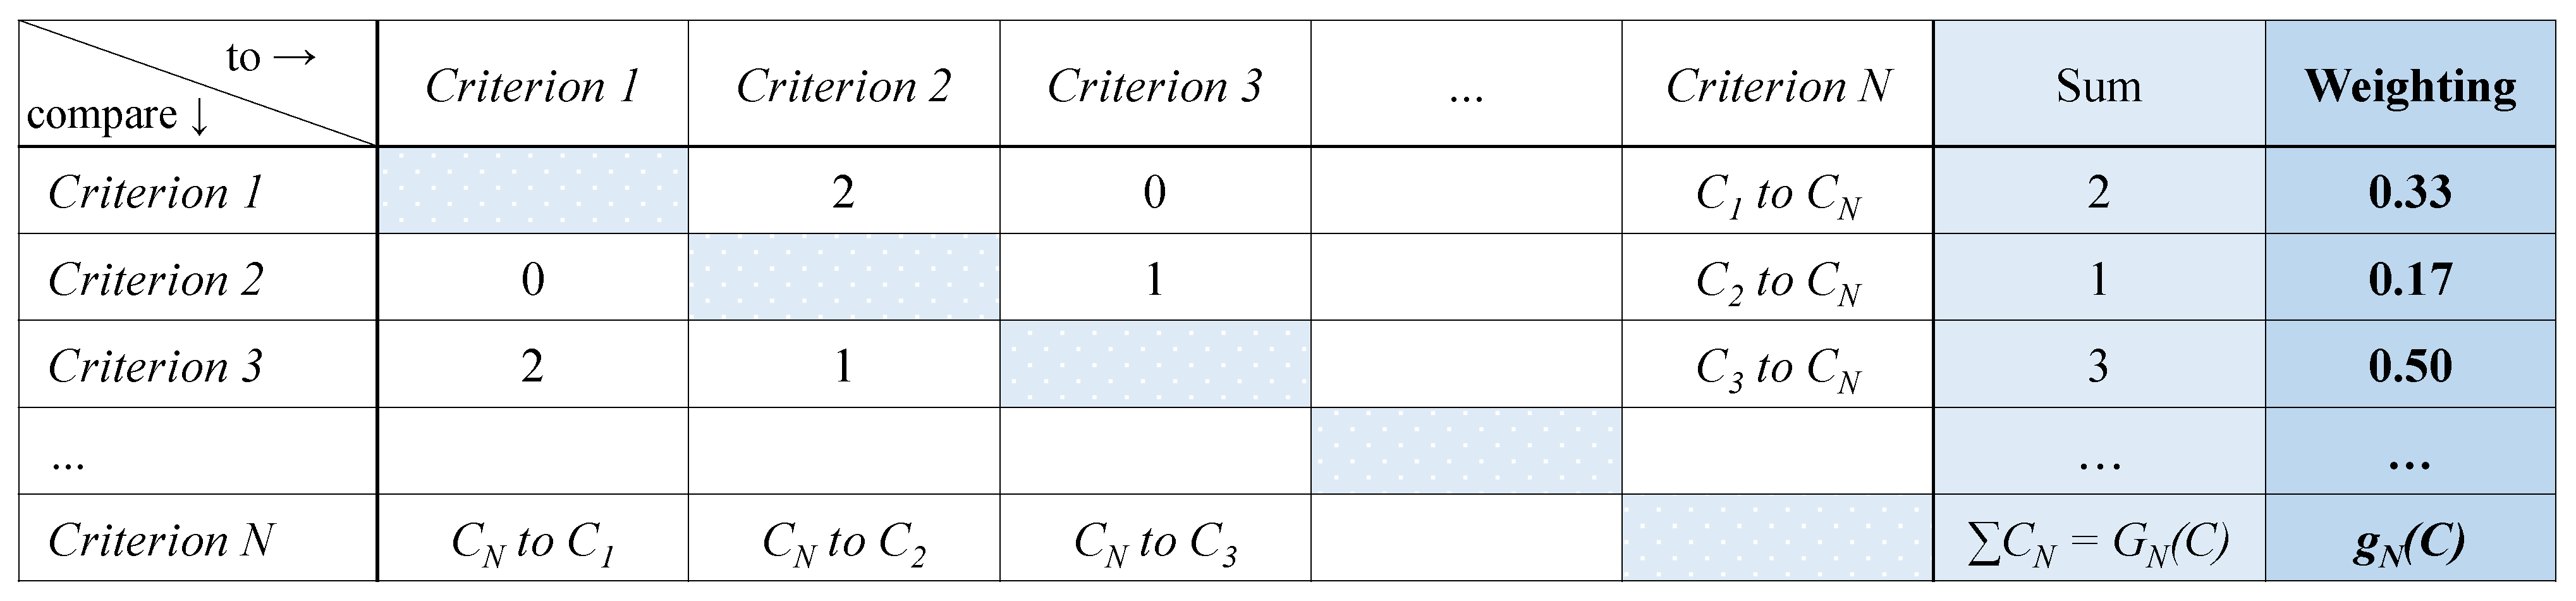
Figure 3 shows an example of a tabular pairwise comparison. First, all criteria,
, are listed in both vertical and horizontal directions. This is followed by comparing vertical elements with horizontal objects and assigning a scalar between 0 and 2. For this value, 0 means less important, 2 means more important, and 1 represents equal importance.
For example,
is less significant than
, represented by the value of 2, but just as important as
, which is expressed by the value of 1. The sum of these scalars gives the absolute weighting,
, and the weighting factor, consequently, represents the relative weighting,
. The functionality of PWC is further explained and visualized in [
16].
This procedure enables the pairwise prioritization of criteria. By defining the importance of objects among themselves, this comparison method is also well suited for highlighting small differences. Subsequently, the weighting factor comes into play in the weighted sum model.
4.2. Weighted Sum Model
The weighted sum model (WSM) is a proven method for utility analyses. The goal is to compare multiple systems with respect to various criteria by evaluating individual performance in that discipline. This assessment is represented by the rating value (RV). Moreover, each criterion can be weighted differently. Sticking with the weighting factors mentioned above, would have the greatest impact on the evaluation among multiple systems.
Based on these weighting factors, a criterion evaluation factor (CEF) is calculated for each system as well as each criterion according to Formula (
2).
Formula (
3) sums the
value per criterion for each system, resulting in the system evaluation factor (SEF).
This approach leads to an evaluation method that can be used, for example, to evaluate differently designed drive systems. The evaluation is represented by a single scalar. Thereby, the scale of rating values ranges from 0 (as the worst grade) to 10 (as the best grade).
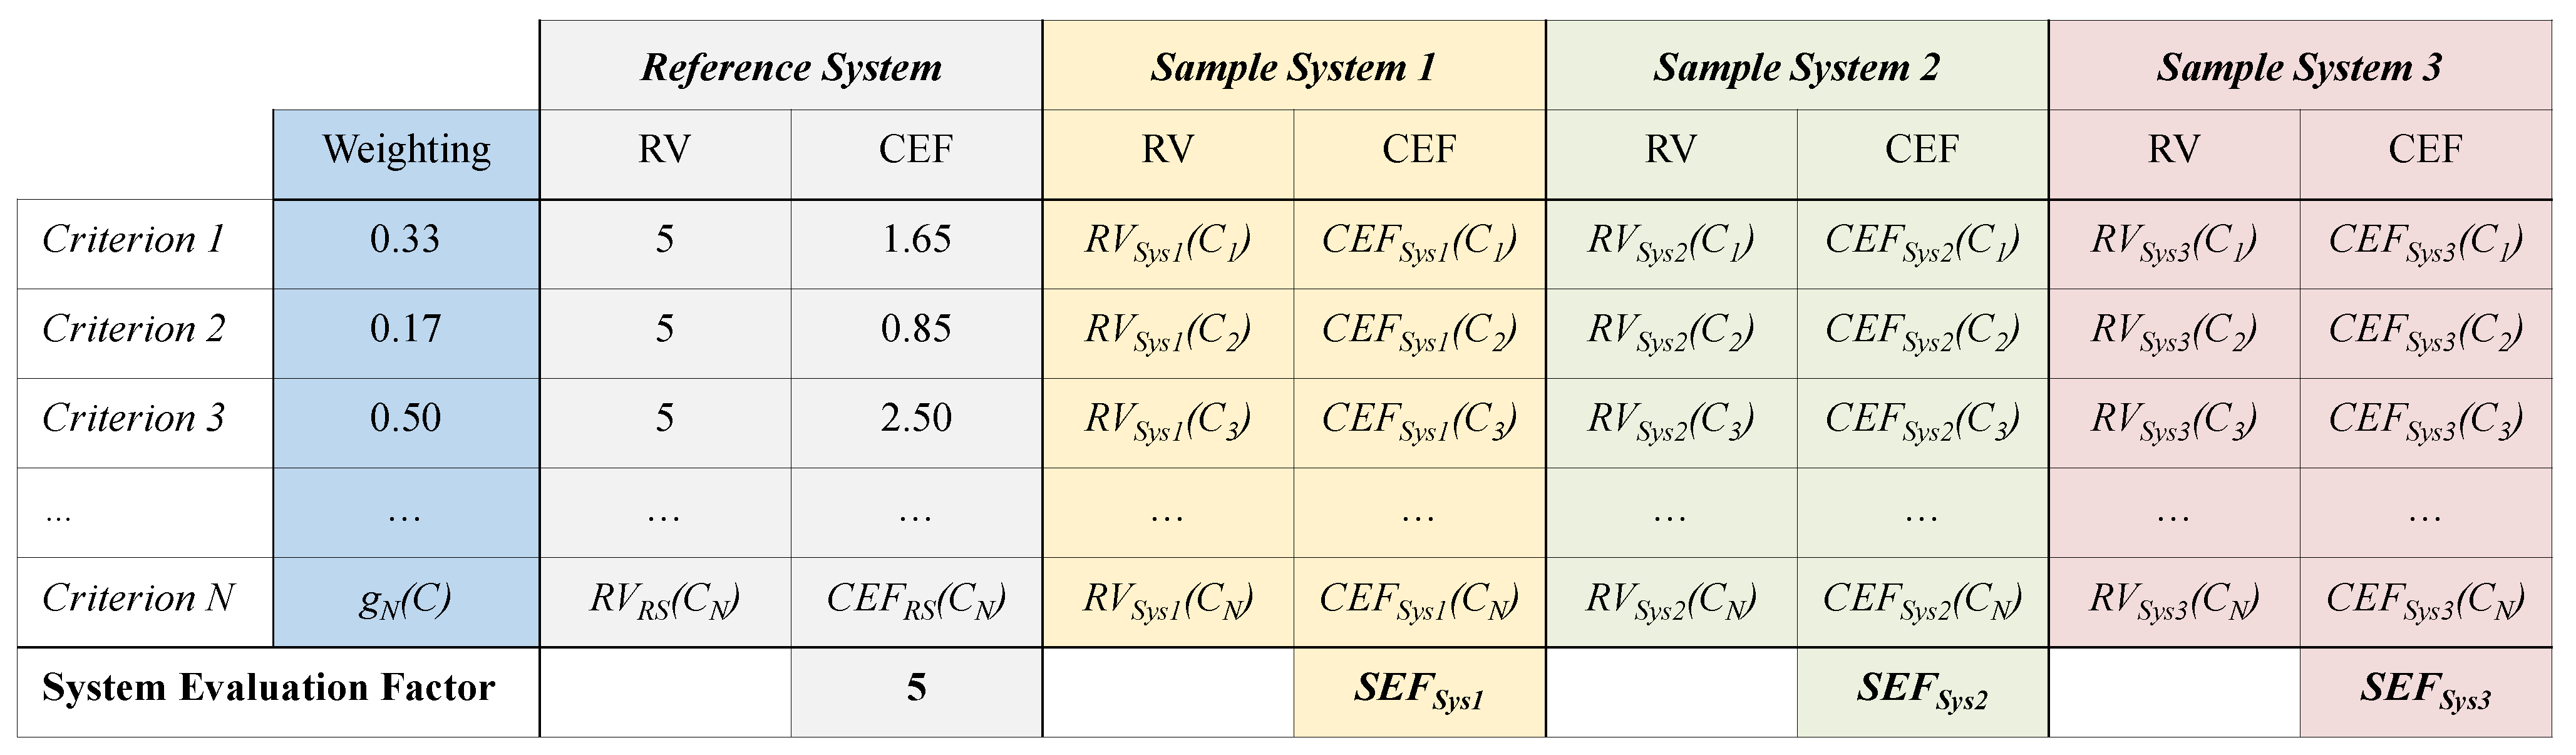
Figure 4 summarizes the methodical approach of the weighted sum model.
As shown, a reference drive system forms the basis for the evaluation of three sample systems. The rating values of this reference drive system are all equal to 5 and, thus, define the reference point. Consequently, the sum of all values also results in a value of 5. Depending on the chosen rating values for the sample systems, all values (as well as values) can be calculated according to the above-mentioned formulas.
5. Results
In order to practically demonstrate the functionality of the presented methods of PWC and WSM, this section deals with the comparison between three drive systems and a reference drive system. First of all, all drive systems are introduced with regard to their technical specifications. In order to reveal the results, two exemplary case studies with different weightings are then considered.
5.1. Reference Drive and Sample Drive Systems
The reference drive system offers a good compromise among the criteria of efficiency, performance, cost, volume, and weight. As mentioned, these criteria influence each other. For example, efficiency and cost have an almost linear relationship, meaning that a gain in efficiency is generally accompanied by an increase in costs. Likewise, an increase in performance tends to lead to increases in costs, weight, and volume [
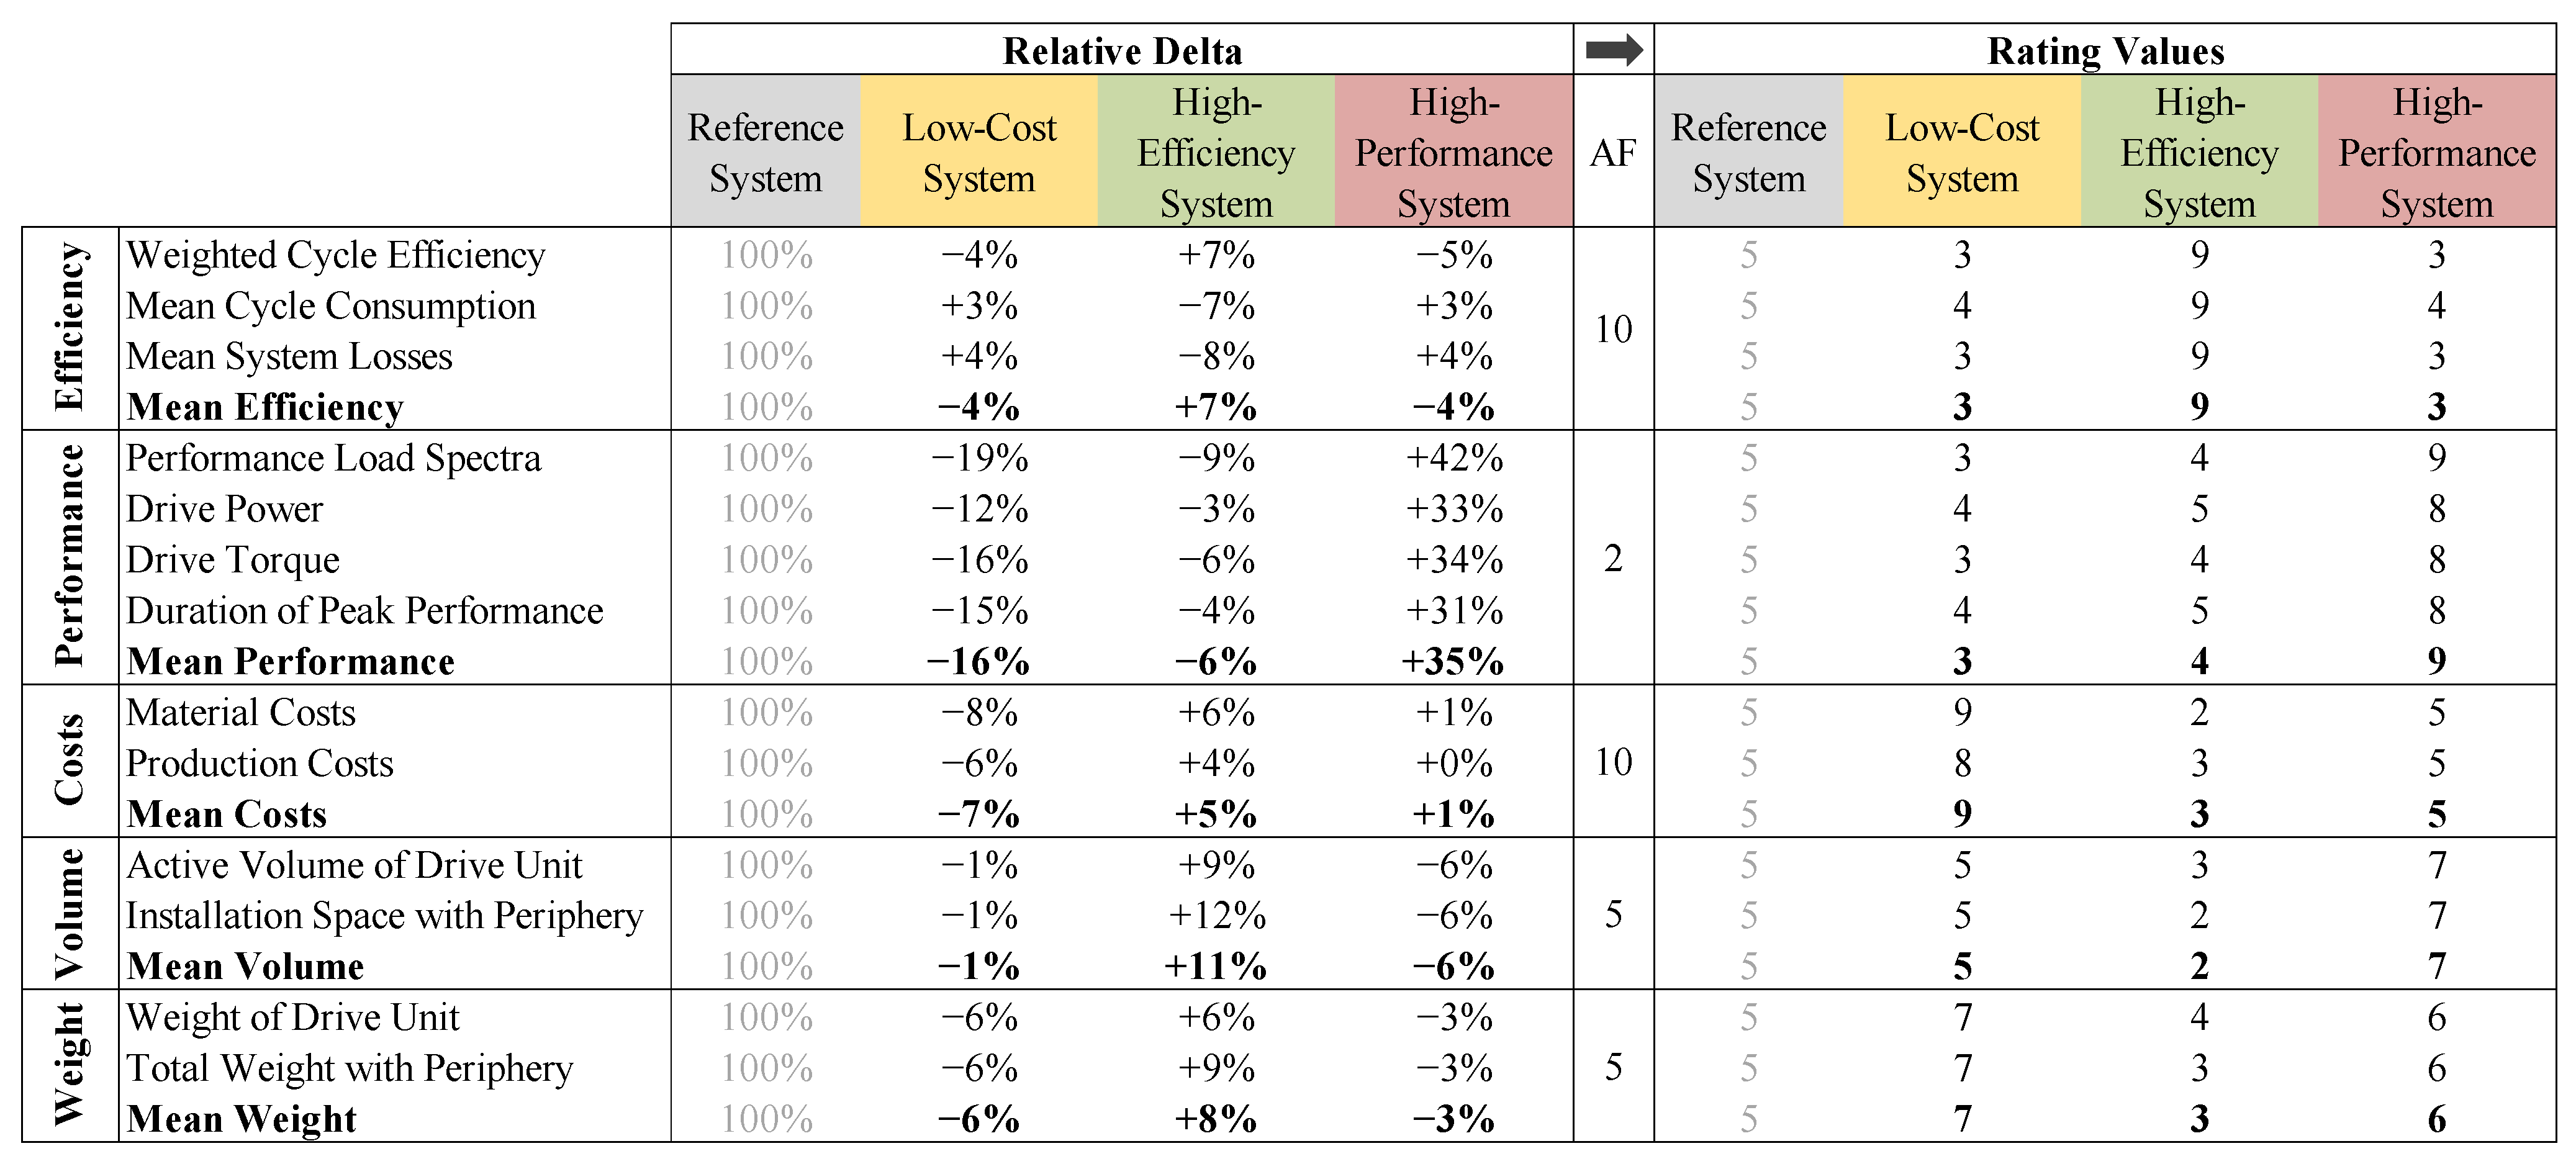
17]. Amidst these dependencies, the reference drive system is very well balanced, which is reflected by a rating value of 5 for all criteria, according to
Figure 5.
This table shows the evaluation criteria and their indicators, e.g., the expenses for material and production as cost criteria. The chart also shows all relative deltas to the reference drive system on the left-hand side, from which the rating values on the right-hand side were derived.
For this derivation, empirically determined amplification factors (AFs) are used to adjust the relative deltas to the rating value scale (0 to 10). These multipliers are necessary because relative deltas of different rating criteria are not necessarily comparable. For example, while an efficiency delta of 2% is relatively high, a performance delta of only 2% is rather negligible. For this reason, the AF for efficiency (10) is five times greater than that for performance (2). Ultimately, these amplification factors enable a comparative assessment of the criteria.
It should also be noted that the sign of the relative deltas could have an opposite effect on the rating value. For example, while the weighted cycle efficiency has a positive delta, the mean cycle consumption is higher and is, therefore, represented by a negative delta.
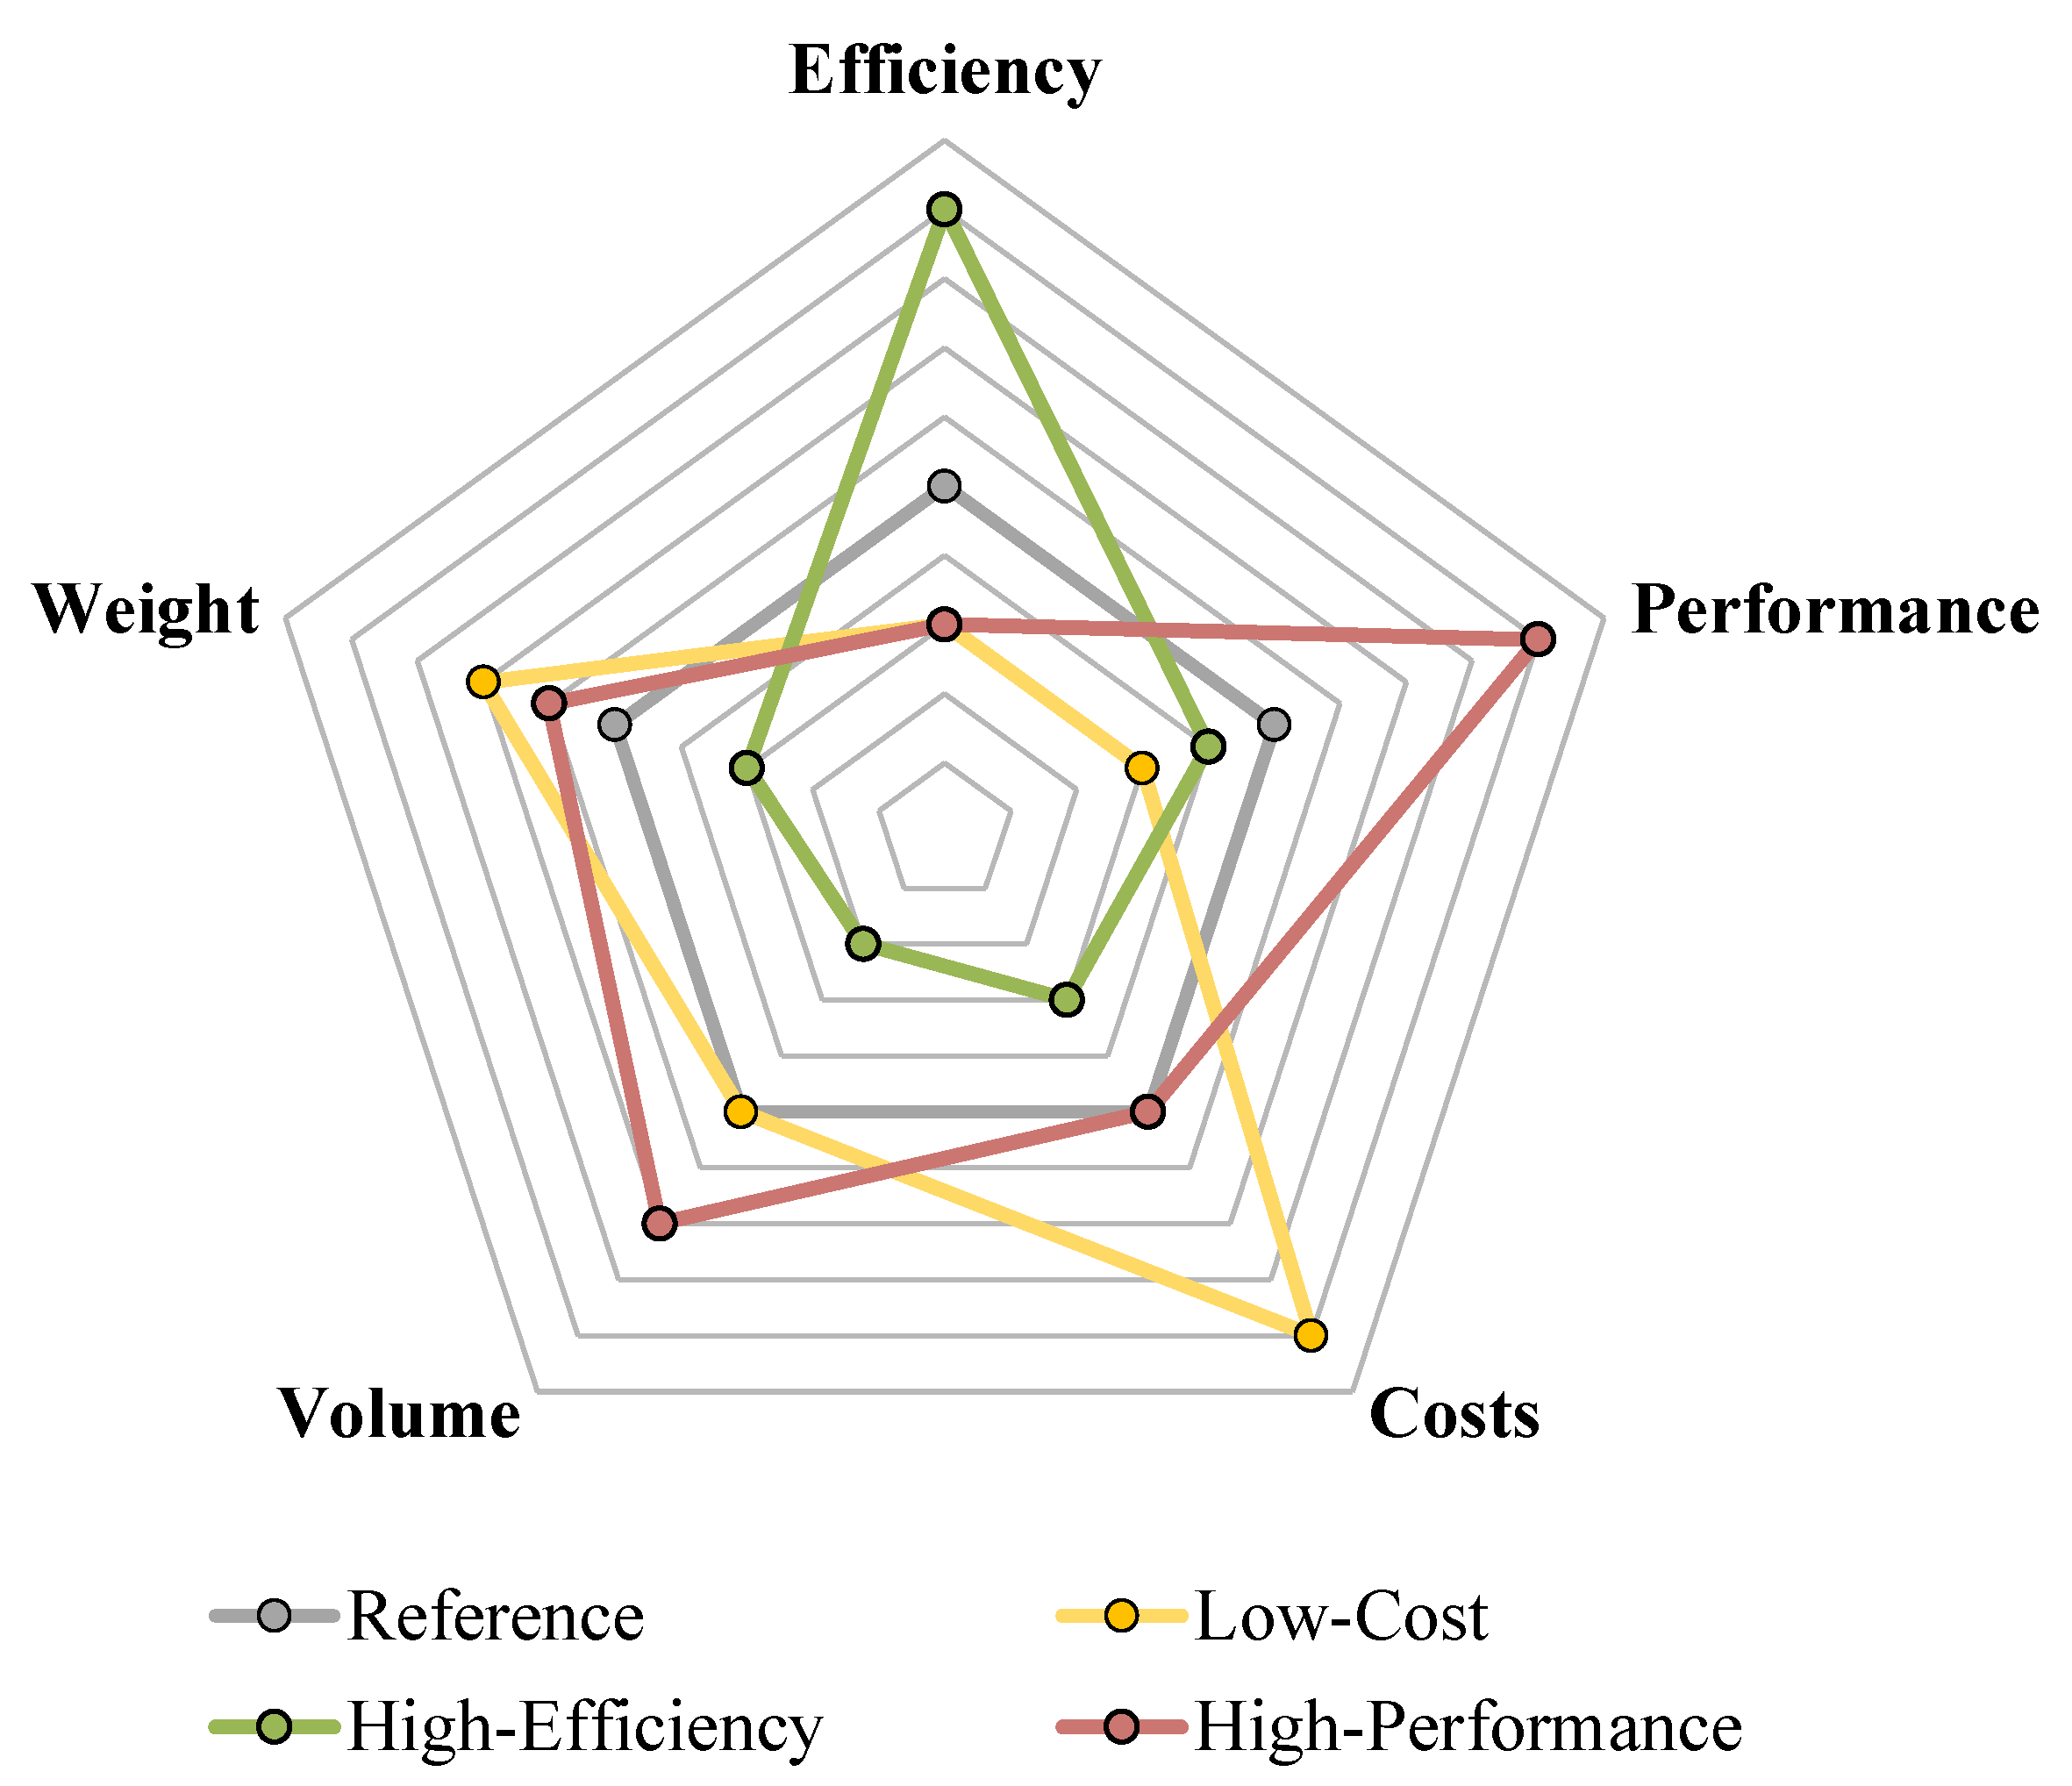
The resulting rating values are visualized in
Figure 6, where all drive systems are compared with each other based on their already-known rating values.
This radar chart shows the comparison between all four drive systems and, thus, highlights the different emphases of the three sample drive systems. Each one has a specific purpose, which was consistently pursued during development. As the name suggests, the low-cost system is primarily aimed at low system costs, with both efficiency and performance dropping significantly compared to the reference drive system. This is represented by an value of 9, while both and are equal to 3. On the other hand, the active volumes of both drive systems are comparable, so is 5 as well, and, notably, the weight is even slightly better than the reference drive system, with an of 7, making the low-cost system only slightly inferior overall.
In contrast, the high-efficiency system achieves significantly higher overall efficiency with an
of 9, but falls short of the reference drive system in all other disciplines. Since high efficiency tends to correlate with high volume, costs, and weight, these criteria are usually inversely related, which is why the ratings are so low with an
at 2 and
and
at 3 each. This is due to the strong anti-proportional dependence of the size and cost on efficiency [
18]. Ultimately, the
is set to 4 but there is no clear correlation between performance and efficiency.
Finally, the high-performance system is basically the opposite of the high-efficiency system. In particular, in the case of high performance with an
of 9, efficiency drops significantly to an
of 3, which is why high efficiency and high performance together are two opposing targets [
19]. Compared to the high-efficiency system, the focus here is on increasing performance at the expense of a reduction in efficiency. This shift in focus makes the costs with an
of 5 comparable to those of the reference drive system. Due to the compact design of this high-performance module, gains in volume and weight can be achieved, resulting in an
of 7 and
of 6.
As the method of this holistic assessment is intended to apply to conventional, electrical, and hybrid drive systems, these three drive systems serve as demonstration examples. Therefore, no further details (such as technical specifications) are provided.
5.2. Holistic Assessment
In the context of a holistic system evaluation, individual objectives play a decisive role. Therefore, the following assessment consists of two case studies (CSs) with different focal points. While the first exemplary case study focuses on efficiency as the main target, the second exemplary case study is aimed at costs.
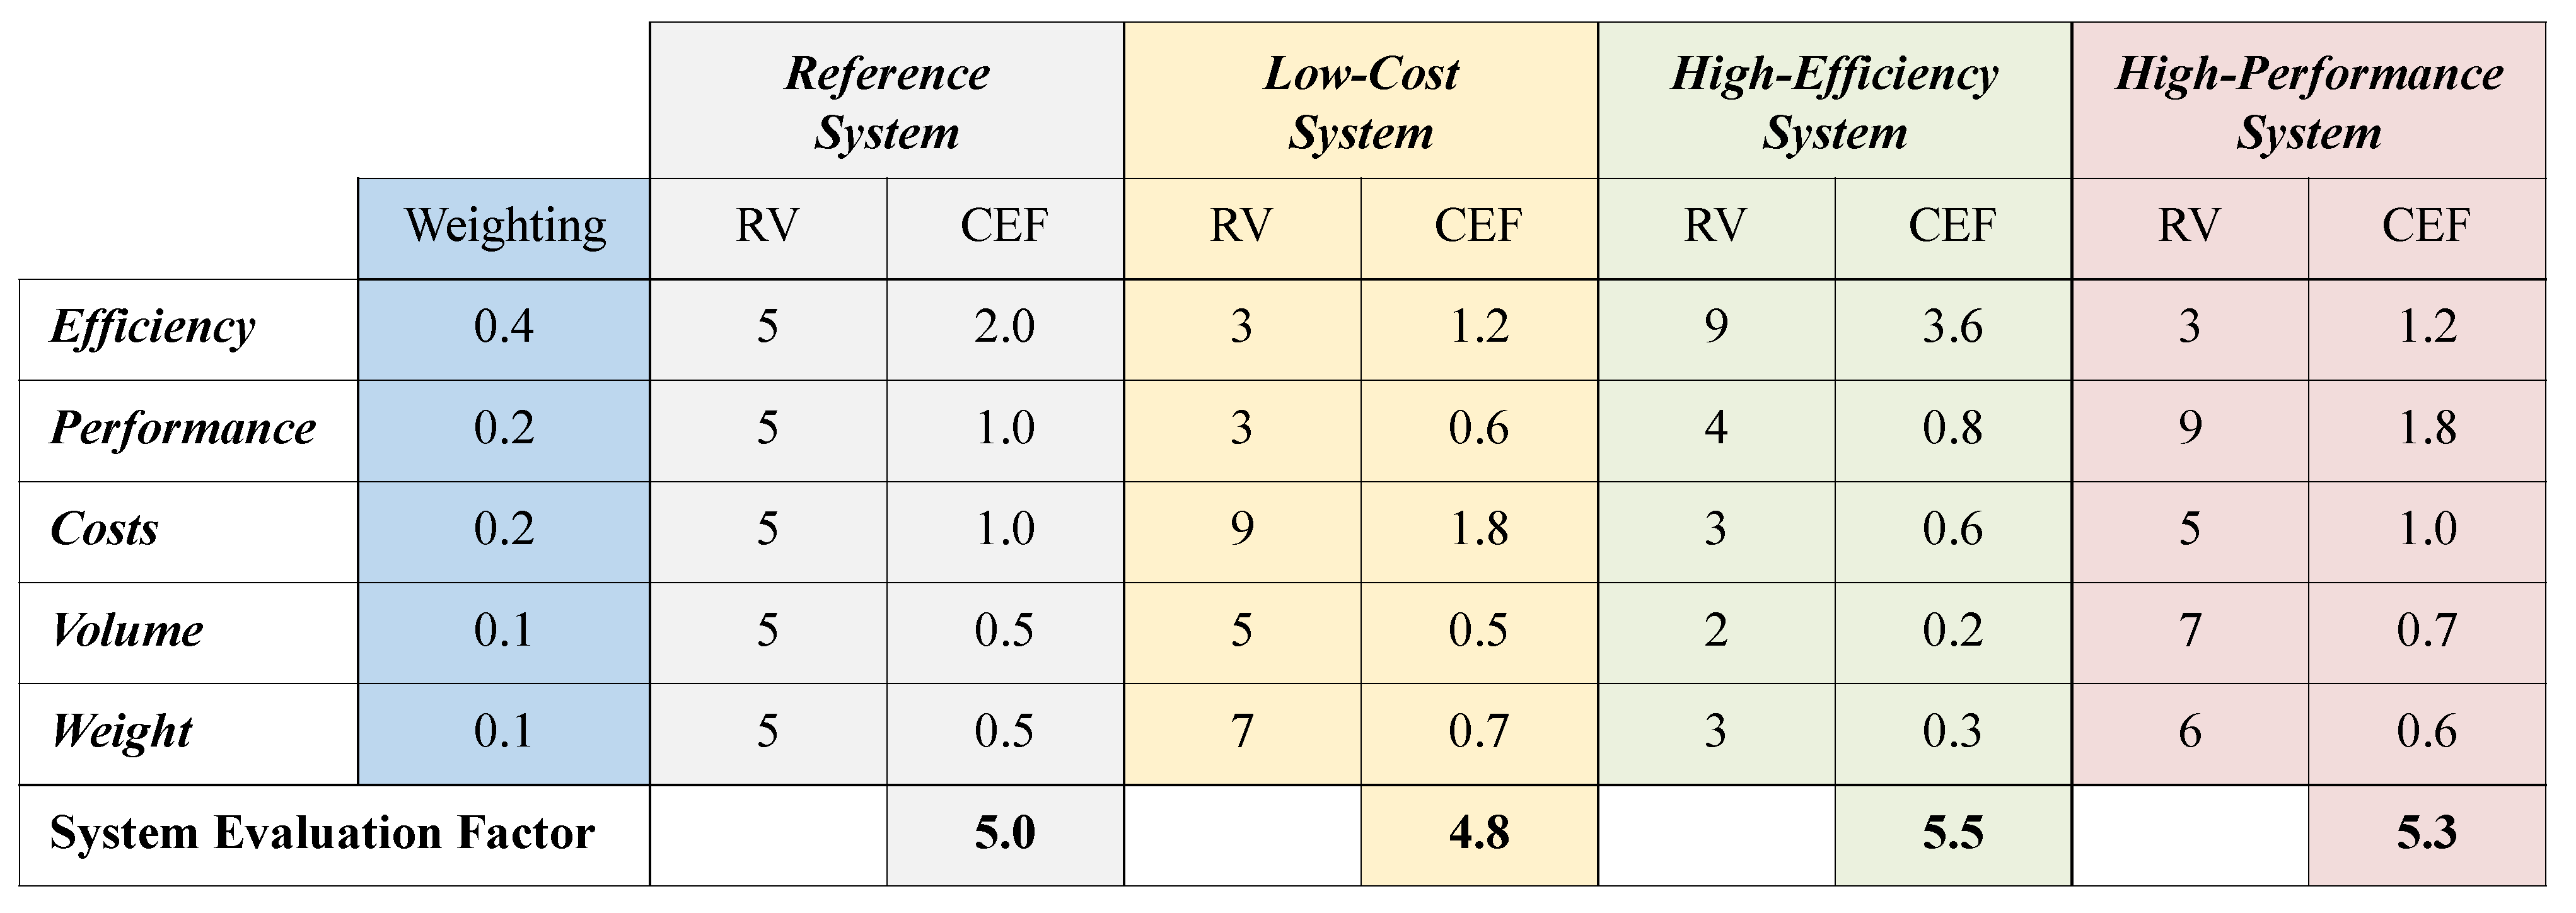
5.2.1. Case Study 1—Focus on Efficiency
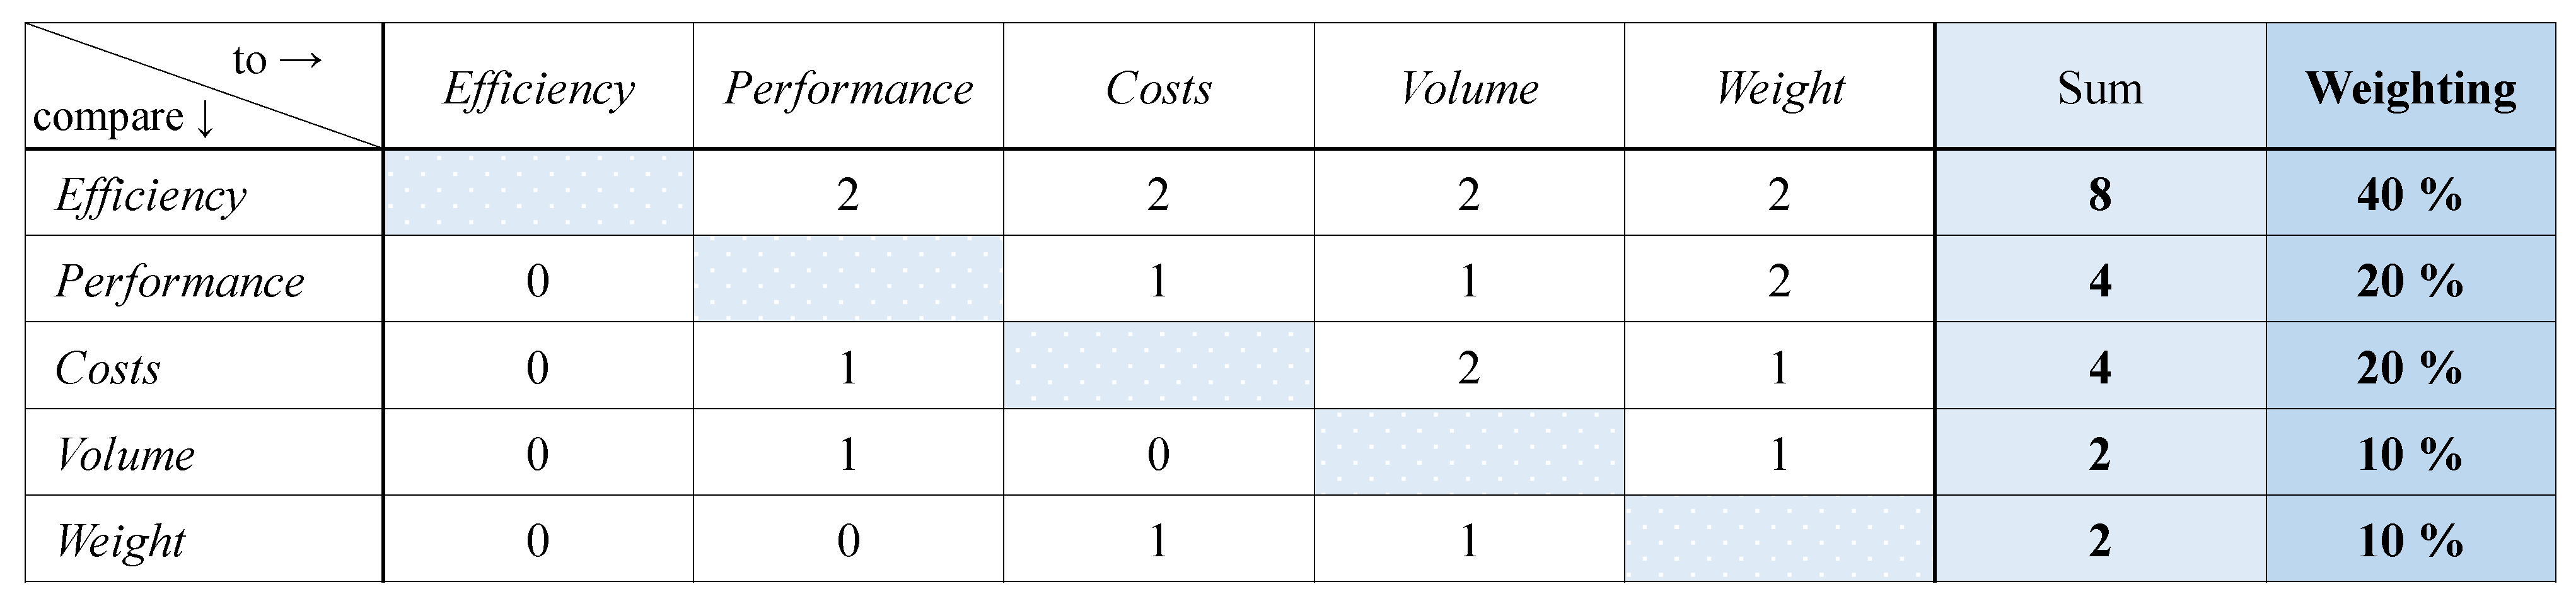
Based on the methodology of the PWC shown above,
Figure 7 illustrates the weightings for CS1. As focused, efficiency is the main objective, which is represented by a weighting factor of 40%. Regardless of the targeted design of individual drives, efficiency is set as the main focus for all, followed by cost and performance. As [
20] shows, efficiency is directly related to all evaluation criteria. As already mentioned, an increase in efficiency correlates with increasing costs and influences performance, which is why any gain in efficiency must always be evaluated, taking into account its cost and performance impact. For this reason, each of the two indicators is weighted relatively high at 20%. Both volume and weight are influenced by the efficiency of the drive, but with a lower priority, and, therefore, are weighted at 10%, respectively. These weighting factors ultimately express the clear gradation and prioritization of the criteria.
These derived weighting factors are now applied to the system evaluation in
Figure 8 using the weighted sum model. While the weighting of the rating values in the case of the reference drive system leads to an overall
value of
, the system evaluation of the sample drive system results in
values.
As the table shows, the main focus on efficiency makes it clear that the high-efficiency system with a value of is to be preferred. At , the high-performance system also produces a higher value than the reference drive system. Only the low-cost system is worse, with an value of .
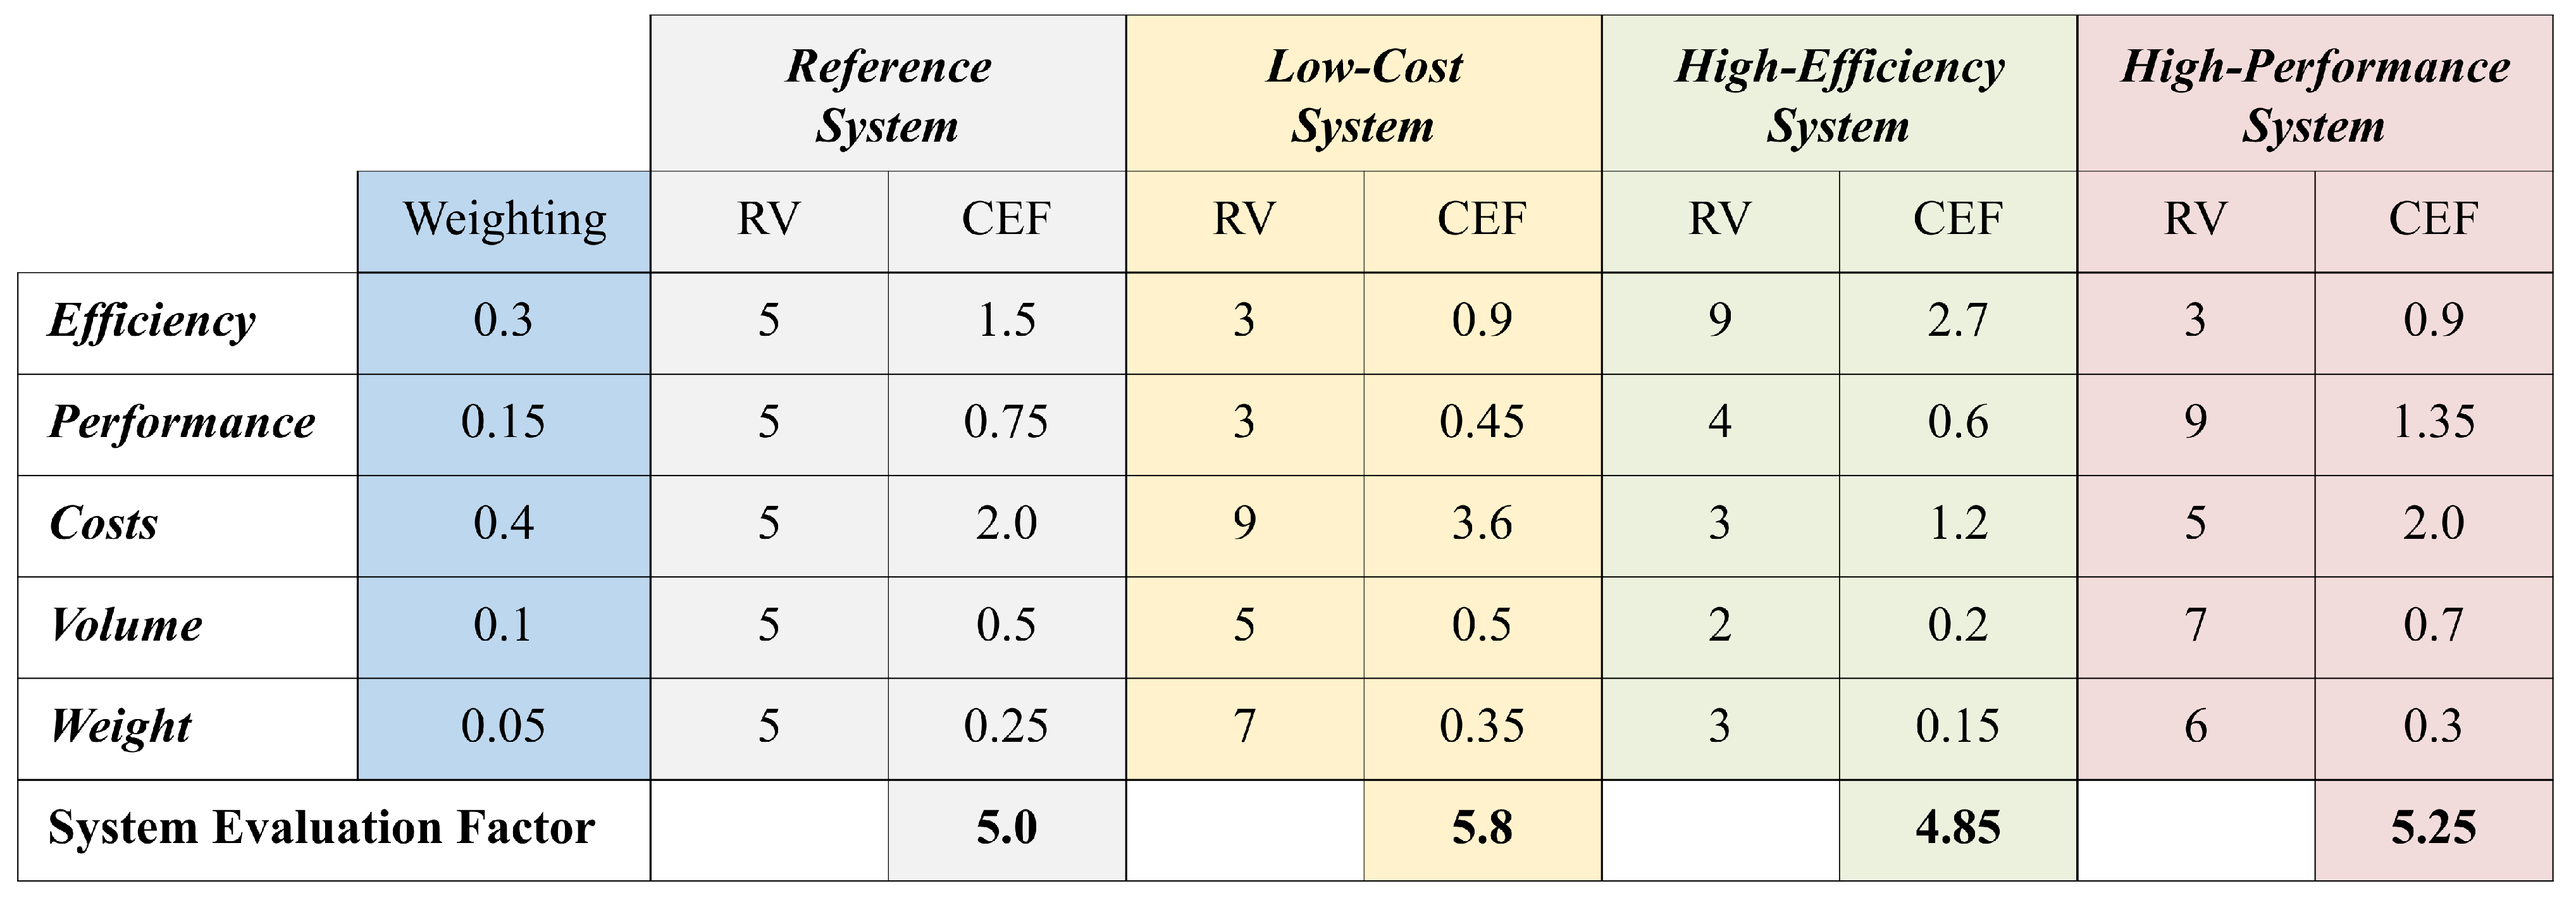
5.2.2. Case Study 2—Focus on Costs
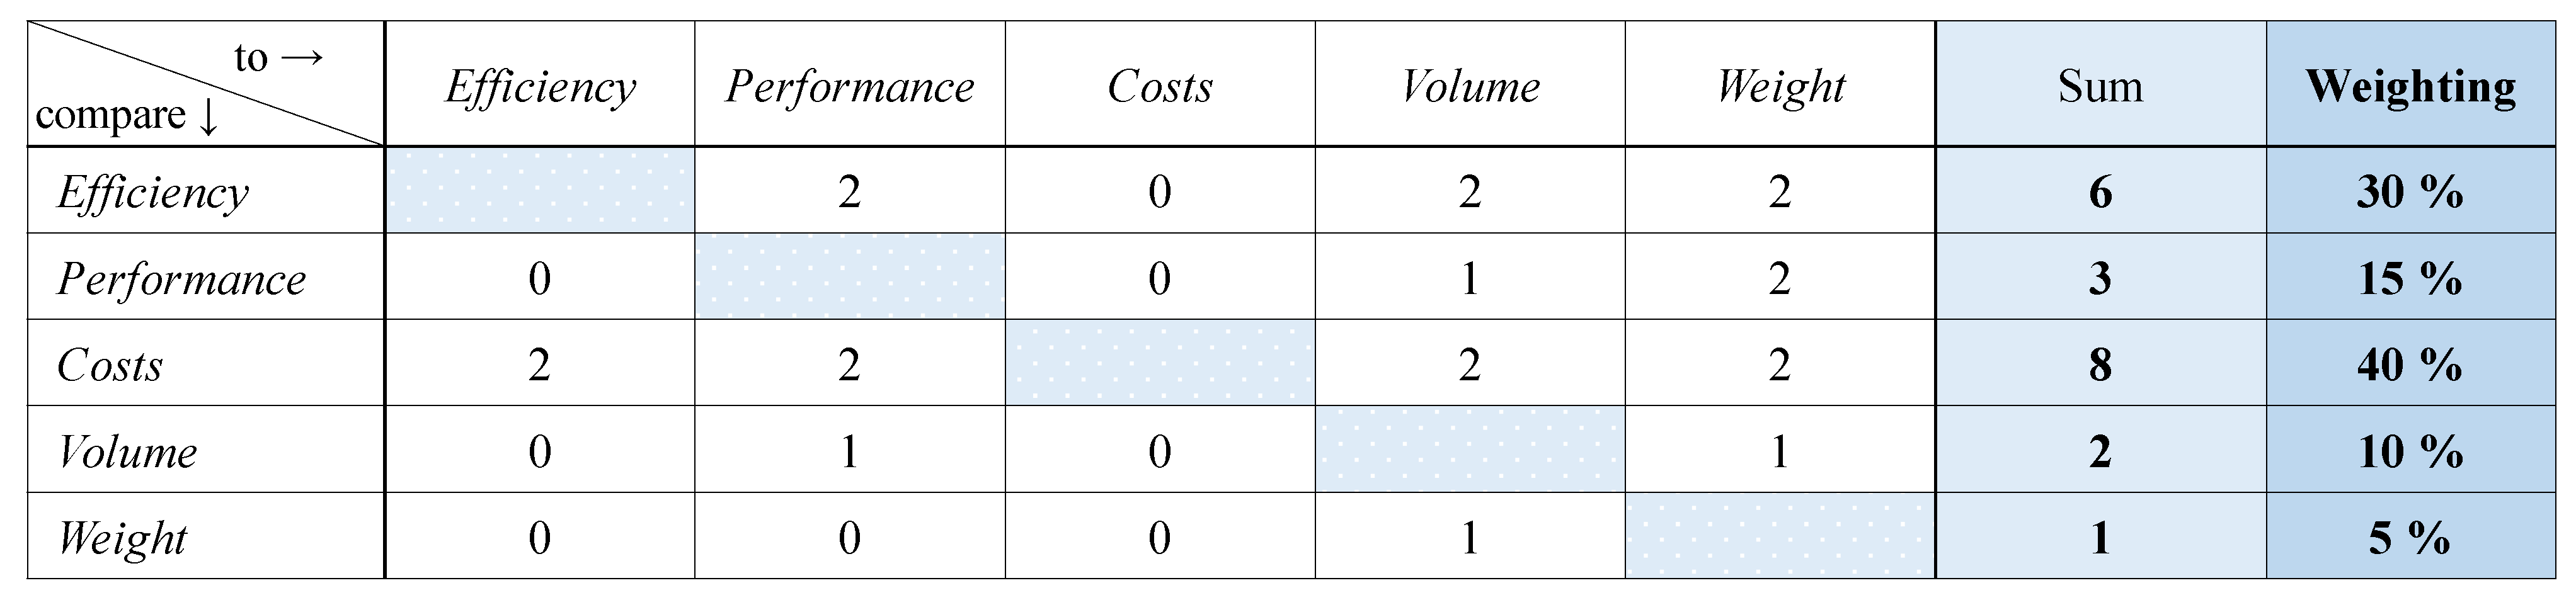
The procedure for CS2 is basically analogous to the approach for CS1. In line with the focus on costs, the weighting has been selected accordingly. As costs are now weighted with a value of 40%, efficiency is weighted with 30% as the second most important criterion. The remaining criteria are determined according to the weighting factors shown in
Figure 9.
In contrast to CS1, this second case study clearly demonstrates the difference caused by an alternative weighting of the criteria. While the
value of the reference drive system remains unchanged at
, the
values of the sample drive systems differ from the previous ones, as shown in
Figure 10.
By prioritizing costs, the value of the low-cost system is unsurprisingly the highest at . The value of the high-efficiency system, on the other hand, drops significantly to just . Interestingly, the high-performance system remains more or less the same at .
6. Discussion
To determine whether a benefit, such as an increase in efficiency, outweighs its cost, a cost–benefit analysis (CBA) is a common method for making decisions. Additional benefits often correlate with an increase in costs, so the purpose of this evaluation method is to quantify and weigh the benefits against the costs using a cost–benefit ratio. The goal is to assess the economic efficiency and determine whether it is worth the investment [
21].
Benefits and costs also correlate in the case of drive systems, as an increase in energy efficiency is accompanied by an increase in system costs. Using the example of CS1, according to which efficiency is weighted most heavily (see
Figure 8), the sample systems are evaluated with a cost-efficiency analysis. The diagram in
Figure 11 shows the rating scales of efficiency over cost and marks the drive systems mentioned.
Since the efficiency weighting
of 40% is twice as high as the cost weighting
of 20%, the ratio between these weightings is 2:1. In terms of cost and efficiency, this ratio allows systems to be considered equivalent, where, for example, a cost advantage and an associated efficiency disadvantage balance each other out. Based on this ratio, the system cost rating value,
, must be two points better to compensate for one point lower efficiency. This dependency is expressed by the equation in Formula (
4) and is represented by the dashed straight line in
Figure 11.
As shown, the low-cost system lies on the dashed line, which means that the cost-efficiency ratio is equal to that of the reference drive system. The lower efficiency is compensated by lower system costs, so the ratio remains the same. The high-efficiency system, on the other hand, exceeds this ratio and performs better than the reference. This can be interpreted to mean that the higher system costs are justifiable relative to the efficiency gain. In addition, the increase in efficiency for this system may allow for a reduction in battery size or capacity, which in turn reduces the cost and weight. In contrast, the high-performance system has a worse ratio due to the lower efficiency at the same costs. The focus on performance brings unfavorable conditions with regard to the cost-efficiency ratio.
7. Conclusions and Extension
The methods presented in this work serve as a framework for the evaluation of drive systems regarding various criteria. Thereby, the selection and weighting of these criteria are adjustable and can be adapted depending on the priorities in the development. The functionality of the methods is explained using the example of the three sample systems presented. Despite completely different emphases, these systems are brought to a comparable basis and compared under the same aspects. The exemplarily chosen weightings remain constant. As a result, the respective focal points of the three drive systems are reflected in the system evaluation factors, demonstrating and validating the applicability of the methodology.
The rating values are currently determined by the user and are, therefore, liable to subjective assessment. Through enhancements to the method, the determination of rating values will be automated by using concrete examination results as a basis. For example, a simulation-based objectification of the system efficiency and performance is carried out, as well as a breakdown of the costs, weight, and volume of the drive components.
A system evaluation based on a tabular utility analysis requires a certain level of complexity and a good imagination. Alternatively, a system evaluation based on the surface area of the individual pentagonal mesh shapes could serve as a better illustration. The larger the surface area, the better the overall system. However, this would not take into account the different weighting factors. For example, the area of the high-performance system is greater than that of the high-efficiency system despite a poorer value. This challenge could be countered by a three-dimensional (3D) radar chart, where the height of each corner corresponds to the weighting factor of the criterion. In this case, the mesh would be in 3D space, with the individual pentagons placed on this plane. The area as an indicator would then become the volume.
Author Contributions
Conceptualization, methodology, software, validation, formal analysis, investigation, resources, data curation, writing—original draft preparation, writing—review and editing, visualization, project administration, funding acquisition, R.M.; supervision, F.G. All authors have read and agreed to the published version of the manuscript.
Funding
This research is funded by the Publication Fund of the Karlsruhe Institute of Technology; funding number 02034100761.
Institutional Review Board Statement
Not applicable.
Informed Consent Statement
Not applicable.
Data Availability Statement
No publicly archived datasets were analyzed.
Conflicts of Interest
Author Raphael Mieth was employed by the company Mercedes-Benz AG. The remaining authors declare that the research was conducted in the absence of any commercial or financial relationships that could be construed as a potential conflict of interestThe authors declare no conflicts of interest.
Abbreviations
The following abbreviations are used in this manuscript:
| AF | amplification factor |
| C | criterion |
| CS | case study |
| Cst | cost |
| CBA | cost–benefit analysis |
| CEF | criterion evaluation factor |
| Eff | efficiency |
| MCDM | multi-criteria decision-making |
| NVH | noise vibration harshness |
| Per | performance |
| PWC | pairwise comparison |
| RV | rating value |
| SEF | system evaluation factor |
| Sys | system |
| Vol | volume |
| Wgt | weight |
| WSM | weighted sum model |
References
- Buhmann, K.M.; Criado, J.R. Consumers’ preferences for electric vehicles: The role of status and reputation. Transp. Res. Part D Transp. Environ. 2023, 114, 103530. [Google Scholar] [CrossRef]
- Chakraborty, P.; Parker, R.; Hoque, T.; Cruz, J.; Du, L.; Wang, S.; Bhunia, S. Addressing the range anxiety of battery electric vehicles with charging en route. Sci. Rep. 2022, 12, 5588. [Google Scholar] [CrossRef] [PubMed]
- Shrestha, S.; Shah, B.B.M.; Chitrakar, S.; Shrestha, B.P. Measures to resolve range anxiety in electric vehicle users. Int. J. Low-Carbon Technol. 2022, 17, 1186–1206. [Google Scholar] [CrossRef]
- Grunditz, E.A.; Thiringer, T. Electric Vehicle Acceleration Performance and Motor Drive Cycle Energy Efficiency Trade-Off. In Proceedings of the 2018 XIII International Conference on Electrical Machines (ICEM), Alexandroupoli, Greece, 3–6 September 2018; pp. 717–723. [Google Scholar] [CrossRef]
- Sanguesa, J.; Torres-Sanz, V.; Garrido, P.; Martinez, F.J.; Marquez-Barja, J.M. A Review on Electric Vehicles: Technologies and Challenges. Smart Cities 2021, 4, 372–404. [Google Scholar] [CrossRef]
- Weiß, F. Methodik zur Optimalen Konzeptauslegung Elektrifizierter Fahrzeugantriebsstränge. Ph.D. Thesis, Technische Universität Chemnitz, Chemnitz, Germany, 2017. [Google Scholar] [CrossRef]
- Li, C.; Wu, R.; Yang, W. Optimization and selection of the multi-objective conceptual design scheme for considering product assembly, manufacturing and cost. SN Appl. Sci. 2022, 4, 91. [Google Scholar] [CrossRef]
- Yue, Z. An extended TOPSIS for determining weights of decision makers with interval numbers. Knowl.-Based Syst. 2011, 24, 146–153. [Google Scholar] [CrossRef]
- Ma, J.; Kremer, G.E.O. A systematic literature review of modular product design (MPD) from the perspective of sustainability. Int. J. Adv. Manuf. Technol. 2016, 86, 1509–1539. [Google Scholar] [CrossRef]
- Krejčí, J. Pairwise Comparison Matrices and Their Fuzzy Extension—Multi-Criteria Decision Making with a New Fuzzy Approach; Springer Nature: Berlin/Heidelberg, Germany, 2018; Volume 366. [Google Scholar] [CrossRef]
- Baumann, M.; Weil, M.; Peters, J.F.; Chibeles-Martins, N.; Moniz, A.B. A review of multi-criteria decision making approaches for evaluating energy storage systems for grid applications. Renew. Sustain. Energy Rev. 2019, 107, 516–534. [Google Scholar] [CrossRef]
- Taherdoost, H.; Madanchian, M. Multi-Criteria Decision Making (MCDM) Methods and Concepts. Encyclopedia 2023, 3, 77–87. [Google Scholar] [CrossRef]
- Kühnapfel, J.B. Nutzwertanalysen in Marketing und Vertrieb; Springer Gabler: Wiesbaden, Germany, 2019; Volume 2. [Google Scholar] [CrossRef]
- Ramík, J. Pairwise Comparisons Method—Theory and Applications in Decision Making; Springer Nature: Berlin/Heidelberg, Germany, 2020; Volume 690. [Google Scholar] [CrossRef]
- Bozóki, S.; Dezsó, L.; Poesz, A.; Temesi, J. Analysis of pairwise comparison matrices: An empirical research. Ann. Oper. Res. 2013, 211, 511–528. [Google Scholar] [CrossRef]
- Dean, M. A Practical Guide to Multi-Criteria Analysis; Technical Report; University College London: London, UK, 2022. [Google Scholar] [CrossRef]
- Kalt, S. Automatisierte Auslegung Elektrischer Antriebsmaschinen zur Anwendungsspezifischen Optimierung. Ph.D. Thesis, Technische Universität München, Munich, Germany, 2021. [Google Scholar]
- Hadraoui, H.E.; Zegrari, M.; Chebak, A.; Laayati, O.; Guennouni, N. A Multi-Criteria Analysis and Trends of Electric Motors for Electric Vehicles. World Electr. Veh. 2022, 13, 65. [Google Scholar] [CrossRef]
- Wang, A. Economic efficiency of high-performance electric vehicle operation based on neural network algorithm. Comput. Eltrical Eng. 2023, 112, 109026. [Google Scholar] [CrossRef]
- Weiss, M.; Cloos, K.C.; Helmers, E. Energy efciency trade-ofs in small to large electric vehicles. Environ. Sci. Eur. 2020, 32, 46. [Google Scholar] [CrossRef]
- Koopmans, C.; Mouter, N. Cost-Benefit Analysis. In New Methods, Reflections and Application Domains in Transport Appraisal; Elsevier Inc.: Amsterdam, The Netherlands, 2021; Volume 7, Chapter 1; pp. 173–183. [Google Scholar] [CrossRef]
| Disclaimer/Publisher’s Note: The statements, opinions and data contained in all publications are solely those of the individual author(s) and contributor(s) and not of MDPI and/or the editor(s). MDPI and/or the editor(s) disclaim responsibility for any injury to people or property resulting from any ideas, methods, instructions or products referred to in the content. |
© 2024 by the authors. Licensee MDPI, Basel, Switzerland. This article is an open access article distributed under the terms and conditions of the Creative Commons Attribution (CC BY) license (https://creativecommons.org/licenses/by/4.0/).


