Article

Analysing the Effect of Chassis Torsional Flexibility on the Rollover Threshold of a Multi-Purpose Agricultural Vehicle

Department of Mechanical Engineering, Politecnico di Milano, 20156 Milan, Italy
*
Author to whom correspondence should be addressed.
Vehicles 2024, 6(1), 415-432; https://doi.org/10.3390/vehicles6010018
Submission received: 20 December 2023 / Revised: 8 February 2024 / Accepted: 16 February 2024 / Published: 21 February 2024

Abstract

:
Multi-purpose agricultural tractors are vehicles that are usually involved in different operations, including road maintenance in small villages and cultivation of small agricultural plots, particularly in mountainous areas. These vehicles typically feature narrow tracks to enhance manoeuvrability, making rollover stability a critical consideration in operational settings. This characteristic arises from the interplay between the suspension and vehicle chassis. This paper introduces a numerical multi-body model designed to replicate the dynamics of a multi-purpose tractor with a torsional chassis. Model parameters were derived through experimental measurements conducted on an actual vehicle. Static measurements were performed to assess tire and suspension stiffness while tilting tests were performed to establish the static rollover limit of the vehicle. Dynamic tests conducted on a four-post test rig characterised the vehicle’s dynamics. The validated model was utilised to explore the vehicle’s stability by reproducing the static rollover tests and simulating the vehicle’s performance under working conditions on a banked road. The vehicle rollover stability was studied by performing a sensitivity analysis that considered both chassis torsional stiffness and suspension stiffness under different loading conditions. The results indicate a trade-off between frame and suspension stiffnesses that enhances overall vehicle stability.

1. Introduction

Multi-functional agricultural tractors are versatile vehicles designed for a wide range of tasks. They are commonly used for activities such as tending vineyards and orchards or clearing snow from the streets of mountain villages. These tractors exhibit characteristics of both conventional road vehicles and typical agricultural farm tractors. Their typical working environments involve challenging terrains, including rugged paths and off-road situations with significant slopes. Therefore, it is crucial to prevent accidents or rollovers while they are in service. Ref. [1] associated areas with the highest number of accidents with steep terrain, an older tractor fleet, and horticultural crops and vineyards. Ref. [2] conducted a multivariate logistic regression analysis to explore the association between the identified exposure variables and the outcomes of interest. According to [3], there were 766 tractor-related fatalities from 2009 to 2014, with 594 rollover fatalities representing 77.5% of all tractor-related fatalities. From these studies, it is evident that tractor rollovers result from a combination of factors, including the vehicle, the operator, and the operating environment of agricultural vehicles. To reduce injuries caused by these accidents, many countries have mandated the use of rollover protective structures (ROPSs). In fact, since 1974, official rules in Europe have made ROPSs compulsory for the type-approval of wheeled agricultural and forestry tractors [4], and international standards have been legislated on this topic [5,6,7]. The attention and research activities related to this topic are already well-documented in the existing literature. Nevertheless, further investigation and comprehension of the rollover phenomenon associated with multi-purpose agricultural tractors are needed. The study of farm tractor rollovers was initiated by [8], who formulated and analysed a mathematical model simulating the stability of a four-wheel-drive, articulated frame logging tractor at static or low constant velocity. Ref. [9] investigated the ability of tractor drivers to evaluate slopes correctly and the mean slope angle at which the most and least conservative drivers indicate a beginning of concern of a rollover using a simulator. In another study, Ref. [10] examined research on tractor rollovers and ROPSs, analysing the energy theoretically available for rollovers using a simple model evaluated with narrow-track tractor data. They demonstrated that the energy available at the beginning of the rollover may not be a linear function of tractor mass, as assumed by the international testing procedure. Additionally, employing an energetic approach again, they argued that the inclusion of forward velocity increases the available energy. However, it was noted that the inclusion of velocity considerably complicated the analysis and is likely to couple roll into more than just the lateral plane. Ref. [11] presented a model developed in the Carsim/Matlab Simulink environment for predicting the probability of mountain tractors experiencing rollovers when operating on significant slope variations. A mathematical model representing the behaviour during a generic tractor lateral rollover, with the possibility of modifying the geometry, the inertia of the tractor, and the environmental boundary conditions, was proposed by researchers in [12]. The purpose was to define a method allowing for the prediction of the elastoplastic behaviour of the impacts occurring in the rollover phase. Ref. [13] presented typical tractor rollover tests and analysed tractor stability in terms of the stability index developed by the authors. Three radio-controlled tractors were used to complete the tests. The tractors’ dynamic state variables, such as roll and pitch angles, roll and pitch velocities, and ground speed, were recorded to assess a tractor stability index. Ref. [14] investigated two types of rollover mechanism initiation: the loss of the up-slope rear tire and contact with the front tire. The developed model employs a kinetic–static approach based on two rigid bodies. The front body models the front axle and wheels with negligible mass and inertia, while the rear body, with significant mass and inertia, models the rear wheels and the remaining parts of the vehicle. To reveal the rollover mechanism of vehicles with flexible frames and solid axle suspension on banked and graded uneven roads, the researchers in [15] proposed a novel rollover index derived from rollover dynamics and an integrated control strategy for vehicle rollover. Ref. [16] presented the results of a comprehensive study on technology for improving the roll stability of heavy-duty vehicles. A rollover threat warning system uses a real-time dynamic model-based time-to-rollover metric as a basis for online rollover detection, combined with an active roll control system that utilises an active suspension mechanism to enhance the roll stability of heavy-duty trucks during static cornering and emergency manoeuvres." Ref. [17] proposed three mathematical models to understand the basic features of the rollover mechanism. These models describe the static rollover limit, considering the orientation of the farm tractor with respect to the road slope. A narrow-track farm tractor equipped with a pivoting front axle is compared with the adoption of a passively suspended front axle. The results show that, in the case of a front axle suspension, the rollover limit of the vehicle can be improved, especially when employing non-symmetric implements. Ref. [18] analysed the stability of fruit-harvesting trucks with a particular focus on rollover risk. A multi-body model of two trucks was developed and validated with some experimental tests. The model was then used to determine the rollover angle along a generic direction, considering the effects of vehicle configuration and tire–soil stiffness. Ref. [19] analysed the lateral overturning and backward rollover characteristics of a tractor driven on a hard surface, depending on the ground slope angle and the shape and height of the obstacles. The results revealed that the factor contributing the most to the overturning and rollover of the tractor was the ground slope, followed by the obstacle height and then the obstacle shape. The parameters that most influence lateral overturning and backward rollover are the height of the centre of mass and the angular velocity in the rolling direction. The study proposed in [20] aimed to develop a specific test procedure to establish a procedure to asses the lateral stability of self-propelled fruit harvesters. The researchers observed and monitored this kind of vehicle under real operational conditions and revealed the variables most likely to affect lateral stability: the position and mass of the operators and the fruit bin on the platform. The study identified two specific settings reproducing real operational conditions most likely to affect the lateral stability of self-propelled fruit harvesters. Ref. [21] proposed a study to ascertain whether the Bullet physics engine can simulate the overturning behaviour of agricultural tractors with a rollover protective structure (ROPS) on a bank slope and on a uniform slope. Ref. [22] defined a rollover index to identify an impending rollover. This is computed from the estimation of roll angle, roll rate, and lateral acceleration measurements. The results illustrate that the rollover index can be used as a parameter to evaluate the danger of rollover. The key role of the tires in the lateral overturning of narrow-track tractors was deeply studied in [23].
The aim of this paper is to demonstrate the impact of a torsionally flexible chassis on enhancing the rollover stability of an agricultural vehicle. The vehicle, designated as a multi-purpose agricultural vehicle, is typically utilised in small Italian municipalities, particularly in mountainous areas, for road maintenance or snow clearing during winter months. These vehicles are also employed in agriculture for cultivating small plots of land or growing fruit trees. Unlike light-duty working vehicles, they are equipped with power take-offs to operate agricultural tools. This paper focuses on finding a trade-off between chassis stiffness and suspension stiffness with the aim of introducing active suspension control. This study aims to analyse this type of vehicle to determine the advantages of having a flexible frame compared to a central hinge, where the torsional stiffness provided by the frame is near zero, and the front axle is completely decoupled from the rear one. The initial section provides a concise overview of the vehicle, describing its key characteristics. Subsequently, the methodology employed for conducting experimental measurements on the vehicle is presented, serving as a basis for validating the developed vehicle model. A multi-body (MB) vehicle model is then formulated, featuring a detailed description that focuses on modelling the key components responsible for the vehicle’s rollover stability. These components include mass distributions, the centre of gravity (COG) position, tire and suspension stiffness, and torsional chassis stiffness. The parameters of the MB model are fine-tuned, and the model’s accuracy is validated against measurements obtained during the experimental campaign. Having established the validated model, a sensitivity analysis explores the influence of chassis stiffness on quasi-static rollover stability and critical working conditions. In the analysis, we consider parameters such as the ratio between the chassis torsional stiffness and the equivalent suspension stiffness, the vehicle loading conditions, and the inclination angle of the vehicle towards the road slope. The findings highlight the role of flexible chassis deformation in enhancing vehicle stability, offering insights into the optimal design of chassis torsional stiffness relative to suspension stiffness.

2. Materials and Methods

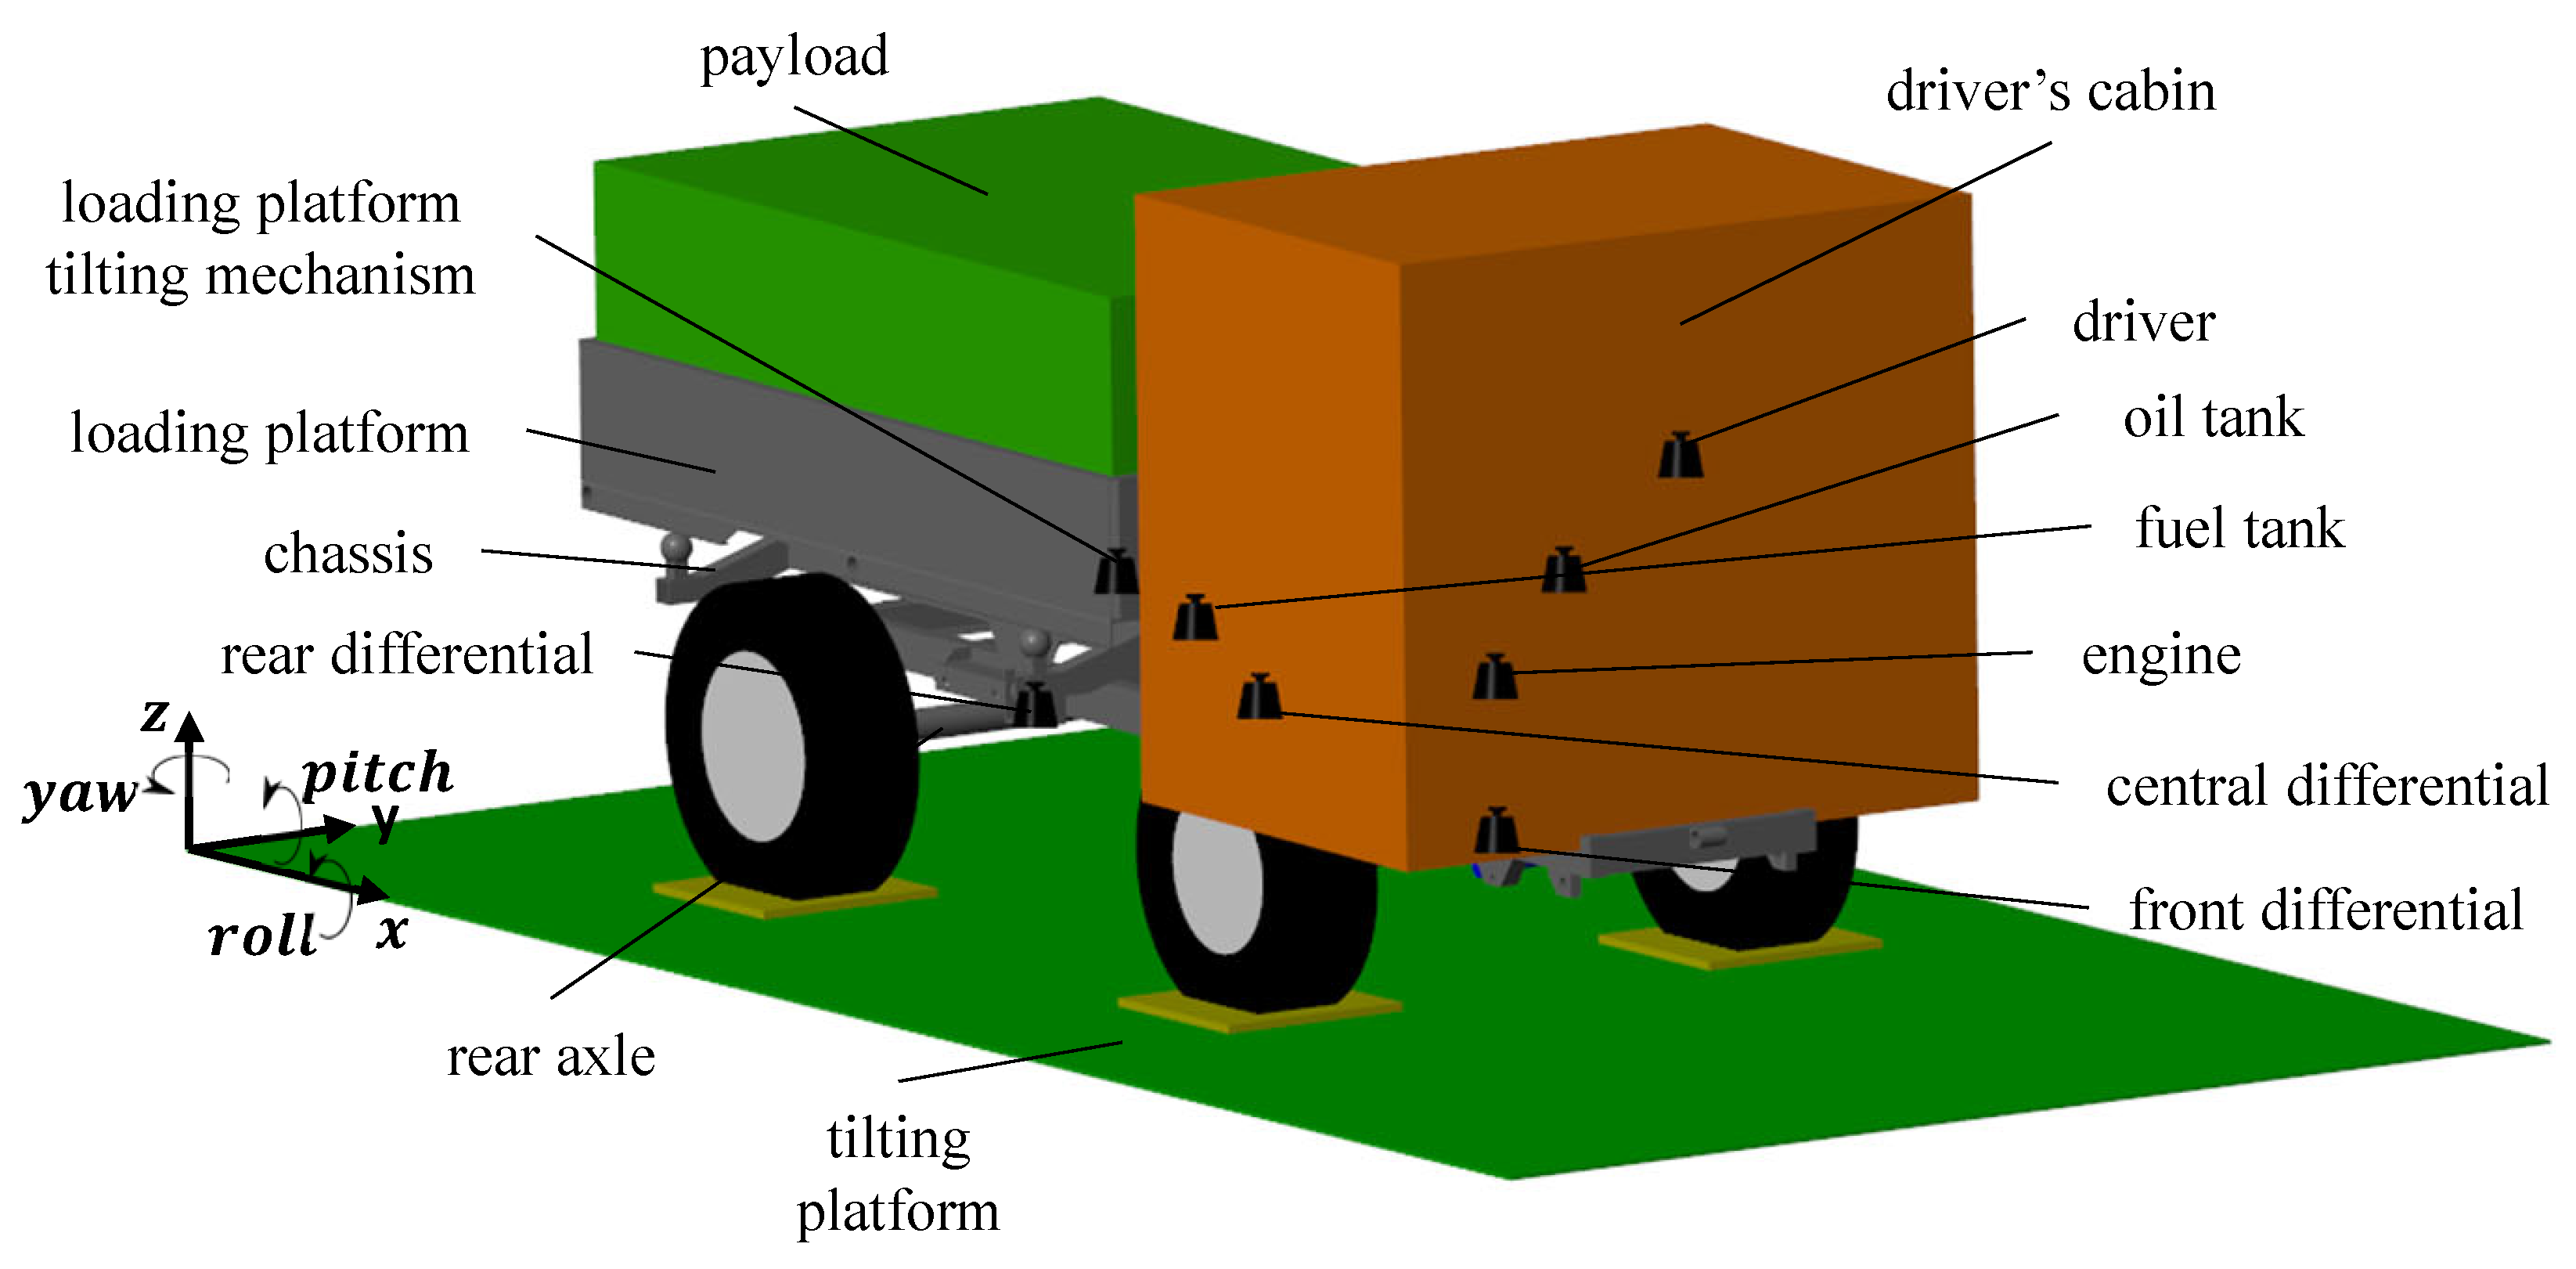
2.1. Reference Vehicle Description

The reference vehicle is a multi-purpose agricultural vehicle, as depicted in Figure 1.
This vehicle has characteristics that lie between traditional road vehicles and agricultural farm tractors (see Table 1).
The vehicle has dimensions overall comparable to those of a commercial vehicle, but the carrying capacity almost corresponds to the vehicle’s weight. The payload can be placed on a tilting loading platform connected to the chassis by four spherical joints arranged in a diamond pattern. This configuration allows for the transfer of the payload placed on the loading platform, leaving the chassis free to torque. The engine, oil, and fuel tanks are connected through rubber bushings on the front side of the chassis. The front side of the driver’s cabin is connected by a revolute joint, allowing it to be overturned to reach the engine located underneath. The rear is blocked by two bushings during normal vehicle operation. The chassis is suspended through the use of half-leaf spring suspensions connected in parallel with two hydraulic dampers.

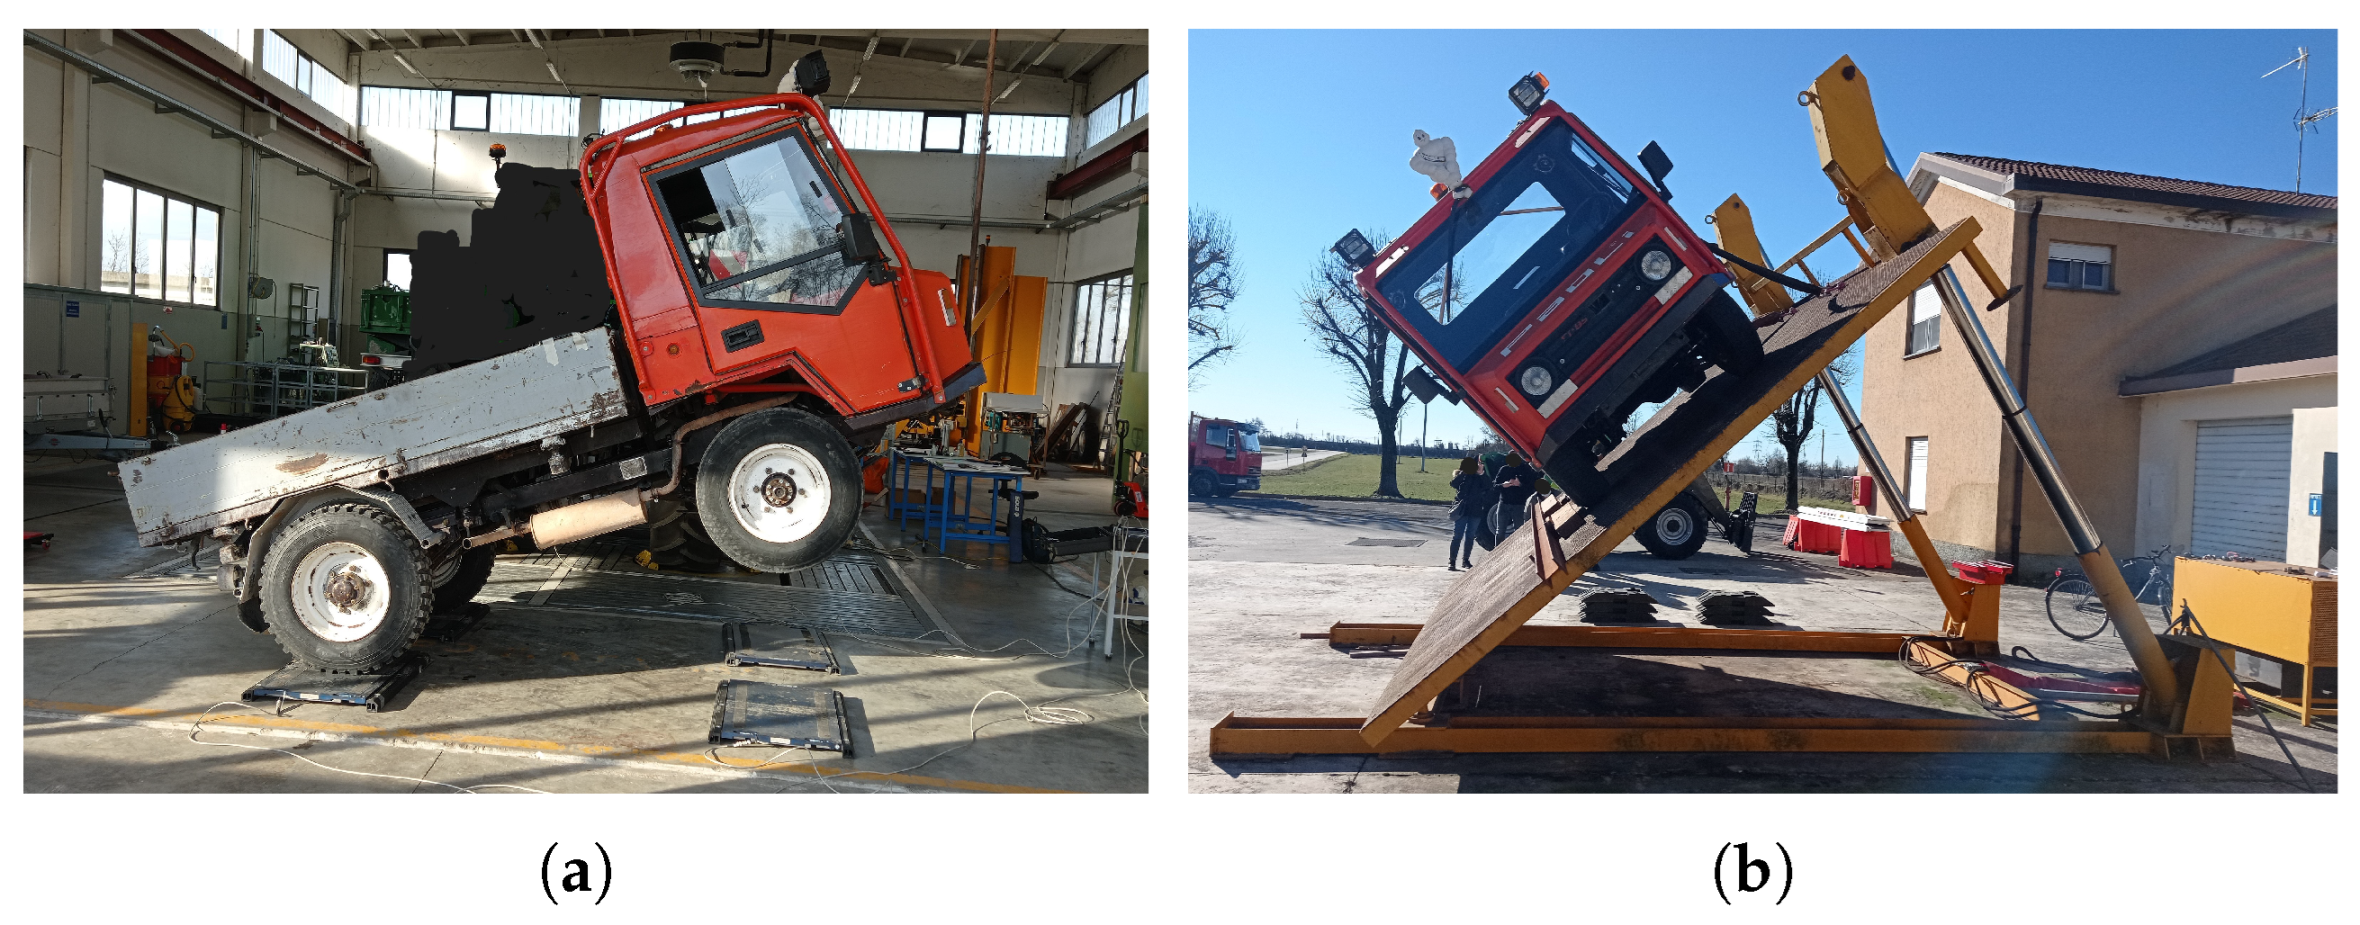
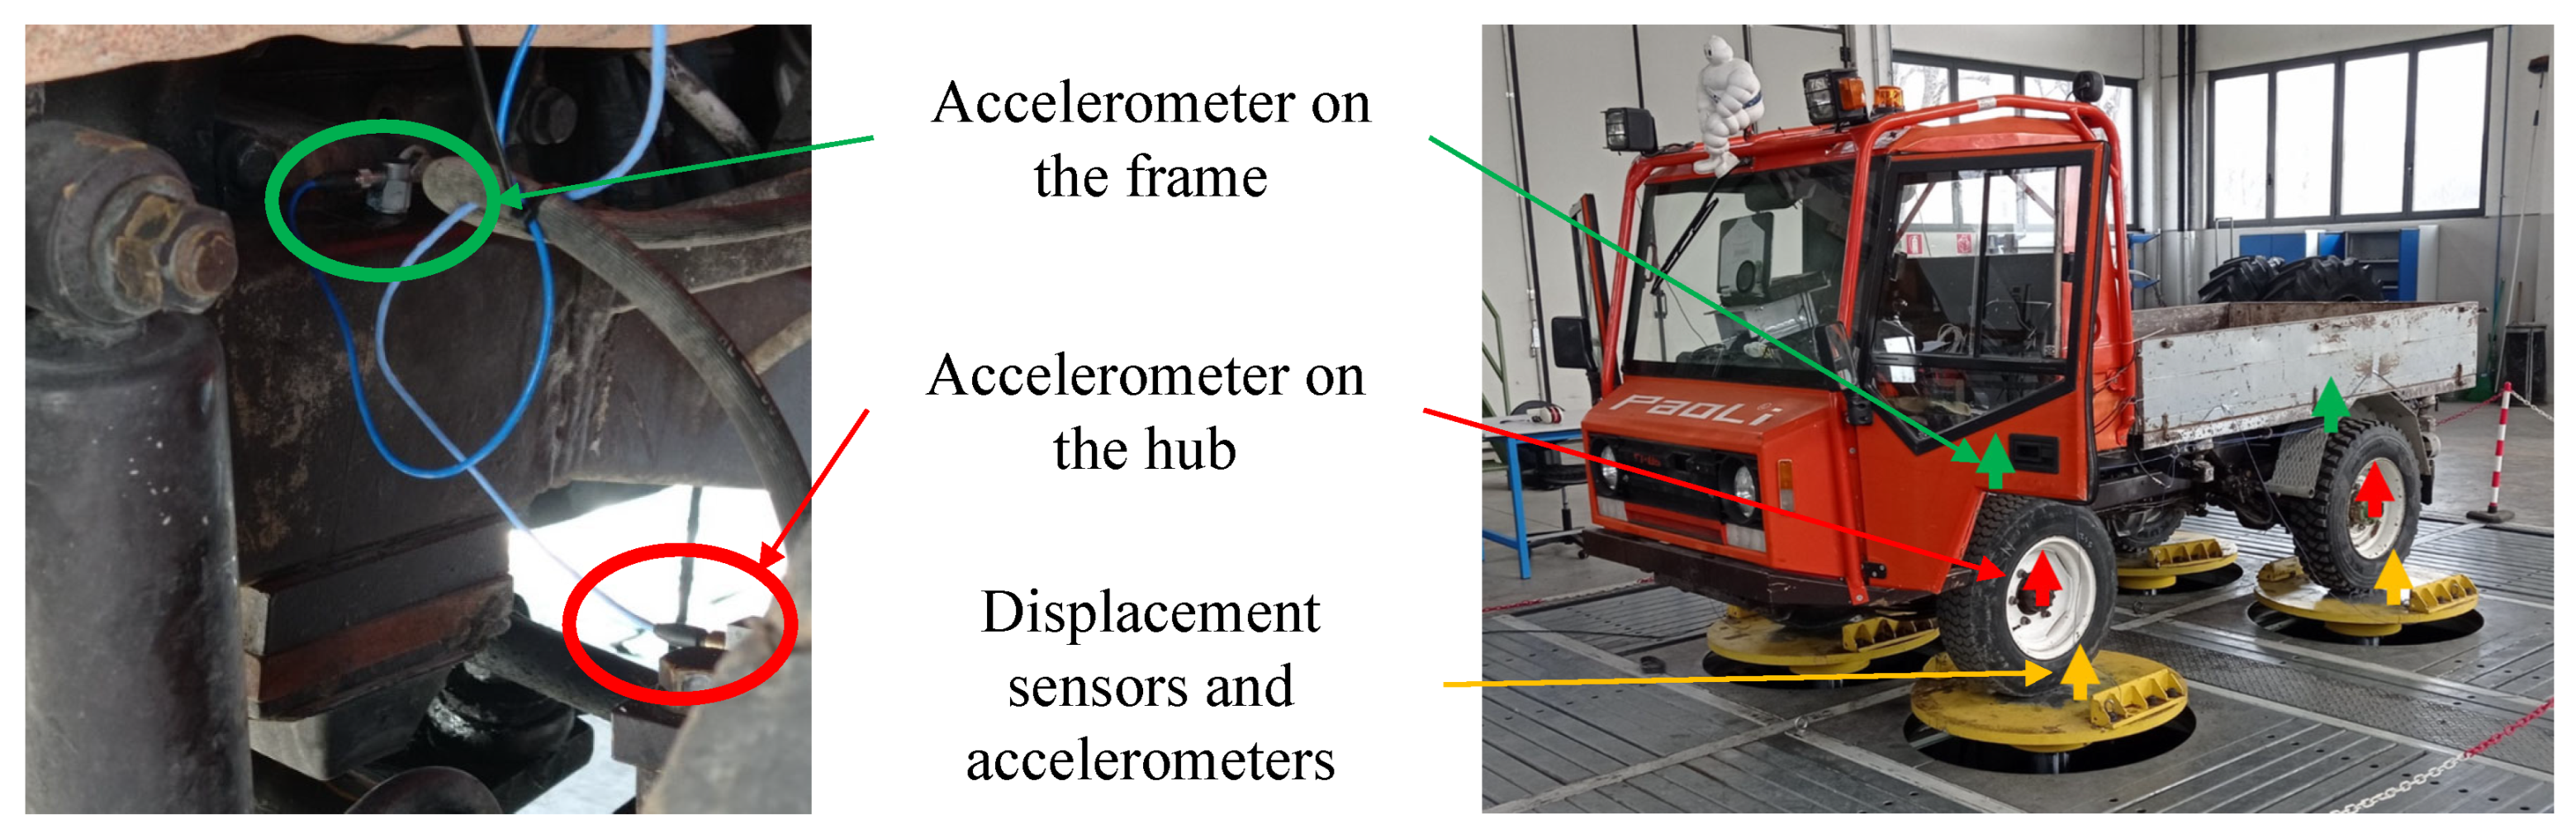
2.2. Experimental Measurements Methodology

Some experimental measurements were performed on the real vehicle to characterise its static and dynamic behaviour. All experimental measurements were conducted under the conditions of the pneumatic tire’s inflation pressure, as specified by the manufacturer, with the oil and fuel tanks at full capacity and a 75 kg payload positioned at the driver’s location in instances wherein the actual driver could not be present. (i) The standing vehicle’s vertical contact forces were measured by placing the vehicle on four loading cells with a sensitivity of ±5 kg and a capability of 12,000 kg each, measuring the load that acts on each single wheel. (ii) The position of the vehicle’s COG was obtained using the methodology specified by standard [24] (Figure 1a). (iii) The geometry of the suspension and steering system was directly measured on the vehicle, preserving the positions of the kinematic points. (iv) The static vertical stiffness of the vehicle suspensions and tires was calculated by measuring their vertical compression at different platform loading conditions. The hub–ground and hub–frame relative displacements were measured using four laser transducers with a sensitivity of 0.1 mm and a capability of 30 mm. The measurements were performed considering the suspension’s working range within bump–stop intervention limits. (v) Tilt tests were performed to define the tilt angle of the platform at which rollover occurs in accordance with the standards [25,26]. The vehicle was positioned on a tilting platform in the direction of the most critical side (i.e., lateral side), and the inclination angle of the platform at which rollover occurs was measured (Figure 1b). The platform tilting angle was increased slowly to reduce any dynamic effect on rollover as much as possible. During the test, downstream wheels were later blocked to limit lateral sliding. The height of blocking devices was less than 10% of the tire nominal radius, as prescribed by the standards. Finally, chains were used for safety reasons to prevent a full rollover after wheel detachment from the ground. (vi) The vehicle’s vertical dynamics was investigated through a full-scale experimental test conducted on a four-post test rig (Figure 2).
The vehicle was instrumented with eight one-axis piezoelectric accelerometers with a range of ±250 g and a sensitivity of 20.2 mV/g. Four were placed in correspondence with the four hubs to measure the vertical accelerations of the unsprung masses. An additional four sensors were placed on the frame, vertically aligned with the four on the hubs (see Figure 2), to measure the three rigid motions of the sprung masses (roll, pitch, and heave of the vehicle car body, and the torsion of the frame). Extra sensors were placed on the four posts: four one-axis accelerometers, identical to the ones used on the vehicle, measured the posts’ vertical accelerations, and four sensor displacements which ensured that the imposed displacement would be respected. The signals were acquired with a sampling frequency of 500 Hz. The vehicle was excited with a series of sweep sine tests in the frequency range between 0.1 and 20 Hz, considering two conditions: unloaded vehicle and loaded vehicle. The second condition was achieved with a 1000 kg payload placed longitudinally in the middle of the loading platform and laterally on the rear axle. The sweep sine test consists of a chirp signal with a constant imposed amplitude (in this case, 3 mm), while the frequency is linearly increased with a rate of 0.1 Hz/s. With the capability to control a single actuator independently, the conducted tests aimed to stimulate only one mode shape of the system in each trial. By coordinating the movement of all four actuators simultaneously, it became feasible to induce the heave motion of both sprung and unsprung masses. The pitching movement of the unsprung masses was triggered by concurrently moving rear posts. On the other hand, the rolling motion of both sprung and unsprung masses was induced by manipulating the actuators on the right side of the vehicle. Table 2 resumes the full scale and sensitivity of the sensors implied in the experimental campaign.

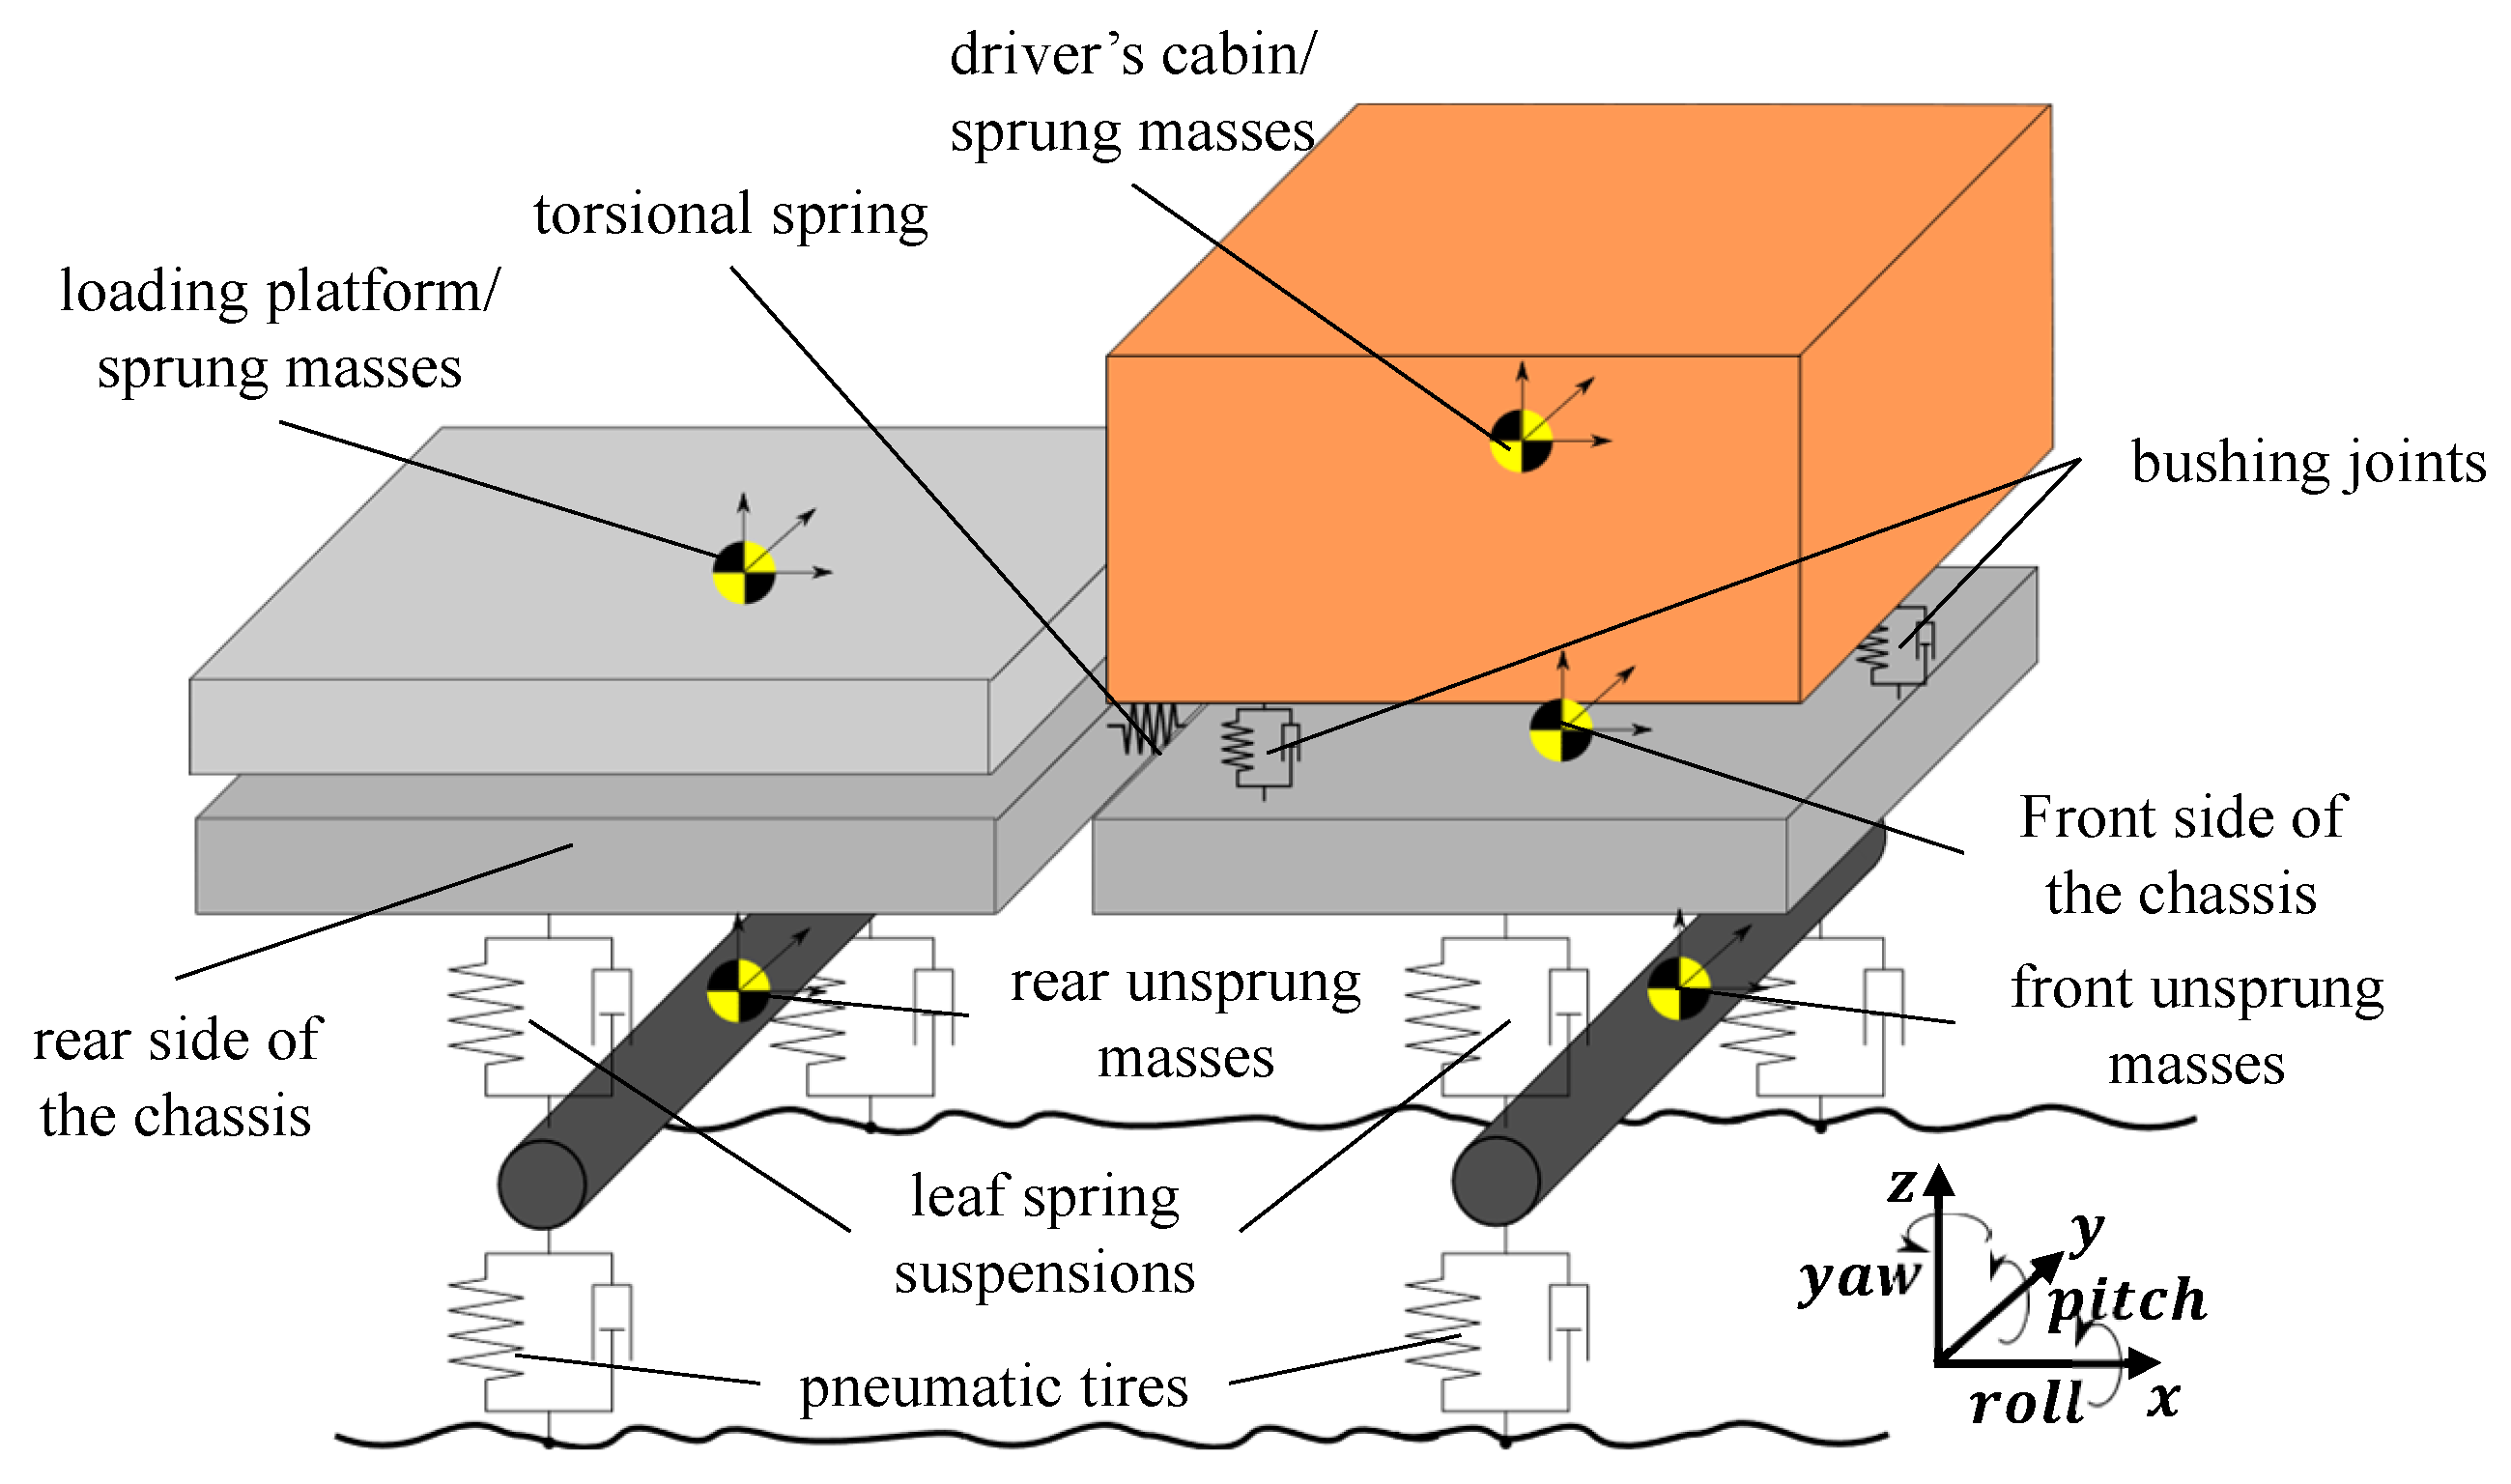
3. Vehicle Multi-Body Model

To study the influence of the chassis torsional flexibility on the rollover threshold of the multi-purpose agricultural vehicle, a vehicle model that can express the torsional flexibility of the chassis is needed (Figure 3).
The unsprung masses are separated from the vehicle chassis because, in this way, it can be modeled as a flexible element.

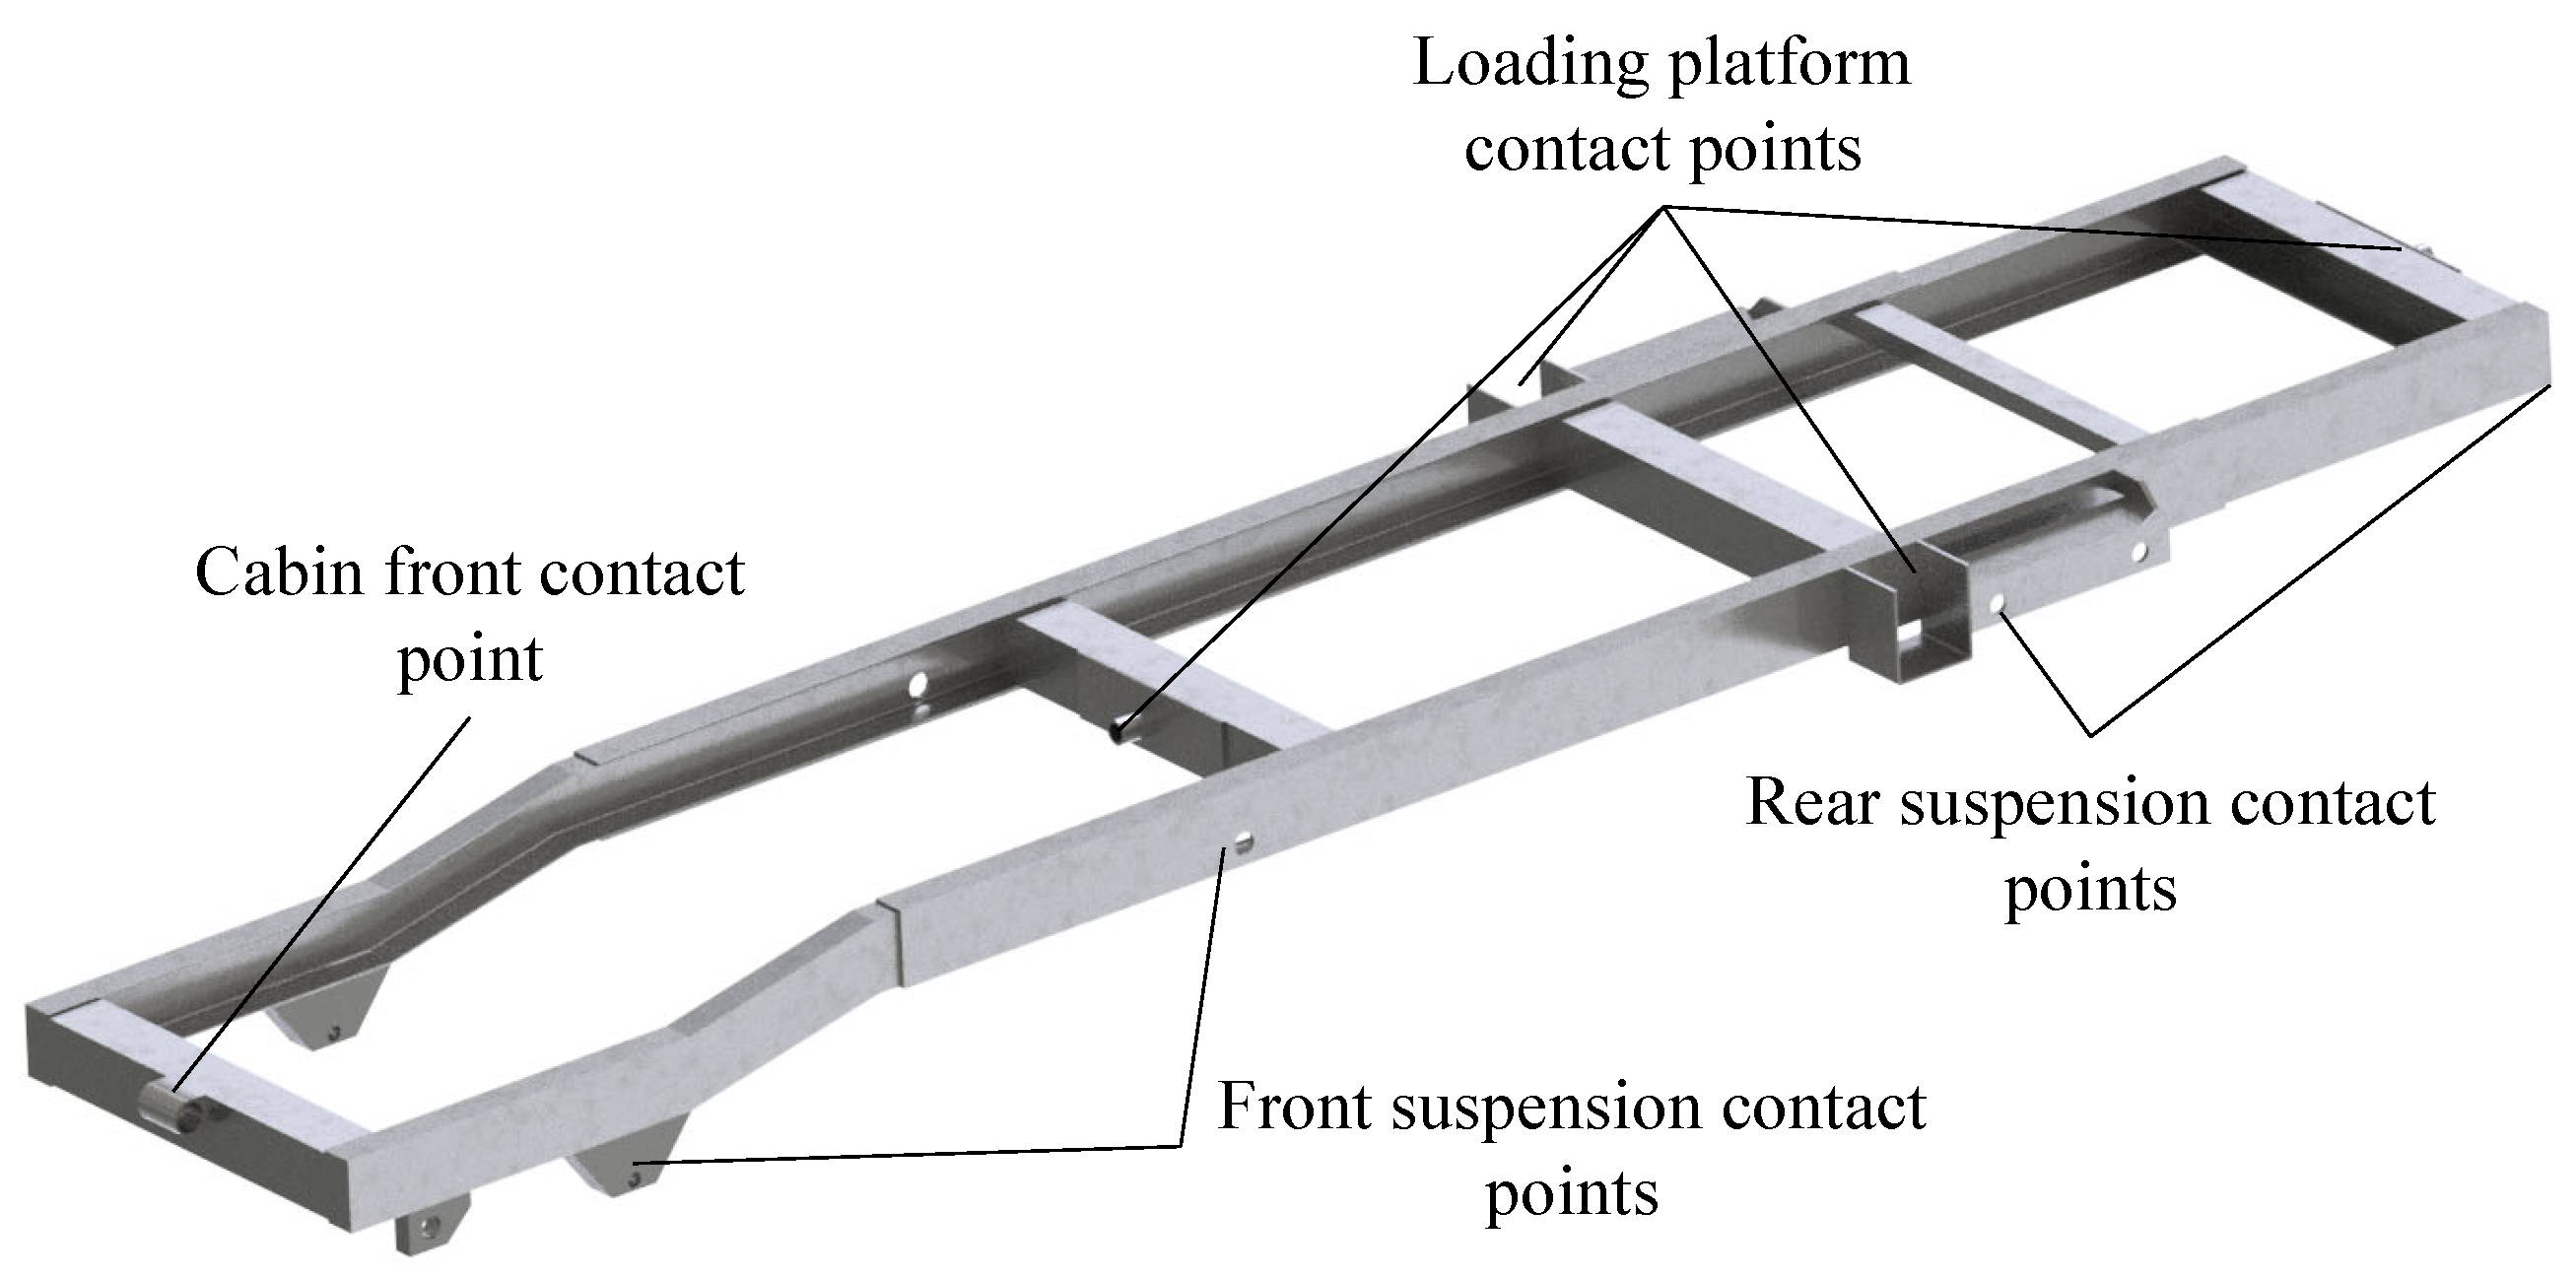
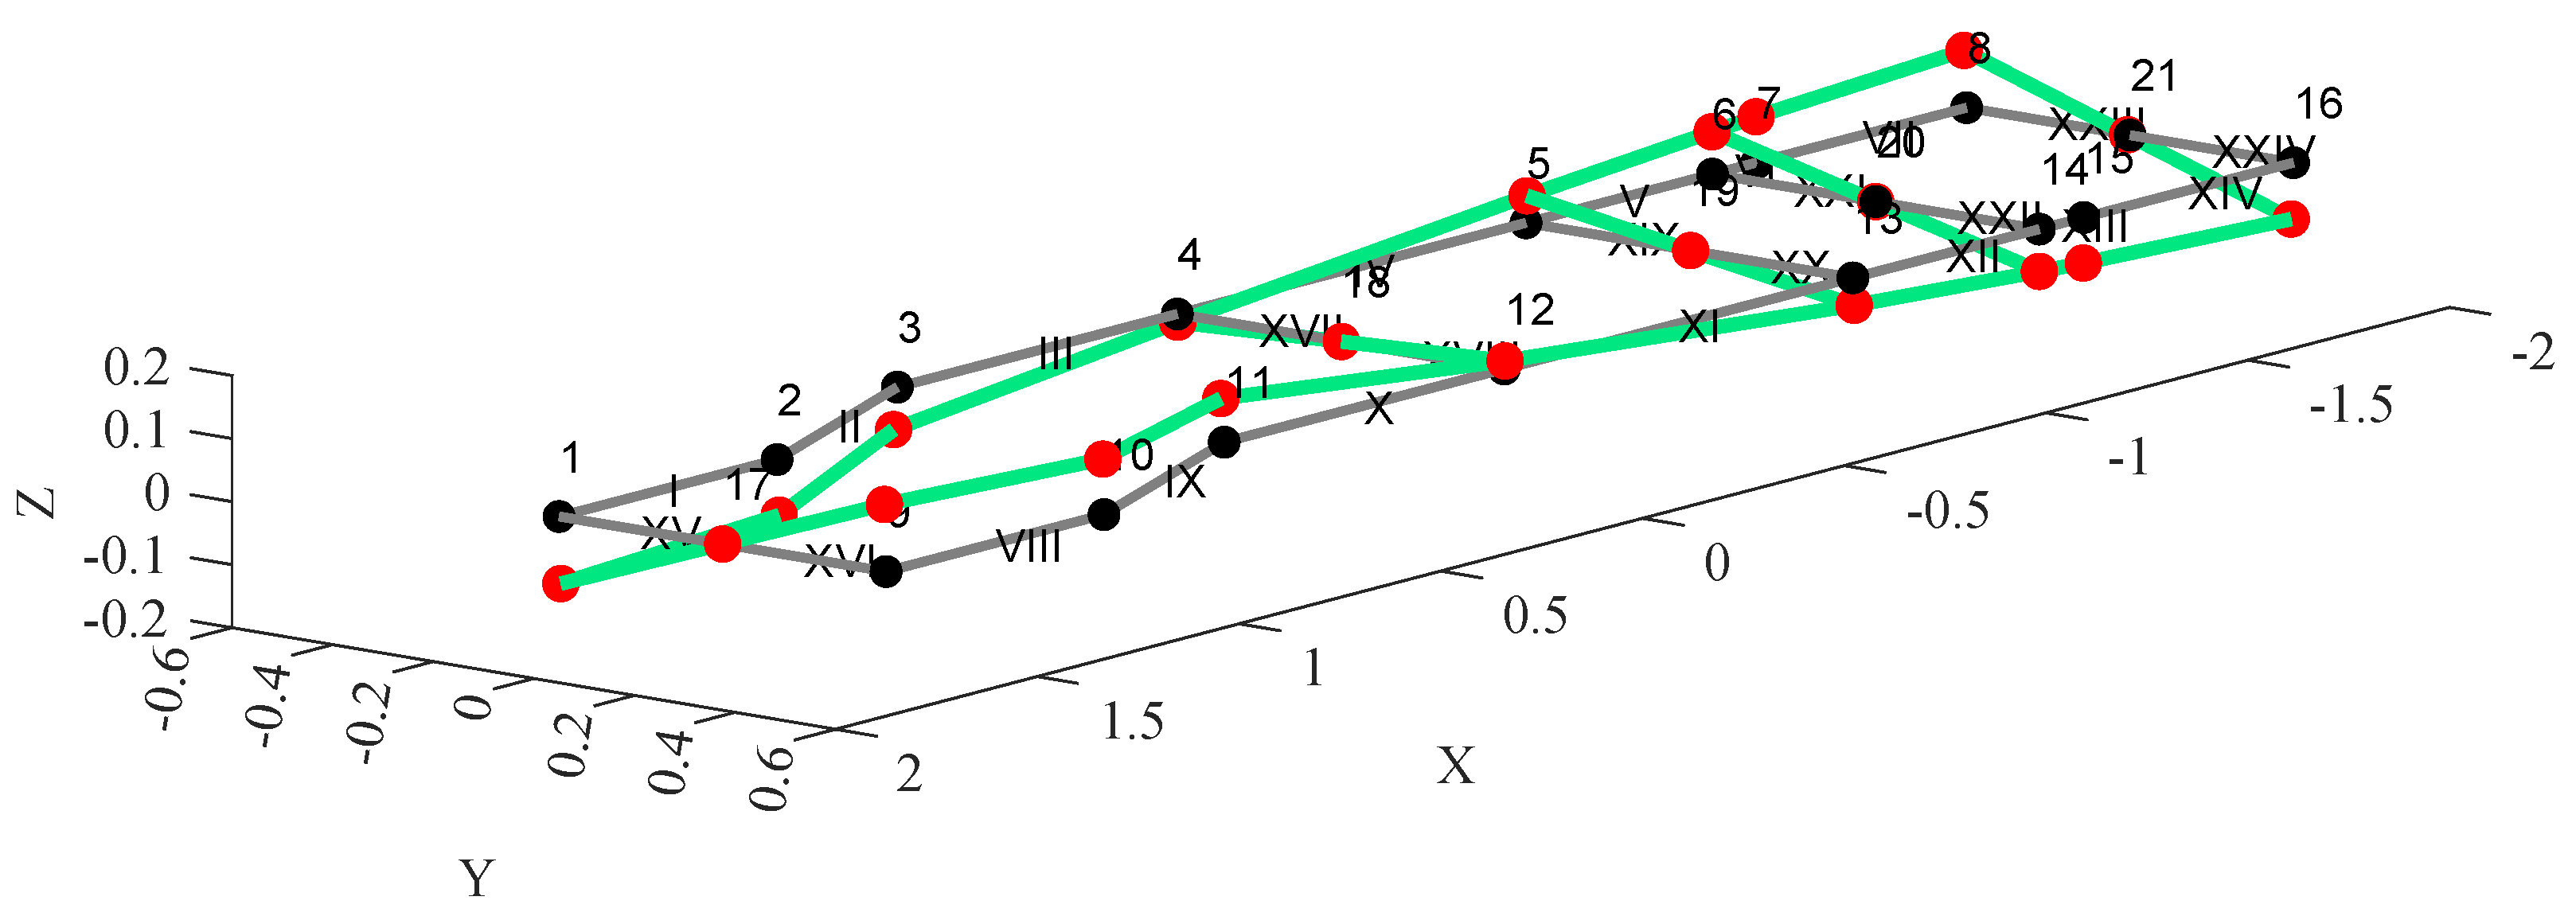
3.1. Vehicle Chassis Model

The real vehicle chassis consists of two longitudinal beams with a C-shaped section profile, interconnected by a series of transverse elements through welding, as shown in Figure 4. All the beams were made of steel.
The torsional rigidity of the chassis was modeled by treating it as divided into two rigid bodies connected by a torsional spring (Figure 3). The torsional spring stiffness value is obtained from a 3D Finite Element Method (FEM) model of the chassis, utilising 3D slender beam elements [27]. The FEM model was implemented in the Matlab environment. Illustrated in Figure 5, the model comprises 21 nodes and 24 elements, with each node corresponding to a section or slope variation. The mass and stiffness matrices of the structure were computed, assuming constant axial and shear stresses along the elements. Subsequently, the natural frequencies and mode shapes of the free structure were determined. Figure 5 illustrates the first torsional mode shape of the chassis at a frequency of 69.9 Hz (depicted by blue lines and red dots), compared to the undeformed structure (depicted by black lines). Notably, the torsional deformation separates the chassis structure into two segments, identified before and after node 18. The undeformed axis can be identified as passing through nodes 17 and 21. The equivalent torsional stiffness of the chassis corresponds to the structure-equivalent stiffness associated with the first torsional mode. The chassis mass and moments of inertia were estimated based on the CAD drawing.

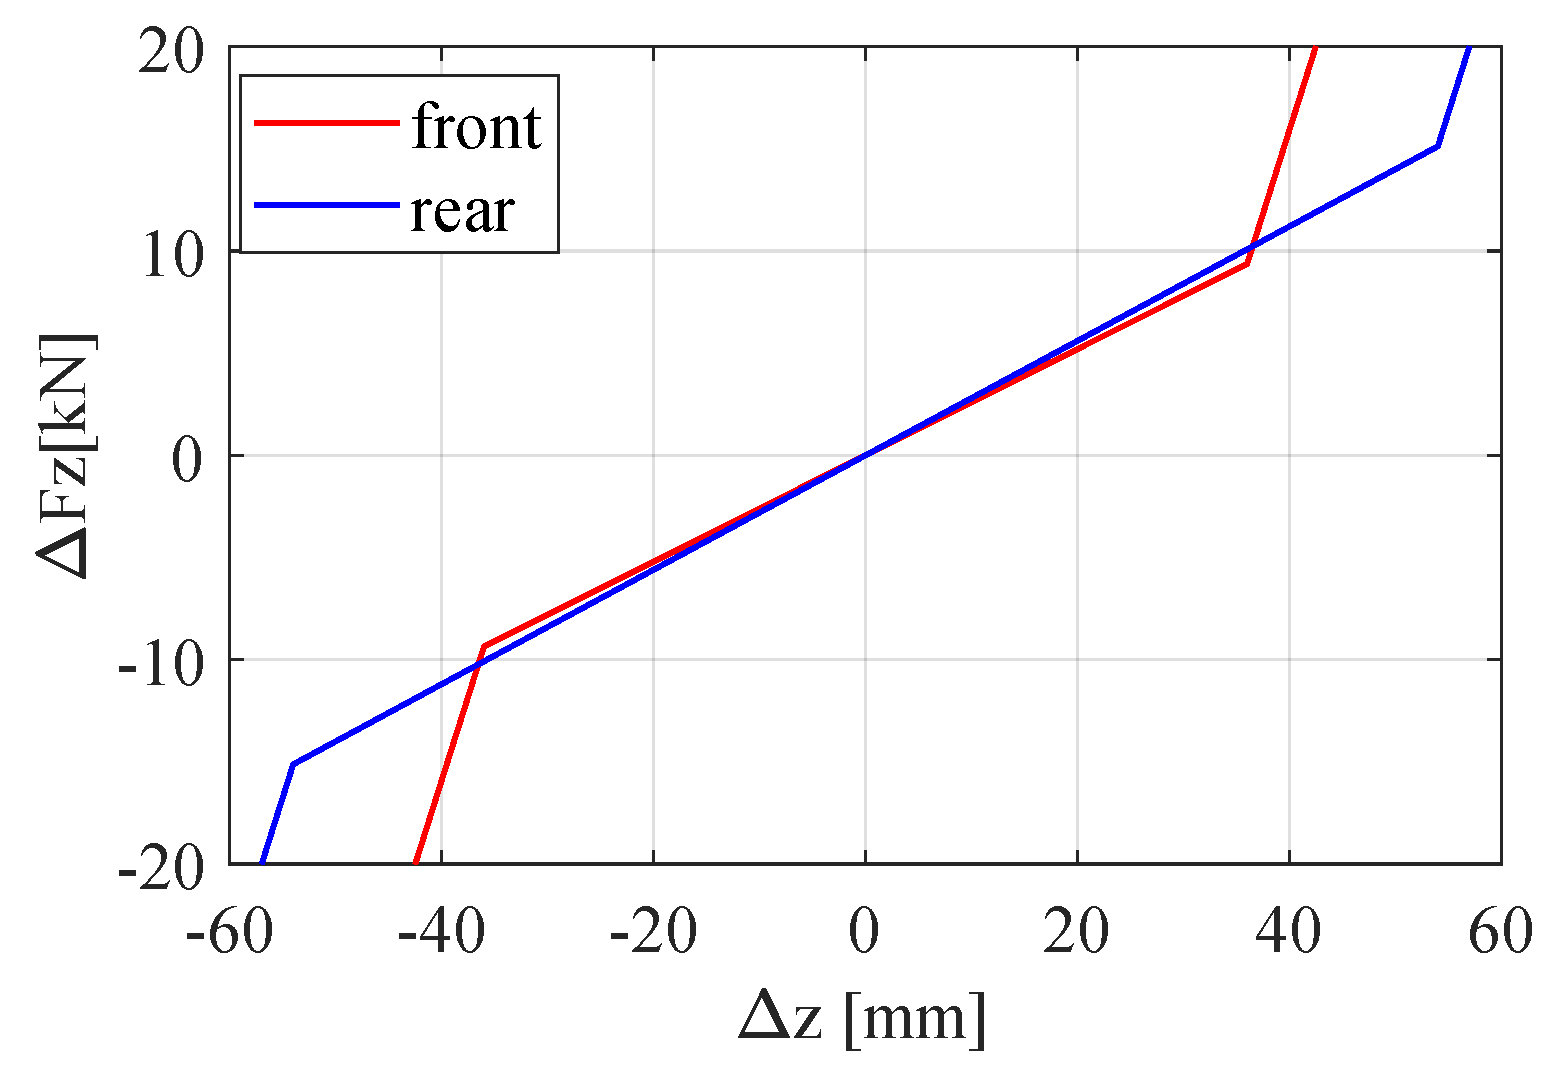
3.2. Vehicle Suspensions Model

The leaf spring suspensions were modelled as a viscoelastic component capable of transmitting vertical, lateral, and longitudinal forces between the rigid axles and the chassis. The model considers the suspensions as a bushing joint, where the longitudinal, lateral, and vertical forces are proportional to the displacement. The vertical stiffness of the suspension is of fundamental importance in the rollover process, as it allows the vehicle’s COG to move laterally. The compression of the leaf spring suspension is linear until the bump–stops intervention (Figure 6).

3.3. Vehicle Tires Model

Two different tire models were used: one for simulations in which the vehicle speed is equal to zero (four-post test rig and static rollover test simulation environment) and another for simulations in which the vehicle speed is different from zero (comfort track and banked road simulation environment). In the first case, the tire is modelled as a viscoelastic element capable of exchanging vertical, lateral, and longitudinal forces with the ground, as described in [18]. The contact forces were modelled using bushing joints and were computed as in Equations (1)–(3).
F z = k z z + r z z ˙ , z < 0 0 , z 0
F x = k x x + r x x ˙ , | k x x + r x x ˙ | < μ F z μ F z , | k x x + r x x ˙ | μ F z
F y = k y y + r y y ˙ , | k y y + r y y ˙ | < μ F z μ F z , | k y y + r y y ˙ | μ F z
z is the vertical deflection of the tire, computed as the difference between the undeformed tire radius R 0 and the effective tire radius R ( z = R 0 R ). k z and r z are the tire’s vertical stiffness and damping coefficient, respectively. Longitudinal force F x and lateral force F y are modelled to saturate according to the static friction coefficient μ between the tire and the platform of the tilting tests. x and y represent the lateral displacement of the tire contact point in the longitudinal and lateral directions, while k x and k y are the longitudinal and lateral stiffness of the tire carcass, and r x and r y are the damping coefficients. When the vehicle speed is non-zero, the ground surface is modelled as a three-dimensional grid. The tire–ground contact point is computed by calculating the minimum distance between the centre of the hub and the surface at each time step. The vertical force at the contact point is directed perpendicular to the surface, while the longitudinal force aligns with the wheel’s direction. The value of the vertical forces is calculated as in the static case (Equation (1)). Since the vehicle speed is very low during the simulations to replicate real working conditions, the longitudinal and lateral forces were computed as in Equations (4) and (5) [28].
F x = K x σ x , F z < 0 0 , F z 0
F y = K y σ y , F z < 0 0 , F z 0
K x and K y are the longitudinal and cornering stiffness of the vehicle. σ x = ω R e v x ω R e is the engineering longitudinal slip, which is the difference between the wheel peripheral speed and the hub longitudinal direction, divided by the wheel peripheral speed. σ y = v y ω R e is the engineering side slip angle computed as the ratio between the hub lateral direction and the wheel peripheral speed.

3.4. Modelling of Vehicle Unsprung Masses

The unsprung masses of the vehicle are considered and modelled as follows: the driver’s cabin was modelled as a rigid body with an equivalent mass and moment of inertia. Three bushing joints connect it to the front side of the frame to reproduce the real constraint. The loading platform is connected to the rear side of the frame by four spherical joints, and the relative masses and inertia come from the relative CAD model. Additional rigid bodies were placed to reproduce the vehicle mass distribution correctly. In more detail, front and rear differentials were placed in the centre of the front and rear axles, respectively, and the central differential and the tilting loading platform mechanism were rigidly linked to the rear side of the chassis. The oil and fuel tanks, the driver, and the engine were connected to the front part of the chassis. The whole vehicle model was developed in the Matlab/Simulink environment using the SimMechanics library and is depicted in Figure 7.

4. Model Validation

4.1. Vehicle Model Mass Distribution Validation

The MB model parameters were tuned by comparing the experimental measurements with the data from numerical simulations. Initially, the mass distribution of the vehicle model was validated by comparing the vertical contact forces and the position of the COG for both the unloaded and loaded vehicles with a payload of 1000 kg. The procedures described in points (i) and (ii) of the second chapter were replicated in the simulated environment. The obtained results are reported in Table 3.
The differences between the experimental data and MB results are less than 1%, considering the COG position for both loaded and unloaded cases. The tilting test experimental methodology described in point (v) was replicated in the simulation environment. During the tilt test, the vehicle axis was parallel to the tilting plane axis ( ψ = 0 ). The simulation results are depicted in Figure 8, showing the trend of the contact forces as normal in relation to the tilting plane as a function of the angle between the tilting plane and the ground.
The comparison between experimental and numerical data reveals that the first wheel detachment occurs at the same tilting angle of 42.1°. The second wheel detachment, which corresponds to the rollover point, is reached at 50.1° for the real tractor and at 49.8° in the numerical simulation. Considering the unloaded vehicle and a vehicle longitudinal angle ψ = 0 in the MB model, the difference in the rollover prediction is below 1%.

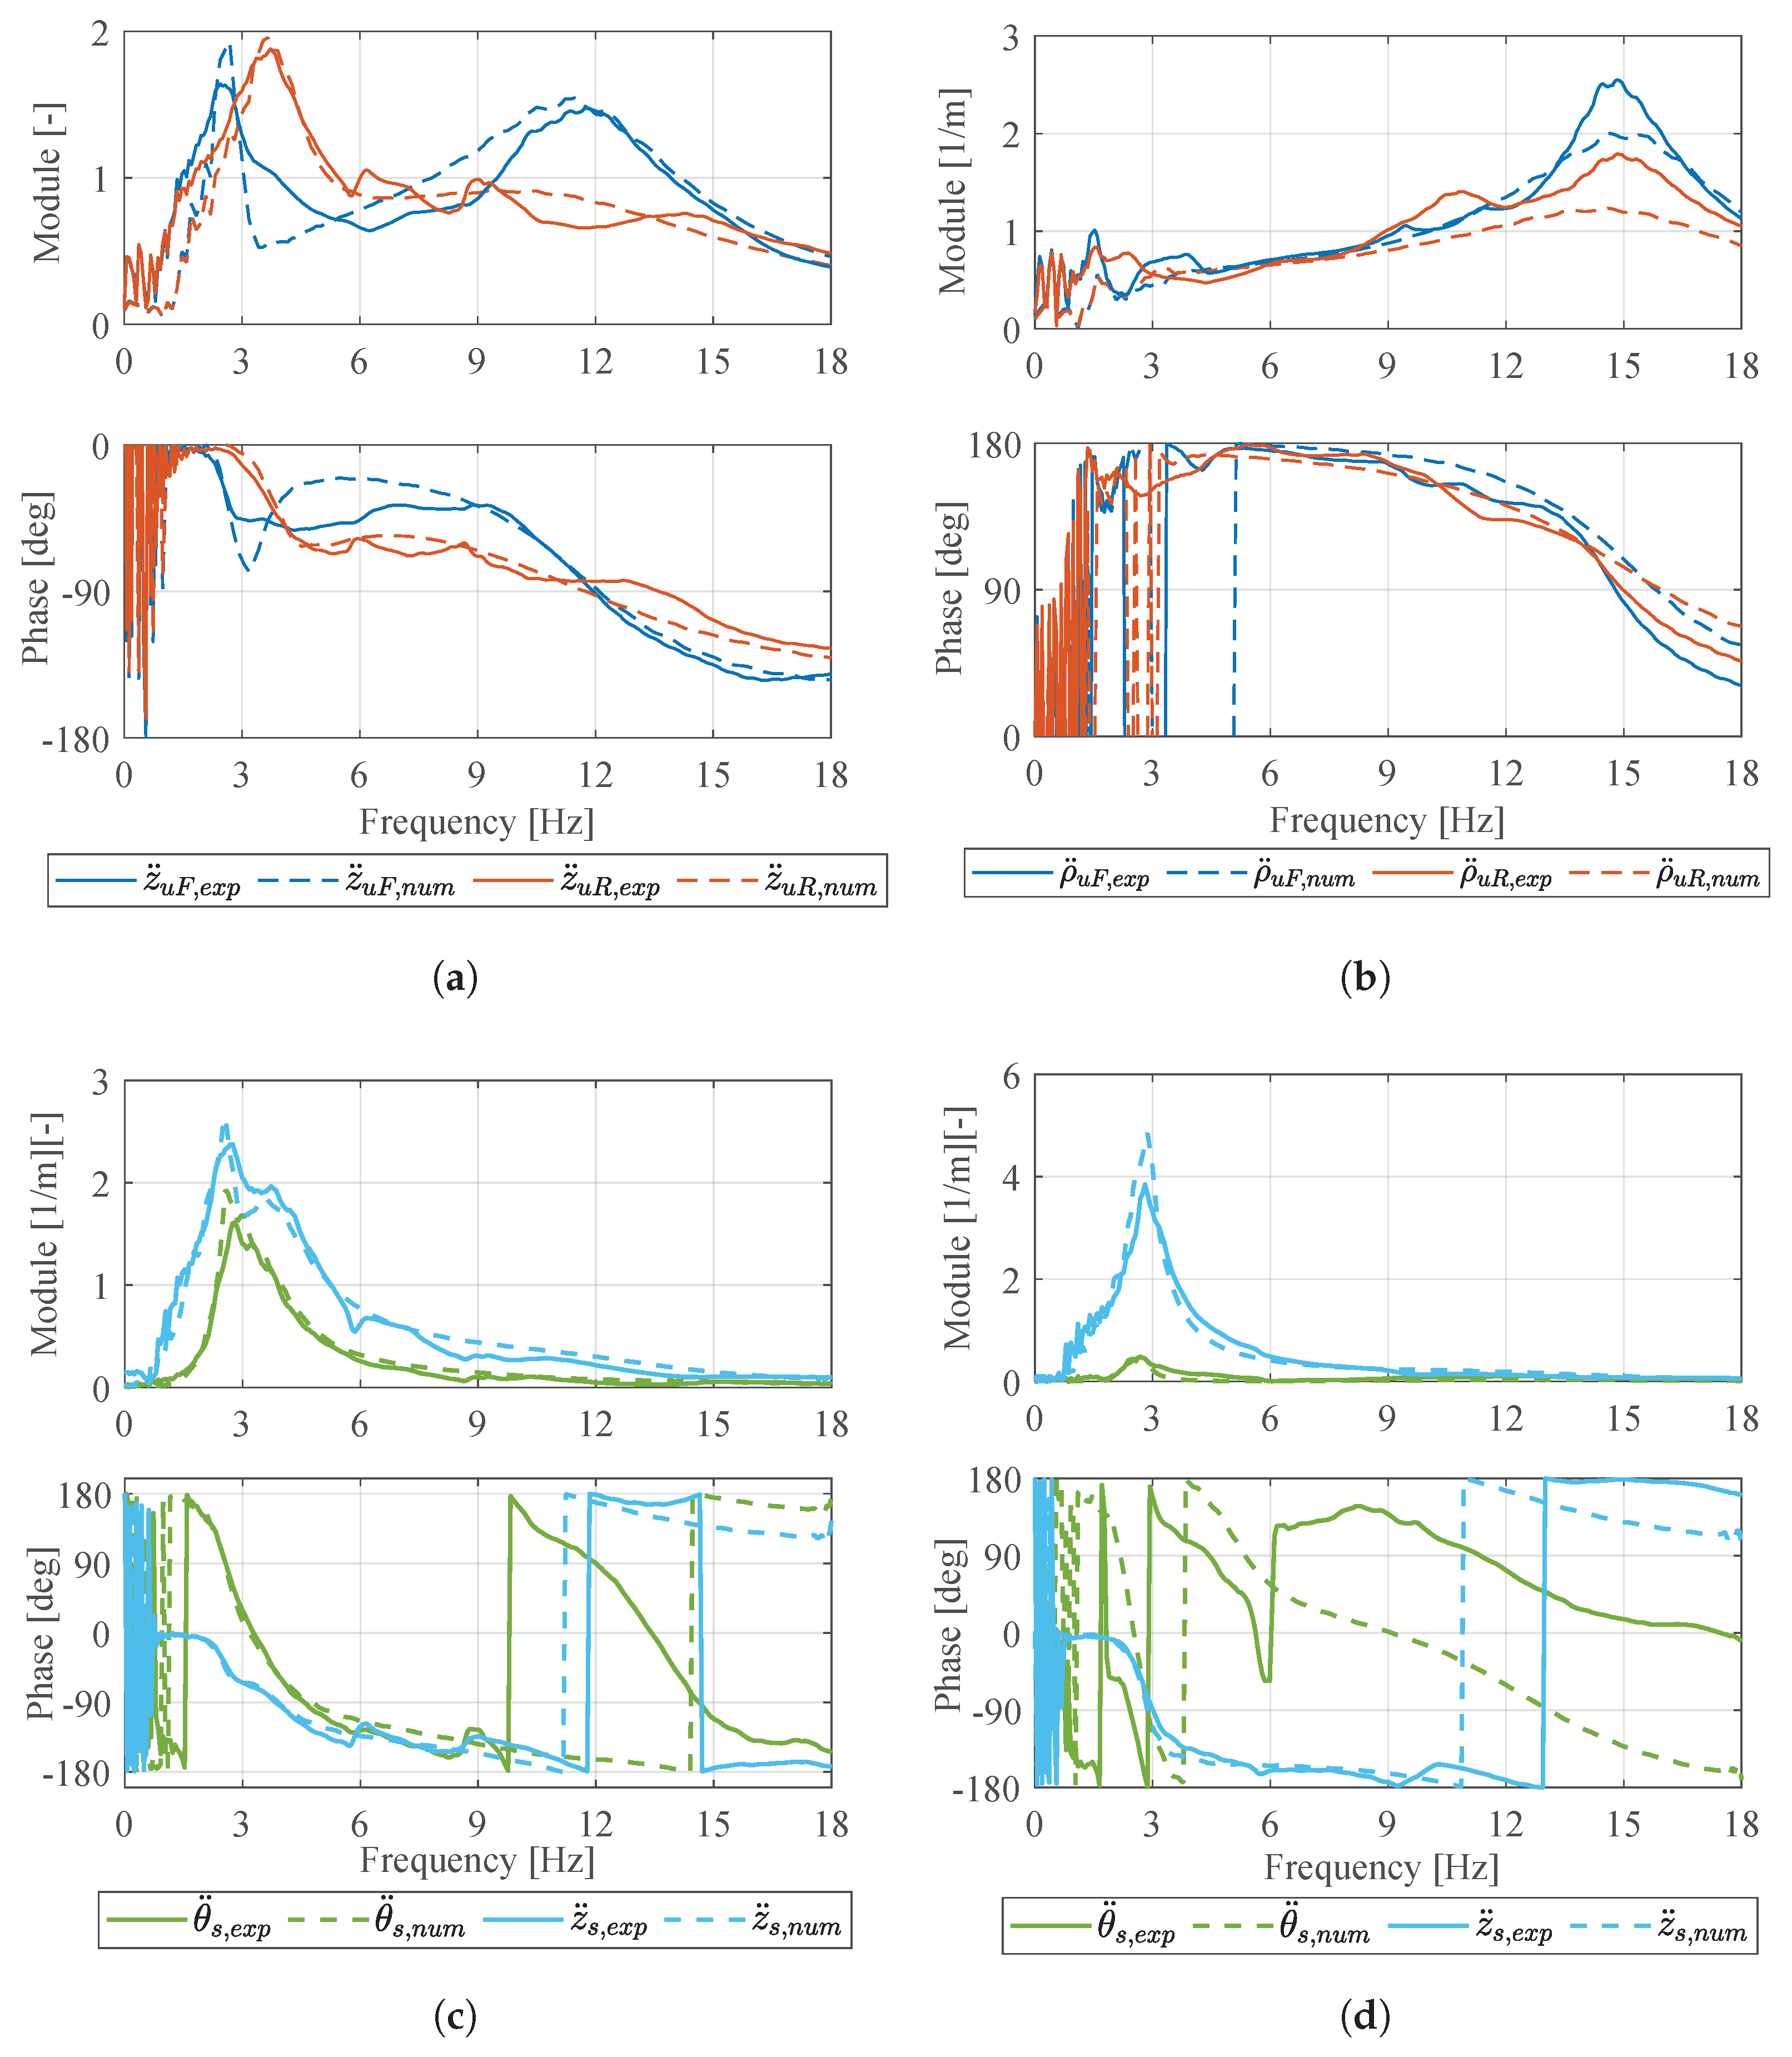
4.2. Validation of the Vehicle Model Dynamics

The results of the static measurements were used as an initial estimate during the fitting procedure of the model parameters, following the same procedure described in [29]. The tests performed and the experimental setup described in point (vi) of the experimental measurements methodology were replicated in the simulation environment. The vehicle model parameters were fine-tuned using four-post test rig acquisitions by comparing experimental measurements’ frequency response functions (FRFs) with the results of the numerical simulations. The data recorded during numerical simulations were post-processed following the same procedure used for the experimental measurements. The results of four-post test rig simulations are expressed as FRFs of the roll ( ρ ¨ u , F and ρ ¨ u , R ) and heave ( z ¨ u , F and z ¨ u , R ) motion acceleration of unsprung masses, the heave motion of sprung masses ( z ¨ s ), and the pitch ( θ ¨ s ) motion acceleration of the sprung masses with respect to the vertical acceleration of the posts. The FRFs were computed by applying the H1 estimator [30] to the time histories of the measurements using the MATLAB function “tfestimate”. The results are shown using a linear scale for both frequencies and amplitudes.
Figure 9 shows the main results related to the characterisation of the vehicle’s vertical dynamics. The numerical simulations exhibit a strong correlation with the data obtained from the experimental measurements. Figure 9a displays the heave motion acceleration of the unsprung masses when the four actuators move synchronously in phase with the unloaded vehicle. On the front axle, the FRF module peak at 11.8 Hz and the phase change of −90° correspond to the frequency related to the heave motion of the front axle. The same applies to the rear axle. At the frequency of 2.7 Hz, there is a peak on the front unsprung masses module, and similarly, on the rear unsprung masses, there is a peak at the frequency of 3.7 Hz. Comparing this figure with Figure 9c, it is possible to observe a coupled motion between the pitch and heave motion of the sprung masses in frequencies between 2.7 Hz and 3.7 Hz. This indicates that the heave and pitch motions are coupled. This behaviour of the vehicle is due to the position of the COG on the vehicle’s longitudinal axis. As reported in Table 3, the vehicle COG is closer to the front axle than the rear. As described in [31], in cases where the pitch and heave motion of the sprung masses are coupled, the mode associated with the vehicle corresponds to the heave motion of the front side of the vehicle frame (in this case, at 2.7 Hz) and the heave motion of the rear side of the vehicle frame (at 3.7 Hz). Considering the loaded vehicle, the COG position moves near the midpoint between the vehicle wheelbase (Table 3). When the vertical motion of the loaded vehicle is excited (Figure 9c), only the peak related to the heave motion at the frequency of 2.7 Hz is noticeable, with only a small contribution of the pitch motion at the frequency of 2.8 Hz. Figure 9b reports the FRFs associated with the roll motion of the unsprung masses when the vehicle roll motion is excited, moving the actuators on the right side of the vehicle in phase and considering the vehicle unloaded. The larger peak in the FRFs module at 14.7 Hz is related to the roll motion of unsprung masses and is confirmed in the phase plot. However, at the frequency of 1.5 Hz, a very small peak corresponding to the roll motion of sprung masses can be noticed. The measurements were performed with piezoelectric accelerometers that perform poorly at very low frequencies, making it difficult to record the roll motion of sprung masses in the measurements.

5. Results and Discussion

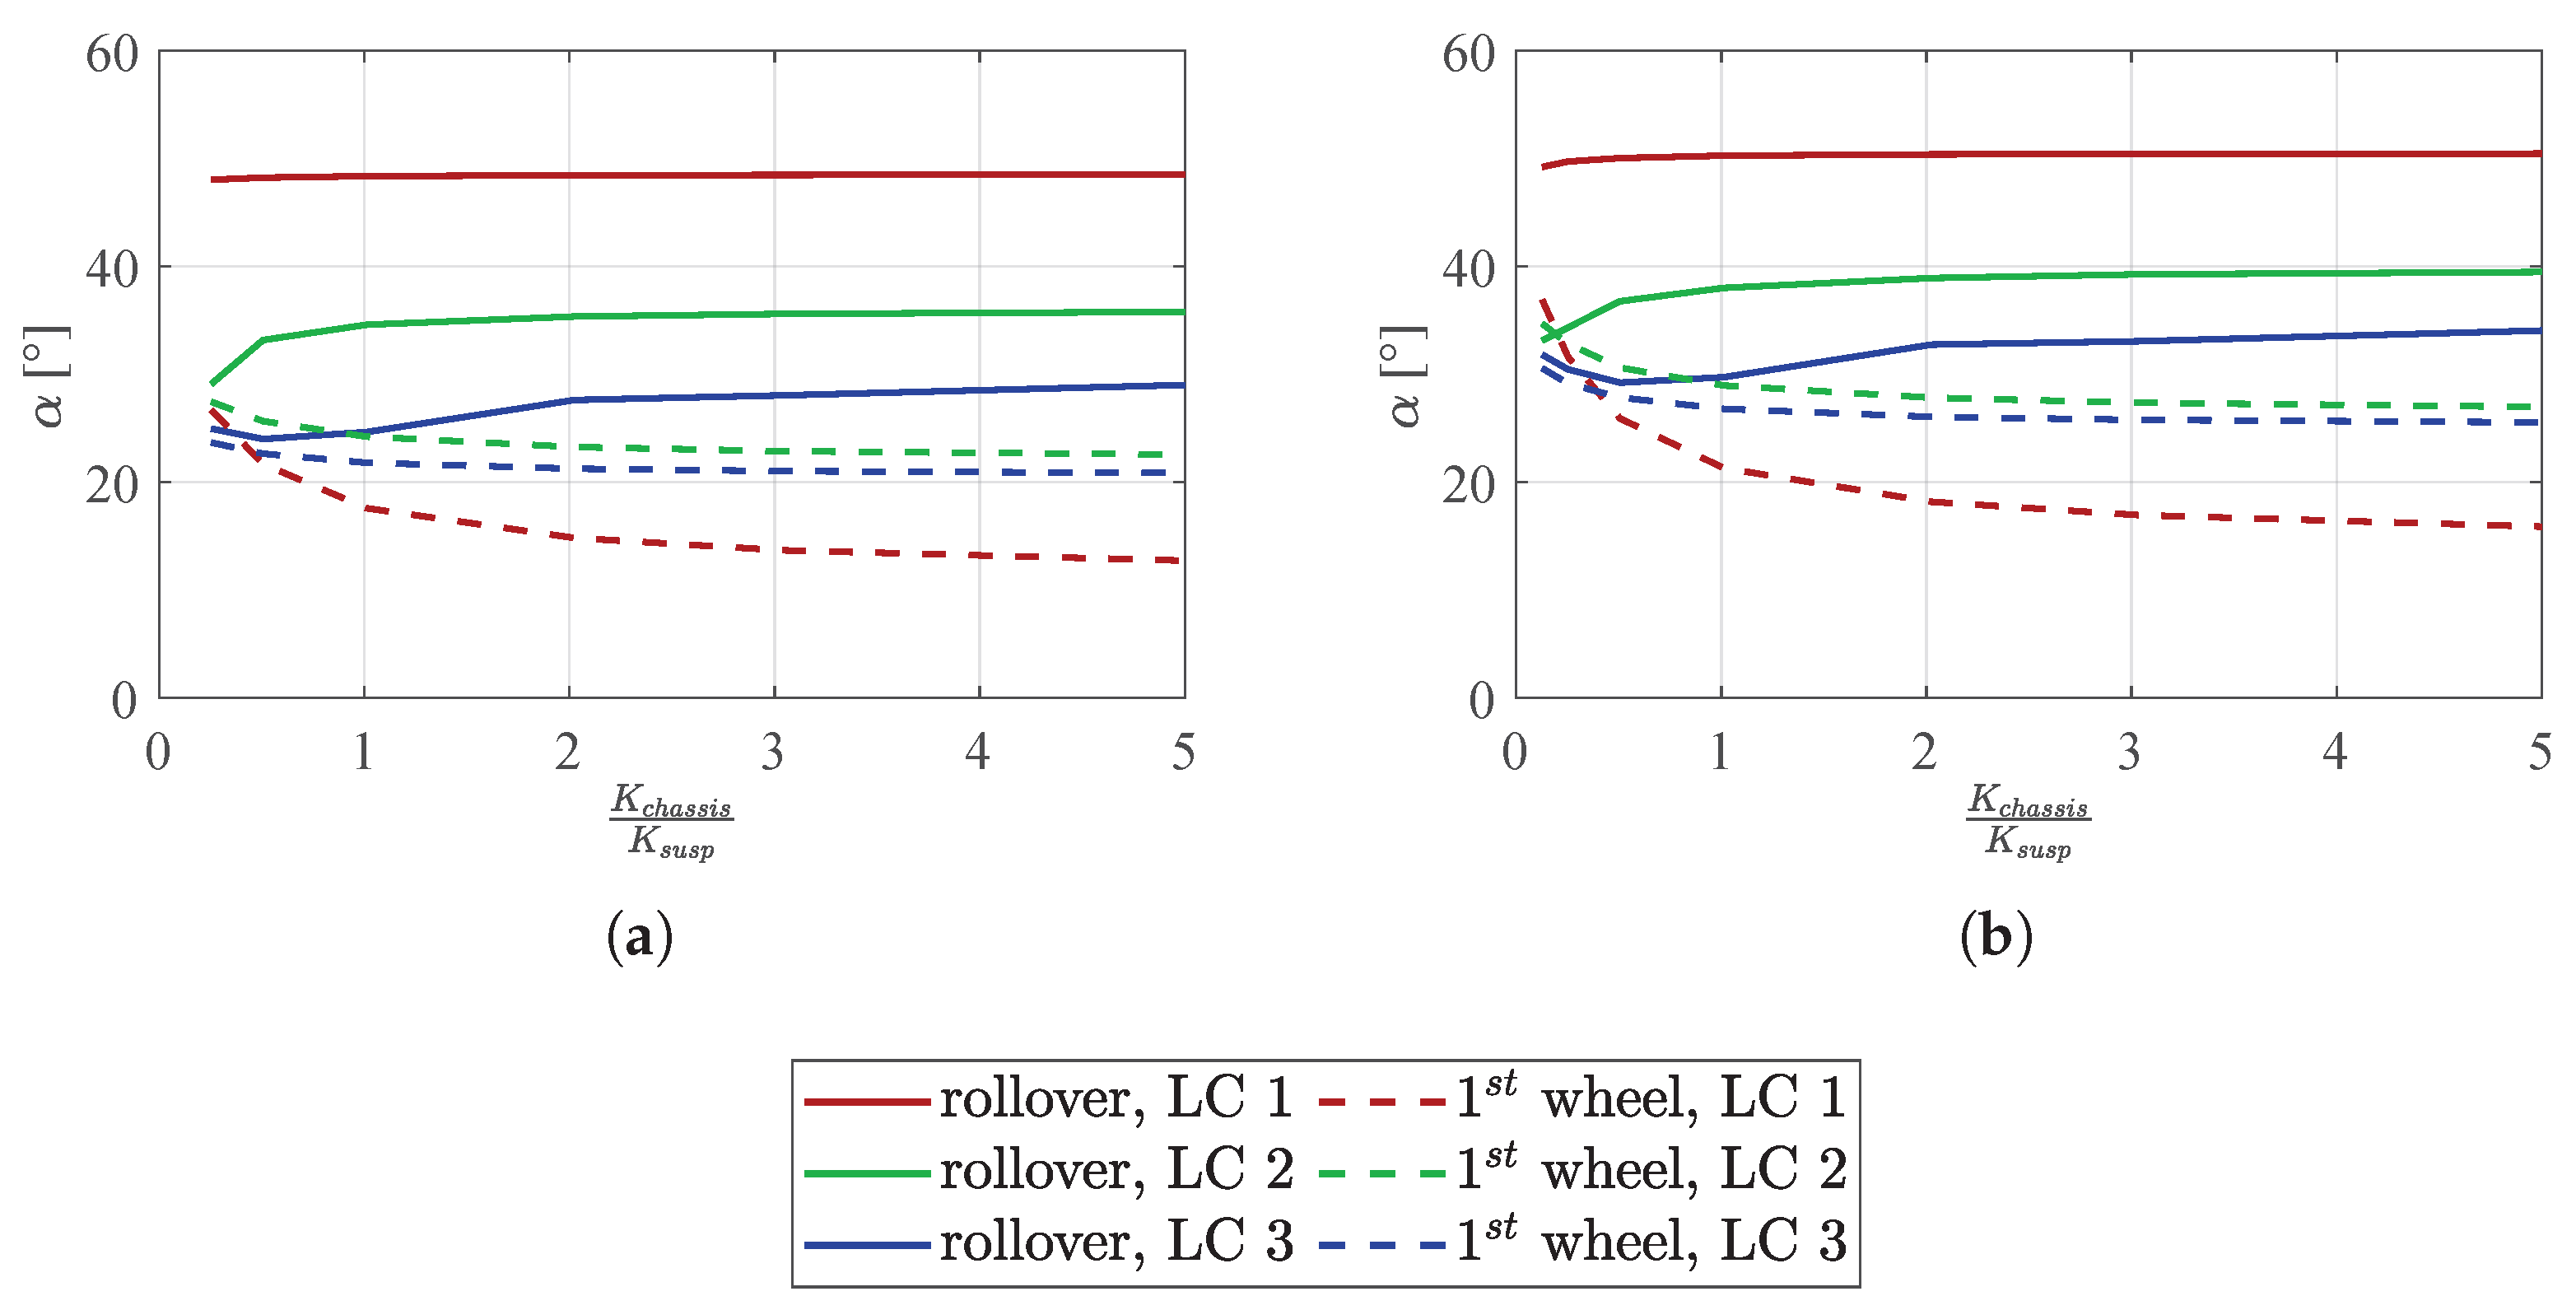
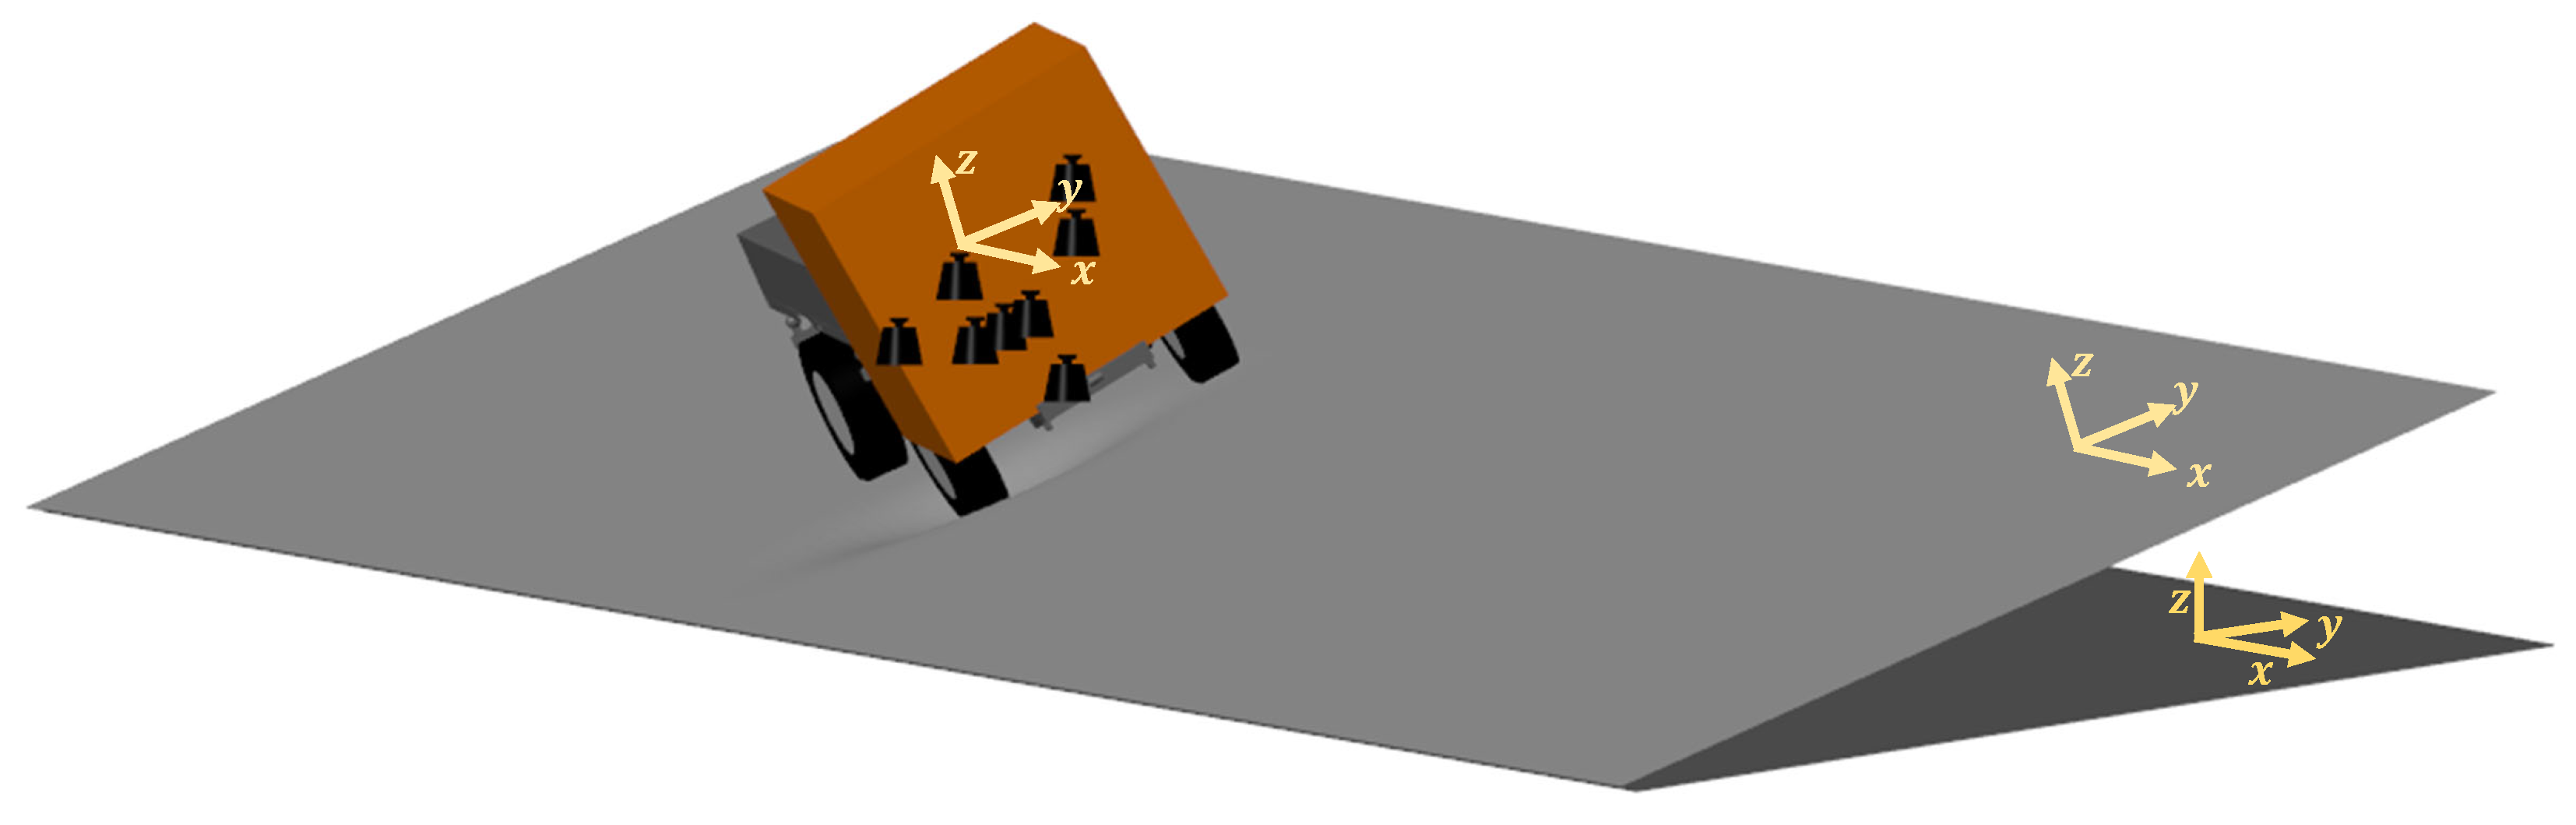
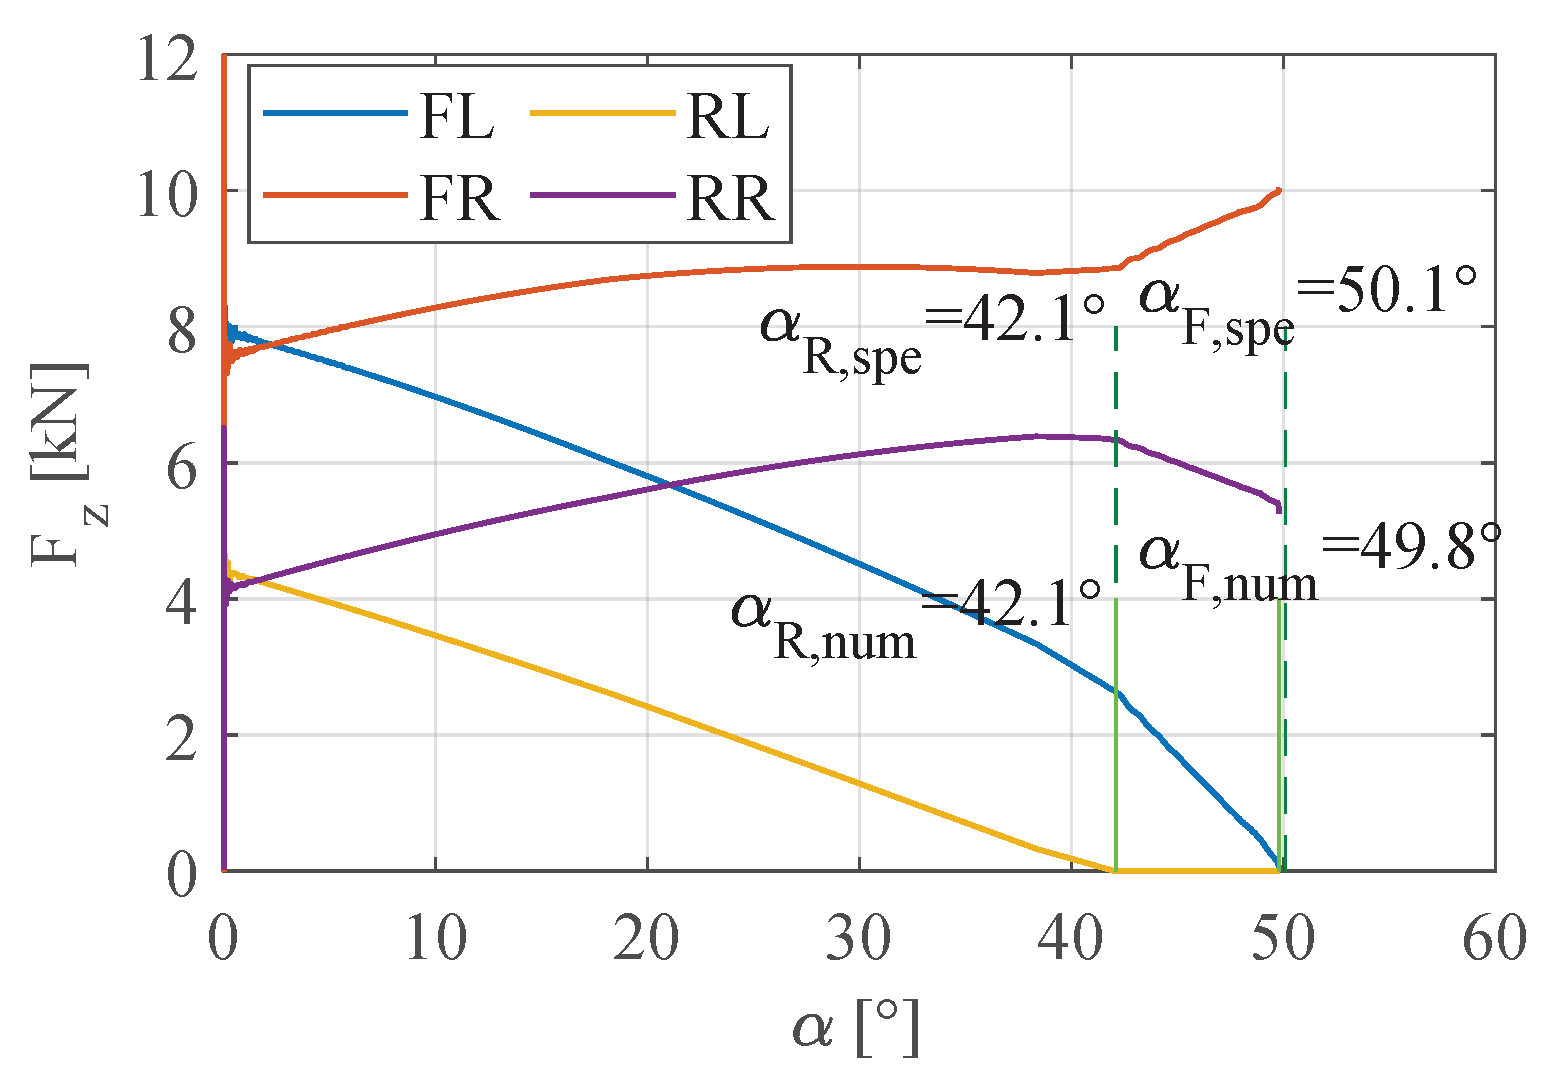
5.1. Static Numerical Simulations Results

The validated model was utilised to analyze rollover as a function of chassis stiffness parameters and vehicle loading conditions. Rollover stability under static conditions was investigated by replicating the static rollover test of the vehicle and considering different orientations of the vehicle’s axis relative to the slope. The tilt angle between the vehicle’s longitudinal axis and the direction parallel to the axis of the tilting platform is denoted by ψ (see Figure 10).
The position corresponding to ψ = 0 is the one described in the test depicted in Figure 1b, where the vehicle’s axis is perpendicular to the slope, and the right side is facing downhill. Numerical simulations were performed by varying the angle ψ from 0° to 360° with a step size of 15°. The simulation was reiterated, taking into account scenarios with all wheels aligned on the tilting platform (“case 0”), raising the left front wheel (“case FL”), and lifting the left rear wheel (“case RL”) by a step of 0.2 m. This approach allowed us to examine rollover stability by replicating the worst-case scenario encountered during field operations. The platform was moved with a speed of 0.5°/s to maintain quasi-static conditions, as in experimental tests. The sensitivity analysis on vehicle parameters was performed using two different chassis torsional stiffness values. The first, indicated as “1K”, corresponds to the actual chassis stiffness, and the second, indicated as “5K”, is equal to five times the actual chassis stiffness. Additionally, three different load cases were considered: “LC 1” refers to the unloaded vehicle case, “LC 2” corresponds to the vehicle loaded with a ballast of 1500 kg placed on the loading platform, and “LC 3” considers a ballast of 2500 kg. The results of the simulations are reported in terms of first-wheel detachment and second-wheel detachment, corresponding to complete rollover, as shown in Figure 11.
The numerical simulations revealed that the torsional stiffness of the chassis has a minor impact on the rollover angle but does play a role in determining the first-wheel detachment angle. This influence becomes more pronounced when a step is present, causing the suspensions to operate in an asymmetrical manner. In such scenarios, a less stiff chassis contributes to an increase in the vertical load on the less burdened wheel, consequently delaying the detachment of the wheel from the ground. This observed behavior holds true across three distinct load cases. The rollover test was repeated under the most critical conditions to better investigate the relationship between chassis flexibility and suspension stiffness. In the scenario where the right front wheel is lifted, as depicted in Figure 11, the smallest platform angle at which the detachment of the first wheel occurs corresponds to a vehicle inclination relative to the slope at an angle ψ = 210 ° . Similarly, considering the lifting of the left front wheel, the first detachment occurs at an angle ψ = 330 ° . Numerical simulations were reiterated by varying the ratio between the torsional stiffness of the chassis and the equivalent torsional stiffness provided by the suspensions ( K c h a s s i s K s u s p ) . In Figure 12, numerical simulation results are expressed in terms of platform tilting angle when the first and second-wheel detachment occurs.
At low stiffness ratios, the chassis deformation lags behind the first-wheel detachment due to a decrease in load transfer between the front and rear axles. Conversely, the trend of the rollover angle decreases as the ratio between chassis and suspension stiffness decreases. The influence of the payload amplifies the trend for a more flexible chassis. For a stiffness ratio greater than 2, where the torsional flexibility of suspensions is not comparable to that of the chassis, the trend stabilises around a fixed value.

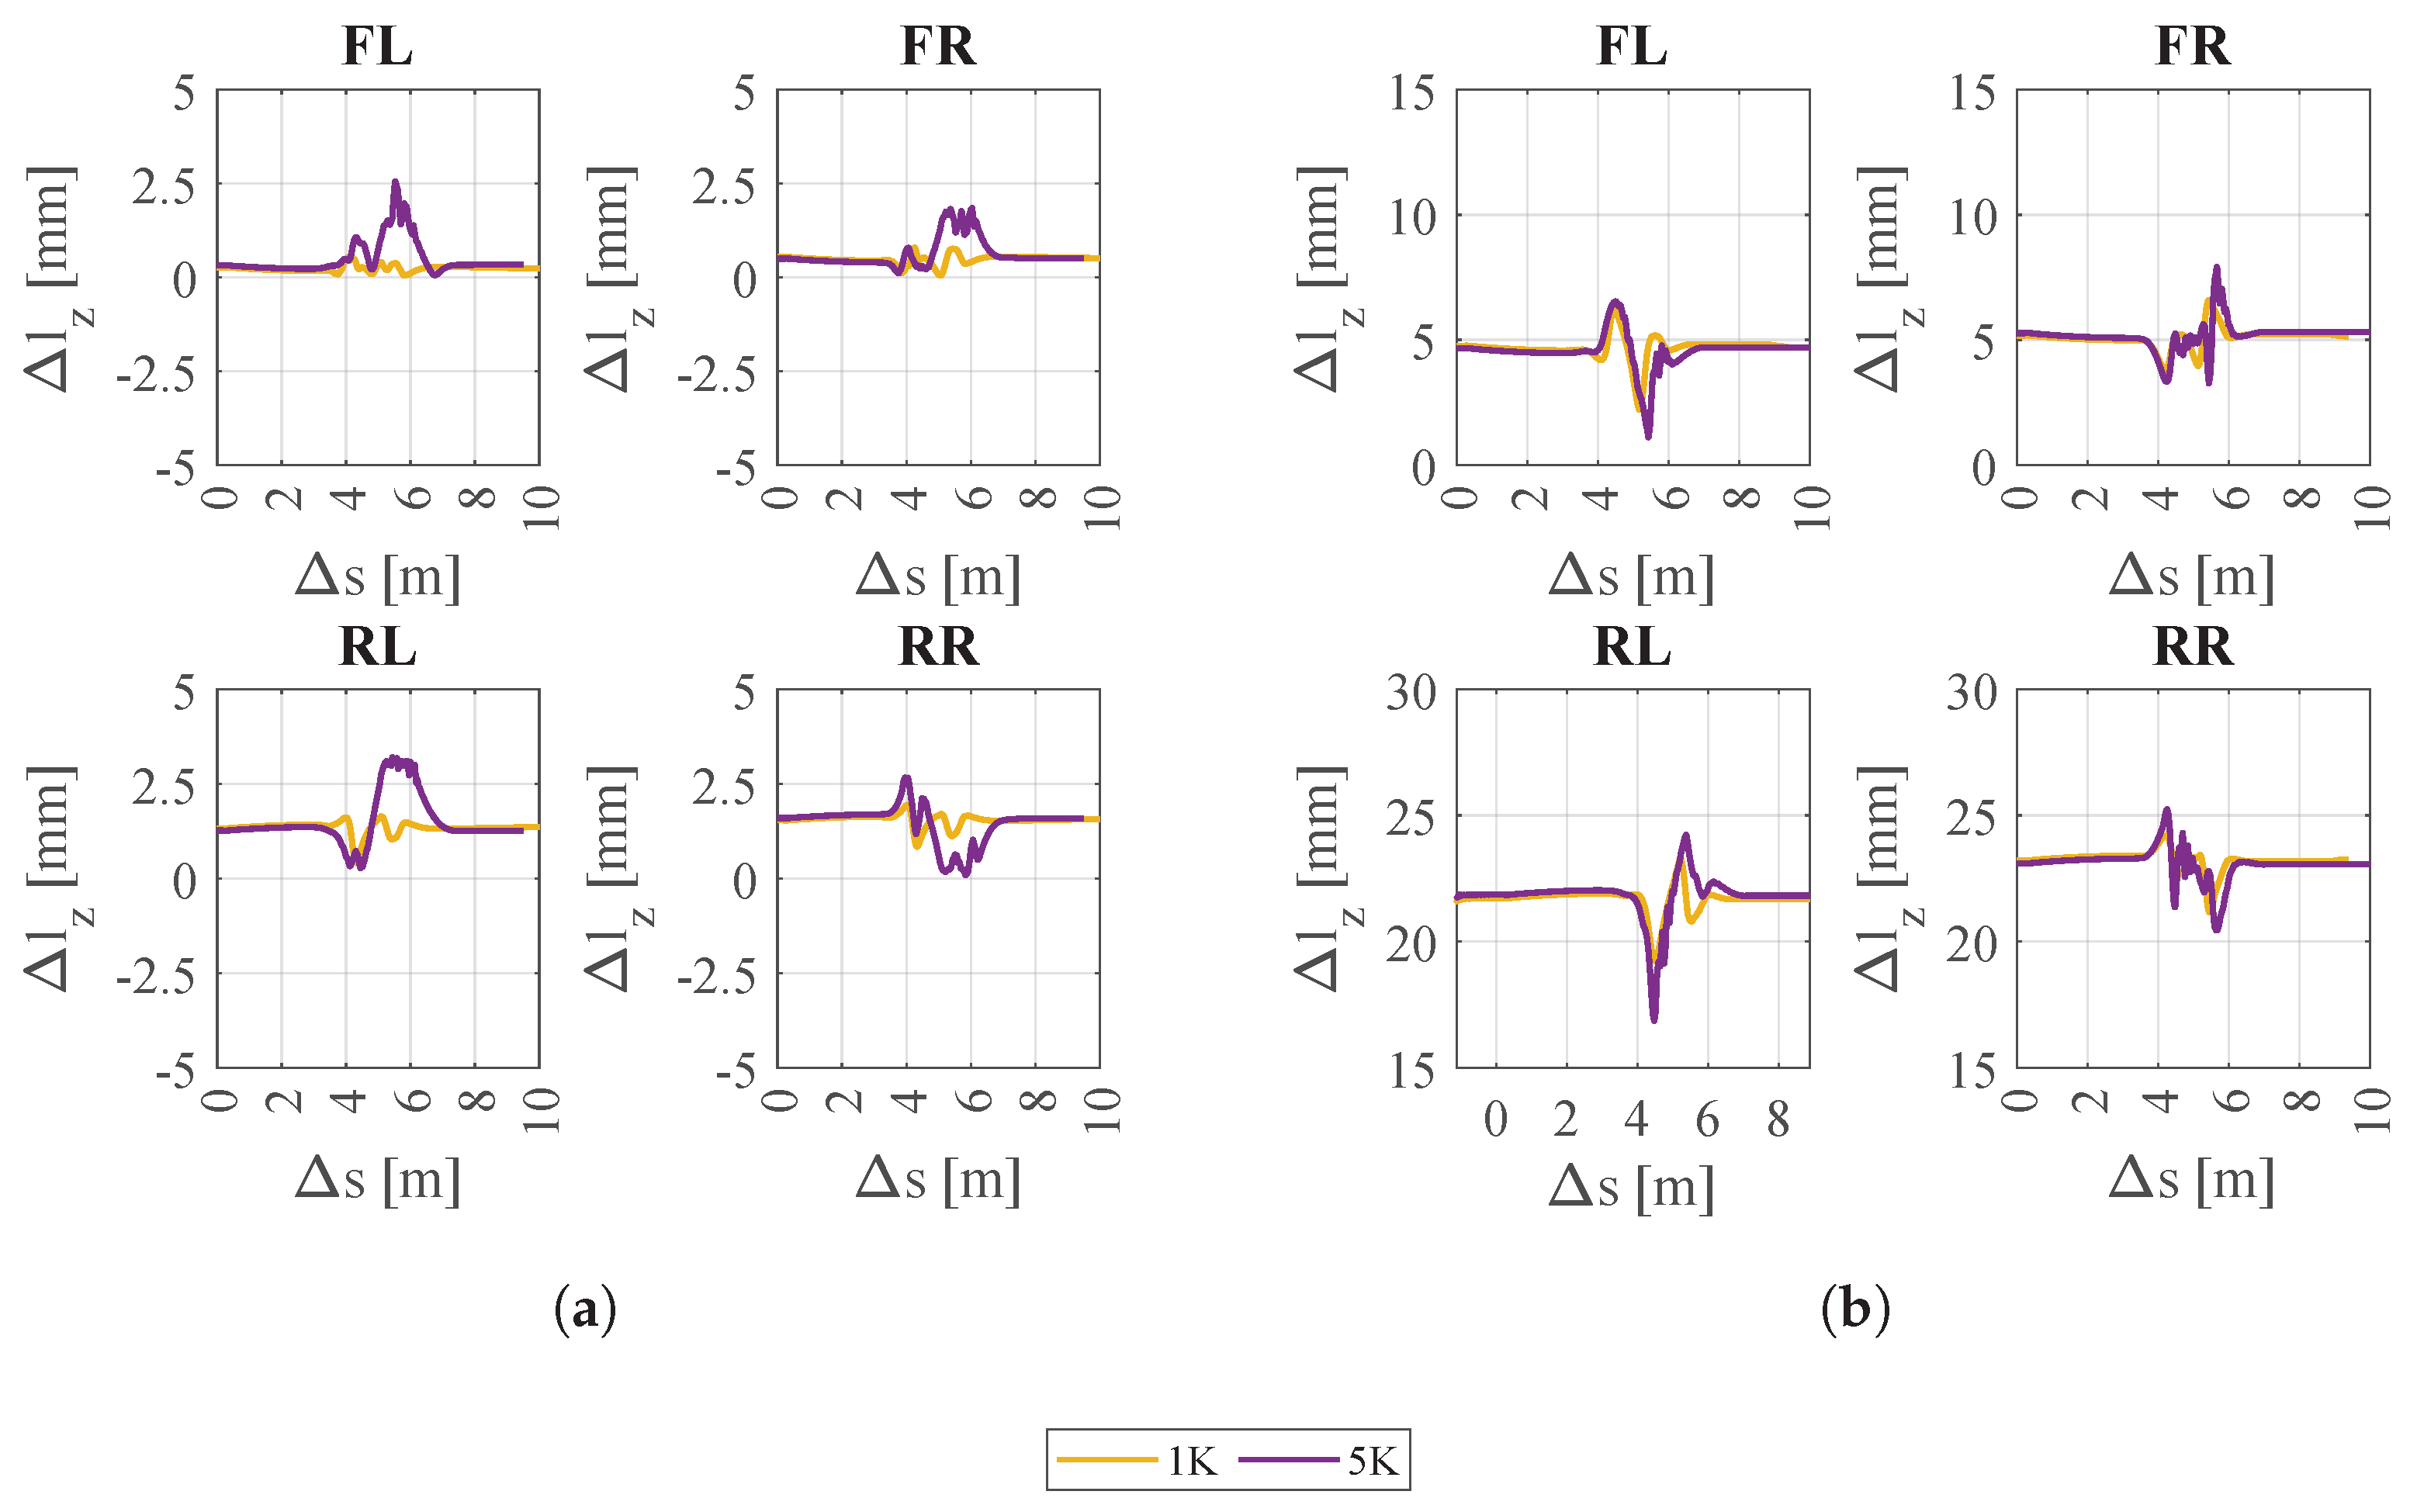
5.2. Dynamic Numerical Simulations Results

The stability to rollover of the vehicle was investigated by simulating the vehicle in working conditions during a critical scenario. The simulation replicates the vehicle traveling along an inclined road, with the direction of travel perpendicular to the slope’s inclination. At a specific point, the vehicle encounters a pothole with the wheels positioned further downhill, as depicted in Figure 13.
In the simulations, the road bank angle was set to 8°, and the hole had dimensions of 3.5 m in length and 0.2 m in depth. This critical manoeuvre was performed with the vehicle speed set to 1 km/h, mimicking real-world in-field operations. The considered vehicle loading conditions include both the unloaded vehicle and the vehicle with a payload of 1500 kg. The vehicle chassis stiffness considered is 1K and 5K, as described in the static rollover simulations. The simulation results are reported in Figure 14, Figure 15 and Figure 16.
Figure 14 represents the vertical force acting on each wheel of the vehicle during the dynamic simulation for the loaded case (Figure 14a) and the unloaded case (Figure 14b). The flexible chassis minimises load transfer, improving road holding when the vehicle tackles the pothole. On the other hand, the stiffer chassis causes wheel detachment. For the manoeuvre with the loaded vehicle, the presence of the ballast enhances the performance of the stiffer chassis because the ballast contributes to the increase in the load on the uphill wheels while the front-right wheel descends into the hole. The vehicle’s behaviour is confirmed by examining the deformation of the suspensions and the chassis. Figure 15 shows the displacement of the suspensions during the dynamic test (Figure 15a for the unloaded case, Figure 15b for the loaded case), and Figure 16 shows the deformation angle of the chassis (Figure 16a for the unloaded case, Figure 16b for the loaded case). Suspension deformation refers to the displacement from the condition where the unloaded vehicle is positioned on a flat surface. Bigger deformations are associated with the wheels that are downstream to the banked road (right side of the vehicle). Instead, the chassis deformation is expressed as the angle between the front and rear sides of the chassis. Considering the case with rigid chassis stiffness (5K), when the vehicle is dealing with the pothole, the deformation of the suspensions tries to compensate for the road unevenness because the chassis has smaller deformation. However, this is not sufficient to ensure stability and road holding, especially when the front wheel exits the pothole. In the case of smaller chassis torsional stiffness (1K), the deformation of the suspension is smaller because the road unevenness is absorbed by the chassis deformation. This behaviour of the vehicle in terms of stability and road holding due to the flexible chassis is enhanced in the case of a loaded vehicle.

6. Conclusions

This paper presents an analysis of the chassis torsional flexibility on the rollover threshold of a multi-purpose agricultural vehicle. The vehicle structure is described, emphasising its key parameters. Several experimental measurements were performed to characterise the vehicle dynamics, including procedures to estimate the COG position, static rollover tests on a tilting platform, and the four-post test rig. Subsequently, the MB vehicle model was developed in a simulation environment to reproduce the vehicle dynamics. Significant emphasis was placed on key vehicle components that most influence the vehicle’s rollover stability, such as tires, suspensions, and chassis flexibility. Specifically, using the finite element approach, the chassis torsional flexibility was characterised and introduced into the MB model as a lumped parameter for sensitivity analysis. The model was validated by reproducing the experimental measurements in the simulation environment. The position of the COG of the model and the results of the tilting platform test closely match the experimental data, characterising the model’s response to static rollover. The vehicle’s vertical dynamics were characterised by reproducing the four-post test rig. The influence of chassis stiffness, suspension stiffness, and loading conditions was investigated by examining static rollover and replicating a typical vehicle working scenario. Static rollover was explored by replicating the tilt platform test, first lifting the front-left wheel and then the front-right wheel, and analysing the ratio between chassis torsional flexibility and suspension-equivalent torsional flexibility. The results indicate a trade-off between increased road-holding capability and rollover stability with varying chassis torsional stiffness. Specifically, decreasing chassis rollover stability increases the first wheel detachment angle, but particularly in heavy loading conditions, there is a negative effect on the rollover angle due to load transfer caused by the flexible chassis. These results are confirmed by examining suspension and chassis compliance in dynamic numerical simulations.

Author Contributions

Conceptualization, M.B., M.V. and E.S.; methodology, E.S.; software, M.B. and M.V.; validation, M.B., M.V. and E.S.; formal analysis, M.B.; investigation, M.B.; resources, E.S.; data curation, M.B.; writing—original draft preparation, M.B.; writing—review and editing, M.B., M.V. and E.S.; visualization, M.B., M.V. and E.S.; supervision, M.V. and E.S.; project administration, E.S.; funding acquisition, M.V. and E.S. All authors have read and agreed to the published version of the manuscript.

Funding

This research received no external funding.

Institutional Review Board Statement

Not applicable.

Informed Consent Statement

Informed consent was obtained from all subjects involved in the study.

Data Availability Statement

Data are contained within the article.

Acknowledgments

This work has been developed as part of the project “PAOLI FP100” funded by Provincia autonoma di Trento, according to “Legge provinciale 13 dicembre 1999, n. 6 e ss.mm., articolo 5.–Aiuti per la promozione della ricerca e sviluppo–Provincia Autonoma di Trento”. A particular acknowledgement goes to the following companies partner of the project: CREA-IT “Consiglio per la ricerca in agricoltura e l’analisi dell’economia agraria” in Treviglio (BG) and the company Paoli F.lli S.r.l.

Conflicts of Interest

The authors declare no conflicts of interest.

References

  1. Jarén, C.; Ibarrola, A.; Mangado, T.; Adin, A.; Arnal, P.; López-Maestresalas, A.; Ríos, A.; Arazuri, S. Fatal Tractor Accidents in the Agricultural Sector in Spain during the Past Decade. Agronomy 2022, 12, 1694. [Google Scholar] [CrossRef]
  2. Bunn, T.L.; Slavova, S.; Hall, L. Narrative text analysis of Kentucky tractor fatality reports. Accid. Anal. Prev. 2008, 40, 419–425. [Google Scholar] [CrossRef] [PubMed]
  3. Rondelli, V.; Casazza, C.; Martelli, R. Tractor rollover fatalities, analyzing accident scenario. J. Saf. Res. 2018, 67, 99–106. [Google Scholar] [CrossRef] [PubMed]
  4. EC Directive 74/150/EEC (1974) on Tractors and Agricultural or Forestry Machinery: Approximation of the Laws. Available online: http://www.eur-lex.eu/ (accessed on 1 December 2023).
  5. EC Directive 2003/37/CE (2003). Available online: https://eur-lex.europa.eu/legal-content/IT/TXT/?uri=CELEX%3A32003L0037&qid=1708423163134 (accessed on 1 December 2023).
  6. EC Directive 2006/26/CE (2006). Available online: https://eur-lex.europa.eu/legal-content/IT/TXT/?uri=CELEX%3A32006L0096&qid=1708423106526 (accessed on 1 December 2023).
  7. SAE International Standard J1194; Rollover Protective Structures (ROPS) for Wheeled Agricultural Tractors. Society of Automotive Engineers Inc.: Warrendale, PA, USA, 2009.
  8. Gibson, H.G.; Elliott, K.C.; Persson, S.P.E. Side slope stability of articulated-frame logging tractors. J. Terramech. 1971, 8, 65–79. [Google Scholar] [CrossRef]
  9. Cavallo, E.; Görücü, S.; Murphy, D. Perception of side rollover hazards in a Pennsylvania rural population while operating an all-terrain vehicle (ATV). Work 2015, 51, 281–288. [Google Scholar] [CrossRef] [PubMed]
  10. Guzzomi, A.L.; Rondelli, V.; Guarnieri, A.; Molari, G.; Molari, P.G. Available energy during the rollover of narrow-track wheeled agricultural tractors. Biosyst. Eng. 2009, 104, 318–323. [Google Scholar] [CrossRef]
  11. Yang, H.; Yang, H.; Xia, C.; Han, J.; Chen, C.; Zhang, H.; Zhang, H. Analysis of Stability and Dynamic Model Simulation of Mountain Tractor Rollover. In Proceedings of the IOP Conference Series: Earth and Environmental Science, Hangzhou, China, 10–12 April 2020; Volume 512. [Google Scholar]
  12. Franceschetti, B.; Leinain, R.; Rondelli, V. Comparison between a rollover tractor dynamic model and actual lateral tests. Biosyst. Eng. 2014, 127, 79–91. [Google Scholar] [CrossRef]
  13. Liu, J.; Ayers, P. Off-road vehicle rollover and field testing of stability index. J. Agric. Saf. Health 1999, 5, 59–71. [Google Scholar] [CrossRef]
  14. Guzzomi, A.L. A revised kineto-static model for Phase I tractor rollover. Biosyst. Eng. 2012, 113, 65–75. [Google Scholar] [CrossRef]
  15. Jin, Z.; Li, J.; Huang, S. Rollover detection and prevention of a heavy-duty vehicle on banked and graded uneven road. Int. J. Veh. Des. 2022, 87, 218–248. [Google Scholar] [CrossRef]
  16. Yu, H.; Güvenç, L.; Özguner, Ü. Heavy duty vehicle rollover detection and active roll control. Int. J. Veh. Des. 2008, 46, 451–470. [Google Scholar] [CrossRef]
  17. Previati, G.; Mastinu, G.; Gobbi, M. Mathematical model for farm tractors towing single axle trailer rollover prediction. Int. J. Veh. Perform. 2022, 8, 132–146. [Google Scholar] [CrossRef]
  18. Melzi, S.; Sabbioni, E.; Vignati, M.; Cutini, M.; Brambilla, M.; Bisaglia, C.; Cavallo, E. Multibody model of fruit harvesting trucks: Comparison with experimental data and rollover analysis. J. Agric. Eng. 2018, 49, 92–99. [Google Scholar] [CrossRef]
  19. Jang, M.; Hwang, S.; Kim, J.; Nam, J. Overturning and rollover characteristics of a tractor through dynamic simulations: Effect of slope angle and obstacles on a hard surface. Biosyst. Eng. 2022, 219, 11–24. [Google Scholar] [CrossRef]
  20. Cutini, M.; Brambilla, M.; Bisaglia, C.; Melzi, S.; Vignati, M.; Cavallo, E.; Laurendi, V. A study of the lateral stability of self-propelled fruit harvesters. Agriculture 2017, 7, 92. [Google Scholar] [CrossRef]
  21. Sun, C.; Nakashima, H.; Shimizu, H.; Miyasaka, J.; Ohdoi, K. Physics engine application to overturning dynamics analysis on banks and uniform slopes for an agricultural tractor with a rollover protective structure. Biosyst. Eng. 2019, 185, 150–160. [Google Scholar] [CrossRef]
  22. Yoon, J.; Kim, D.; Yi, K. Design of a rollover index-based vehicle stability control scheme. User Model. User-Adapt. Interact. 2007, 45, 459–475. [Google Scholar] [CrossRef]
  23. Febo, P.; Pessina, D. The effect of tyre size on the non-continuous rolling test for narrow tractors. J. Agric. Eng. Res. 2001, 78, 147–152. [Google Scholar] [CrossRef]
  24. ISO 789-6:1982; Agricultural Tractors—Test Procedures—Part 6: Centre of Gravity. International Organization for Standardisation Publ.: Geneva, Switzerland, 1982.
  25. ISO 16321-1:2013; Self-Propelled Agricultural Machinery—Assessment of Stability—Part 1: Principles. International Organization for Standardisation Publ.: Geneva, Switzerland, 2013.
  26. ISO 16321-2:2015; Self-Propelled Agricultural Machinery—Assessment of Stability—Part 2: Determination of Static Stability and Test Procedures. International Organization for Standardisation Publ.: Geneva, Switzerland, 2015.
  27. Federico Cheli, G.D. Advanced Dynamics of Mechanical Systems; Springer International Publishing: Cham, Switzerland, 2015. [Google Scholar]
  28. Pacejka, H.B. Tire and Vehicle Dynamics, 3rd ed.; Butterworth-Heinemann: Oxford, UK, 2012. [Google Scholar]
  29. Braghin, F.; Cheli, F.; Genoese, A.; Sabbioni, E.; Bisaglia, C.; Cutini, M. Experimental modal analysis and numerical modelling of agricultural vehicles. In Proceedings of the IMAC-XXVII A Conference and Exposition on Structural Dynamics, Orlando, FL, USA, 9–12 February 2009; pp. 9–12. [Google Scholar]
  30. Bendat, J.S.; Piersol, A.G. Engineering Applications of Correlation and Spectral Analysis; Wiley-Interscience: Hoboken, NJ, USA, 2012. [Google Scholar]
  31. Belloni, M.; Vignati, M.; Sabbioni, E.; Cutini, M. Characterization of Vertical Dynamics of a Multi-Purpose Tractor with Static and Dynamic Experimental Tests; SAE WCX Technical Papers; SAE: Detroit, MI, USA, 2023. [Google Scholar]
Figure 1. (a) Vehicle while performing the tilt test. (b) Comfort track used for vehicle vertical dynamics characterisation.
Vehicles 06 00018 g001
Figure 2. Position of the accelerometers during the tests to characterise vehicle vertical dynamics.
Vehicles 06 00018 g002
Figure 3. MB model scheme of narrow-track agricultural vehicle for rollover simulations.
Vehicles 06 00018 g003
Figure 4. CAD drawing of the vehicle chassis.
Vehicles 06 00018 g004
Figure 5. Finite elements model of the vehicle chassis. The green lines and red dots represent the first chassis torsional mode shape at the frequency of 69.9 Hz. The black lines and black dots represent the undeformed structure.
Vehicles 06 00018 g005
Figure 6. Vertical stiffness of leaf spring suspensions. Numerical model leaf spring suspensions vertical stiffness with bump–stops effect.
Vehicles 06 00018 g006
Figure 7. MB model of the multi-purpose agricultural vehicle in Matlab/Simulink environment.
Vehicles 06 00018 g007
Figure 8. Tyre vertical contact forces during the tilt test simulation, and comparison between experimental data and numerical simulations.
Vehicles 06 00018 g008
Figure 9. Four-posts test rig experimental measurements and numerical simulations FRFs comparison. (a) Heave motion accelerations of unsprung masses; four posts in phase; unloaded vehicle. (b) Roll motion accelerations of unsprung masses; right-side posts in phase; unloaded vehicle. (c) Pitch and heave motion accelerations of sprung masses; four posts in phase; unloaded vehicle. (d) Pitch and heave motion accelerations of sprung masses; four posts in phase; loaded vehicle.
Vehicles 06 00018 g009
Figure 10. MB model of the vehicle while performing the tilt table test.
Vehicles 06 00018 g010
Figure 11. Quasi-static rollover angles: (a) First-wheel detachment, case 0; (b) First-wheel detachment, case FL; (c) First-wheel detachment, case FR; (d) Second-wheel detachment, case 0; (e) Second-wheel detachment, case FL; (f) Second-wheel detachment, case FR.
Vehicles 06 00018 g011
Figure 12. First and second wheel detachment as a function of chassis–suspensions torsional stiffness ratio. Quasi-static tilting test considering simulation case FL (a) at ψ = 330 ° and simulation case FR (b) at ψ = 210 ° .
Vehicles 06 00018 g012
Figure 13. MB model of the vehicle while tackling a pothole with the front-right wheel on a sloped road.
Vehicles 06 00018 g013
Figure 14. Normal contact forces as a function of travelled space during dynamic simulation. (a) Unloaded vehicle; (b) loaded vehicle.
Vehicles 06 00018 g014
Figure 15. Vertical displacement of suspension as a function of travelled space during dynamic simulation. (a) Unloaded vehicle; (b) loaded vehicle.
Vehicles 06 00018 g015
Figure 16. Torsional angle deformation of the vehicle chassis a function of travelled space during dynamic simulation. (a) Unloaded vehicle; (b) loaded vehicle.
Vehicles 06 00018 g016
Table 1. Characteristic dimensions of the vehicle.
DimensionValueUnit
Wheelbase2045mm
Front-wheel track1385mm
Rear-wheel track1400mm
Front-tire size225/75 R16
Rear-tire size225/75 R17.5
Overall length4060mm
Overall width1690mm
Unloaded vehicle mass2450kg
Payload2500kg
Table 2. Sensors used on the vehicle during the experimental campaign.
Sensor TypeFull ScaleSensitivityUnit
loading cells12,000±5kg
laser transducers30±0.1mm
accelerometers±250±0.00025g
Table 3. Comparison of weight distribution and the COG position between the experimental measurements and the MB model.
DimensionExperimental
Measurement
Numerical
Model
LoadedUnloadedLoadedUnloaded
lateral distance from
the longitudinal axis
(positive left) (mm)
23201920
height from the ground (mm)701754705760
Disclaimer/Publisher’s Note: The statements, opinions and data contained in all publications are solely those of the individual author(s) and contributor(s) and not of MDPI and/or the editor(s). MDPI and/or the editor(s) disclaim responsibility for any injury to people or property resulting from any ideas, methods, instructions or products referred to in the content.

