Impact of Rain Intensity on Interstate Traffic Speeds Using Connected Vehicle Data
Abstract
1. Introduction
2. Objective
- Literature review (Section 3).
- Data collection and integration of CV data with HRRR data (Section 4).
- Explanatory variables’ description and estimation (Section 5).
- Methodology for filtering technique (Section 6).
- Qualitative approach using case study along Interstate-65 (Section 7).
- Quantitative approach at aggregate and disaggregate levels (Section 8).
- Conclusions (Section 9).
3. Literature Review
3.1. Rainfall
3.2. Effects of Visibility
3.3. Data Resource and Data Analytics
4. Data Collection
4.1. Connected Vehicle (CV) Trajectory Data
4.2. High-Resolution Rapid-Refresh (HRRR) Data
4.3. Integration of CV Data and HRRR Data
4.4. Dataset
- Exclusion of any storm events with snow or ice pellets.
- Exclusion of work zone regions (recurring congestion).
- Exclusion of incident-related traffic congestion.
- Exclusion of periods where no rain condition was experienced at all.
5. Explanatory Variables
5.1. Free Flow Speed Estimation
5.2. Speed Reduction
5.3. Descriptive Statistics
5.4. Directional Wind Estimation
6. Methodology—Filtering Technique
7. Qualitative Approach—Case Study along I-65
8. Quantitative Approach
8.1. Aggregate Analysis
8.2. Disaggregate Analysis
8.3. Impact of Precipitation Intensity on Speeds
8.4. Impact of Nighttime Conditions
8.5. Impact of Wind
8.6. Impact of Temperature
8.7. Impact of Visibility
8.8. Probability of Speed Reductions
9. Conclusions
Author Contributions
Funding
Data Availability Statement
Acknowledgments
Conflicts of Interest
References
- Wei-li, W. Analysis on Driver’s Driving Workload in Different Weather Conditions. J. Beijing Univ. Technol. 2011, 37, 540. [Google Scholar]
- Kilpeläinen, M.; Summala, H. Effects of weather and weather forecasts on driver behaviour. Transp. Res. Part F Traffic Psychol. Behav. 2007, 10, 288–299. [Google Scholar] [CrossRef]
- How Do Weather Events Impact Roads? Federal Highway Administration: Washington, DC, USA, 2020.
- Kyte, M.; Khatib, Z.; Shannon, P.; Kitchener, F. Effect of Weather on Free-Flow Speed. Transp. Res. Rec. J. Transp. Res. Board 2001, 1776, 60–68. [Google Scholar] [CrossRef]
- Zhang, J.; Song, G.; Gong, D.; Gao, Y.; Yu, L.; Guo, J. Analysis of rainfall effects on road travel speed in Beijing, China. IET Intell. Transp. Syst. 2018, 12, 93–102. [Google Scholar] [CrossRef]
- Wang, P.; Zhang, Y.; Wang, S.; Li, L.; Li, X. Forecasting Travel Speed in the Rainfall Days to Develop Suitable Variable Speed Limits Control Strategy for Less Driving Risk. J. Adv. Transp. 2021, 2021, 6637584. [Google Scholar] [CrossRef]
- Akin, D.; Sisiopiku, V.; Skabardonis, A. Impacts of Weather on Traffic Flow Characteristics of Urban Freeways in Istanbul. Procedia Soc. Behav. Sci. 2011, 16, 89–99. [Google Scholar] [CrossRef]
- Rahman, A.; Lownes, N.E. Analysis of rainfall impacts on platooned vehicle spacing and speed. Transp. Res. Part F Traffic Psychol. Behav. 2012, 15, 395–403. [Google Scholar] [CrossRef]
- Zhang, W.; Li, R.; Shang, P.; Liu, H. Impact Analysis of Rainfall on Traffic Flow Characteristics in Beijing. Int. J. Intell. Transp. Syst. Res. 2019, 17, 150–160. [Google Scholar] [CrossRef]
- Ahmed, M.M.; Ghasemzadeh, A. The impacts of heavy rain on speed and headway Behaviors: An investigation using the SHRP2 naturalistic driving study data. Transp. Res. Part C Emerg. Technol. 2018, 91, 371–384. [Google Scholar] [CrossRef]
- Khan, N.; Das, A.; Ahmed, M.M. Non-Parametric Association Rules Mining and Parametric Ordinal Logistic Regression for an In-Depth Investigation of Driver Speed Selection Behavior in Adverse Weather using SHRP2 Naturalistic Driving Study Data. Transp. Res. Rec. J. Transp. Res. Board 2020, 2674, 101–119. [Google Scholar] [CrossRef]
- Rakha, H.; Arafeh, M.; Park, S. Modeling Inclement Weather Impacts on Traffic Stream Behavior. Int. J. Transp. Sci. Technol. 2012, 1, 25–47. [Google Scholar] [CrossRef]
- Smith, B.L.; Byrne, K.G.; Copperman, R.B.; Hennessy, S.M.; Goodall, N.J. An investigation into the impact of rainfall on freeway traffic flow. In Proceedings of the 83rd Annual Meeting of the Transportation Research Board, Washington, DC, USA, 11 January 2004. [Google Scholar]
- Prokhorchuk, A.; Mitrovic, N.; Muhammad, U.; Stevanovic, A.; Asif, M.T.; Dauwels, J.; Jaillet, P. Estimating the Impact of High-Fidelity Rainfall Data on Traffic Conditions and Traffic Prediction. Transp. Res. Rec. J. Transp. Res. Board 2021, 2675, 1285–1300. [Google Scholar] [CrossRef]
- Lam, W.H.K.; Tam, M.L.; Cao, X.; Li, X. Modeling the Effects of Rainfall Intensity on Traffic Speed, Flow, and Density Relationships for Urban Roads. J. Transp. Eng. 2013, 139, 758–770. [Google Scholar] [CrossRef]
- Billot, R.; el Faouzi, N.-E.; de Vuyst, F. Multilevel assessment of the impact of rain on drivers’ behavior: Standardized methodology and empirical analysis. Transp. Res. Rec. 2009, 2107, 134–142. [Google Scholar] [CrossRef]
- Qiu, L.; Nixon, W.A. Effects of Adverse Weather on Traffic Crashes. Transp. Res. Rec. J. Transp. Res. Board 2008, 2055, 139–146. [Google Scholar] [CrossRef]
- Zhang, C.-B.; Wan, P.; Mei, Z.-H.; Zhang, P.-L. Traffic flow characteristics and models of freeway under rain weather. Wuhan Ligong Daxue Xuebao J. Wuhan Univ. Technol. 2013, 35, 63–67. [Google Scholar]
- Ali, E.M.; Ahmed, M.M.; Yang, G. Normal and risky driving patterns identification in clear and rainy weather on freeway segments using vehicle kinematics trajectories and time series cluster analysis. IATSS Res. 2021, 45, 137–152. [Google Scholar] [CrossRef]
- Ghasemzadeh, A.; Hammit, B.E.; Ahmed, M.M.; Young, R.K. Parametric Ordinal Logistic Regression and Non-Parametric Decision Tree Approaches for Assessing the Impact of Weather Conditions on Driver Speed Selection Using Naturalistic Driving Data. Transp. Res. Rec. J. Transp. Res. Board 2018, 2672, 137–147. [Google Scholar] [CrossRef]
- Faria, M.V.; Baptista, P.C.; Farias, T.L.; Pereira, J.M.S. Assessing the impacts of driving environment on driving behavior patterns. Transportation 2020, 47, 1311–1337. [Google Scholar] [CrossRef]
- Zhang, X.; Chen, M. Quantifying the Impact of Weather Events on Travel Time and Reliability. J. Adv. Transp. 2019, 2019, 8203081. [Google Scholar] [CrossRef]
- Snowden, R.J.; Stimpson, N.; Ruddle, R.A. Speed perception fogs up as visibility drops. Nature 1998, 392, 450. [Google Scholar] [CrossRef] [PubMed]
- Broughton, K.L.; Switzer, F.; Scott, D. Car following decisions under three visibility conditions and two speeds tested with a driving simulator. Accid. Anal. Prev. 2007, 39, 106–116. [Google Scholar] [CrossRef] [PubMed]
- Rahman, S.; Abdel-Aty, M.; Wang, L.; Lee, J. Understanding the Highway Safety Benefits of Different Approaches of Connected Vehicles in Reduced Visibility Conditions. Transp. Res. Rec. J. Transp. Res. Board 2018, 2672, 91–101. [Google Scholar] [CrossRef]
- Das, A.; Ahmed, M.M. Exploring the effect of fog on lane-changing characteristics utilizing the SHRP2 naturalistic driving study data. J. Transp. Saf. Secur. 2021, 13, 477–502. [Google Scholar] [CrossRef]
- Das, A.; Ghasemzadeh, A.; Ahmed, M.M. Analyzing the effect of fog weather conditions on driver lane-keeping performance using the SHRP2 naturalistic driving study data. J. Saf. Res. 2019, 68, 71–80. [Google Scholar] [CrossRef]
- Das, A.; Ahmed, M.M.; Ghasemzadeh, A. Using trajectory-level SHRP2 naturalistic driving data for investigating driver lane-keeping ability in fog: An association rules mining approach. Accid. Anal. Prev. 2019, 129, 250–262. [Google Scholar] [CrossRef] [PubMed]
- Yan, X.; Li, X.; Liu, Y.; Zhao, J. Effects of foggy conditions on drivers’ speed control behaviors at different risk levels. Saf. Sci. 2014, 68, 275–287. [Google Scholar] [CrossRef]
- McCann, K.; Fontaine, M.D. Assessing Driver Speed Choice in Fog with the Use of Visibility Data from Road Weather Information Systems. Transp. Res. Rec. J. Transp. Res. Board 2016, 2551, 90–99. [Google Scholar] [CrossRef]
- Khan, N.; Ghasemzadeh, A.; Ahmed, M. Investigating the Impact of Fog on Freeway Speed Selection using the SHRP2 Naturalistic Driving Study Data. Transp. Res. Rec. J. Transp. Res. Board 2018, 2672, 93–104. [Google Scholar] [CrossRef]
- Shabarek, A.; Chien, S.; Hadri, S. Deep Learning Framework for Freeway Speed Prediction in Adverse Weather. Transp. Res. Rec. J. Transp. Res. Board 2020, 2674, 28–41. [Google Scholar] [CrossRef]
- Brooks, J.O.; Crisler, M.C.; Klein, N.; Goodenough, R.; Beeco, R.W.; Guirl, C.; Tyler, P.J.; Hilpert, A.; Miller, Y.; Grygier, J.; et al. Speed choice and driving performance in simulated foggy conditions. Accid. Anal. Prev. 2011, 43, 698–705. [Google Scholar] [CrossRef] [PubMed]
- Rakha, H.; Farzaneh, M.; Arafeh, M.; Sterzin, E. Inclement Weather Impacts on Freeway Traffic Stream Behavior. Transp. Res. Rec. J. Transp. Res. Board 2008, 2071, 8–18. [Google Scholar] [CrossRef]
- Fu, X.; Lam, W.H.; Meng, Q. Modelling impacts of adverse weather conditions on activity–travel pattern scheduling in multi-modal transit networks. Transp. B Transp. Dyn. 2014, 2, 151–167. [Google Scholar] [CrossRef]
- Agarwal, M.; Maze, T.H.; Souleyrette, R. The weather and its impact on urban freeway traffic operations. In Proceedings of the 85th Annual Meeting of the Transportation Research Board, Washington, DC, USA, 22 January 2006. [Google Scholar]
- Katz, B.; O’Donnell, C.; Donoughe, K.; Atkinson, J.E.; Finley, M.D.; Balke, K.N.; Kuhn, B.T.; Warren, D. Guidelines for the Use of Variable Speed Limit Systems in Wet Weather; Federal Highway Administration, Office of Safety: Washington, DC, USA, 2012.
- Dailey, D.J.; Washington State Transportation Commission. The Use of Weather Data to Predict Non-Recurring Traffic Congestion; Transportation Northwest Organization: Washington, DC, USA, 2006.
- Singh, H.; Kathuria, A. Analyzing driver behavior under naturalistic driving conditions: A review. Accid. Anal. Prev. 2021, 150, 105908. [Google Scholar] [CrossRef] [PubMed]
- Sakhare, R.S.; Hunter, M.; Mukai, J.; Li, H.; Bullock, D.M. Truck and Passenger Car Connected Vehicle Penetration on Indiana Roadways. J. Transp. Technol. 2022, 12, 578–599. [Google Scholar] [CrossRef]
- Sakhare, R.S.; Desai, J.; Li, H.; Kachler, M.A.; Bullock, D.M. Methodology for Monitoring Work Zones Traffic Operations Using Connected Vehicle Data. Safety 2022, 8, 41. [Google Scholar] [CrossRef]
- Sakhare, R.S.; Desai, J.C.; Mathew, J.K.; McGregor, J.D.; Bullock, D.M. Evaluation of the Impact of Presence Lighting and Digital Speed Limit Trailers on Interstate Speeds in Indiana Work Zones. J. Transp. Technol. 2021, 11, 157–167. [Google Scholar] [CrossRef]
- Sakhare, R.S.; Desai, J.C.; Mahlberg, J.; Mathew, J.K.; Kim, W.; Li, H.; McGregor, J.D.; Bullock, D.M. Evaluation of the Impact of Queue Trucks with Navigation Alerts Using Connected Vehicle Data. J. Transp. Technol. 2021, 11, 561–576. [Google Scholar] [CrossRef]
- Desai, J.; Mahlberg, J.; Kim, W.; Sakhare, R.; Li, H.; McGuffey, J.; Bullock, D.M. Leveraging Telematics for Winter Operations Performance Measures and Tactical Adjustment. J. Transp. Technol. 2021, 11, 611–627. [Google Scholar] [CrossRef]
- McNamara, M.; Sakhare, R.S.; Li, H.; Baldwin, M.; Bullock, D. Integrating crowdsourced probe vehicle traffic speeds into winter operations performance measures. In Proceedings of the Transportation Research Board 96th Annual Meeting no. 17-00161, Washington, DC, USA, 8–12 January 2017. [Google Scholar]
- USGS. Rate of Rainfall. Available online: https://water.usgs.gov/edu/activity-howmuchrain-metric.html (accessed on 14 July 2022).
- Department of Atmospheric, Oceanic, and Earth Sciences, Virginia Weather and Climate Data. Wind: U and v Components. 2014. Available online: http://colaweb.gmu.edu/dev/clim301/lectures/wind/wind-uv (accessed on 1 December 2022).
- Sakhare, R.S.; Desai, J.; Li, H.; Mathew, J.; Bullock, D. Predicting Weather Impact on Traffic Speeds Using the Multi-Radar Multi-Sensor System. In Proceedings of the 101st American Meteorological Society Annual Meeting, virtual, 1—15 January 2021; Available online: https://ams.confex.com/ams/101ANNUAL/meetingapp.cgi/Paper/382590 (accessed on 27 July 2022).




| Rain Category | Precipitation Rate (mm/h) |
|---|---|
| No rain | 0 |
| Slight rain | 0–0.5 |
| Moderate rain | 0.5–4 |
| Heavy rain | 4–8 |
| Very heavy rain | >8 |
| # | Date | Day | Interstate | Start MM | End MM | Start Time | End Time | Total Time (Hours) | Total Miles | Total Mile-Hours |
|---|---|---|---|---|---|---|---|---|---|---|
| 1 | 10 April 2021 | Saturday | I-70 | 125 | 145 | 11:00 a.m. | 8:00 p.m. | 9 | 20 | 180 |
| 2 | 10 April 2021 | Saturday | I-70 | 40 | 50 | 10:00 a.m. | 4:00 p.m. | 6 | 10 | 60 |
| 3 | 28 April 2021 | Wednesday | I-65 | 203 | 220 | 5:00 p.m. | 11:59 p.m. | 7 | 17 | 119 |
| 4 | 28 April 2021 | Wednesday | I-70 | 15 | 45 | 8:00 p.m. | 11:00 p.m. | 3 | 30 | 90 |
| 5 | 29 April 2021 | Thursday | I-65 | 203 | 220 | 12:00 a.m. | 7:00 a.m. | 7 | 17 | 119 |
| 6 | 9 May 2021 | Sunday | I-65 | 203 | 220 | 12:00 a.m. | 12:00 p.m. | 12 | 17 | 204 |
| 7 | 9 May 2021 | Sunday | I-74 | 140 | 150 | 12:00 p.m. | 3:00 p.m. | 3 | 10 | 30 |
| 8 | 9 May 2021 | Sunday | I-74 | 35 | 50 | 3:00 a.m. | 8:00 a.m. | 5 | 15 | 75 |
| 9 | 28 May 2021 | Friday | I-70 | 40 | 50 | 3:00 p.m. | 6:00 p.m. | 3 | 10 | 30 |
| 10 | 3 June 2021 | Thursday | I-70 | 52 | 58 | 7:00 a.m. | 10:00 a.m. | 3 | 6 | 18 |
| 11 | 3 June 2021 | Thursday | I-74 | 130 | 134 | 2:00 p.m. | 5:00 p.m. | 3 | 4 | 12 |
| 12 | 3 June 2021 | Thursday | I-74 | 160 | 171 | 4:00 p.m. | 8:00 p.m. | 4 | 11 | 44 |
| 13 | 19 June 2021 | Saturday | I-65 | 20 | 42 | 12:00 a.m. | 7:00 a.m. | 7 | 22 | 154 |
| 14 | 19 June 2021 | Saturday | I-70 | 15 | 45 | 12:00 a.m. | 9:00 a.m. | 9 | 30 | 270 |
| 15 | 19 June 2021 | Saturday | I-74 | 135 | 150 | 1:00 a.m. | 6:00 a.m. | 5 | 15 | 75 |
| 16 | 19 June 2021 | Saturday | I-74 | 135 | 150 | 3:00 a.m. | 8:00 a.m. | 5 | 15 | 75 |
| 17 | 19 June 2021 | Saturday | I-74 | 135 | 150 | 3:00 a.m. | 8:00 a.m. | 5 | 15 | 75 |
| 18 | 1 July 2021 | Thursday | I-65 | 115 | 122 | 1:00 a.m. | 10:00 a.m. | 9 | 7 | 63 |
| 19 | 1 July 2021 | Thursday | I-70 | 15 | 45 | 12:00 a.m. | 4:00 a.m. | 4 | 30 | 120 |
| 20 | 1 July 2021 | Thursday | I-70 | 15 | 45 | 6:00 a.m. | 11:00 a.m. | 5 | 30 | 150 |
| 21 | 1 July 2021 | Thursday | I-74 | 35 | 50 | 1:00 a.m. | 7:00 a.m. | 6 | 15 | 90 |
| 22 | 1 July 2021 | Thursday | I-74 | 20 | 33 | 1:00 a.m. | 7:00 a.m. | 6 | 13 | 78 |
| 23 | 8 July 2021 | Thursday | I-70 | 130 | 145 | 10:00 a.m. | 3:00 p.m. | 5 | 15 | 75 |
| 24 | 8 July 2021 | Thursday | I-74 | 20 | 33 | 8:00 a.m. | 12:00 p.m. | 4 | 13 | 52 |
| 25 | 11 July 2021 | Sunday | I-65 | 208 | 218 | 4:00 a.m. | 10:00 a.m. | 6 | 10 | 60 |
| 26 | 11 July 2021 | Sunday | I-70 | 130 | 145 | 12:00 a.m. | 5:00 a.m. | 5 | 15 | 75 |
| 27 | 13 July 2021 | Tuesday | I-65 | 40 | 48 | 9:00 a.m. | 12:00 p.m. | 3 | 8 | 24 |
| 28 | 13 July 2021 | Tuesday | I-74 | 128 | 132 | 1:00 p.m. | 4:00 p.m. | 3 | 4 | 12 |
| 29 | 16 July 2021 | Friday | I-65 | 75 | 85 | 3:00 p.m. | 11:00 p.m. | 8 | 10 | 80 |
| 30 | 16 July 2021 | Friday | I-70 | 125 | 145 | 1:00 a.m. | 7:00 a.m. | 6 | 20 | 120 |
| 31 | 16 July 2021 | Friday | I-70 | 125 | 136 | 5:00 p.m. | 8:00 p.m. | 3 | 11 | 33 |
| 32 | 16 July 2021 | Friday | I-74 | 150 | 165 | 7:00 p.m. | 11:59 p.m. | 5 | 15 | 75 |
| 33 | 16 July 2021 | Friday | I-74 | 150 | 165 | 12:00 p.m. | 3:00 p.m. | 3 | 15 | 45 |
| 34 | 20 September 2021 | Monday | I-65 | 75 | 90 | 4:00 a.m. | 5:00 p.m. | 13 | 15 | 195 |
| 35 | 20 September 2021 | Monday | I-70 | 40 | 50 | 3:00 a.m. | 7:00 a.m. | 4 | 10 | 40 |
| 36 | 20 September 2021 | Monday | I-74 | 35 | 50 | 12:00 a.m. | 3:00 a.m. | 3 | 15 | 45 |
| 37 | 21 September 2021 | Tuesday | I-65 | 75 | 90 | 8:00 p.m. | 11:59 p.m. | 4 | 15 | 60 |
| 38 | 22 September 2021 | Wednesday | I-70 | 125 | 135 | 2:00 a.m. | 12:00 p.m. | 10 | 10 | 100 |
| 39 | 22 September 2021 | Wednesday | I-70 | 125 | 135 | 1:00 p.m. | 11:59 p.m. | 11 | 10 | 110 |
| 40 | 22 September 2021 | Wednesday | I-74 | 35 | 50 | 2:00 a.m. | 8:00 p.m. | 18 | 15 | 270 |
| 41 | 2 October 2021 | Saturday | I-65 | 237 | 247 | 7:00 p.m. | 11:59 p.m. | 5 | 10 | 50 |
| 42 | 3 October 2021 | Sunday | I-65 | 254 | 258 | 3:00 p.m. | 7:00 p.m. | 4 | 4 | 16 |
| 43 | 3 October 2021 | Sunday | I-70 | 125 | 135 | 6:00 p.m. | 9:00 p.m. | 3 | 10 | 30 |
| 44 | 3 October 2021 | Sunday | I-74 | 20 | 33 | 2:00 p.m. | 6:00 p.m. | 4 | 13 | 52 |
| 45 | 7 October 2021 | Thursday | I-65 | 254 | 258 | 5:00 a.m. | 9:00 a.m. | 4 | 4 | 16 |
| 46 | 7 October 2021 | Thursday | I-74 | 60 | 66 | 2:00 a.m. | 5:00 a.m. | 3 | 6 | 18 |
| 47 | 11 October 2021 | Monday | I-65 | 254 | 258 | 4:00 p.m. | 11:00 p.m. | 7 | 4 | 28 |
| 48 | 11 October 2021 | Friday | I-74 | 20 | 33 | 12:00 a.m. | 8:00 a.m. | 8 | 13 | 104 |
| 49 | 15 October 2021 | Friday | I-65 | 40 | 48 | 9:00 p.m. | 11:00 p.m. | 2 | 8 | 16 |
| 50 | 15 October 2021 | Friday | I-70 | 40 | 50 | 12:00 a.m. | 6:00 a.m. | 6 | 10 | 60 |
| 51 | 15 October 2021 | Friday | I-70 | 40 | 50 | 8:00 p.m. | 11:59 p.m. | 4 | 10 | 40 |
| 52 | 24 October 2021 | Sunday | I-65 | 203 | 220 | 6:00 p.m. | 11:59 p.m. | 6 | 17 | 102 |
| 53 | 24 October 2021 | Sunday | I-70 | 40 | 50 | 6:00 a.m. | 5:00 p.m. | 11 | 10 | 110 |
| 54 | 24 October 2021 | Sunday | I-70 | 125 | 135 | 12:00 p.m. | 5:00 p.m. | 5 | 10 | 50 |
| 55 | 25 October 2021 | Monday | I-65 | 203 | 220 | 12:00 a.m. | 7:00 a.m. | 7 | 17 | 119 |
| 56 | 25 October 2021 | Monday | I-70 | 125 | 135 | 3:00 a.m. | 8:00 a.m. | 5 | 10 | 50 |
| 57 | 25 October 2021 | Monday | I-74 | 20 | 33 | 12:00 a.m. | 5:00 a.m. | 5 | 13 | 65 |
| 58 | 25 October 2021 | Monday | I-74 | 35 | 50 | 12:00 a.m. | 5:00 a.m. | 5 | 15 | 75 |
| 59 | 6 March 2022 | Sunday | I-65 | 185 | 200 | 1:00 a.m. | 4:00 a.m. | 3 | 15 | 45 |
| 60 | 7 March 2022 | Monday | I-65 | 190 | 210 | 11:00 p.m. | 5:00 a.m. | 6 | 20 | 120 |
| 61 | 7 March 2022 | Monday | I-65 | 215 | 240 | 11:00 p.m. | 5:00 a.m. | 6 | 25 | 150 |
| 62 | 11 March 2022 | Friday | I-65 | 215 | 240 | 10:00 p.m. | 10:00 a.m. | 12 | 25 | 300 |
| 63 | 18 March 2022 | Friday | I-65 | 190 | 210 | 12:00 p.m. | 6:00 p.m. | 6 | 20 | 120 |
| 64 | 30 March 2022 | Wednesday | I-65 | 215 | 240 | 6:00 p.m. | 11:59 p.m. | 6 | 25 | 150 |
| 65 | 13 April 2022 | Wednesday | I-70 | 130 | 145 | 1:00 p.m. | 11:59 p.m. | 11 | 15 | 165 |
| 66 | 13 April 2022 | Wednesday | I-70 | 97 | 105 | 2:00 p.m. | 11:00 p.m. | 9 | 8 | 72 |
| 67 | 18 April 2022 | Monday | I-65 | 215 | 230 | 2:00 a.m. | 9:00 a.m. | 7 | 15 | 105 |
| 68 | 18 April 2022 | Monday | I-70 | 120 | 130 | 4:00 a.m. | 10:00 a.m. | 6 | 10 | 60 |
| 69 | 18 April 2022 | Monday | I-74 | 20 | 33 | 2:00 a.m. | 8:00 a.m. | 6 | 13 | 78 |
| 70 | 18 April 2022 | Monday | I-74 | 41 | 65 | 2:00 a.m. | 8:00 a.m. | 6 | 24 | 144 |
| 71 | 21 April 2022 | Thursday | I-74 | 20 | 33 | 12:00 a.m. | 8:00 a.m. | 8 | 13 | 104 |
| 72 | 24 April 2022 | Sunday | I-65 | 190 | 210 | 4:00 p.m. | 11:00 p.m. | 7 | 20 | 140 |
| 73 | 25 April 2022 | Monday | I-70 | 70 | 80 | 12:00 a.m. | 11:00 a.m. | 11 | 10 | 110 |
| 74 | 25 April 2022 | Monday | I-74 | 41 | 73 | 12:00 a.m. | 12:00 p.m. | 12 | 32 | 384 |
| 75 | 1 May 2022 | Sunday | I-70 | 110 | 120 | 12:00 a.m. | 6:00 a.m. | 6 | 10 | 60 |
| 76 | 6 May 2022 | Friday | I-65 | 151 | 160 | 1:00 p.m. | 7:00 p.m. | 6 | 9 | 54 |
| 77 | 14 May 2022 | Saturday | I-65 | 180 | 190 | 1:00 p.m. | 5:00 p.m. | 4 | 10 | 40 |
| 78 | 14 May 2022 | Saturday | I-70 | 55 | 70 | 2:00 p.m. | 6:00 p.m. | 4 | 15 | 60 |
| 79 | 14 May 2022 | Saturday | I-70 | 32 | 50 | 4:00 p.m. | 8:00 p.m. | 4 | 18 | 72 |
| 80 | 20 May 2022 | Friday | I-65 | 75 | 105 | 12:00 a.m. | 5:00 a.m. | 5 | 30 | 150 |
| 81 | 20 May 2022 | Friday | I-70 | 70 | 80 | 12:00 a.m. | 6:00 a.m. | 6 | 10 | 60 |
| 82 | 20 May 2022 | Friday | I-74 | 60 | 72 | 12:00 a.m. | 4:00 a.m. | 4 | 12 | 48 |
| 83 | 26 May 2022 | Thursday | I-65 | 182 | 200 | 8:00 p.m. | 11:59 p.m. | 4 | 18 | 72 |
| 84 | 26 May 2022 | Thursday | I-65 | 205 | 210 | 8:00 p.m. | 11:59 p.m. | 4 | 5 | 20 |
| 85 | 26 May 2022 | Thursday | I-65 | 215 | 230 | 8:00 p.m. | 11:59 p.m. | 4 | 15 | 60 |
| 86 | 26 May 2022 | Thursday | I-70 | 40 | 50 | 8:00 a.m. | 2:00 p.m. | 6 | 10 | 60 |
| 87 | 26 May 2022 | Thursday | I-74 | 20 | 30 | 9:00 a.m. | 10:00 p.m. | 13 | 10 | 130 |
| 88 | 1 June 2022 | Wednesday | I-65 | 12 | 26 | 8:00 p.m. | 11:59 p.m. | 4 | 14 | 56 |
| 89 | 1 June 2022 | Wednesday | I-70 | 138 | 153 | 7:00 p.m. | 11:59 p.m. | 5 | 15 | 75 |
| 90 | 1 June 2022 | Wednesday | I-74 | 125 | 150 | 7:00 p.m. | 11:00 p.m. | 4 | 25 | 100 |
| 91 | 6 June 2022 | Monday | I-65 | 220 | 240 | 8:00 p.m. | 11:59 p.m. | 4 | 20 | 80 |
| 92 | 6 June 2022 | Monday | I-70 | 110 | 125 | 8:00 p.m. | 11:59 p.m. | 4 | 22 | 88 |
| 93 | 6 June 2022 | Monday | I-74 | 60 | 70 | 5:00 p.m. | 11:59 p.m. | 7 | 10 | 70 |
| 94 | 7 June 2022 | Tuesday | I-65 | 213 | 235 | 12:00 a.m. | 4:00 a.m. | 4 | 22 | 88 |
| 95 | 8 June 2022 | Wednesday | I-65 | 213 | 240 | 1:00 p.m. | 5:00 p.m. | 4 | 27 | 108 |
| Total | 562 | 1386 | 8397 | |||||||
| Description | Percent of Trip Records |
|---|---|
| Indicator variable for nighttime (from 8 p.m. to 6 a.m.) | 22.86% |
| Rain category: No rain | 44.8% |
| Rain category: Slight rain | 11.3% |
| Rain category: Moderate rain | 34.5% |
| Rain category: Heavy rain | 5.7% |
| Rain category: Very heavy rain | 3.7% |
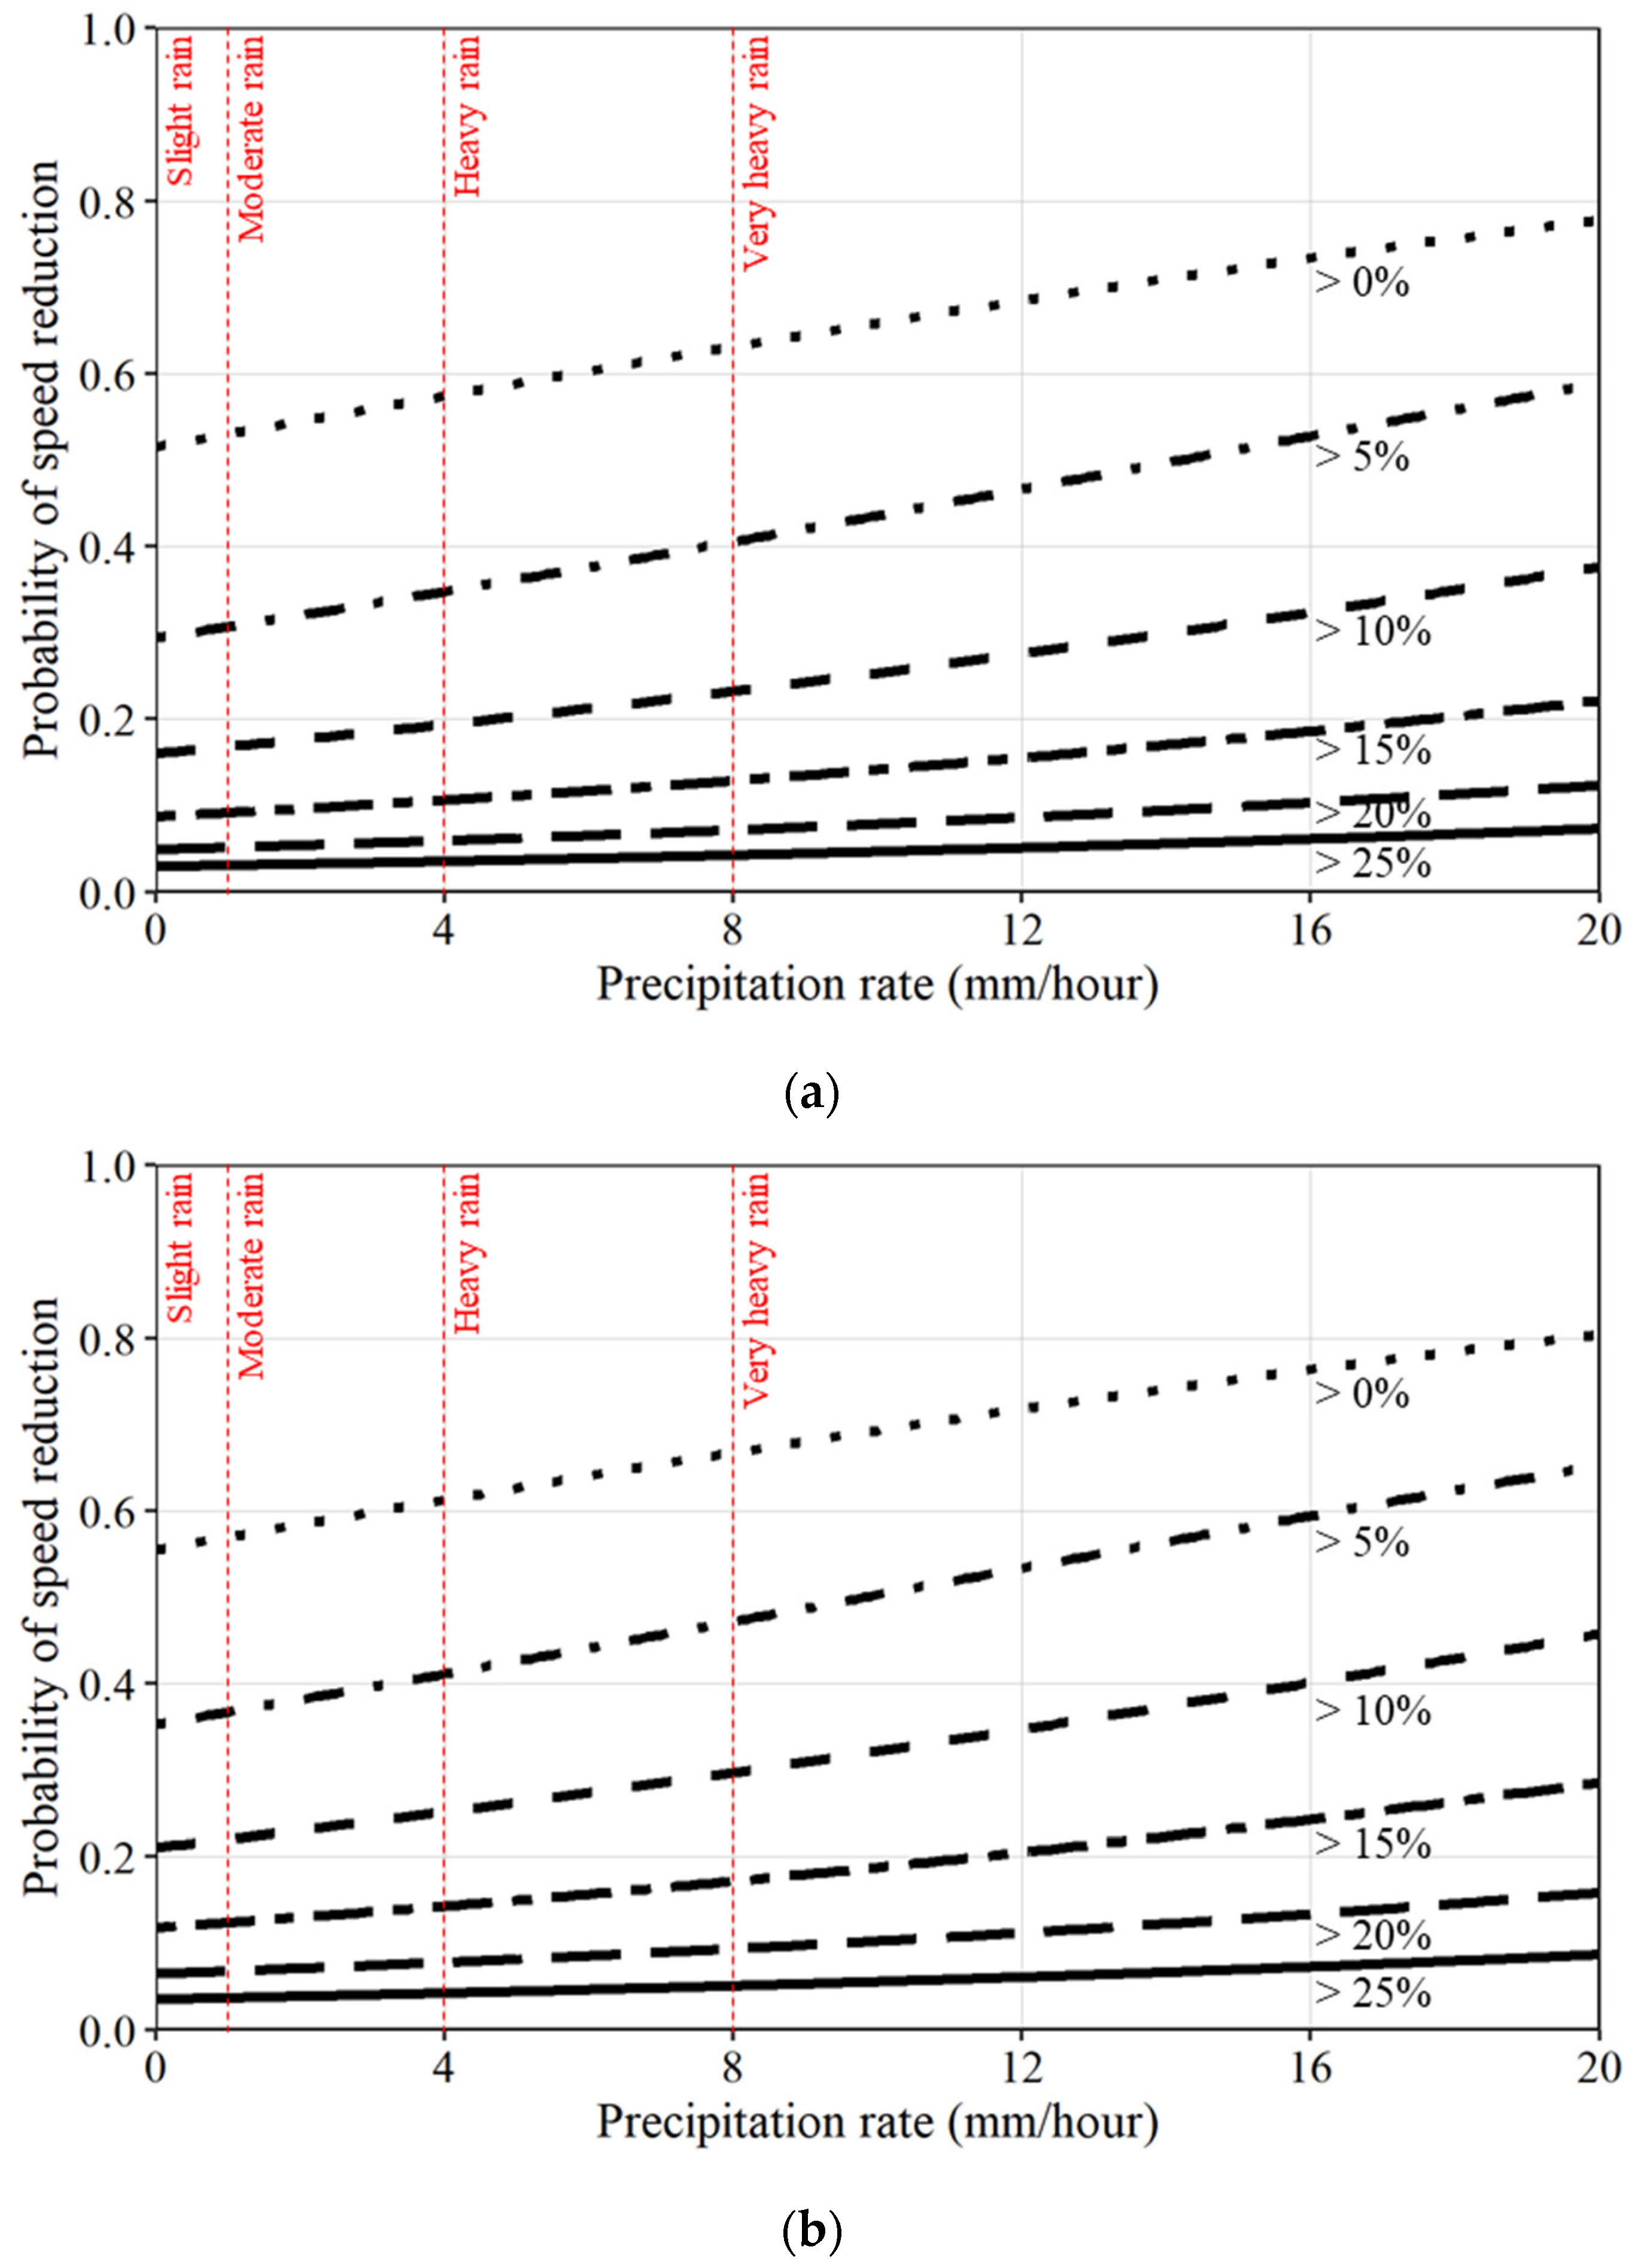
| Indicator speed reduction percent greater than 0% | 54.57% |
| Indicator speed reduction percent greater than 5% | 32.87% |
| Indicator speed reduction percent greater than 10% | 18.64% |
| Indicator speed reduction percent greater than 15% | 10.32% |
| Indicator speed reduction percent greater than 20% | 5.75% |
| Indicator speed reduction percent greater than 25% | 3.35% |
| Precipitation Rate Category | Precipitation Rate (mm/hour) | Number of Trip Records | Mean Speed (mph) | 25th Percentile Speed (mph) | Median Speed (mph) | 75th Percentile Speed (mph) | Interquartile Range | Percent Decrease in Average Speed |
|---|---|---|---|---|---|---|---|---|
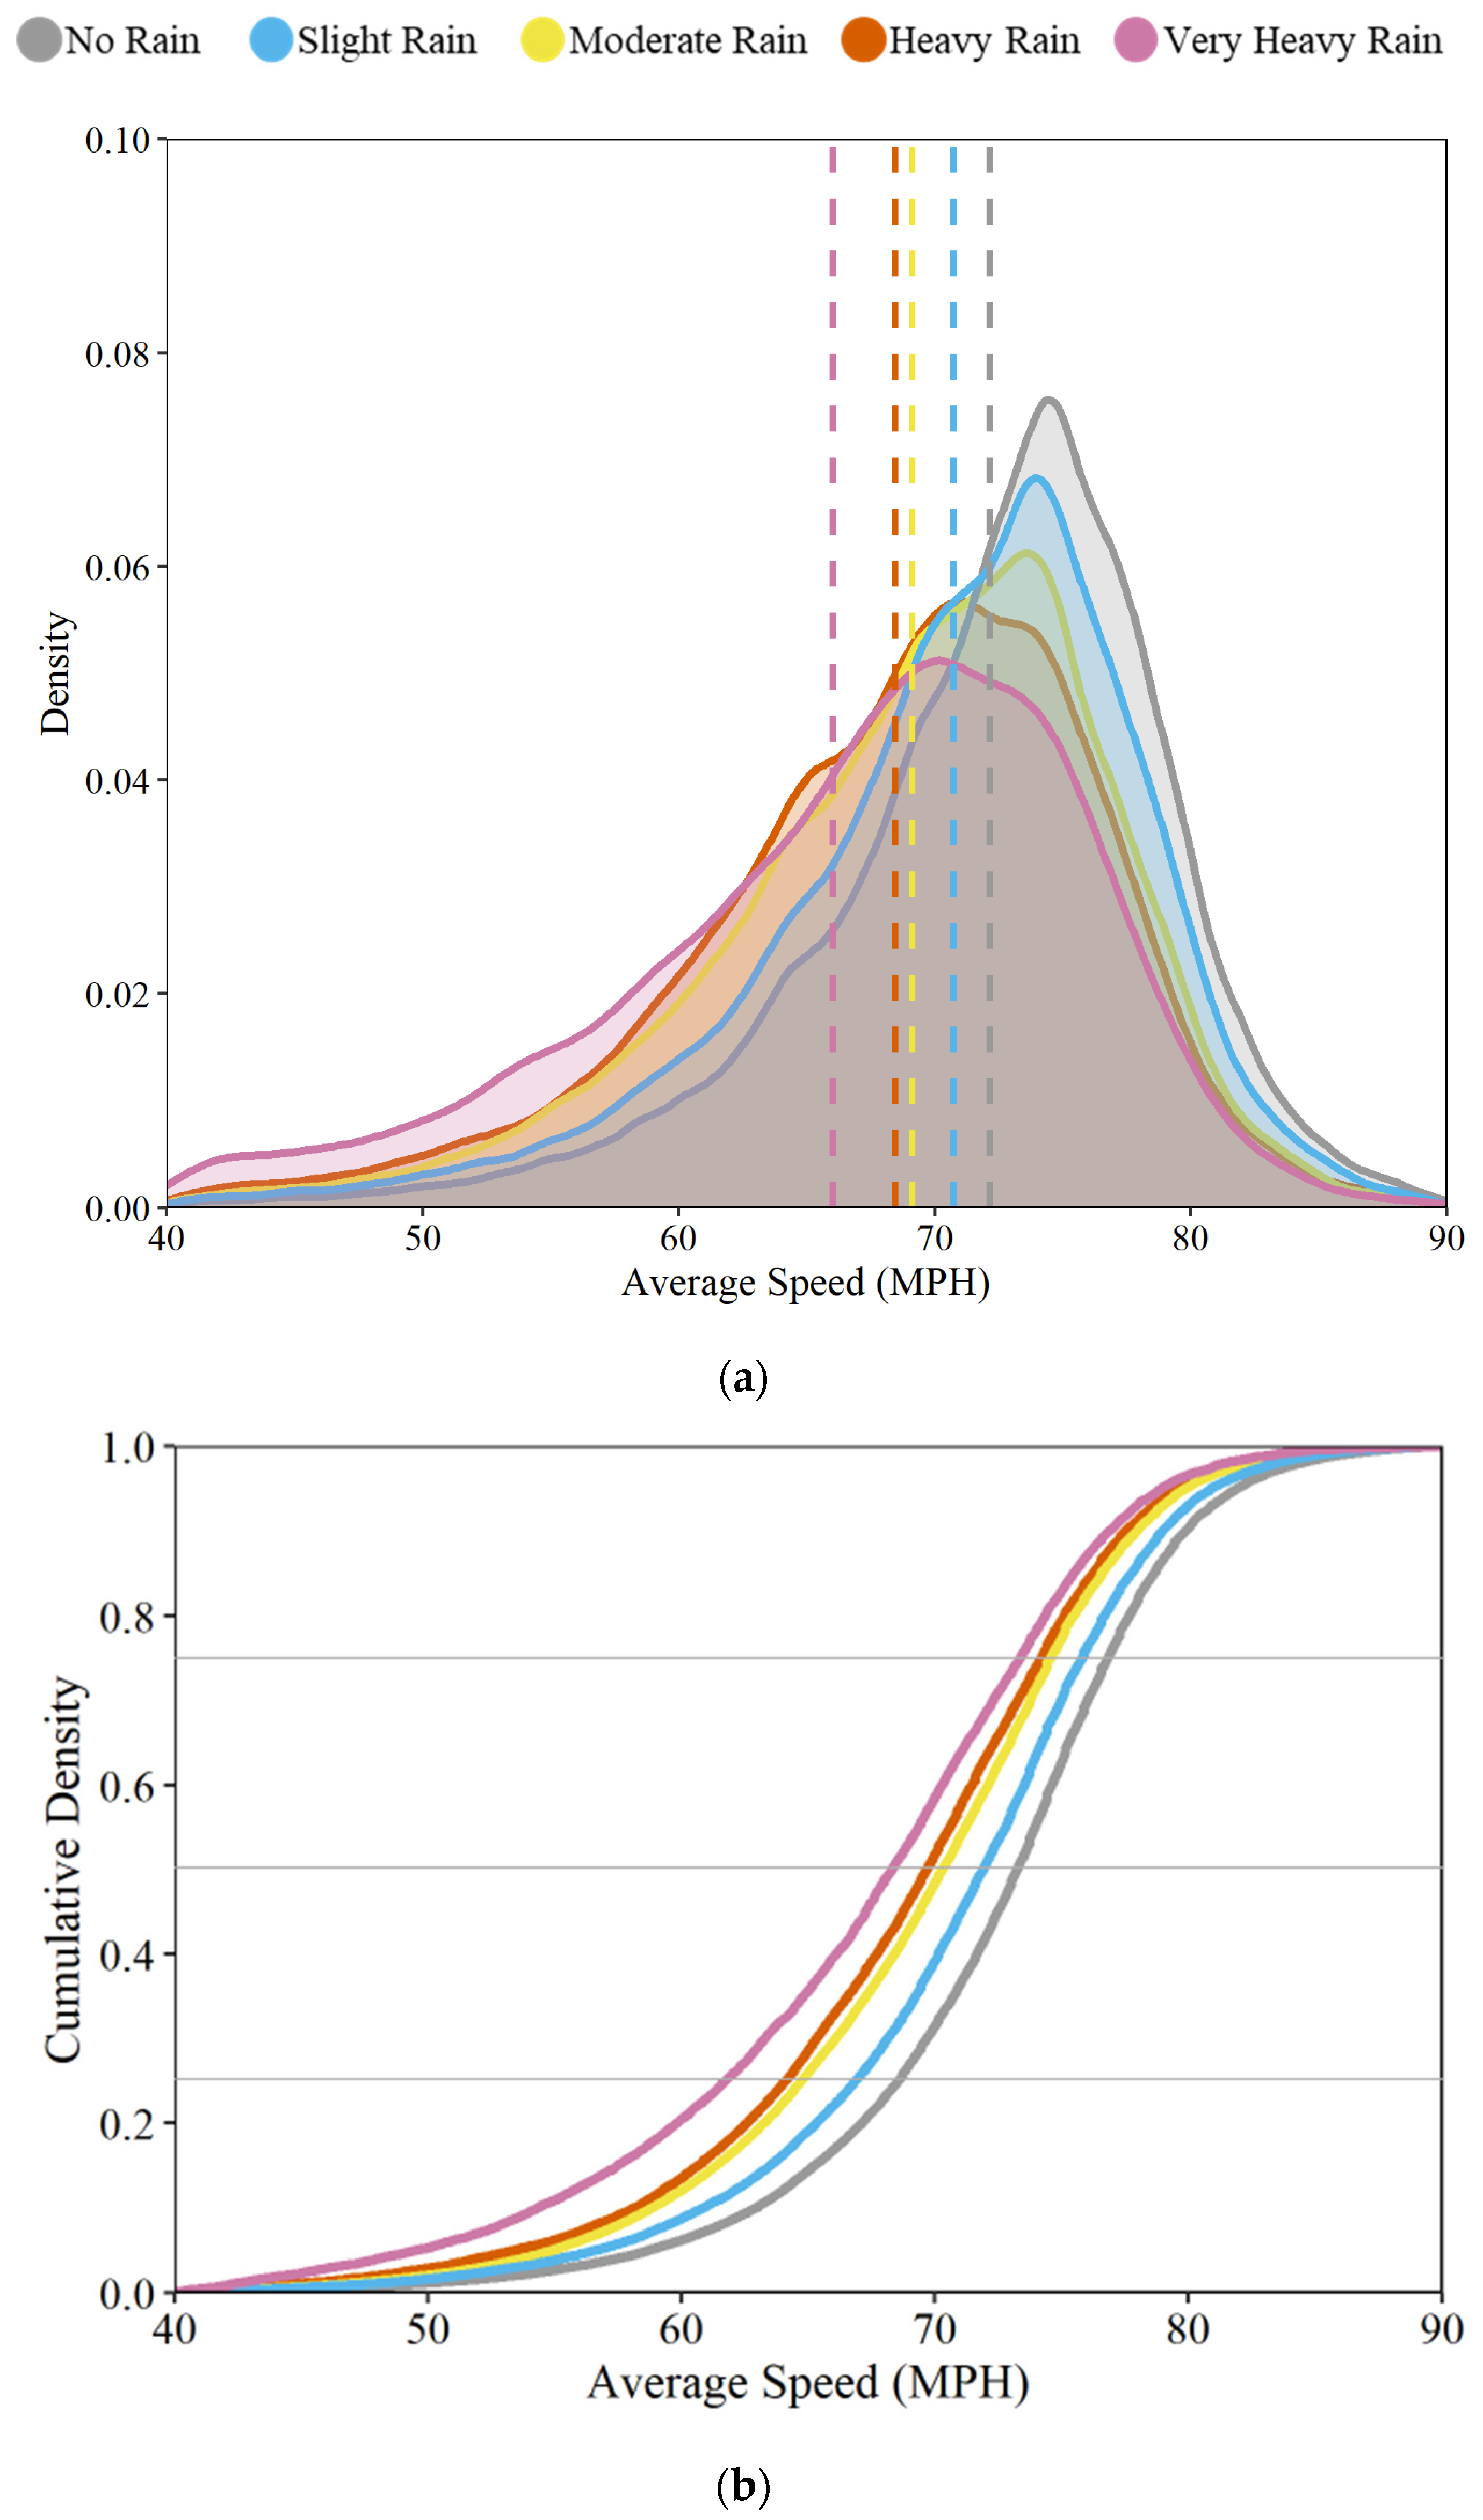
| No rain | 0 | 123,450 | 72.05 | 68.48 | 73.21 | 76.82 | 8.34 | - |
| Slight rain | 0–0.5 | 35,243 | 70.66 | 66.77 | 71.86 | 75.79 | 9.02 | 1.93% |
| Moderate rain | 0.5–4 | 107,762 | 69.03 | 64.58 | 70.21 | 74.52 | 9.94 | 4.19% |
| Heavy rain | 4–8 | 20,160 | 68.42 | 63.97 | 69.61 | 74.15 | 10.18 | 5.04% |
| Very heavy rain | >8 | 10,689 | 66.00 | 60.94 | 68.00 | 73.21 | 12.27 | 8.40% |
| Variable | Estimated Coefficients, Significance Level (z-Statistics) | |||||
|---|---|---|---|---|---|---|
| Model 1: Speed Reduction >0% | Model 2: Speed Reduction >5% | Model 3: Speed Reduction >10% | Model 4: Speed Reduction >15% | Model 5: Speed Reduction >20% | Model 6: Speed Reduction >25% | |
| Intercept | −0.383 *** (−12.19) | −1.651 *** (−48.29) | −3.021 *** (−70.20) | −4.44 *** (−76.91) | −6.023 *** (−75.58) | −7.482 *** (−69.42) |
| Precipitation rate in mm/hour | 0.0531 *** (37.26) | 0.0565 *** (44.75) | 0.0528 *** (43.66) | 0.0515 *** (41.38) | 0.0492 *** (36.47) | 0.0486 *** (31.93) |
| Temperature in °F | 0.008 *** (16.14) | 0.0136 *** (25.40) | 0.0236 *** (35.36) | 0.0354 *** (39.85) | 0.0509 *** (42.10) | 0.0657 *** (40.56) |
| Headwind in m/s | 0.0273 *** (10.82) | 0.0106 *** (3.98) | −0.0647 * (−2.01) | −0.0296 *** (−7.02) | −0.0661 *** (−11.53) | −0.106 *** (−13.64) |
| Tailwind in m/s | −0.0113 *** (−4.52) | −0.0261 *** (−9.64) | −0.0403 *** (−12.04) | −0.0529 *** (−12.12) | −0.0713 *** (−12.31) | −0.0881 *** (−11.60) |
| Cross wind blowing right in m/s | −0.001 − (−0.60) | −0.00598 ** (−3.02) | −0.0102 *** (−4.17) | −0.0178 *** (−5.53) | −0.0134 ** (−3.14) | −0.0131 * (−2.33) |
| Nighttime indicator | 0.351 *** (15.82) | 0.526 *** (23.53) | 0.609 *** (23.90) | 0.651 *** (20.80) | 0.556 *** (13.81) | 0.412 *** (7.84) |
| Visibility during daytime in 1000 m | −0.0217 *** (−14.29) | −0.0268 *** (−17.31) | −0.0308 *** (−17.40) | −0.0348 *** (−15.99) | −0.0337 *** (−12.12) | −0.033 *** (−8.99) |
| Visibility during nighttime in 1000 | −0.0062 *** (−10.25) | −0.006 *** (−9.24) | −0.00836 *** (−10.67) | −0.00928 *** (−9.39) | −0.0126 *** (−9.98) | −0.015 *** (−9.56) |
| Number of observations | 275,244 | 275,244 | 275,244 | 275,244 | 275,244 | 275,244 |
| Restricted log likelihood | −189753 | −174421 | −132480 | −91461 | −60633 | −40413 |
| Log likelihood at convergence | −188071 | −171936 | −129872 | −89107 | −58670 | −38808 |
| Percent correct prediction | 54.96% | 67.09% | 81.23% | 89.59% | 94.22% | 96.63% |
Disclaimer/Publisher’s Note: The statements, opinions and data contained in all publications are solely those of the individual author(s) and contributor(s) and not of MDPI and/or the editor(s). MDPI and/or the editor(s) disclaim responsibility for any injury to people or property resulting from any ideas, methods, instructions or products referred to in the content. |
© 2023 by the authors. Licensee MDPI, Basel, Switzerland. This article is an open access article distributed under the terms and conditions of the Creative Commons Attribution (CC BY) license (https://creativecommons.org/licenses/by/4.0/).
Share and Cite
Sakhare, R.S.; Zhang, Y.; Li, H.; Bullock, D.M. Impact of Rain Intensity on Interstate Traffic Speeds Using Connected Vehicle Data. Vehicles 2023, 5, 133-155. https://doi.org/10.3390/vehicles5010009
Sakhare RS, Zhang Y, Li H, Bullock DM. Impact of Rain Intensity on Interstate Traffic Speeds Using Connected Vehicle Data. Vehicles. 2023; 5(1):133-155. https://doi.org/10.3390/vehicles5010009
Chicago/Turabian StyleSakhare, Rahul Suryakant, Yunchang Zhang, Howell Li, and Darcy M. Bullock. 2023. "Impact of Rain Intensity on Interstate Traffic Speeds Using Connected Vehicle Data" Vehicles 5, no. 1: 133-155. https://doi.org/10.3390/vehicles5010009
APA StyleSakhare, R. S., Zhang, Y., Li, H., & Bullock, D. M. (2023). Impact of Rain Intensity on Interstate Traffic Speeds Using Connected Vehicle Data. Vehicles, 5(1), 133-155. https://doi.org/10.3390/vehicles5010009


