1. Introduction
The automotive industry is currently in a major transition process focusing on e-mobility and the ongoing digitalization of the development process. According to recent research, the percentage of electric cars in new vehicle registrations in the EU will increase to 67% in the next 15 years [
1]. This causes serious challenges for the automotive OEMs (original equipment manufacturers) regarding the choice of the concept, as electric powertrains allow very high flexibility in terms of the topology. In this research work, a holistic way was explored to realize a meaningful analysis-synthesis cycle that takes into account current developments in design, simulation and optimization methods.
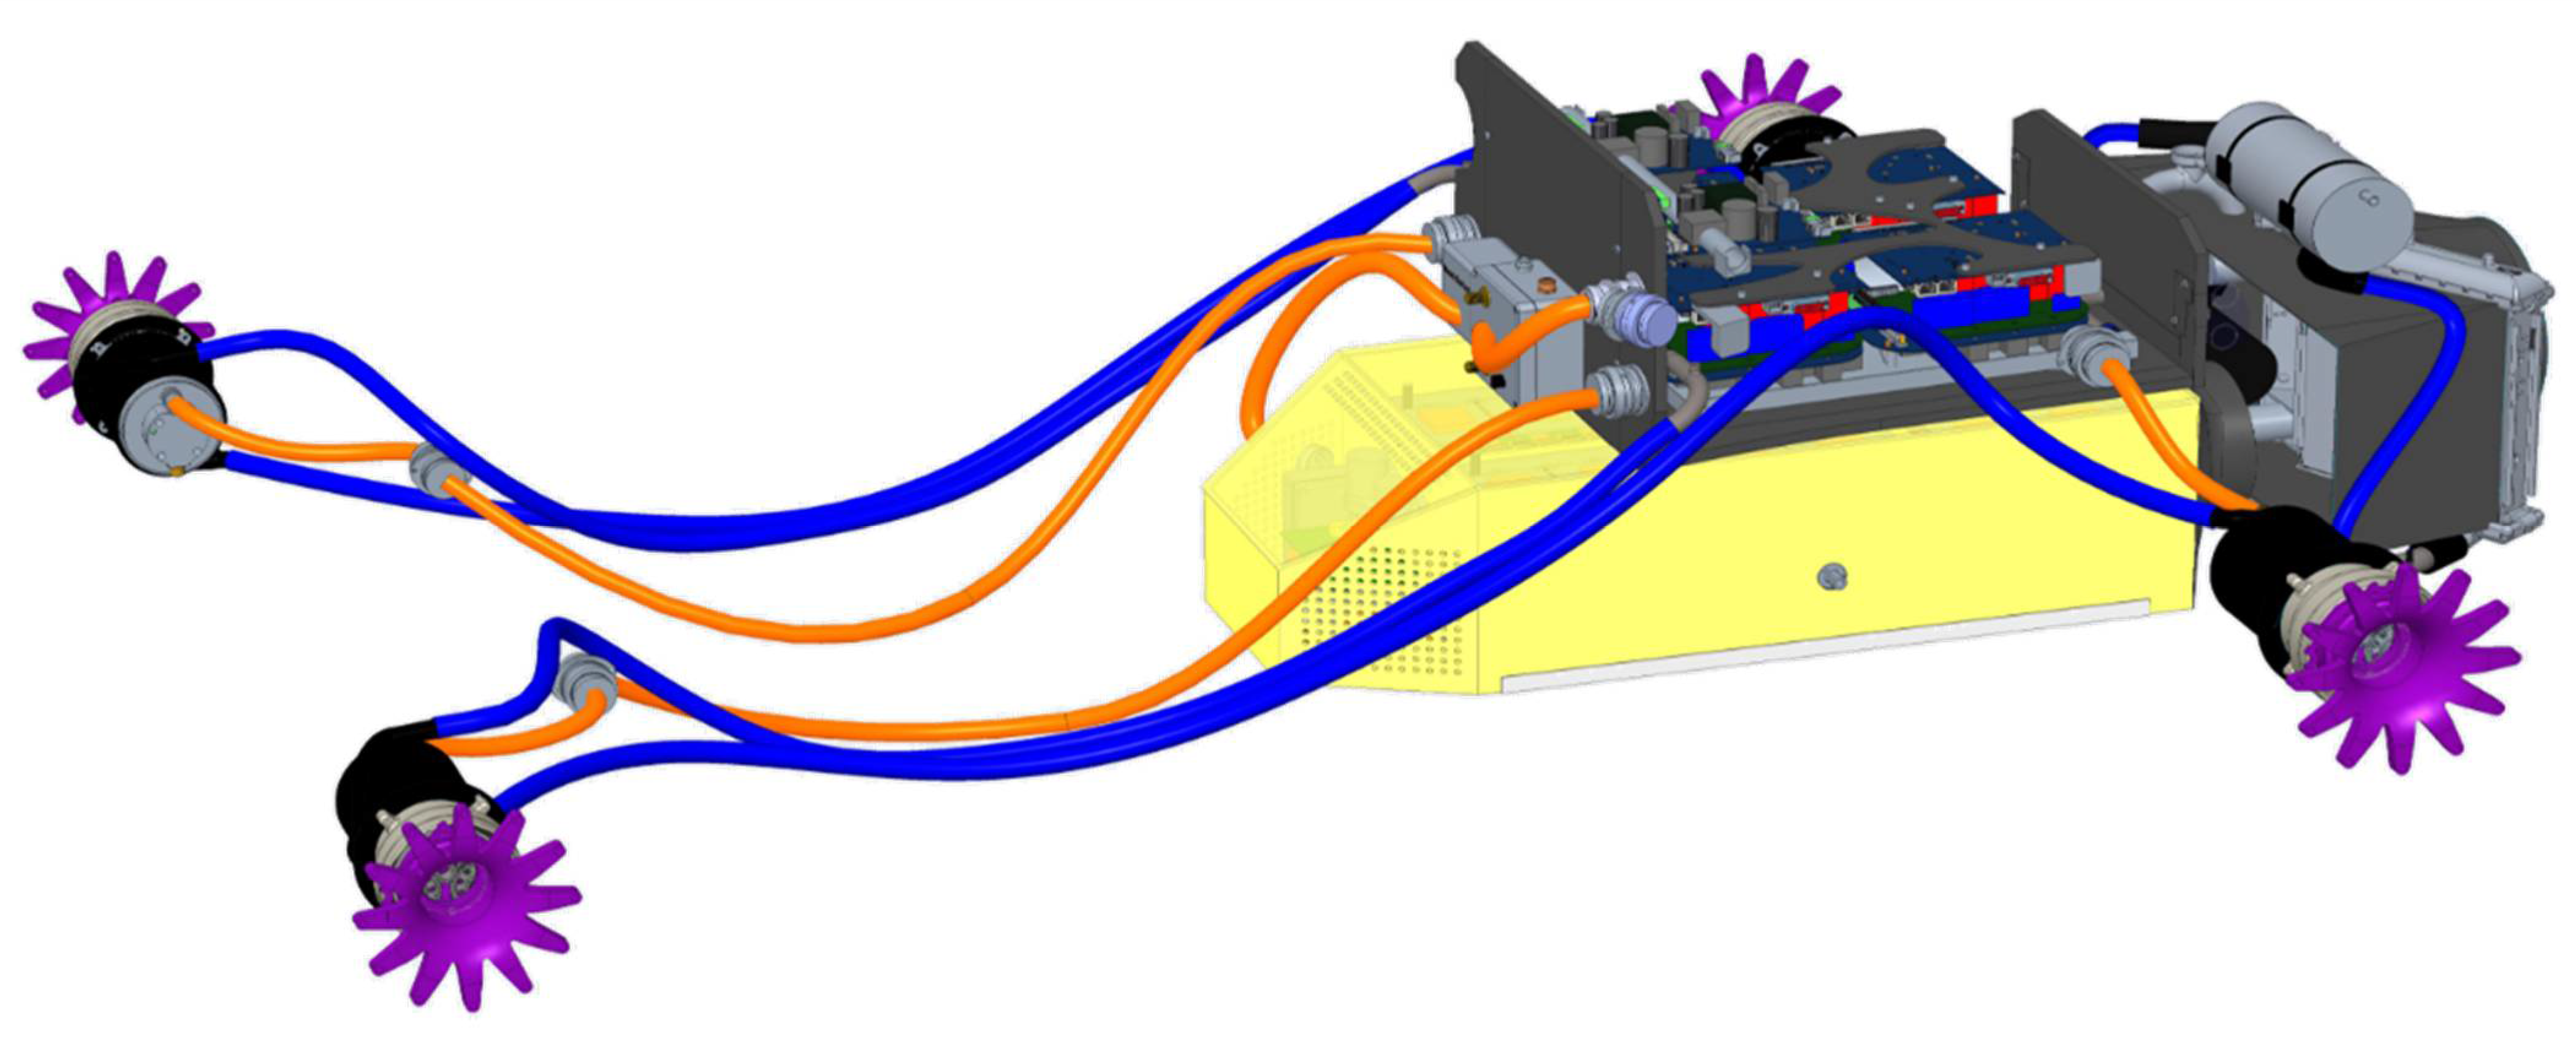
To investigate this research question, a high-performance drive-train for a Formula Student race car was developed. The drive-train is intended to be used in the electric racing car of the Formula Student Team Weingarten. The team has developed previously internal combustion vehicles and will participate in the upcoming season with an electric racing car for the first time. At the beginning of the development, no vehicle data or previous experience with an electric race car were available. For this reason, this project is a good example to describe the complete development process starting from the requirements and ending with the system validation. The resulting drive-train of the Formula Student vehicle is shown in the following (
Figure 1). The figure shows the wheel assemblies consisting of wheel hubs, planetary gearboxes, electric motors and cooling jackets. In the middle of the picture is the accumulator (colored yellow) with its housing. Above the accumulator are the inverters with cooling plates and in the rear the two air-water heat exchangers with the fans and expansion reservoirs are located.
In order to demonstrate the underlying product development process, the article is organized as follows. The general processes are explained in
Section 2.
Section 3 emphasizes the conception of the drive-train under development,
Section 4 the synthesis of the simulation of this drive-train and
Section 5 an expansion of this simulation. The focus of
Section 6 is the validation of this simulation and of
Section 7 the resulting optimization of the concept of the drive train.
Section 8 describes the integration of different types of virtual, real-time prototype testing. Finally, conclusions are drawn and an outlook is given in
Section 9.
2. Design, Simulation and Optimization Processes
For the development of the electrical drive-train, a continuous design process starting with an intensive analysis of the requirements was carried out. This strong emphasis on requirements is present in all current model-based systems engineering (MBSE) approaches. In September 2020, the well-known guideline VDI/VDE 2206 was republished as a draft under the new name “Development of cyber-physical mechatronic systems (CPMS)” [
2]. This guideline basically offers the user support for all tasks in the development of cyber-physical mechatronic systems by presenting the main logical relationships. The core content of the guideline is an inherent flow logic for the development of mechatronic and cyber-physical systems; this is represented as an updated and extended V-model [
3]. The central objective of the revision of the guideline is to adapt to greatly changed industrial environments; these changes result from the general trend towards cyber-physical systems, the increasing use of artificial intelligence and the analysis of large amounts of data, as well as further improved computer-aided synthesis and analysis methods. Current research in this topic area includes automated parameter selection [
4], domain-specific modeling approaches [
5], and the study of requirements change risk [
6].
The research project continues to draw on the fundamentals of Model-Based System Engineering (MBSE) [
7,
8]. International research groups are currently working on the integration of verification processes into MBSE [
9], tracking and communicating risks through MBSE tools [
10], role models for the application of MBSE [
11], and modular product architectures based on MBSE [
12]. Currently, graph-based design methods (compare [
13] are developed as a prominent means for realizing MBSE through knowledge representation in UML and compilation by means of a design compiler (DC43, IILS GmbH, Trochtelfingen, Germany [
14]) leading to a machine-executable V-model. The approach includes representations of requirements [
15], functions [
16] and abstract physics [
17] and was demonstrated on multiple examples such as the design of a balanced two-wheel scooter [
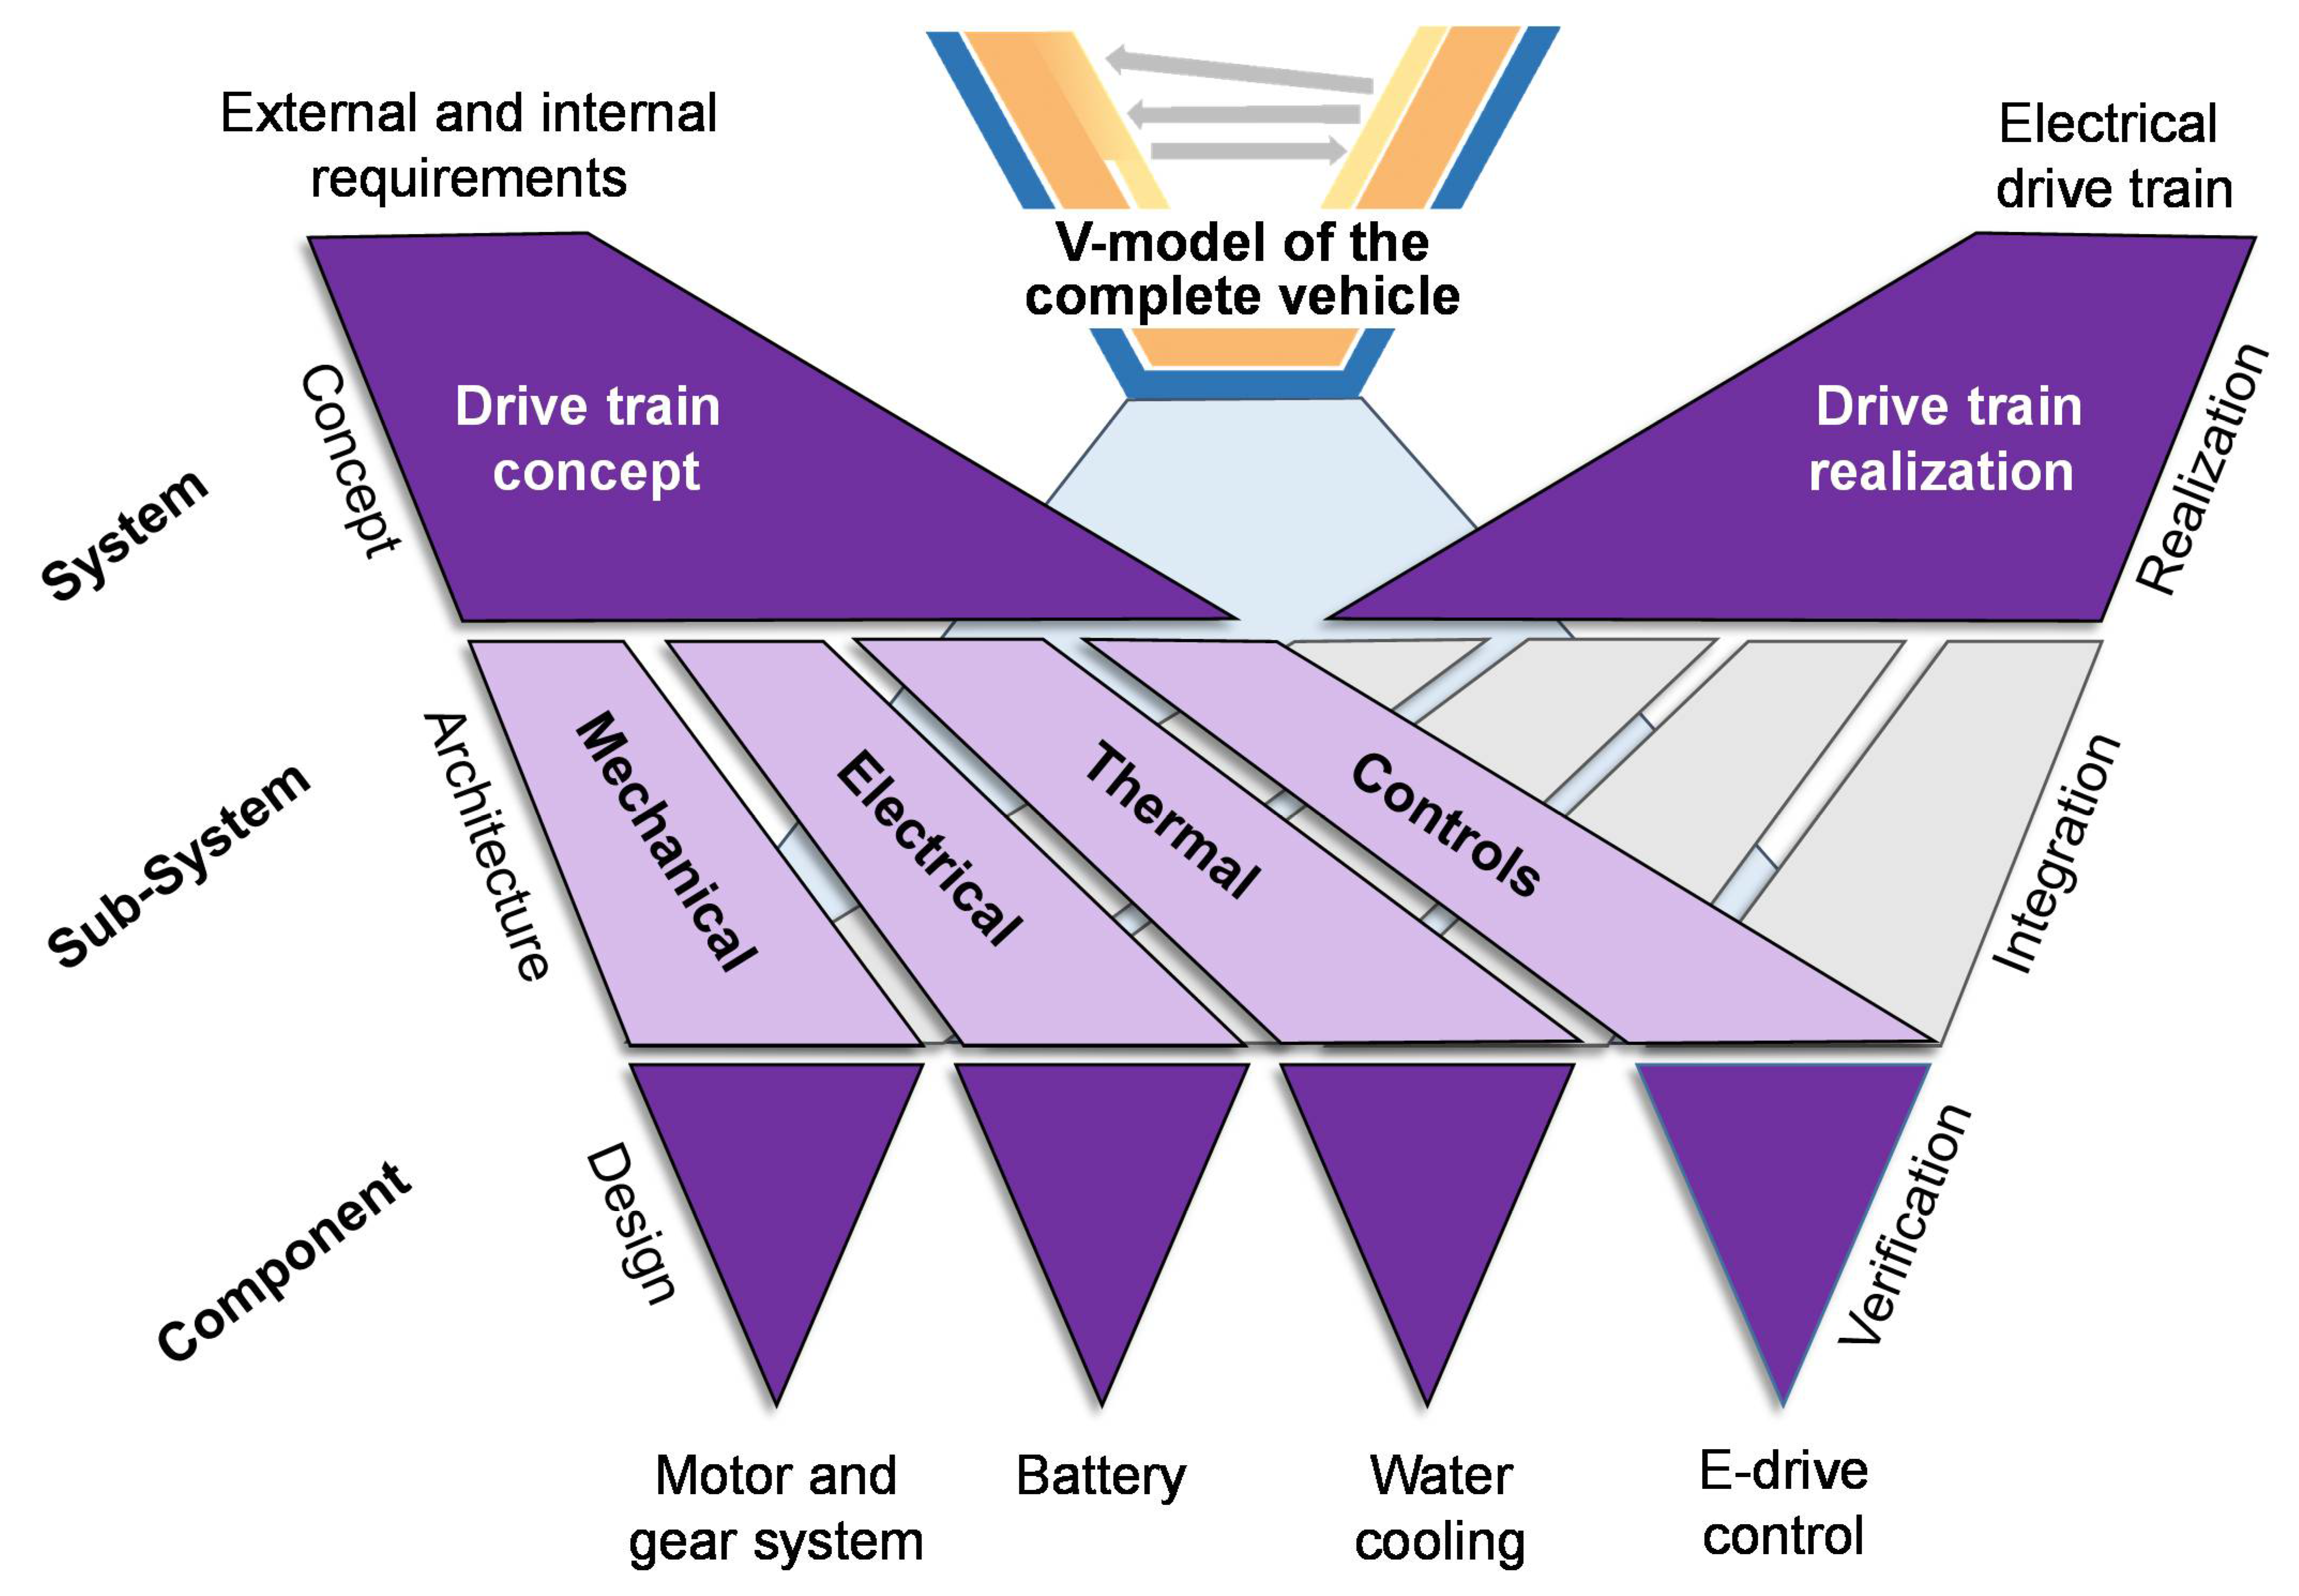
18]. In the given case, the general procedure can be described applying a V-model which is included in the main V-model representing the development of the whole vehicle (
Figure 2).
The shown process addresses central challenges in the development of high-performance electrical drive trains which result from the multitude of possible topological choices and numerous mutually interconnected physical phenomena. In common industrial practice, several tools for simulation and topology optimization are applied. This requires the transfer of multiple versions of the product models; frequently many process steps have to be carried out manually. The shown processes offer a holistic possibility to realize a sensible analysis-synthesis cycle that takes into consideration current developments in design, simulation and optimization processes. The properties in these processes concern several domains (mechanical, electrical, thermal and the control domain). The process starts with internal and external requirements. On the system level, a domain spanning drive-train concept is being developed. On the sub-system level, the different domains find architectural solutions for this concept and allow the component design. A conscious verification and integration completes the design cycle including interconnected multi-domain simulation and a continuous connection to the decisive requirements. Consequently, from an initial phase concerning the general concept of the drive-train, several “action lines” are employed to realize important entities of the drive-train. These are verified by means of detailed simulations and integrated into a complete drive-train. The conception of this drive-train is discussed in the subsequent section.
3. Conception of the Drive-Train
For the development of the electric drive-train, the requirements are analyzed and transferred to the different sub-systems of the drive-train. The requirements are based on the technical regulations of the racing series (external requirements) and the team’s demands regarding the vehicle performance (internal requirements). The requirements of the technical regulations include, for example, the maximum voltage for the high voltage system of 600 V, the maximum power of 80 kW or the maximum temperature of the accumulator cells, which is specified as 60 °C or the manufacturer’s specifications. The lower temperature specification determines the maximum operating temperature [
19]. The team’s requirements are described more abstractly and demand the maximum possible acceleration in every driving situation, which is necessary to achieve the fastest possible lap time. Regarding the drive-train system, this goal can be achieved if the weight is minimal, high driving power is available, the mass moment of inertia is as low as possible and a low center of gravity of the vehicle is enabled. Furthermore, the driving characteristics should be as stable as possible [
20]. The goal for developing the electric drive-train is to maximally exploit the external requirements to achieve the best possible internal requirements.
The concept of the electric drive-train is based on the perspective of the entire vehicle. For this purpose, the basics of the individual technical assemblies and their influence on the vehicle performance must be evaluated. Therefore, the following points are explained in this chapter:
Explanation of possible electric drive-train topologies and competitive analysis with subsequent choice of the drive-train topology;
Evaluation of the concept for the high-voltage accumulator (HV accumulator) and the choice of battery cells;
Selection of the gearbox and its conception with the associated boundary conditions;
Fundamentals of the vehicles thermal concept.
3.1. Electric Drive-Train Topologies
For the concept of the drive-train topology, there is a high degree of flexibility for electrically powered vehicles. Possible options are for example the variants with one motor and a conventional differential, the use of two motors on one axle or the use of one motor per wheel [
21]. The Formula Student racing series is mainly dominated by teams using all-wheel-drive vehicles with wheel hub motors or internal-mounted motors which are connected to the wheel via drive shafts. Four main aspects were considered for the choice of the drive-train topology. The maximum possible acceleration, the efficiency of the drive system, the availability and the complexity.
The calculations and the literature show that the maximum acceleration can be achieved during accelerated circular driving if all four wheels are driven and the torque can be distributed fully variable [
20]. This kind of drive control and drive topology enables a technique known as
“torque vectoring
”, which is used for optimum traction exploitation. The second aspect concerning efficiency can also be fulfilled with an all-wheel-drive vehicle. Due to the effect of dynamic load transfer, which can be reduced but not eliminated by aerodynamics and suspension set-up, the rear axle can transfer increased force during acceleration and the front axle during braking [
20]. Using an all-wheel-drive concept and four variably controllable motors, it is possible to maximize power transfer during acceleration and recover as much energy as possible during braking through
“recuperation
”.
Finally, the drive concept will also be evaluated in terms of complexity and availability. The complexity of the all-wheel drive is significantly higher than the complexity of a single motor coupled to a conventional differential. For this reason, a motor-inverter package is selected, which was developed for electric vehicles with an all-wheel-drive concept used in the Formula Student racing series. On the one hand, this provides a competitive, reliable and rule-compliant drive package, and on the other hand, the use of the package significantly reduces the complexity, especially for the system implementation. Furthermore, the drive package is quickly available for the team and allows early testing of the drive-train components.
3.2. Concept of the High-Voltage Accumulator
In order to recuperate as much energy as possible and to keep the transition losses as low as possible, the battery concept should be defined in order to minimize the amount of current that has to flow for the maximum drive and braking power supply. The concept for the battery is selected to ensure that it can discharge and charge with the maximum current (I). The current intensity is calculated by the maximum drive power (P) and the system voltage (U). To achieve the lowest current intensity by providing maximum power, the highest permissible voltage of 600 V has to be used. This is shown in Equation (1) and results in a maximum current of 133 A.
To achieve the lowest possible battery weight, as much energy as possible should be recuperated. For this reason, the cells must have a high charging rate. This requires high-performance cells with a high C-rate. Additionally important is a high energy density to achieve the lowest possible total weight of the accumulator. Besides the round cells, pouch cells and prismatic cells are available on the market. The pouch cell design is considered the most suitable for the race car application, as they have a very high energy density and a large surface area for the cooling of the cells [
22]. Furthermore, these cells are available with high C-rates on the market and with the appropriate approvals (e.g., CE labeling). The initial concept used is a 144S2P configuration of a cell with a nominal voltage of 3.7 V and a capacity of 6.8 Ah. The review of this concept with an overall capacity of 7.2 kWh is presented in the following.
3.3. Concept of the Gearbox
The main task of vehicle transmission for electric drives is to achieve the best possible conversion of the tractive power offered by the electric motor into the tractive power of the vehicle. The goal is to achieve this over the widest possible speed range [
23]. On the Formula Student circuits, a maximum driving speed (v
u) of about 120 km/h is possible. Combined with the maximum speed of the electric motor (n
1) of 20,000 rpm and a selected tire with a dynamic diameter (d) of 0.4 m, this results in a wheel speed (n
2) of about 1575 rpm and a gear ratio (i) of 12.7.
This estimation, from Equations (2) and (3), shows that a high transmission ratio is necessary for the conversion of the torque and speed. Therefore, a planetary gearbox with an in-between reduction on the planetary stage is chosen, due to space and weight reasons. The detailed design and optimization of the transmission concept will be explained in the following sections of this article.
3.4. Thermal Concept of the Vehicle
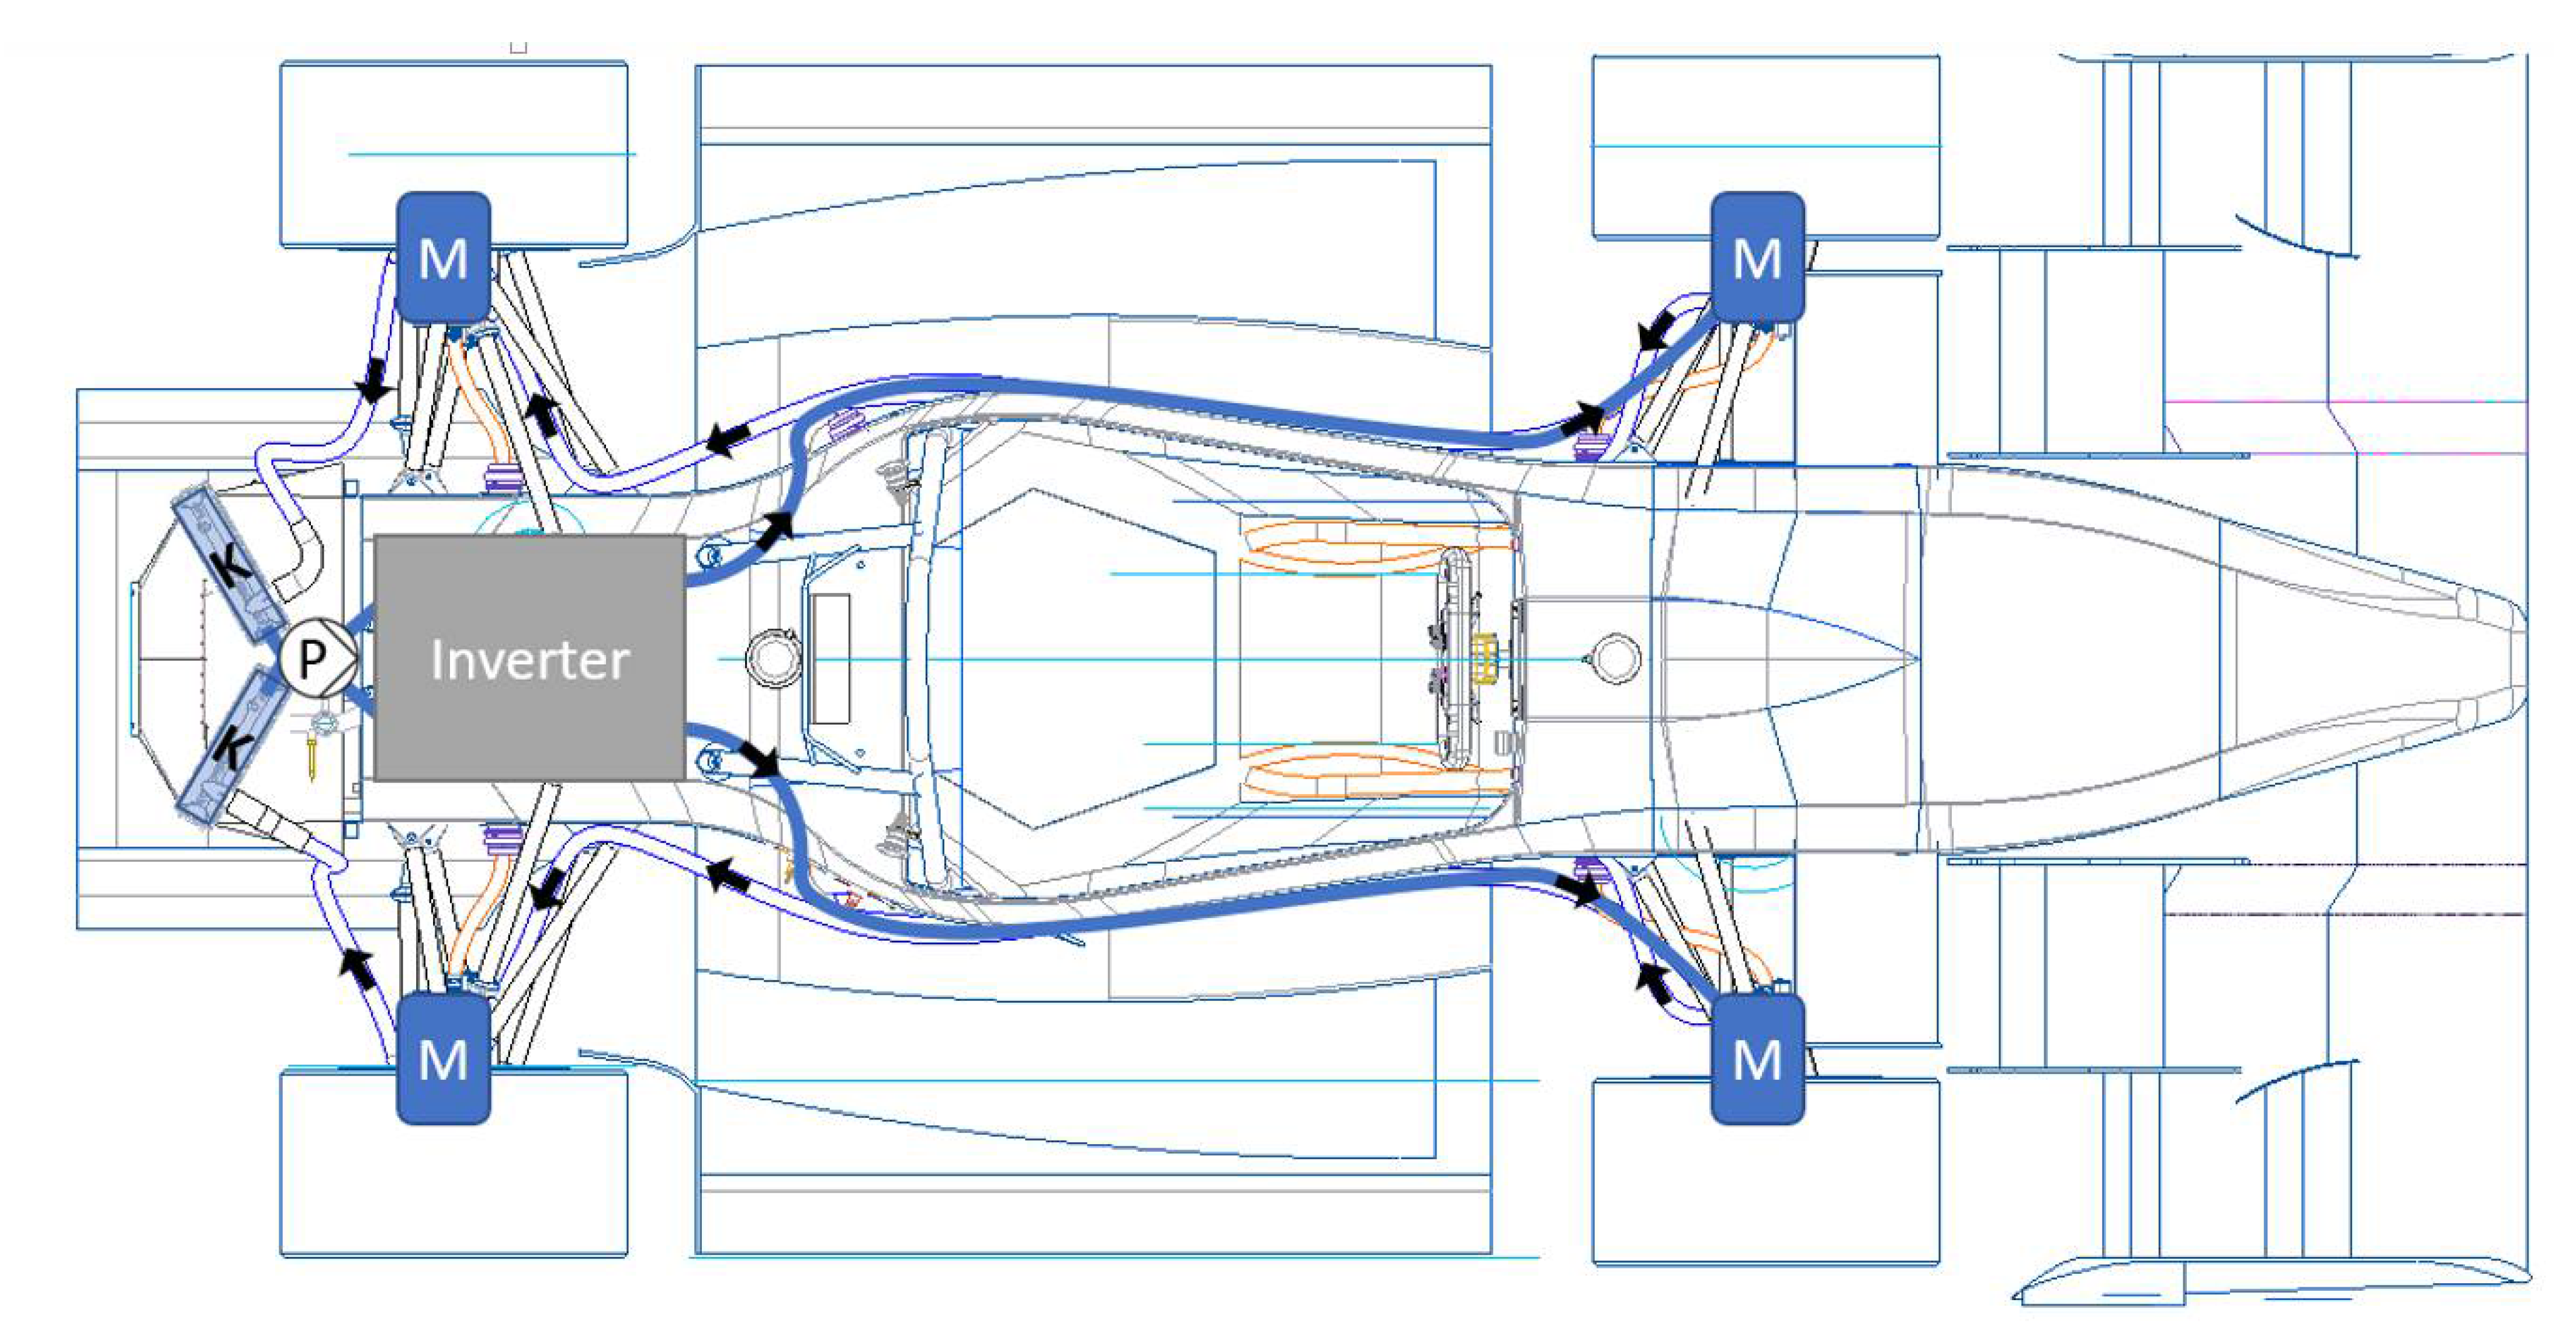
The requirements specification can be used to create an initial concept for the cooling system and the required heat sinks and material quantities for heat dissipation. For the drive package consisting of the motor and inverter, the supplier specifies constant cooling by using water as the cooling medium. Due to the required lower inlet temperature of the inverters, it can be derived from the concept that these should be flushed with the coldest fluid. Therefore, they are placed directly after the radiators. The inverters can be separated into two modules, which allows the cooling system to be divided into the right and left sides of the vehicle. The cooling medium, which flows through the left inverter is directed to the left motor on the front axle. Afterward, the motor placed on the left rear side is flowed through and the cooling medium is directed back into the left radiator (water–air heat exchanger). Afterward, the cooling flows of both vehicle sides are mixed and directed to both inverters again. For better comprehensibility, the concept is shown in the following concept sketch (
Figure 3). The blue marked boxes with the letter M are the motors, P is the water pump and K are the radiators.
To keep the complexity of the cooling system to a minimum and to avoid possible failures due to leakages caused by the frequent removal and installation of the battery for service purposes, the concept of an air-cooling system for the accumulator is chosen. This also eliminates the additional risk of short-circuiting the battery cells in the event of undesired contact with the cooling medium. Due to the mentioned reasons and the additional weight saving, a water cooling or oil cooling system for the battery cells was not considered. The calculation of the air mass flow and the thermal cooling behavior of the battery and the water-cooling system are described in the following.
4. Synthesis of the Simulation Model
The development of a Formula Student racing car highlights the importance of pushing forward the learning curve. Especially since the e-drive is a completely new development and only nine months are available for developing and testing the vehicle, as many critical components as possible should be virtually analyzed in advance. In this context, simulations can have a key role in demonstrating behaviors of technical systems across all levels of the V-model and performing subsequent optimizations based on this information. One-dimensional simulation tools can provide important results for these multi-physics developments [
24]. For this research, the AVL CRUISE
TM M simulation software (AVL CRUISE
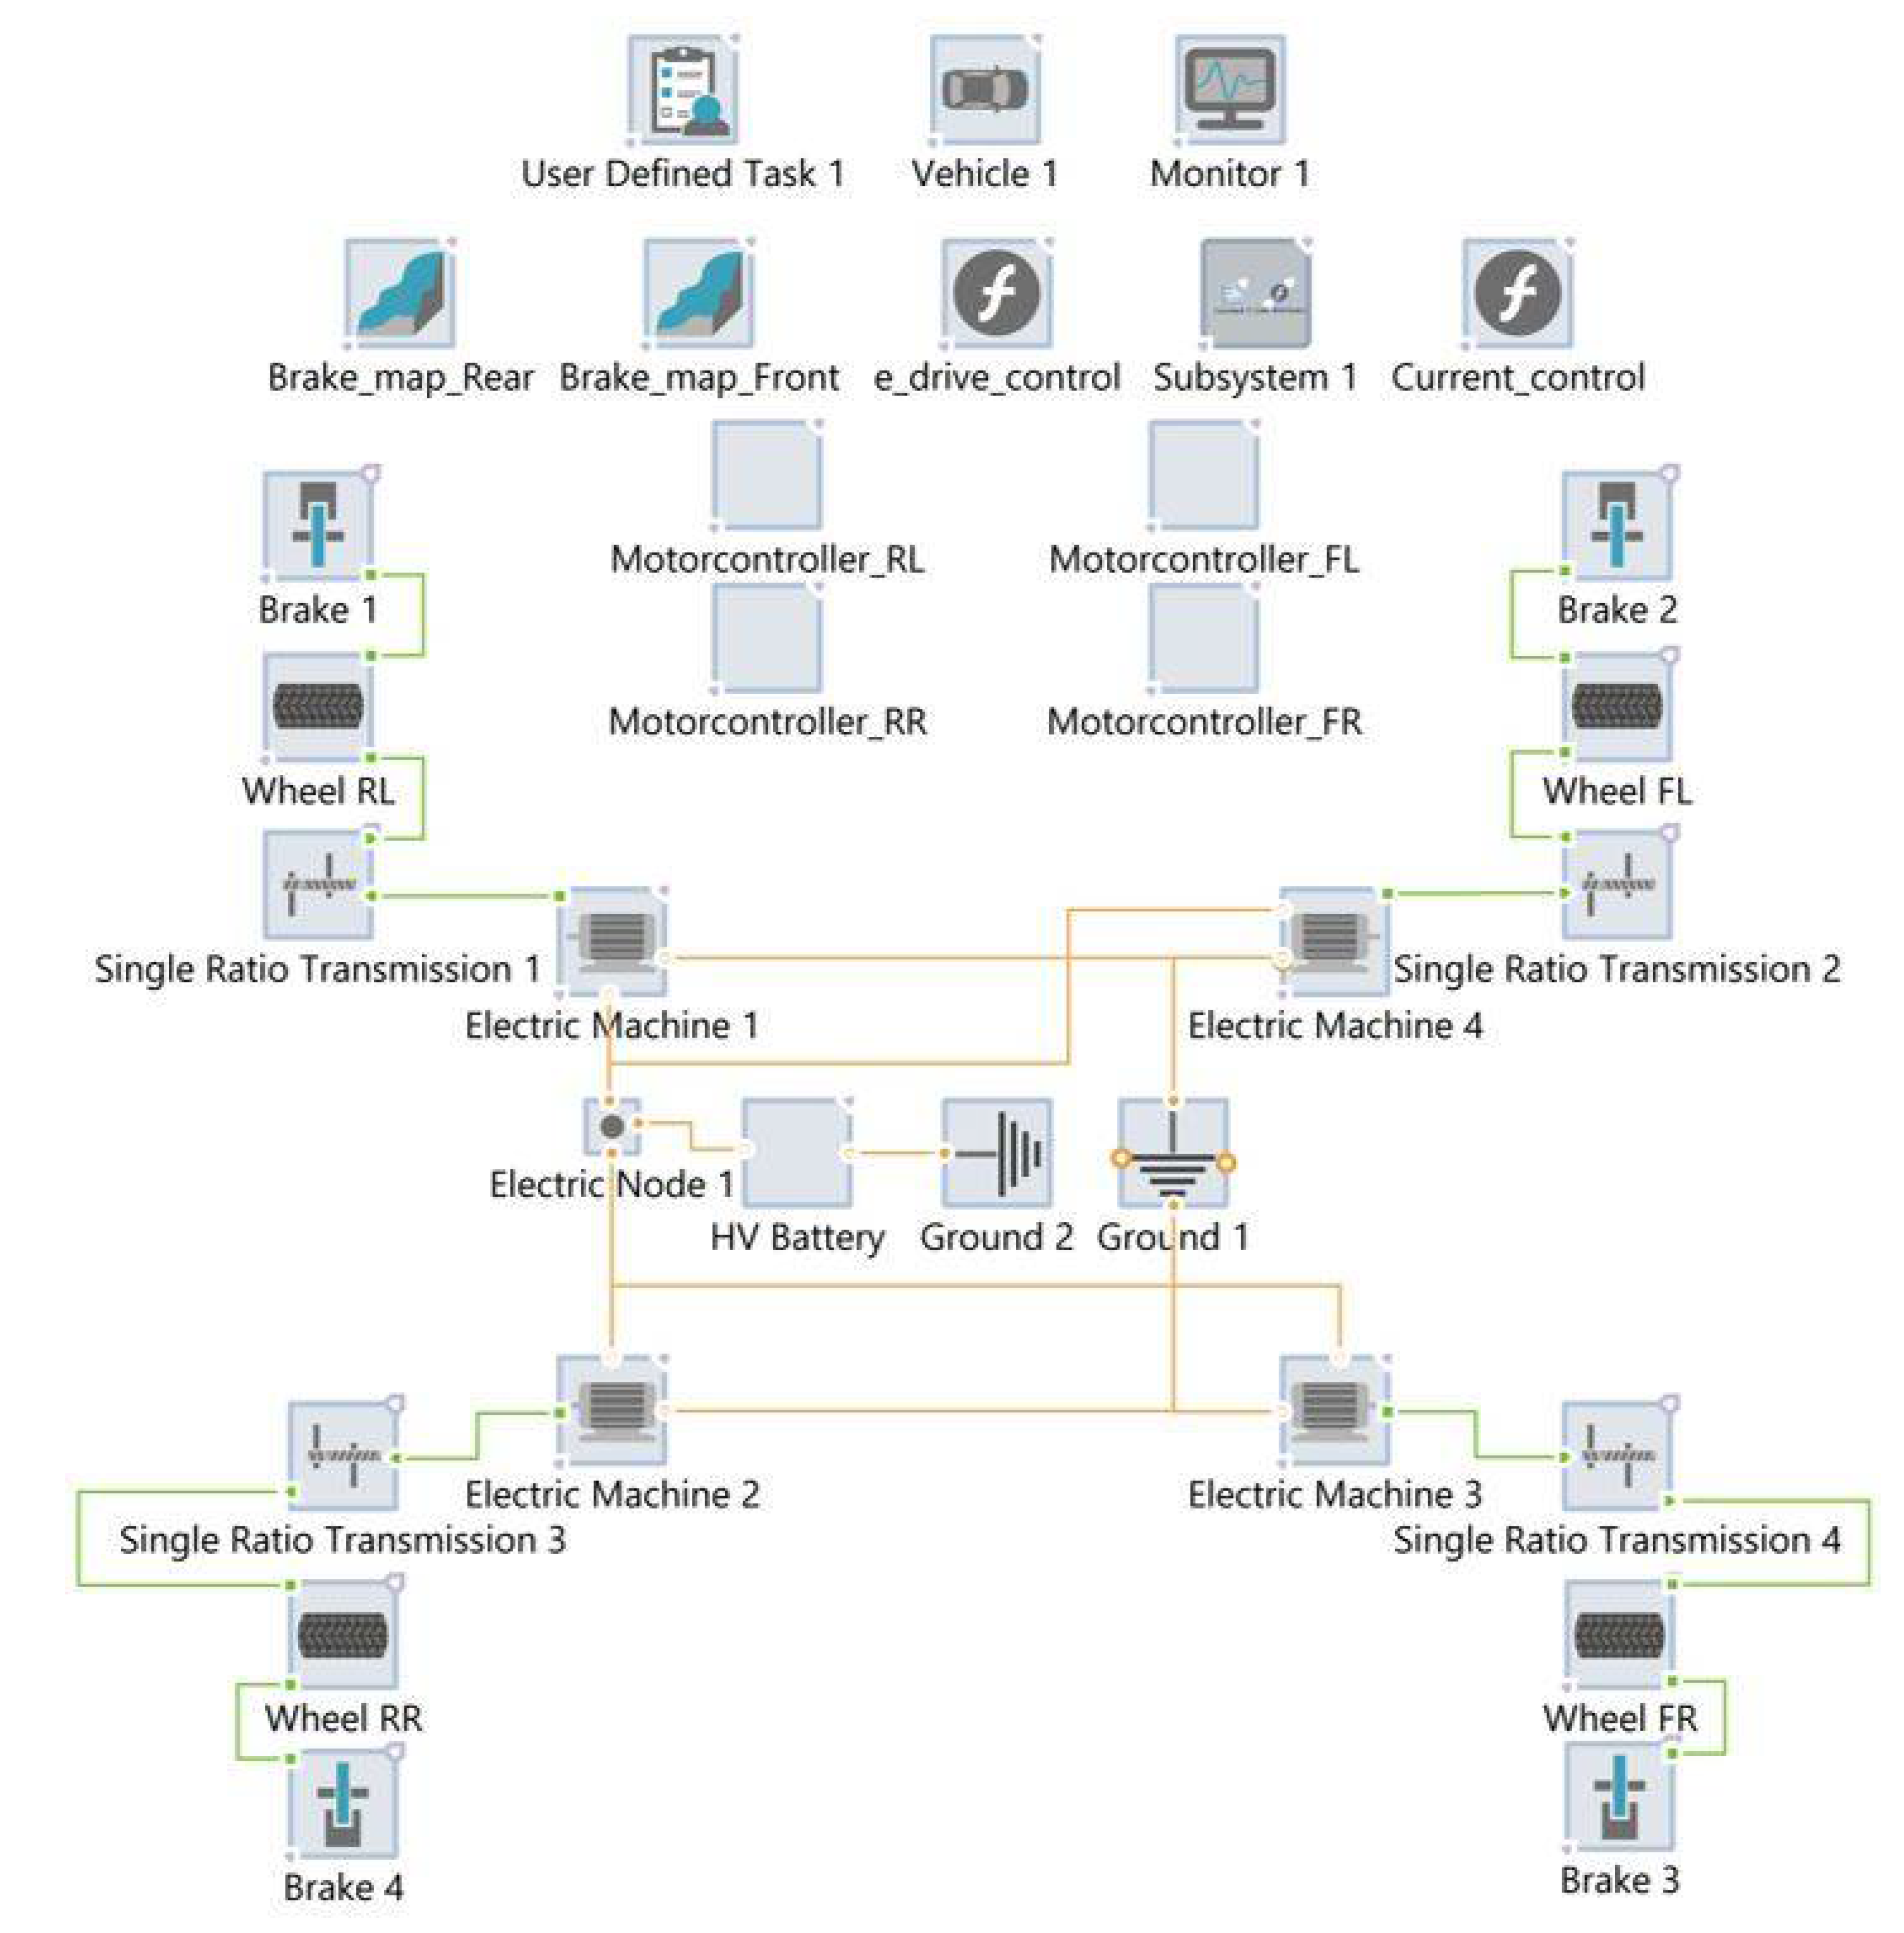
TM M, AVL List GmbH, Graz, Austria) is used to model and simulate the electric drive-train. To evaluate the basic drive-train concept, a model is generated in the simulation environment to analyze the impact of the key components (
Figure 4).
The model consists of a high-voltage accumulator, the motors with the inverters, the gearboxes, the tires and the mechanical brakes. The remaining vehicle data (downforce, drag, weight, etc.), as well as the drive control, are integrated into the model via additional system blocks. Using a user-definable driving profile, the driving characteristics of the vehicle can be examined in terms of the relevant parameters, such as efficiency or acceleration capability.
The motor data of the motor “AMK DD5-14-10-POW 18600-B5” was derived from the supplier’s specifications. This contains, for example, the torque, power losses, etc. for the inverter and the motors. For modeling the tire “Hoosier 16 × 7.5-10 LC0”, measurement data from tests of the “Formula SAE Tire Testing Consortium” was used. The brake geometry was estimated according to the available installation space and the geometry of the brake pads. However, this factor should not be rated strongly, as the vehicle control system focuses on the best possible recuperation to reduce losses due to mechanical conventional brake use. The brake pressure through the travel on the brake pedal was determined according to the brake master cylinder in a map, which allows us to determine the resulting brake pressure. The vehicle center of gravity and weight data are derived from a concept model and data from previous combustion vehicles. For this purpose, the previous combustion cars were measured on an inertia measurement bench. The aerodynamic characteristics of the vehicle were determined based on the target values of the aerodynamics department. The coefficient of lift in the front is −2.576 and in the rear −3.025. The coefficient of drag is 2.18 due to the high aerodynamic load and the cross-sectional area of the racing car can be assumed to be one square meter.
For the boundary conditions of the environmental influences, the most critical race was selected due to the highest outside temperature. This is the Formula Student competition in Spain at the Circuit de Barcelona-Catalunya. The race is held under dry track conditions with an altitude of 128 m above sea level and an outside temperature of 40 °C. However, other racetracks were also simulated for comparison and to consider further critical load cases. For example, the race in Spielberg (Austria) was simulated for the evaluation of the cooling system, as high outside temperatures can also occur with significantly higher track altitude and thus lower air density. According to the regulations, a Formula Student racetrack always has a length of 22 km with a driver change halfway through the race.
For the load cycle, the speed profiles from log data from the previous combustion vehicles were used and new speed profiles were also generated with the help of a lap time simulation. The Formula Student race cars are redeveloped and rebuilt every year. In total, a maximum of 35 operating hours are achieved in the approximately three-month testing and racing phase under competitive conditions.
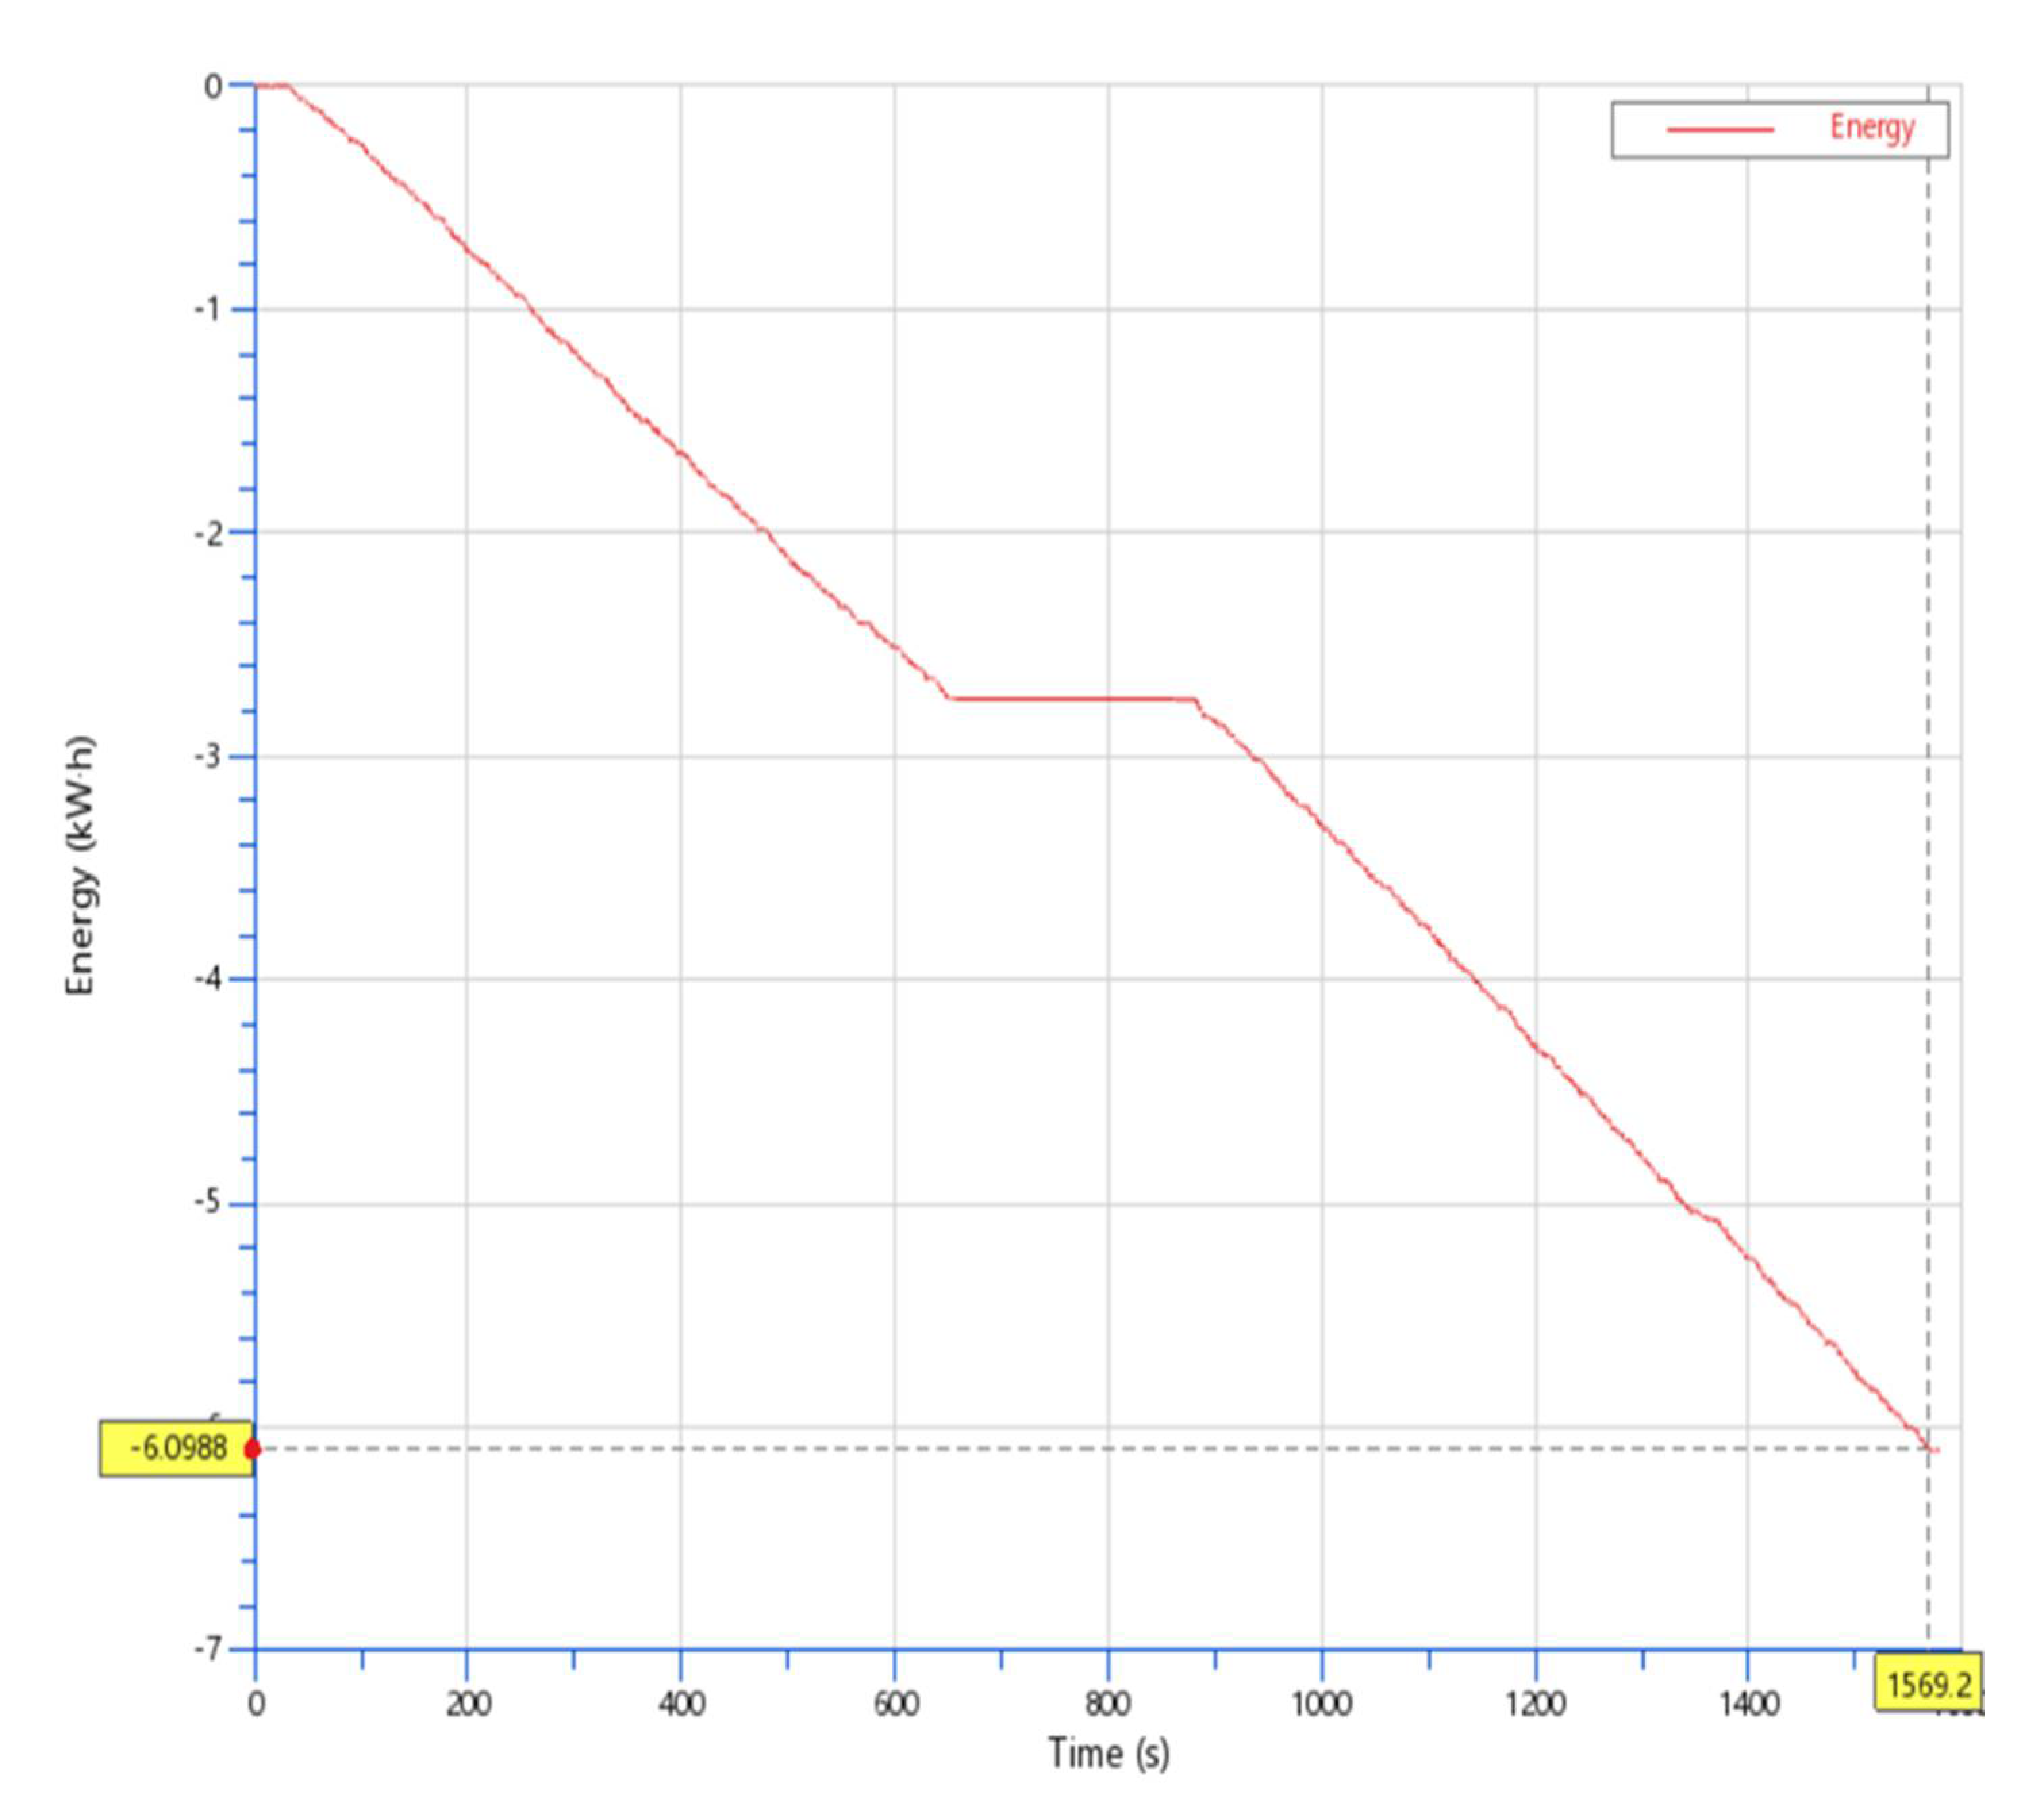
Using the initial model, it was possible, for example, to determine the energy consumption of the concept and to examine the accumulator dimensioning (
Figure 5). In the picture, the energy dissipation of the accumulator over the endurance race with a length of 22 km can be seen. In the middle, a driver change is performed, which is why the discharge line stays constant. A total of approximately 6 kWh is used and the endurance race lasts about 1569 s.
5. Expansion of the Simulation Model
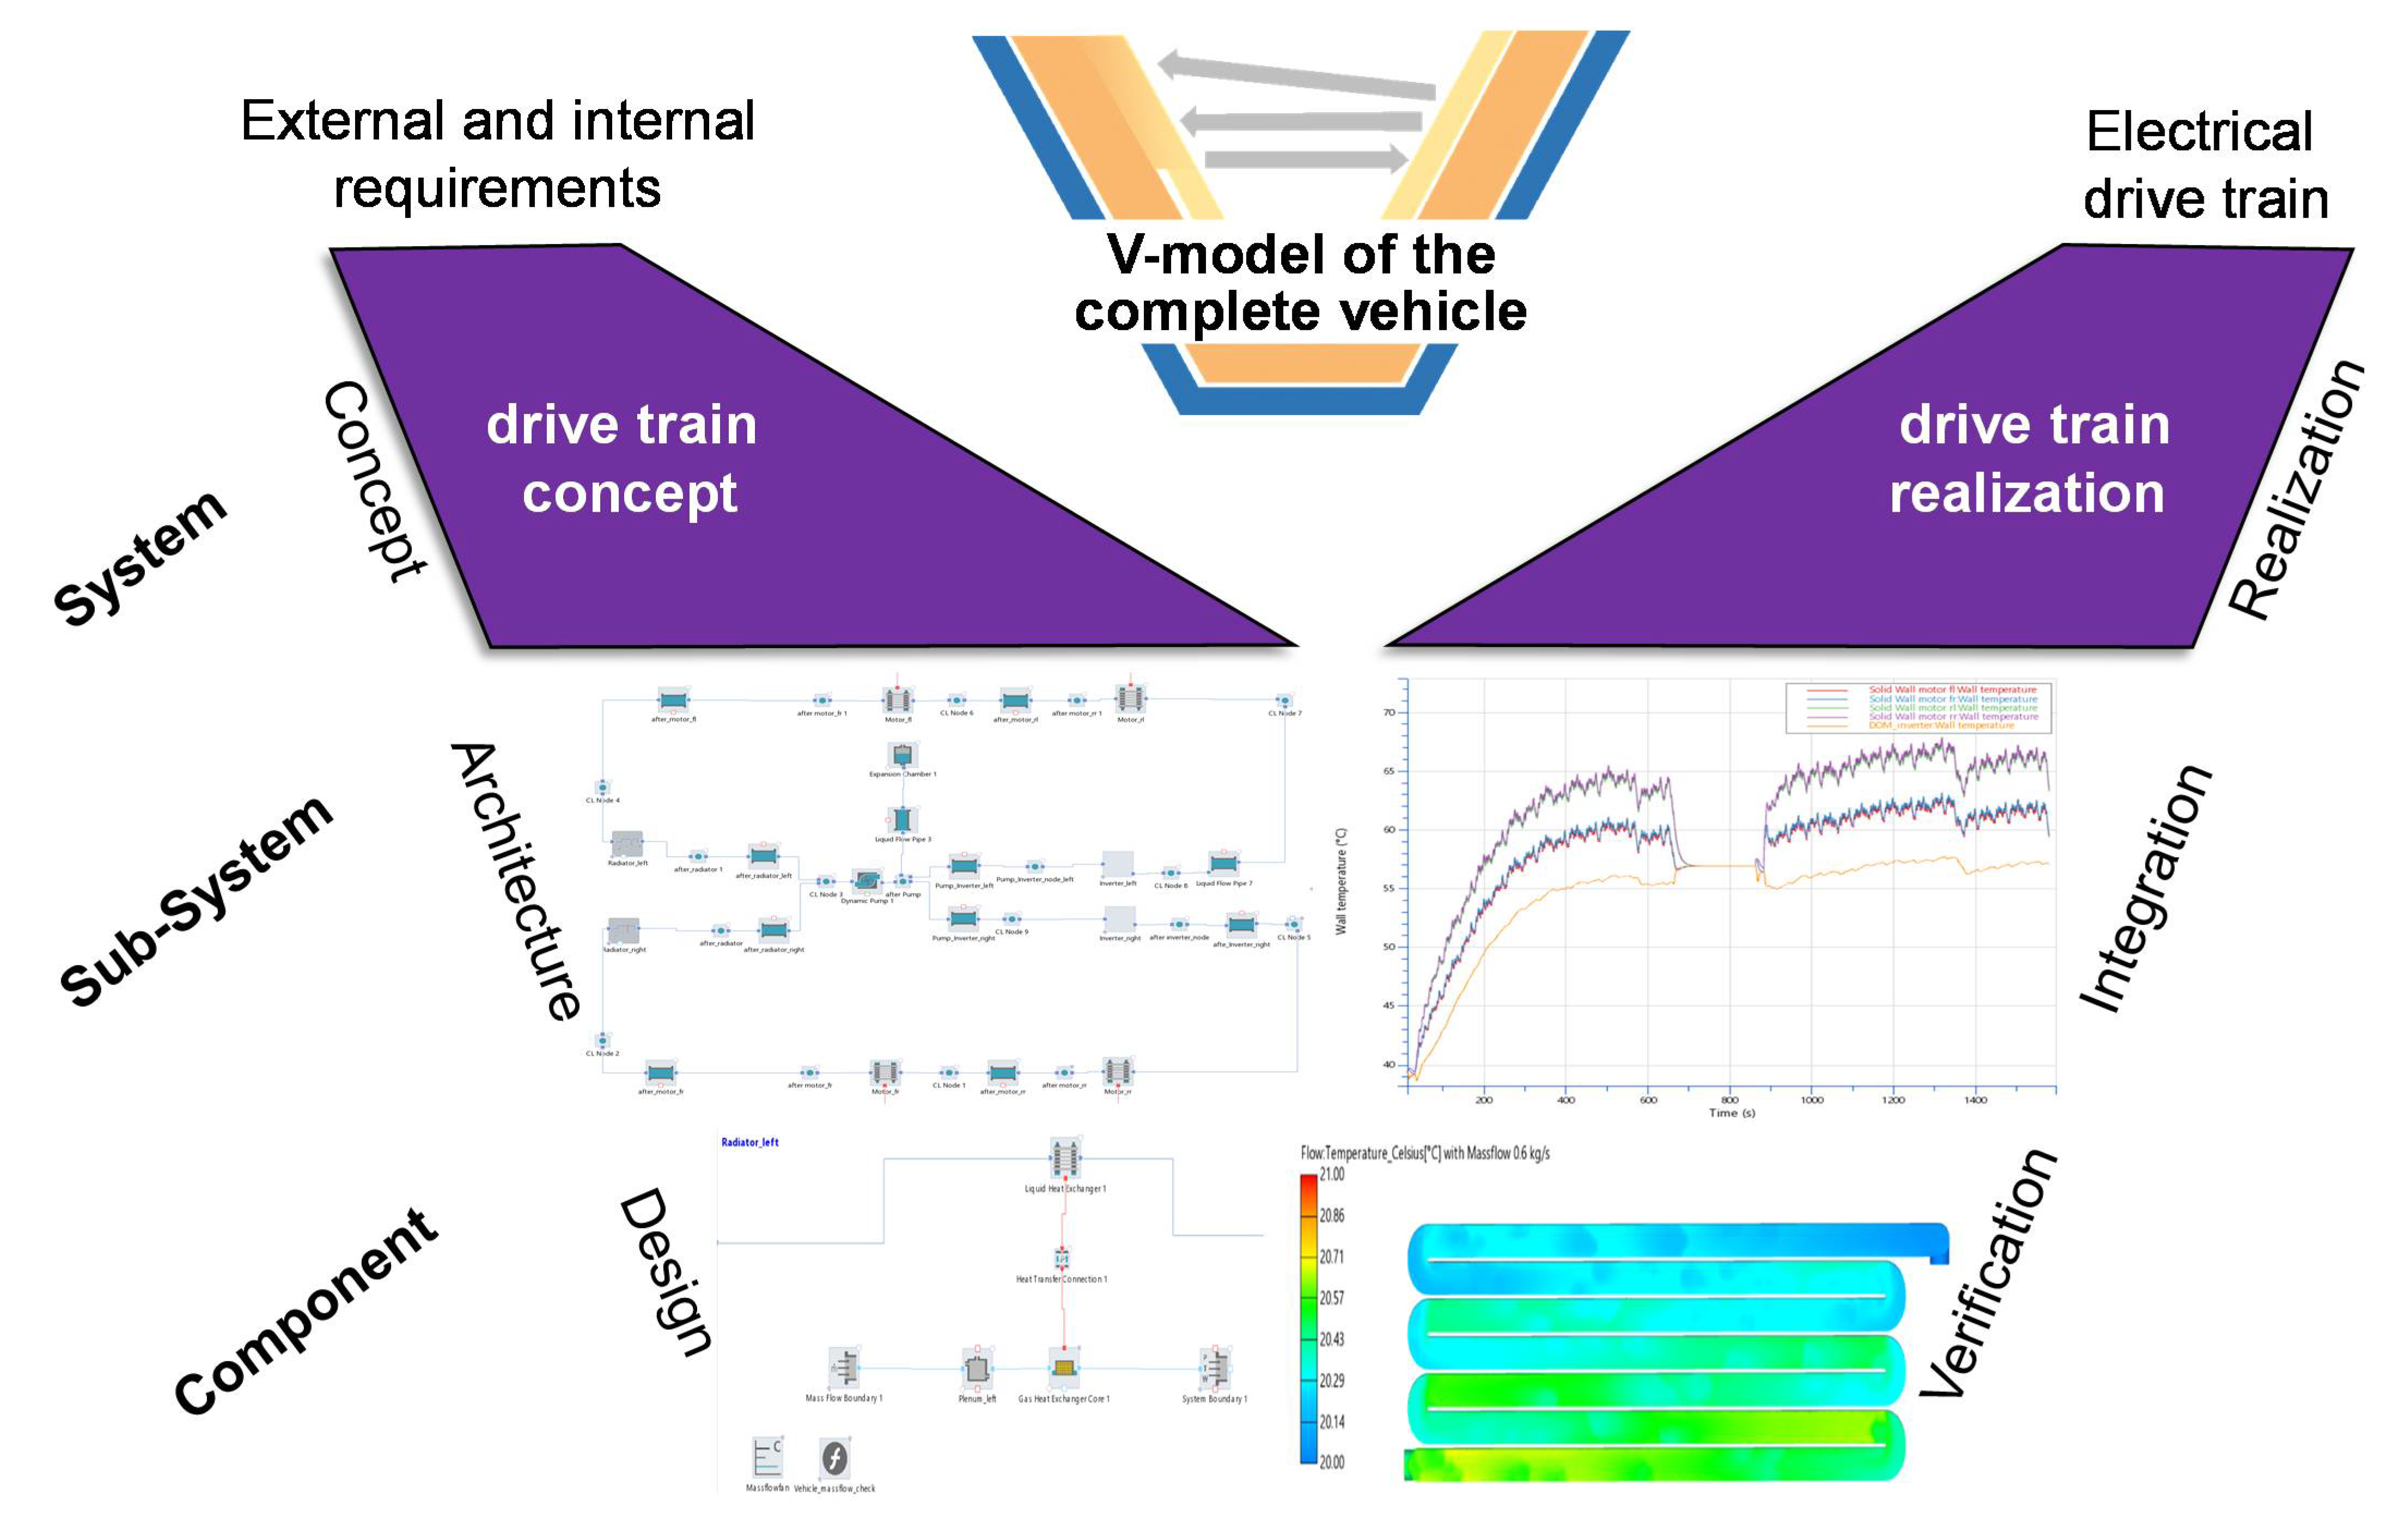
The basic vehicle model revealed the influence of the drive-train on many aspects of vehicle performance. To identify critical components and load cases, a failure mode and effects analysis (FMEA) was executed. Based on this FMEA, the simulation model was extended into several dimensions. To evaluate the cooling concept for the electric motors and the inverters, a new model is being built, based on the basic model. For this purpose, a new subsystem is created in which all components are integrated. Subsequently, the “water-air heat exchangers”, are modeled and fed with data from analytical calculations and characteristic curves from the suppliers. After the model was created, results from the CFD software AVL FIRE
TM (AVL FIRE
TM, AVL List GmbH, Graz, Austria) are transferred from the 3D CFD simulations to the 1D simulation with a significantly higher level of detail using the “Thermal Network Generator”. This enables the integration of components into the system level as specified in the V-model. The complete product development process can be executed by using the AVL eSUITE™ (
Figure 6).
The figure shows the water-cooling circuit at the system and component level, followed by the integration and verification of the components and assemblies exemplarily. For electric vehicles, the thermal behavior of the battery and the individual cells is a significant aspect that can be investigated using simulation models [
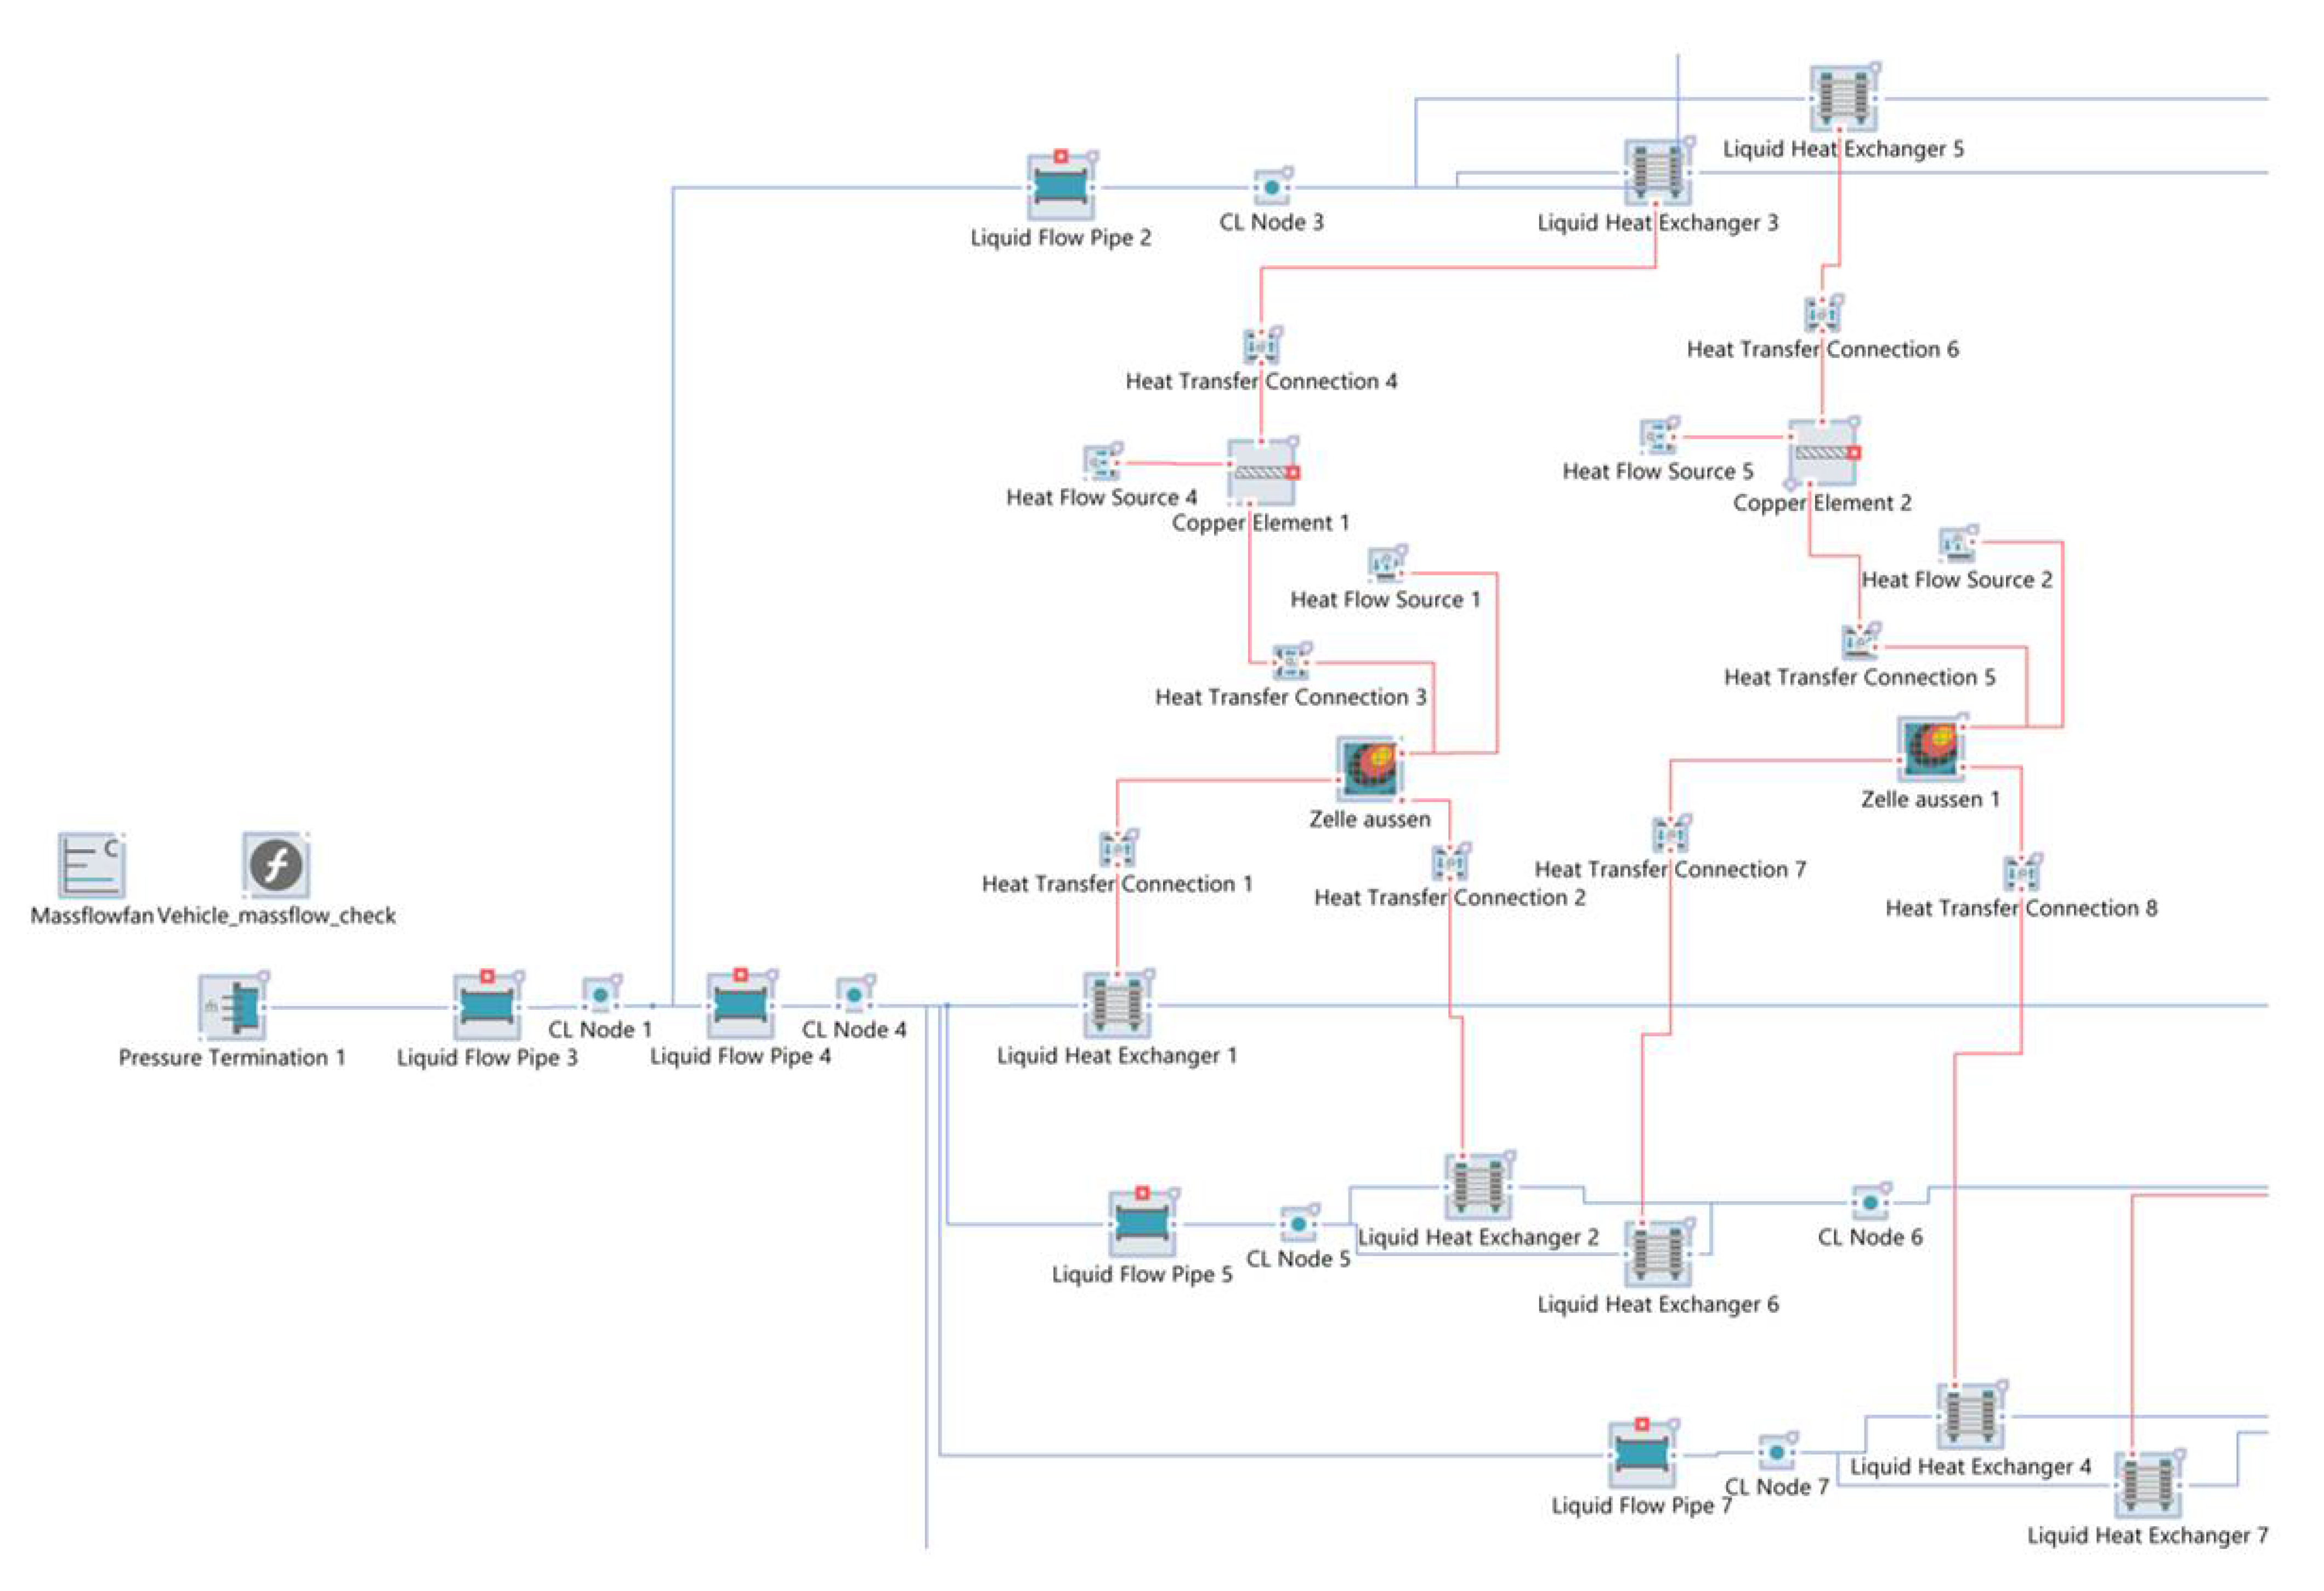
25]. For the investigation of the thermal behavior of the battery, a model was built in the simulation environment (
Figure 7). The red lines represent the possible paths for the heat transfer and the blue lines symbolize the ducts of the cooling medium.
To avoid calculation errors due to the compressibility of air and to enable a more stable solver run, a “liquid system” with properties of the medium “air” was used for the calculation due to the small pressure differences in the air cooling system.
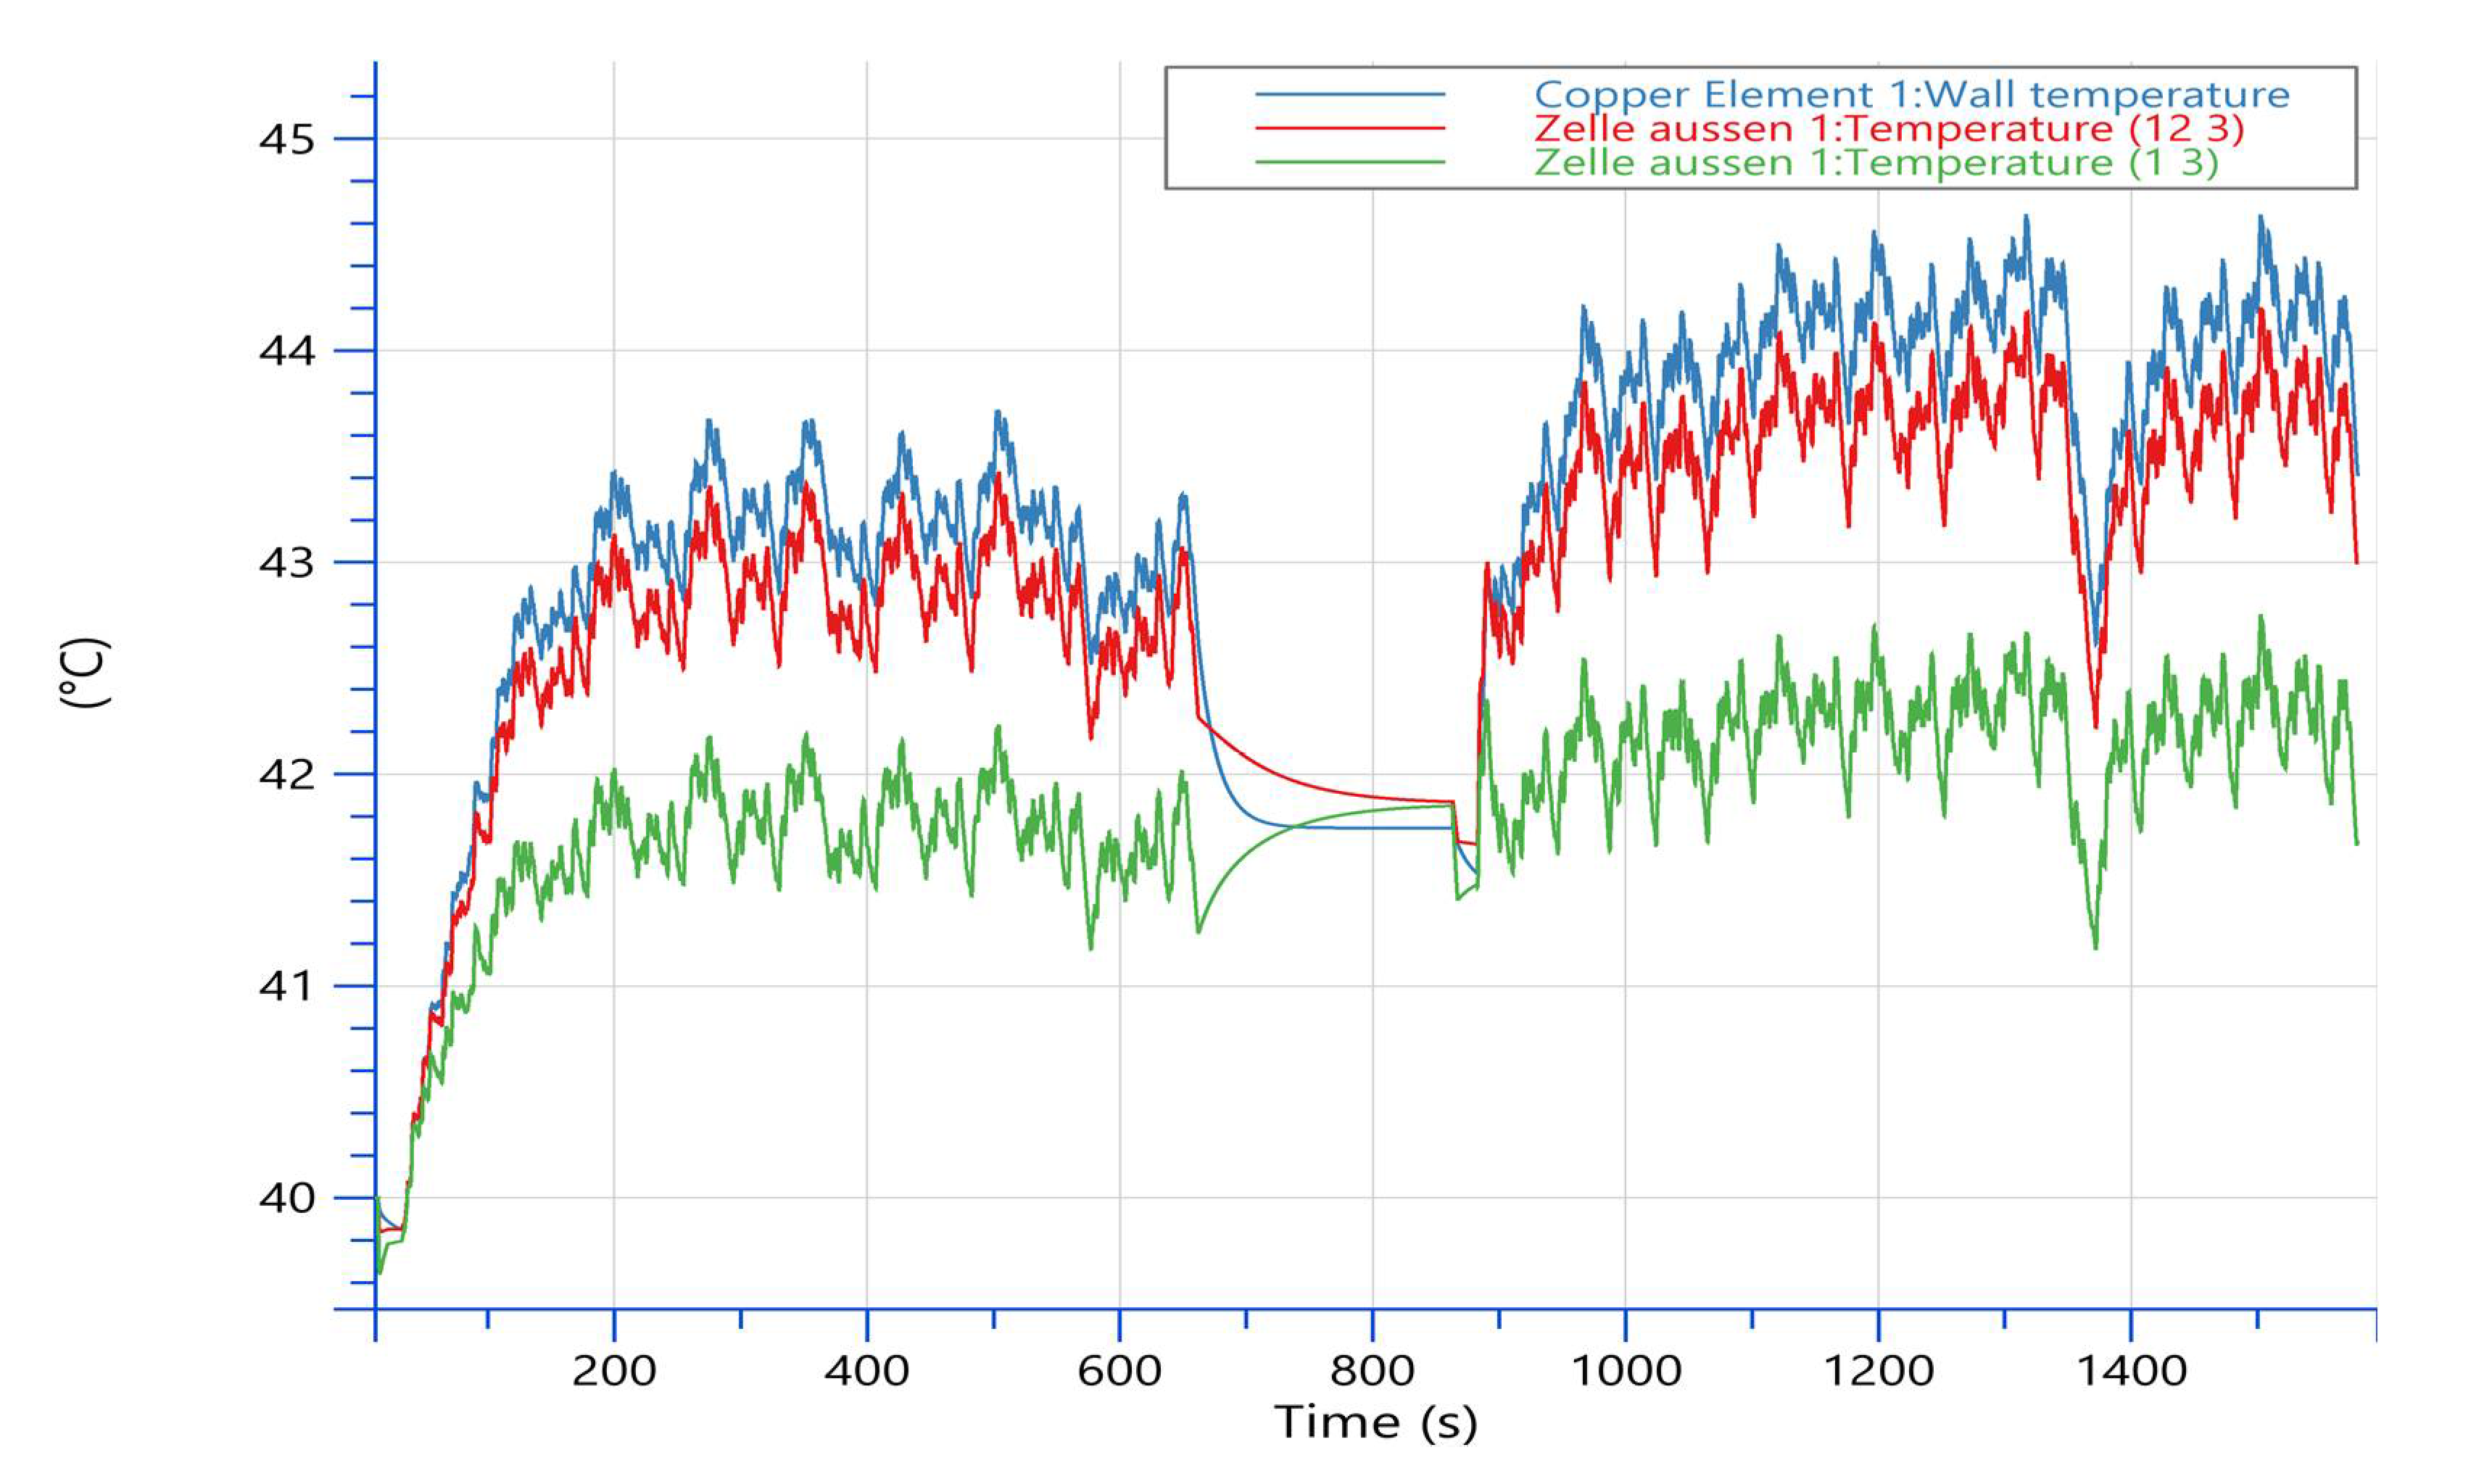
Figure 8 shows the temperature response of the most forward cell, the most rearward cell, and the connecting terminals during an endurance run.
The verification in the simulation environment also allowed to investigate the critical load case with a maximum ambient temperature of 40 °C which could be classified as non-problematic.
6. Validation
For the first development, the simulations were able to provide important information about the vehicle, but the simulations must be verified to be representative. Because no test bench data or real driving data from previous developments are available, theoretical validation options had to be identified. It was possible to develop two methods for this validation. On the one hand, the energy consumption for an endurance run and on the other hand, the cooling power to be dissipated in relation to the competitors are used for validation. For both validation methods, competitor analyses were used to identify other vehicles that use the same drive-train package with a similar overall vehicle concept. To validate the simulation model, a speed profile of a Formula Student vehicle from a previous competition was simulated and the energy consumption and the cooling power to be dissipated were compared with a similarly performing vehicle from a competitor. Both validation methods showed that the simulation supplies results in the expected magnitude and can therefore be considered theoretically validated.
7. Optimization of the Vehicle Concept
This section describes the optimizations that can be performed on the drive-train concept using the AVL CRUISE
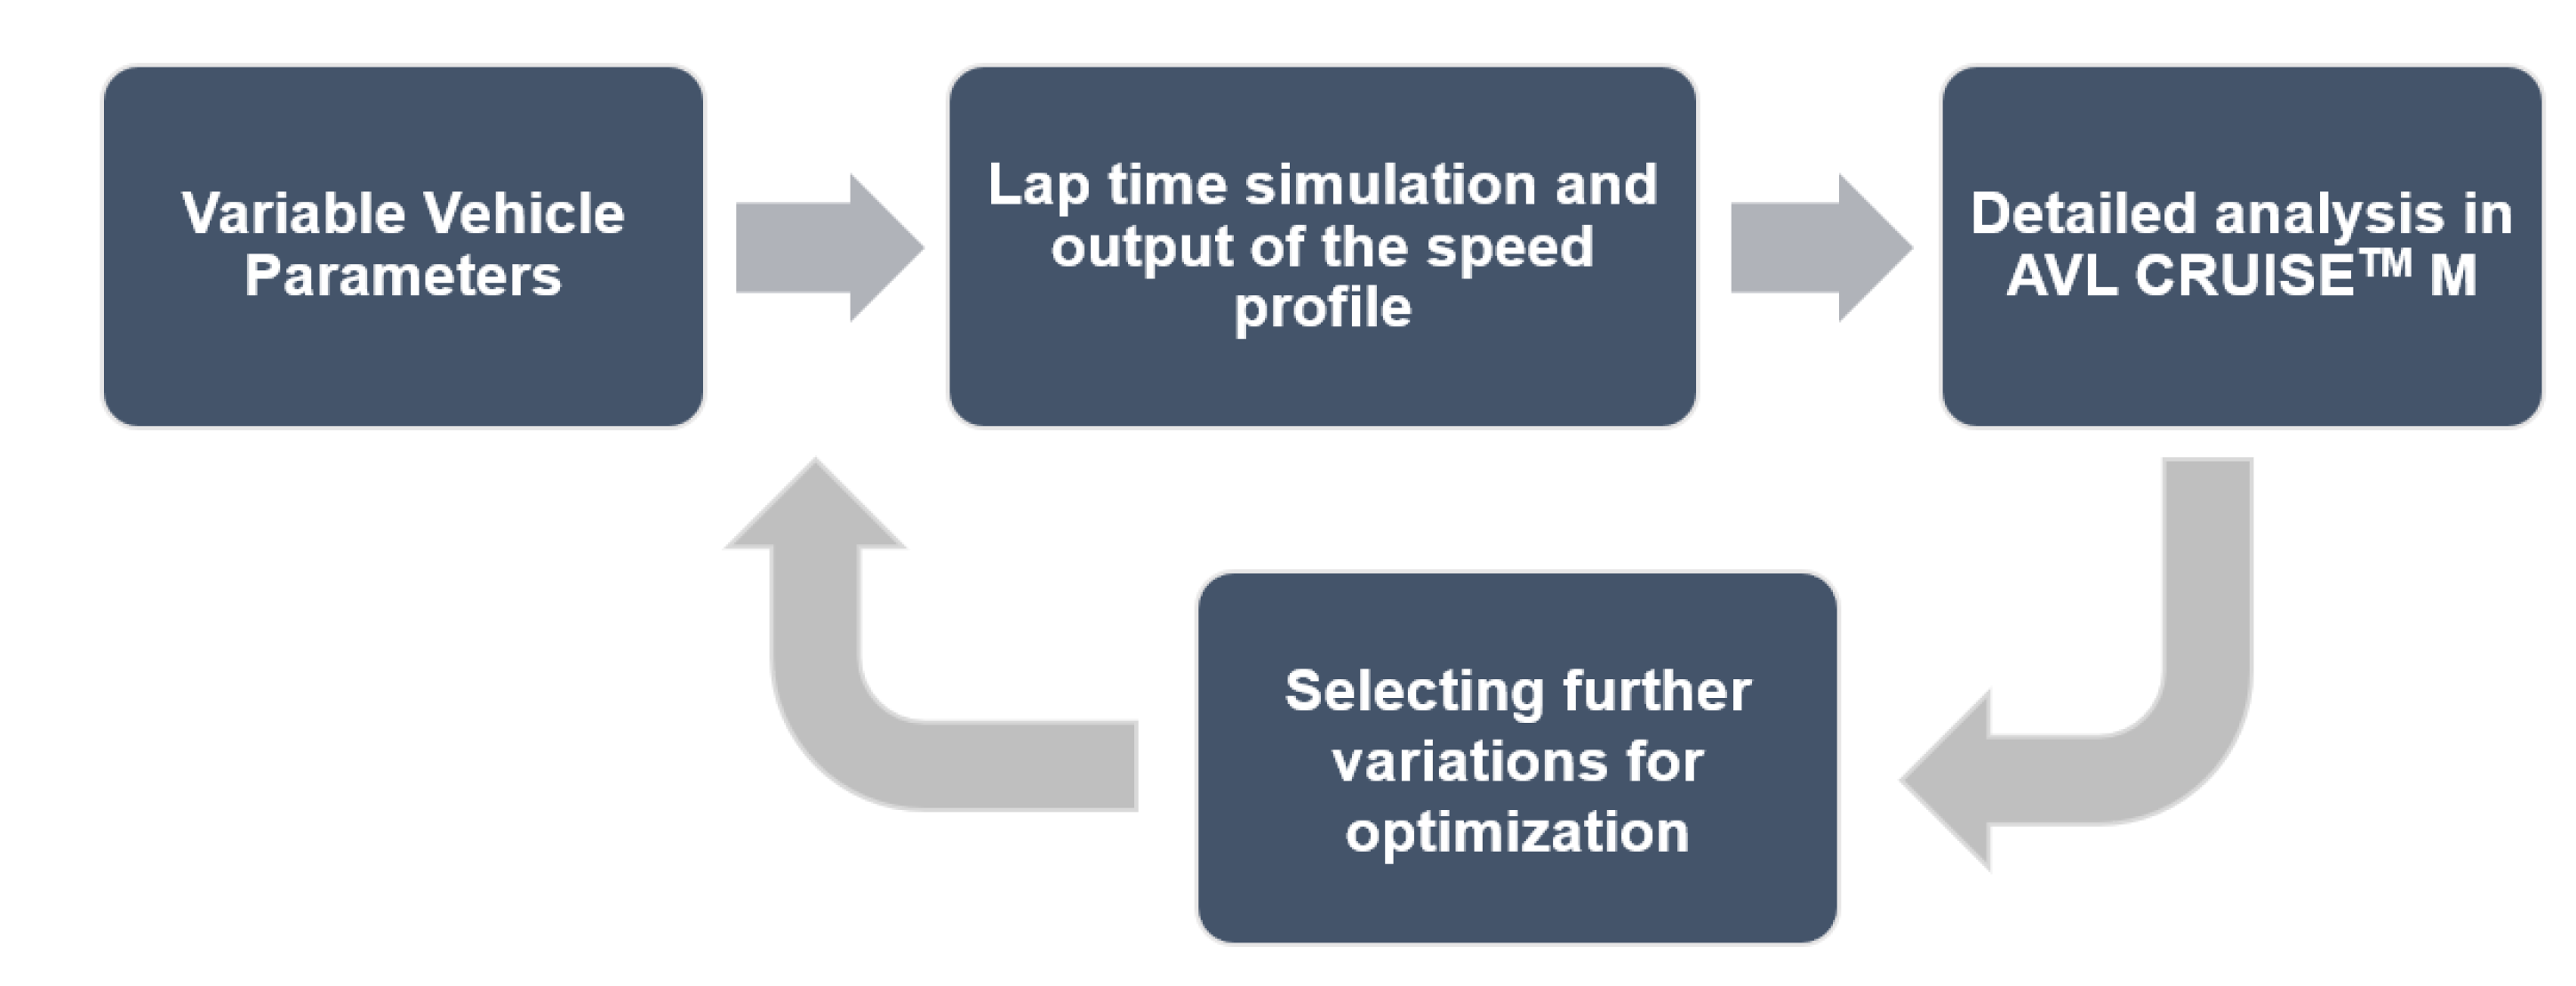
TM M simulation. Especially the coupling of the drive-train simulation with a self-developed lap time simulation, which is executed in Octave (GNU Octave, GNU General Public License), enables possibilities to optimize the concept of the electric race car. In the following, a study to determine the optimal gear ratio for the electric powertrain is explained. By coupling the two simulation tools, specific speed profiles are generated for the varying vehicle parameters by the lap time simulation, which are simulated and analyzed in AVL CRUISE
TM M (
Figure 9).
7.1. Optimization Process of the Gear Ratio
In this way, the influence of the transmission ratio on the vehicle can be evaluated in detail in a full-factorial study. The optimization process runs as described in the following:
Requirements-driven initial conception with a selection of a starting point, e.g., based on the top speed to be achieved or the maximally available package;
Modeling and simulation of the initial state to determine the influence on lap time, energy consumption or acceleration capability, etc.;
Variation of the gear ratio within the specified limits through a full factorial simulation study. The boundary conditions were determined based on certain design limits, such as the maximum package space or the desired maximum speed. Based on this, the gear ratios had to be varied between I = 10 and i = 15. Subsequently, the variation of the parameters and the analysis were performed by using a parametric model setup. Due to the changed gear ratio, a changed load profile with a different lap time for a fast race lap was determined. This also led to a different drive train efficiency and a different energy consumption. These characteristics could be analyzed and optimized with the help of the determination of the minima as shown in
Section 7.2;
The selected gear ratio concept was transferred to the detailed feasibility study in the FVA-Workbench (FVA-Workbench, FVA GmbH, Frankfurt, Germany) and the detailed 3D data were generated. These were finally checked with a load spectrum of the related endurance to investigate the durability of the chosen design.
7.2. Pareto Optimization
An appropriate method for the evaluation of computer experiments and related optimization processes is the so-called “Pareto optimization”. For the determination of the Pareto frontier, all results of a full factorial study are recorded with the values of both factors to be minimized [
26]. This method is useful for the appropriate selection of motor and gearbox combinations [
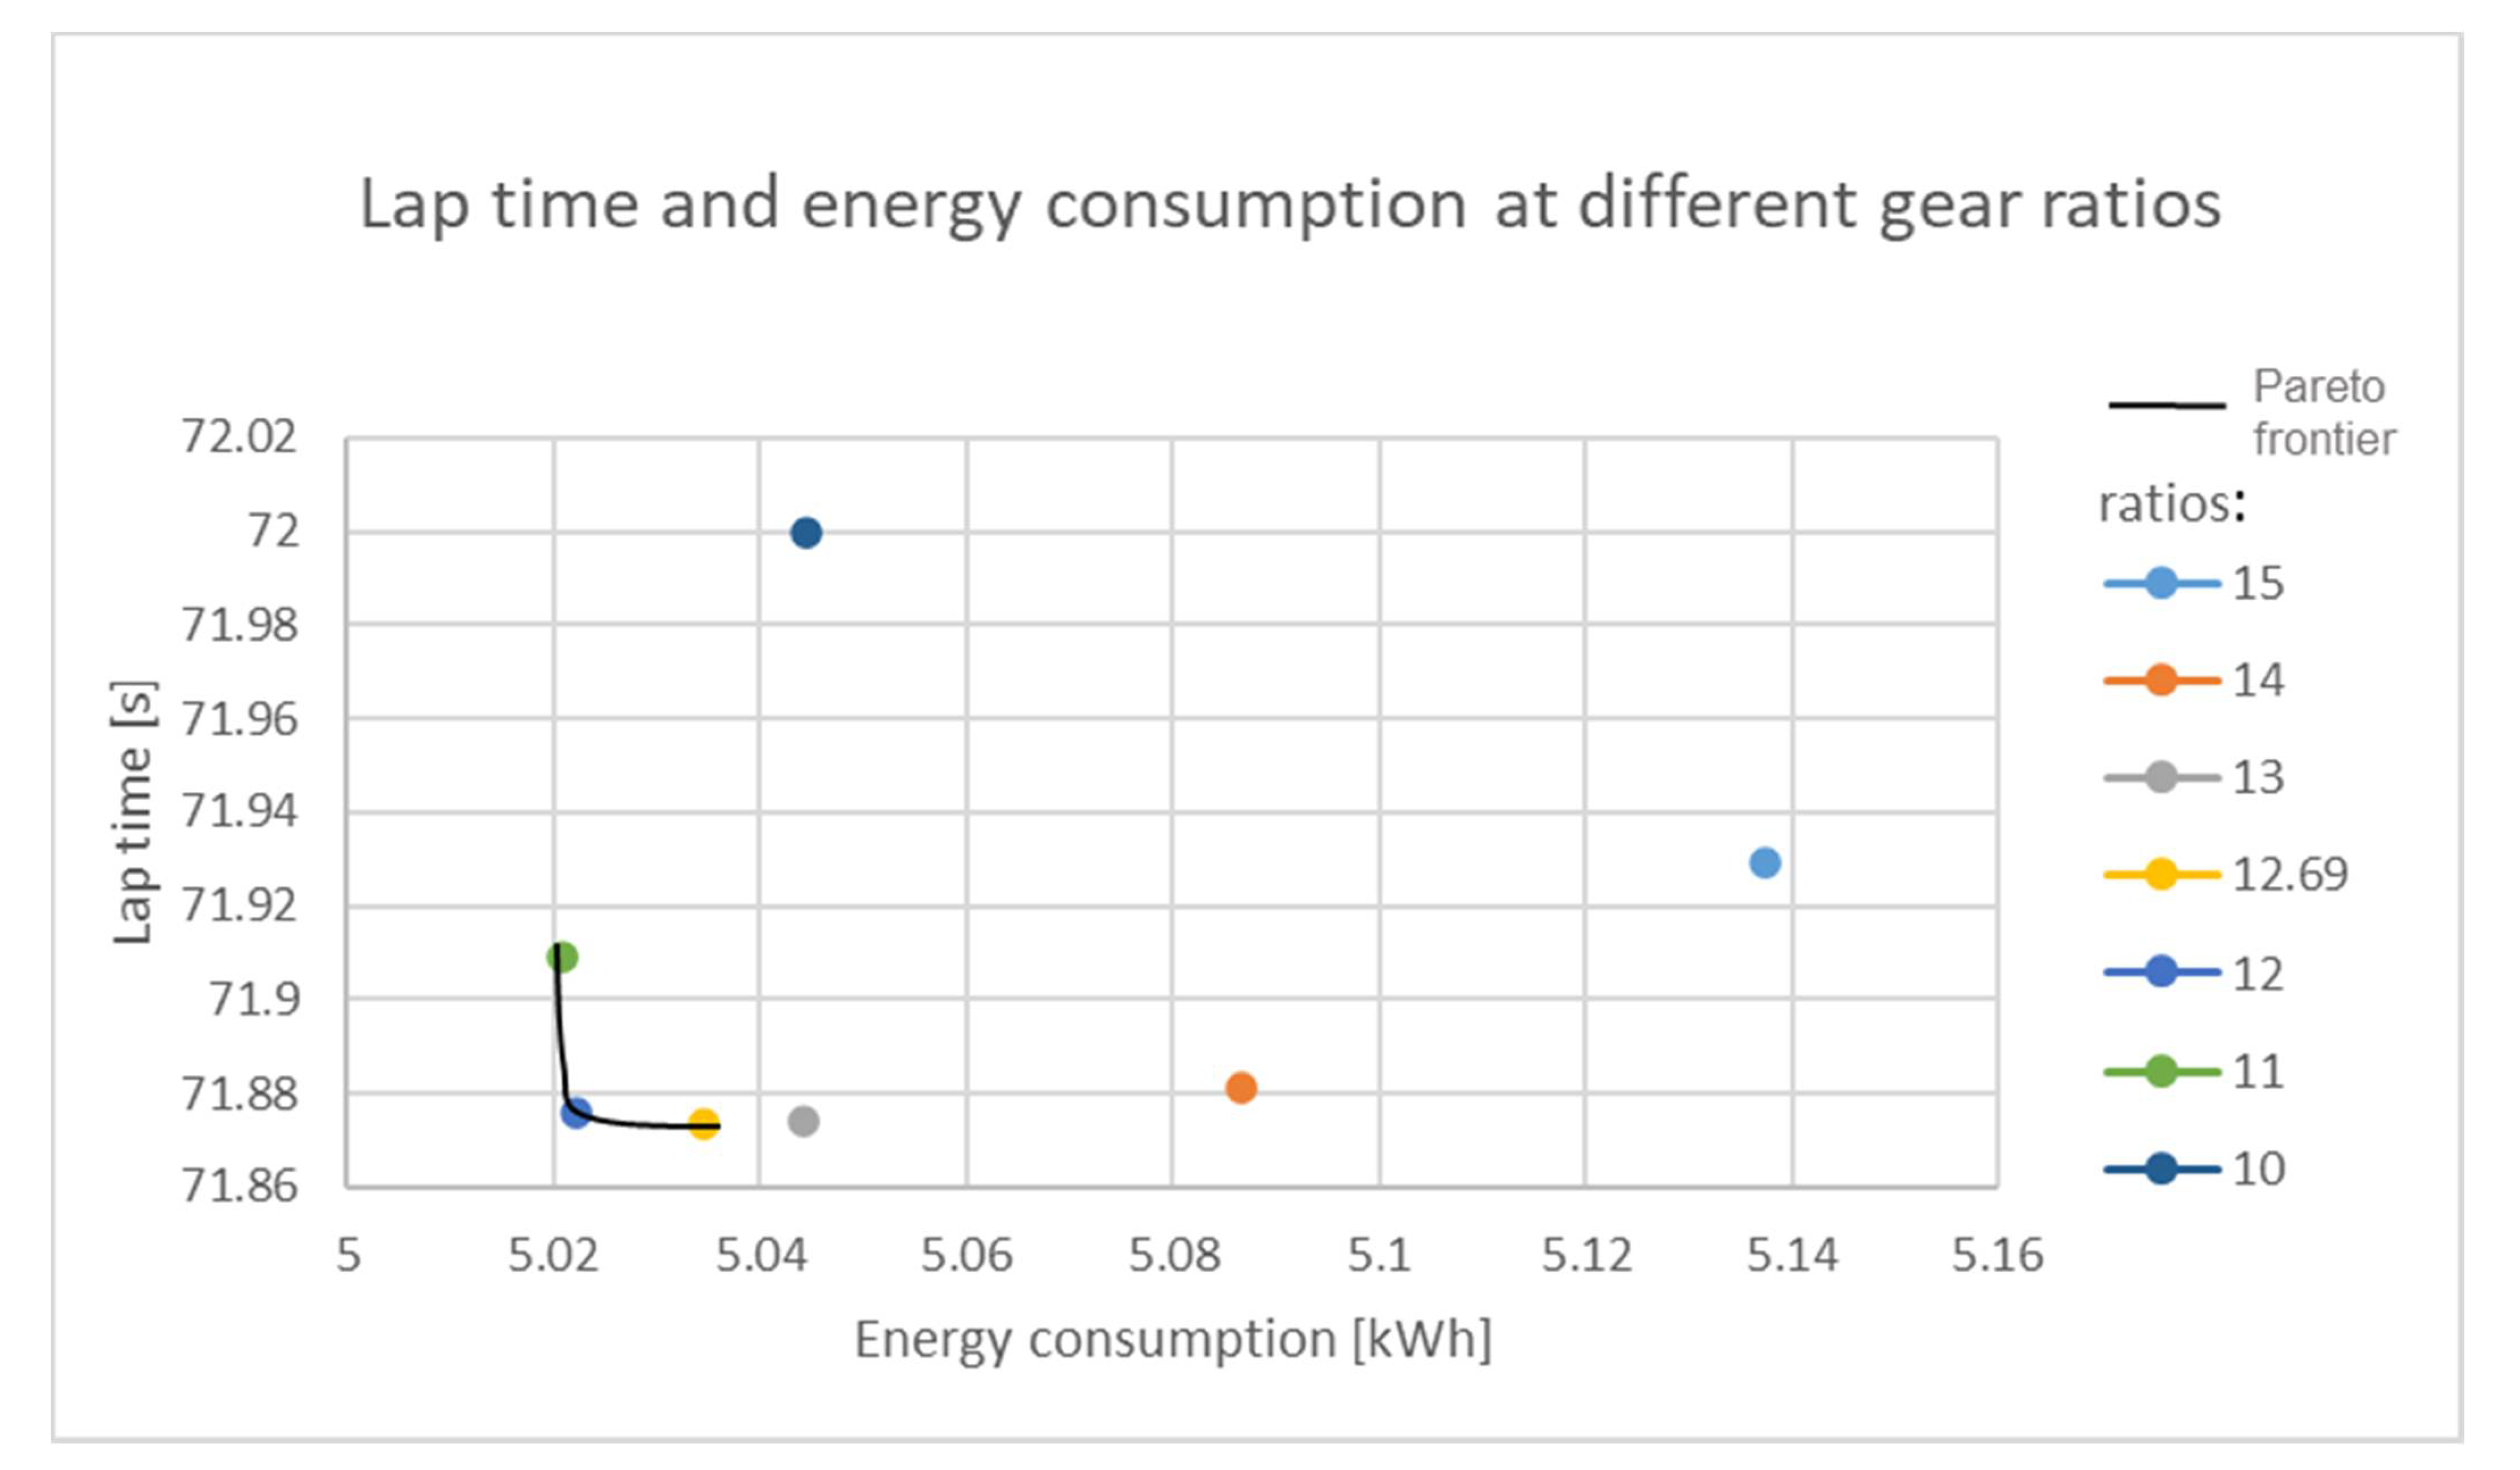
18]. The results of the full factorial simulation of the gear ratios lead to the plotted distribution (
Figure 10).
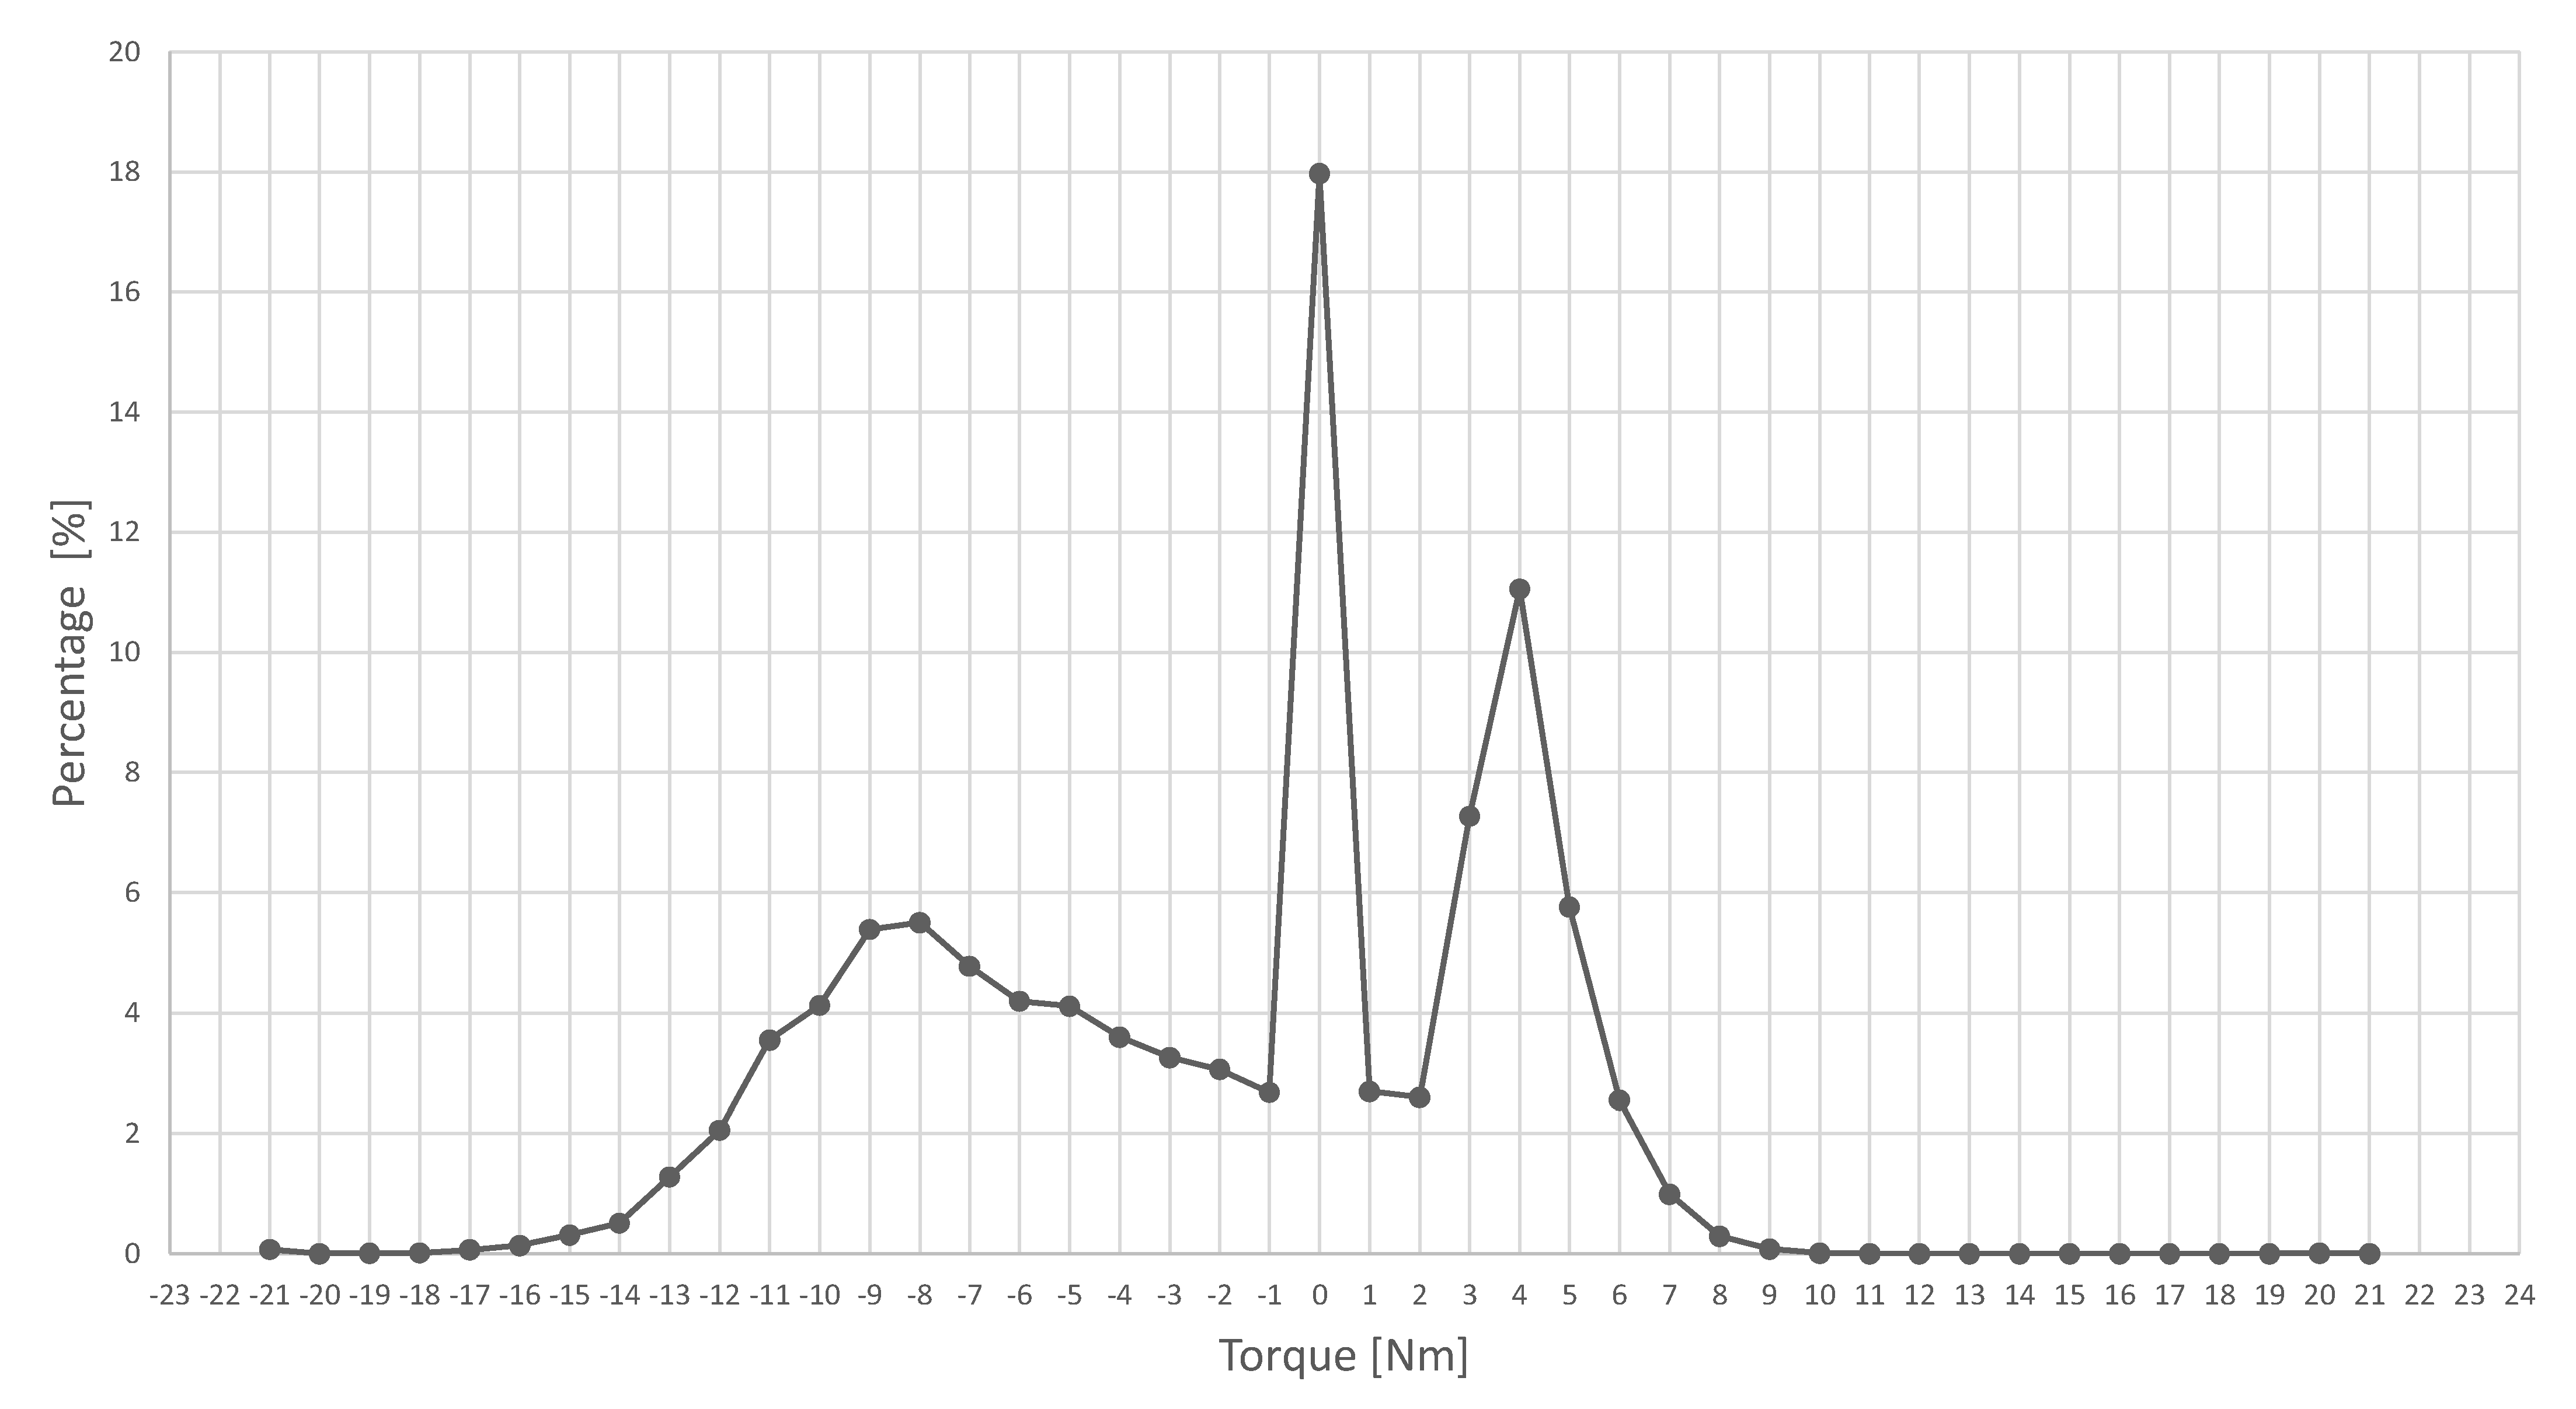
The generated Pareto frontier consists of the points i = 12.69, i = 12 and i = 11. These three points represent the “Pareto optimals” for the target parameters. The ratio i = 11 has the least energy consumption, compared to the ratio i = 12.69, which achieves the fastest lap time. The third possible result i = 12 offers a lower energy consumption compared to the fastest gear ratio but consumes more energy than i =11. The parameter of the lap time is rated higher than the energy consumption for a racing car. Therefore, the gear ratio with i = 12.69 is selected. After the gear ratio had been conceptually defined, a load profile was generated using the simulation tool for further optimization of the transmission part geometries. For this purpose, the torques were calculated according to the probability of occurrence for a lifetime of 40 operating hours (
Figure 11).
To verify the load profile and to generate the geometry of the transmission components, the software FVA-Workbench was used.
8. Integration
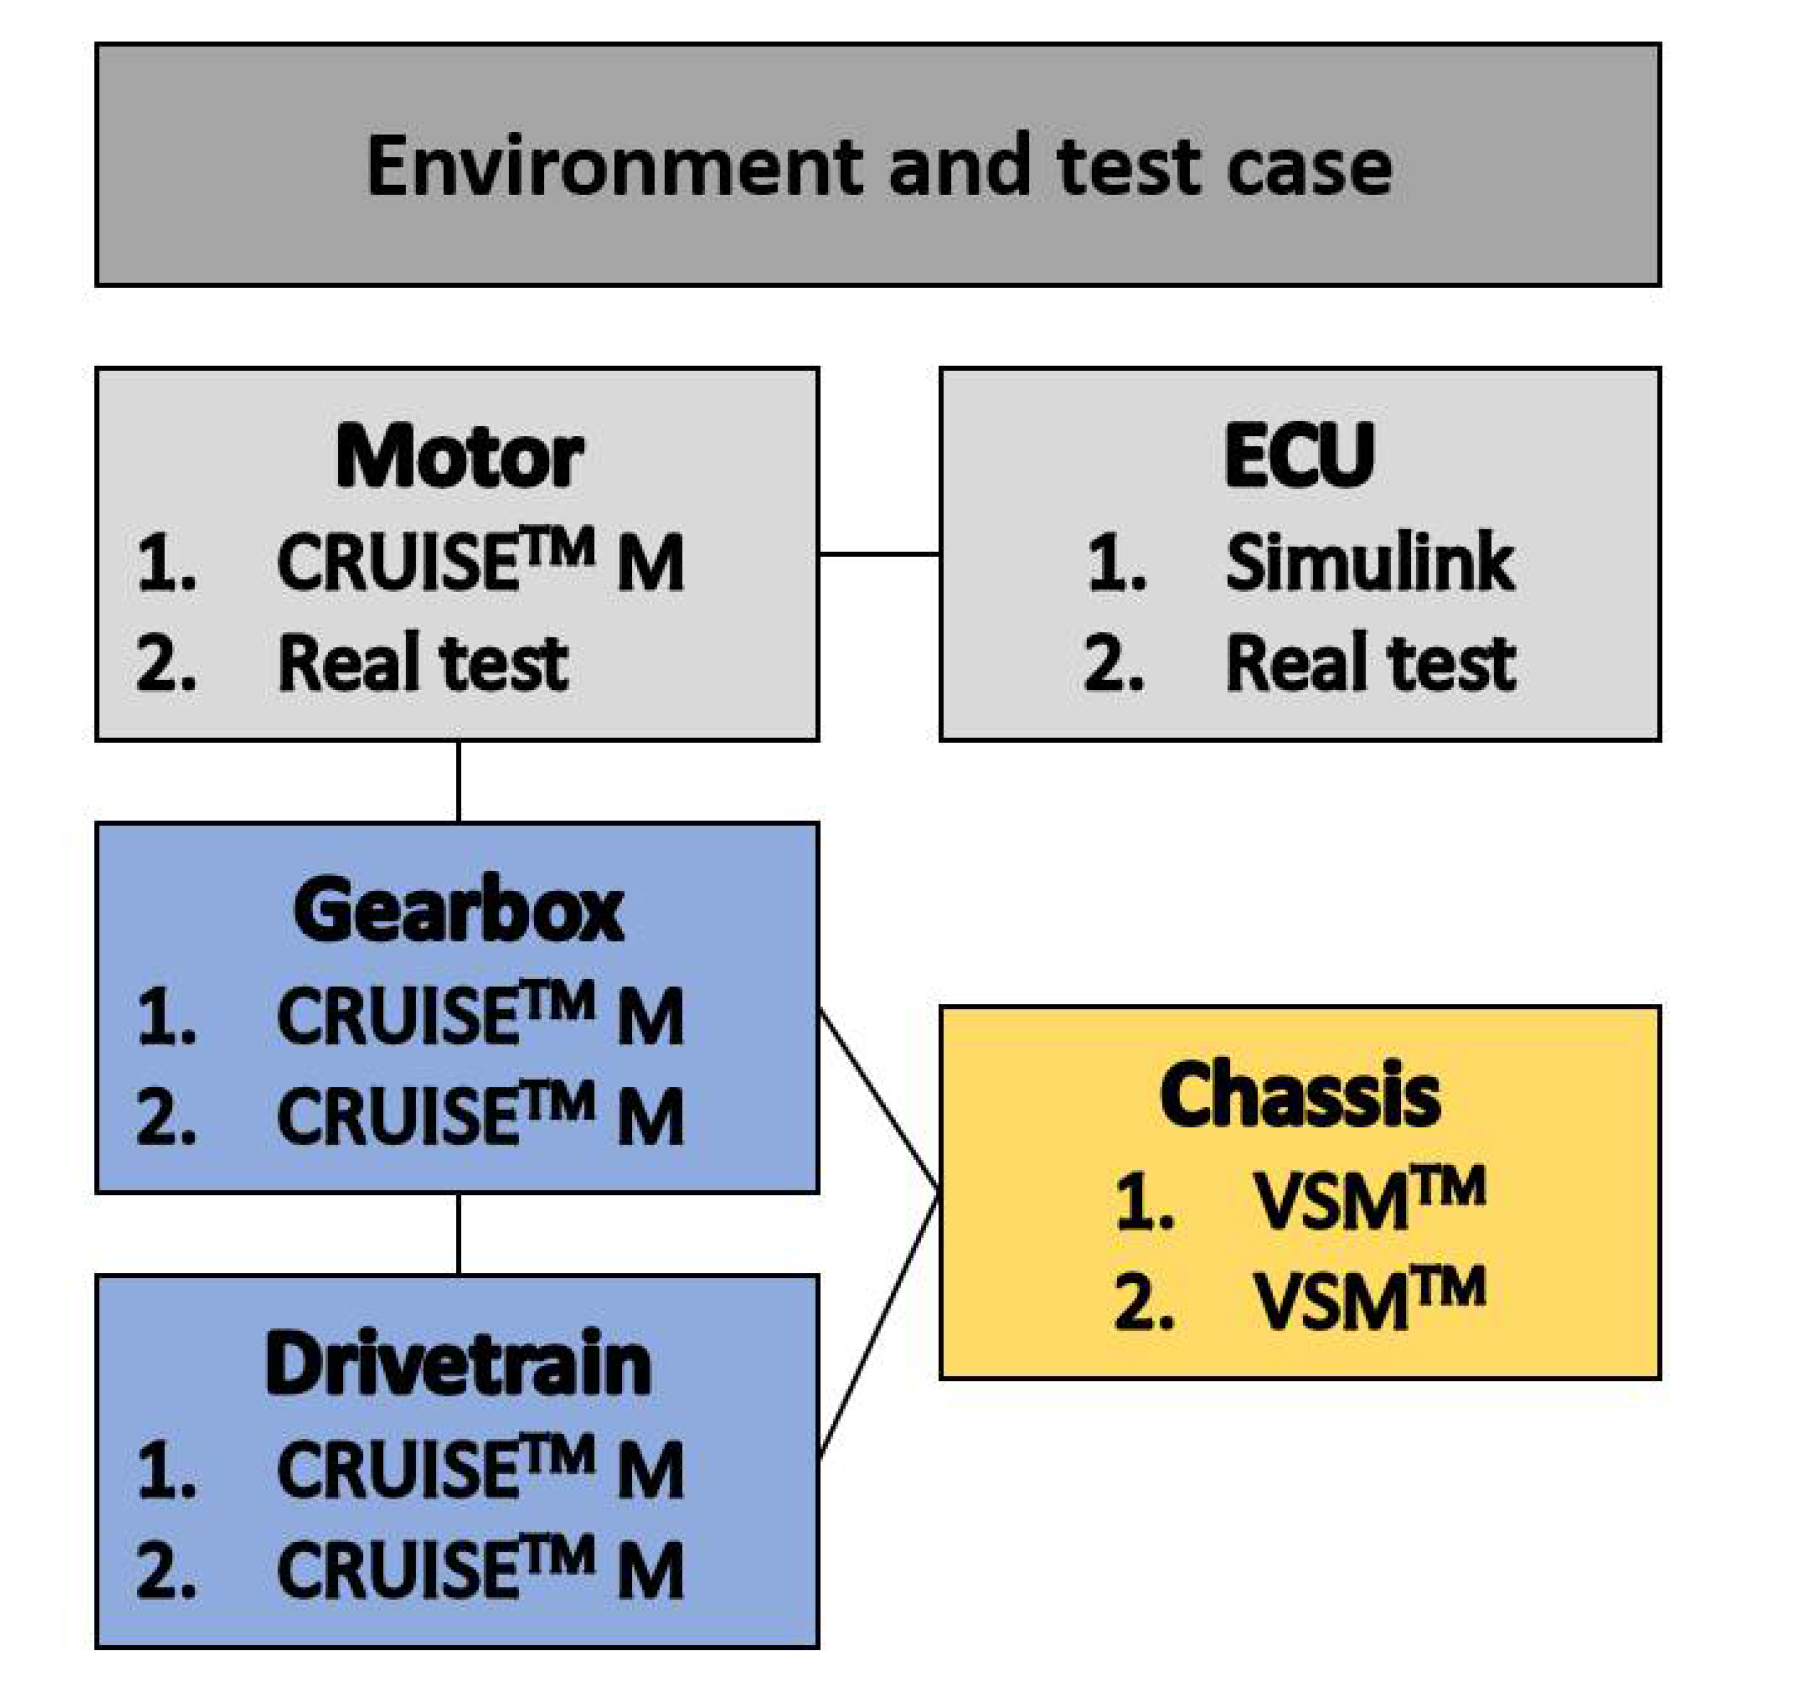
For a holistic approach regarding the V-model, the AVL eSUITE™ provides the basis for a topology of different types of virtual, real-time prototype testing if AVL VSM
TM (AVL VSM
TM, AVL List GmbH, Graz, Austria) is linked up with AVL CRUISE
TM M [
27].
The topology of the virtual prototype can represent a virtual vehicle by using both programs and the “AVL Model.CONNECTTM” interface. In the first implementation level, both simulations are used to test the control of the ECU. This type of testing is called “software in the loop”, as virtual systems are used to test dynamic vehicle control. In this case, the ECU is replaced by a model generated in “MATLAB-Simulink” (Simulink, MathWorks, Inc., Natick, MA, USA). This implementation level is used to develop the torque vectoring for the new race car.
In the second implementation stage, the virtual models of the motor and the ECU are replaced by real components. This offers the possibility to test the application of the components on the test bench before the vehicle is completed and to adjust it to the components in the best possible way (
Figure 12, based on [
27]). This testing method is known as “hardware in the loop”. It would also be possible to test the planetary gearbox with virtual driving profiles resulting from the model coupling.
9. Conclusions and Outlook
For combustion vehicles two dominant design variants can be identified:
single-engine in front, camshaft in a longitudinal direction, rear-wheel drive and
single-engine in front, camshaft in transverse direction front-wheel drive.
For electrical drive-trains, no clearly dominant design variants are obvious yet; maybe they will not appear because of lower physical restrictions. A holistic analysis-synthesis cycle of an electrical drive-train consequently has to enable a topological multitude in order to enhance the possibility to approach an optimum for a given set of requirements. This paper presents such a kind of analysis-synthesis cycle taking into account the current developments in the field of MBSE as well as simulation approaches. The main goal was the development and optimization of an electric drive-train. This task can be considered as accomplished; the Formula Student Team Weingarten will compete in the Formula Student Electric (FSE) category in the 2021 season with an electric powertrain based on these results and findings.
By employing extensive simulation, valuable insights into various components of the powertrain have been generated. For example, the design of the electrical components, such as the battery, could be verified, the mechanical components, for example, the planetary gearbox, could be optimized in terms of efficiency and performance, and finally, the fundamentals of the drive controller could be determined. The critical constituents identified during an FMEA were analyzed in detail. This was accompanied by a lap time simulation and a validation based on competitor analysis.
In the future, the lap time simulation can be used to evaluate numerous vehicle parameters regarding the entire drive-train performance and its influence on the lap time. Further research will aim to extend the linking of the different levels of the V-model possible at one software manufacturer using the design languages and DC 43 to other simulation tools from other manufacturers through FMI interfaces. This could lead to an automated and intelligent multidimensional product design.
Author Contributions
Conceptualization, S.S. (Sven Schumacher), S.S. (Stefan Schmid), P.W., R.S., and M.T.; methodology, S.S. (Sven Schumacher) and R.S.; design and dimensioning, S.S. (Sven Schumacher); simulation, S.S. (Sven Schumacher), S.S. (Stefan Schmid) and P.W.; analysis and evaluation, S.S. (Sven Schumacher); writing—original draft preparation, S.S. (Sven Schumacher) and R.S.; writing—review and editing, S.S. (Stefan Schmid), P.W. and M.T. All authors have read and agreed to the published version of the manuscript.
Funding
As a part of this research project, a master thesis was realized, which was supported by the Stifterverband für die Deutsche Wissenschaft e.V. (Donors’ association for the promotion of humanities and sciences in Germany) fellowship “Master LAB #THENEWNORMAL”.
Institutional Review Board Statement
Not applicable.
Informed Consent Statement
Not applicable.
Data Availability Statement
The data presented in this study are available on request from the corresponding author.
Acknowledgments
The authors wish to thank the administrative and technical staff of Ravensburg-Weingarten University (RWU), for the continuous support of the formula student team and all involved students for their immense contribution, see
https://www.fsteamweingarten.de/ (accessed on 19 July 2021).
Conflicts of Interest
The authors declare no conflict of interest.
References
- PwC. Digital Auto Report 2020: Volume 1. Available online: https://www.strategyand.pwc.com/de/de/studie/2020/digital-auto-report-2020.html (accessed on 20 May 2021).
- VDI/VDE 2206—Entwurf. Entwicklung Cyber-Physischer Mechatronischer Systeme (CPMS); Beuth: Berlin, Germany, 2020. [Google Scholar]
- Gräßler, I.; Hentze, J. The new V-Model of VDI 2206 and its validation. at-Automatisierungstechnik 2020, 68, 312–324. [Google Scholar] [CrossRef]
- Lu, J.; Chen, D.; Wang, G.; Kiritsis, D.; Törngren, M. Model-Based Systems Engineering Tool-Chain for Automated Parameter Value Selection. IEEE Trans. Syst. Man Cybern. Syst. 2021, accepted for inclusion. Available online: https://ieeexplore.ieee.org/stamp/stamp.jsp?arnumber=9328223 (accessed on 20 July 2021).
- Shaked, A.; Reich, Y. Using Domain-Specific Models to Facilitate Model-Based Systems-Engineering: Development Process Design Modeling with OPM and PROVE. Appl. Sci. 2021, 11, 1532. [Google Scholar] [CrossRef]
- Gräßler, I.; Ole, C.; Scholle, P. Method for Systematic Assessment of Requirement Change Risk in Industrial Practice. Appl. Sci. 2020, 10, 8697. [Google Scholar] [CrossRef]
- Walden, D.D.; Roedler, G.J.; Forsberg, K.; Hamelin, R.D.; Shortell, T.M. Systems Engineering Handbook: A Guide for System Life Cycle Processes and Activities, 4th ed.; Wiley: Hoboken, NJ, USA, 2015. [Google Scholar]
- Pottebaum, J.; Gräßler, I. Informationsqualität in der Produktentwicklung: Modellbasiertes Systems Engineering mit expliziter Berücksichtigung von Unsicherheit. Konstruktion 2020, 72, 76–83. [Google Scholar] [CrossRef]
- Laing, C.; David, P.; Blanco, E.; Dorel, X. Questioning integration of verification in model-based systems engineering: An industrial perspective. Comput. Ind. 2020, 114, 103163. [Google Scholar] [CrossRef]
- Darpel, S.; Beckman, S.; Ferlin, T.; Havenhill, M.; Parrot, E.; Harcula, K. Method for tracking and communicating aggregate risk through the use of model-based systems engineering (MBSE) tools. J. Space Saf. Eng. 2020, 7, 11–17. [Google Scholar] [CrossRef]
- Gräßler, I.; Wiechel, D.; Pottebaum, J. Role model of model-based systems engineering application. Mater. Sci. Eng. 2021, 1097, 012003. [Google Scholar]
- Pfeifer, S.; Seidenberg, T.; Jürgenhake, C.; Anacker, H.; Dumitrescua, R. Towards a modular product architecture for electric ferries using Model-Based Systems Engineering. Procedia Manuf. 2020, 52, 228–233. [Google Scholar] [CrossRef]
- Rudolph, S. Übertragung von Ähnlichkeitsbegriffen. Habilitationsschrift, Fakultät Luft- und Raumfahrttechnik und Geodäsie. Habilitation Thesis, Universität Stuttgart, Stuttgart, Germany, 2002. [Google Scholar]
- IILS mbH. Design Compiler 43. Available online: https://www.iils.de (accessed on 4 May 2021).
- Holder, K.; Zech, A.; Ramsaier, M.; Stetter, R.; Niedermeier, H.P.; Rudolph, S.; Till, M. Model-Based Requirements Management in Gear Systems Design Based on Graph-Based Design Languages. Appl. Sci. 2017, 7, 1112. [Google Scholar] [CrossRef] [Green Version]
- Elwert, M.; Ramsaier, M.; Eisenbart, B.; Stetter, R. Holistic Digital Function Modelling with Graph-Based Design Languages. In Proceedings of the Design Society: International Conference on Engineering Design; Cambridge University Press: Cambridge, UK, 2019; Volume 1, pp. 1523–1532. [Google Scholar] [CrossRef] [Green Version]
- Stetter, R. Approaches for Modelling the Physical Behavior of Technical Systems on the Example of Wind Turbines. Energies 2020, 13, 2087. [Google Scholar] [CrossRef]
- Holder, K.; Schumacher, S.; Friedrich, M.; Till, M.; Stetter, R.; Fichter, W.; Rudolph, S. Digital Development Process for the Drive System of a Balanced Two-Wheel Scooter. Vehicles 2021, 3, 3. [Google Scholar] [CrossRef]
- Formula Student Germany GmbH. Formula Student Rules 2020 Version 1.0. Available online: https://www.formulastudent.de/fsg/rules/ (accessed on 13 February 2021).
- Trzesniowski, M. Rennwagentechnik:Grundlagen, Konstruktion, Komponenten, Systeme; ATZ/MTZ-Fachbuch; Springer Vieweg: Wiesbaden, Germany, 2014. [Google Scholar]
- Pischinger, F.; Adomeit, P.; Dorenkamp, R.; Schindler, K.-P.; Baar, R.; Gumpoltsberger, G.; Greiner, J.; Sasse, C.; Steinel, K.; Lanzer, H.; et al. Antriebe. In Vieweg Handbuch Kraftfahrzeugtechnik; Braess, H.H., Seiffert, U., Eds.; ATZ/MTZ-Fachbuch; Springer Vieweg: Wiesbaden, Germany, 2013; p. 213. [Google Scholar] [CrossRef]
- Morche, D.; Schmitt, F.; Genuit, K.; Elsen, O.; Kampker, A.; Deutskens, C.; Heimes, H.H.; Swist, M.; Maue, A.; vom Hemdt, A.; et al. Fahrzeugkonzeption für die Elektromobilität. In Elektromobilität:Grundlagen einer Zukunftstechnologie; Kampker, A., Vallée, D., Schnettler, A., Eds.; Springer Vieweg: Wiesbaden, Germany, 2018; pp. 181–277. [Google Scholar] [CrossRef]
- Naunheimer, H.; Bertsche, B.; Ryborz, J.; Novak, W.; Fietkau, P. Systematik der Fahrzeuggetriebe: Konstruktive Grundkonzepte. In Fahrzeuggetriebe:Grundlagen, Auswahl, Auslegung und Konstruktion, 3rd ed.; Naunheimer, H., Bertsche, B., Ryborz, J., Novak, W., Fietkau, P., Eds.; Springer: Berlin/Heidelberg, Germany, 2019; pp. 139–273. [Google Scholar] [CrossRef]
- Colla, A.; Katrašnik, T.; Walter, K.; Diwoky, F. Battery-electric vehicle efficiency potential assessment and thermal aging investigation. In Der Antrieb von Morgen 2017; Liebl, J., Ed.; Springer Vieweg: Wiesbaden, Germany, 2017. [Google Scholar] [CrossRef]
- Erhard, S.V. Mehrdimensionale Elektrochemisch-Thermische Modellierung von Lithium-Ionen-Batterien. Dissertation, Technischen Universität Münche, München, 2017. Available online: https://mediatum.ub.tum.de/doc/1338266/1338266.pdf (accessed on 20 April 2017).
- Siebertz, K.; van Bebber, D.; Hochkirchen, T. Optimierung. In Statistische Versuchsplanung:Design of Experiments; Siebertz, K., van Bebber, D., Hochkirchen, T., Eds.; VDI-/Buch; Springer: Berlin/Heidelberg, Germany, 2010; pp. 225–245. [Google Scholar] [CrossRef]
- Puntigam, W.; Zehetner, J.; Lappano, E.; Krems, D. Integrated and Open Development Platform for the Automotive Industry. In Systems Engineering for Automotive Powertrain Development; Hick, H., Küpper, K., Sorger, H., Eds.; Powertrain; Springer: Berlin/Heidelberg, Germany, 2020; pp. 1–27. [Google Scholar] [CrossRef]
| Publisher’s Note: MDPI stays neutral with regard to jurisdictional claims in published maps and institutional affiliations. |
© 2021 by the authors. Licensee MDPI, Basel, Switzerland. This article is an open access article distributed under the terms and conditions of the Creative Commons Attribution (CC BY) license (https://creativecommons.org/licenses/by/4.0/).


