Article

Assessment of Metabolic Adaptations in Periparturient Dairy Cows Provided 3-Nitrooxypropanol and Varying Concentrate Proportions by Using the GreenFeed System for Indirect Calorimetry, Biochemical Blood Parameters and Ultrasonography of Adipose Tissues

1
Institute of Animal Nutrition, Friedrich-Loeffler-Institut (FLI), Federal Research Institute for Animal Health, 38116 Braunschweig, Germany
2
Institute of Animal Nutrition, Martin Luther University Halle-Wittenberg, 06120 Halle (Saale), Germany
*
Author to whom correspondence should be addressed.
Dairy 2022, 3(1), 100-122; https://doi.org/10.3390/dairy3010009
Submission received: 22 September 2021 / Revised: 26 November 2021 / Accepted: 29 November 2021 / Published: 3 February 2022

Abstract

:
Methanogenesis in ruminants contributes to both greenhouse gas emissions and feed energy losses whereby the latter becomes specifically important in energy-deficient periparturient cows. It was hypothesized that increased concentrate feed proportions (CFP) and feeding with the methane inhibitor 3-nitrooxypropanol (3-NOP), as well as their potential synergism, improve the energy status of peripartal cows. Periparturient dairy cows were fed low or high dietary CFP either tested without or combined with 3-NOP. The GreenFeed system was used to calculate the metabolic respiration quotient (RQmetabolic) and tissue energy retention (ERtissue) by methods of indirect calorimetry. The calorimetrically estimated ERtissue coincided with a conventionally calculated energy balance except for the antepartal period. Neither CFP nor 3-NOP affected the ultrasonographically assessed lipomobilization in adipose depots. In the group fed 3-NOP and a high concentrate feed proportion, the RQmetabolic significantly rose over the course of the experiment and the ERtissue was also increased. Serum non-esterified fatty acid concentrations were lower in the 3-NOP groups albeit ß-hydroxybutyrate (BHB) remained unaffected. Higher CFP reduced BHB and increased blood glucose levels. In conclusion, 3-NOP and high CFP improved the energy budget of the cows in an interactive manner, which was, however, not apparent in all of the examined parameters. The application of the GreenFeed system for indirect calorimetry is a promising approach, which needs further validation in the future.

1. Introduction

In ruminants, feed is mainly converted to volatile fatty acids (VFA) by the rumen microbiota, thereby yielding hydrogen (H2) and carbon-dioxide (CO2), which are redirected to methane (CH4) formation in methanogenic archaea [1]. 3-nitrooxypropanol (3-NOP), a structural analogue of methyl-coenzyme M, is currently supposed to be one of the most potent CH4 inhibitors in cattle [2,3]. The CH4-mitigating effect of 3-NOP potentially amounts to 39.0 ± 5.40% in dairy cows [4] but ranges widely from 7 [5] to 60% [6] depending on the provided ration type (neutral-detergent fibre (NDF) content), administration technique (mixing in with the total-mixed ration (TMR), infusion, pulse-dose) and dosage level [4].
Besides the ecological benefits of reducing greenhouse gas emissions from ruminant livestock [7], CH4 mitigation is assumed to improve feed energy efficiency as up to 12% of the gross energy intake (GEI) can be lost by methanogenesis in the bovine rumen [8]. Furthermore, both increased dietary concentrate feed proportion (CFP) [9] and 3-NOP [4] were observed to shift rumen fermentation to H2-consuming propionic-metabolic typed pathways [4,9] which could increase the hepatic supply of glucogenic precursors [10], with this being specifically advantageous in periparturient cows. Hence, transitional dairy cows metabolically adapt to the negative energy balance (EB), which is the disparity between energy intake and requirements for maintenance and lactogenesis, by induction of an accelerated lipolysis in adipose tissue (AT) depots [11]. Subsequently, the massive hepatic influx of non-esterified fatty acids (NEFA) risks a metabolic overload of the hepatic capacity for NEFA oxidation, which results in increased ketone body synthesis and predisposition of the cow to hyperketonaemia and hepatic lipidosis [11,12].
Reynolds et al. [5] identified a decreased total EB and increased heat production (HP) when energy metabolism was expressed as a percentage of digested energy in dairy cows supplemented with 2500 mg of 3-NOP per day. In contrast, van Gastelen et al. [13] reported that HP and energy retention in body fat and protein remained unaffected in 16 early-lactation dairy cows supplemented with 51 mg of 3-NOP/kg dry matter (DM). Correspondingly, energy allocation to body weight gain (BWG), representing a positive EB at the tissue level, was observed to be either increased [2,13] or not affected in 3-NOP-fed dairy cows, as reported by Haisan et al. [14] and in the accompanying manuscript [15]. 3-NOP was comprehensively reported to exert no influence on energy expenditure (EE) for milk production [16] even though varying 3-NOP effects on milk composition were published [13,16,17]. However, the effects on milk ingredients were attributed to the aforementioned 3-NOP-induced shift in the rumen fermentation pattern toward a decreased acetate–propionate ratio [18] rather than being associated with alterations in post-ruminal energy metabolism [17]. Accordingly, excessive accumulation of NEFA and ß-hydroxybutyrate (BHB) in blood, being indicative of a severe negative EB [19], were not affected in early- [20] and mid-lactating [14] 3-NOP-supplemented cows.
However, there is a gap in the knowledge of the energy turnover at the tissue level and intermediary pools of correspondingly regulated blood metabolites in cows provided varying CFP combined with 3-NOP in their rations during the periparturient period. Gas exchange measurements of CO2 production and O2 consumption in dairy cows are commonly measured in the respiration chamber (RC), which is often referred to as the ‘gold-standard’ technique. These gas measurements allow for an indirect calorimetric estimation of the HP and the total (RQtotal) and metabolic (rumen fermentation corrected) respiration quotient (RQmetabolic). The RQtotal mirrors the whole animal metabolism including feed nutrient degradation in the rumen, whereby the RQmetabolic rather reflects the intermediary oxidation of specific macronutrients and, therefore, dynamics in physiological and nutritional adaptations [21]. Accordingly, RQmetabolic values of 1.0 mirror a prevailing carbohydrate oxidation whereas those of fat oxidation and deposition amount to 0.71 and above 1.0, respectively. Protein oxidation is associated with RQmetabolic values of 0.81 [22]. However, the costly gas quantification in RC restricts the cow’s normal behaviour and only allows the measurement of small animal numbers over short-term periods [23]. Therefore, the present approach aimed to use spot gas flux measurements of CH4, CO2 and O2 from the open-circuit GreenFeed (GF) system (C-Lock Inc., Rapid City, SD, USA) for the indirect calorimetric estimation of EE for maintenance, production and energy retention in body tissues (ERtissue) in periparturient dairy cows provided 3-NOP and varying CFP in the ration. This assessment of cow energetics was accompanied by an ultrasonic-based estimation of lipomobilization from AT depots in concert with frequent blood sampling for analyses of energy-related metabolites.
It was hypothesized that increased glucogenic propionate [15] and energy spared from methanogenesis due to feeding 3-NOP in combination with high CFP caused a surplus of energy being utilized to cope with the negative EB in periparturient dairy cows, which was reflected by the decreased lipomobilization from AT depots and serum concentrations of NEFA and BHB.

2. Materials and Methods

The experiment was carried out at the experimental station of the Institute of Animal Nutrition, Friedrich-Loeffler-Institut (FLI) in Brunswick, Germany in accordance with the German Animal Welfare Act and approved by the LAVES (Lower Saxony State Office for Consumer Protection and Food Safety, Oldenburg, Germany) (33.19-42502-04-15/1858).

2.1. Experimental Design

The presented investigations are part of a comprehensive experiment: the fundamental experimental design, CH4 and CO2 emissions, dry matter intake (DMI), rumen VFA, BW measures, EB according to the ‘Gesellschaft für Ernährungsphysiologie’ (GFE) [24] (EBGFE), milk performance parameters and feed efficiency are presented in Schilde et al. [15]. During the present experiment, 55 pluriparous German Holstein cows were assigned to four groups according to a 2 × 2-factorial design. In this context, treatments of low (LC) or high (HC) CFP were tested without supplements (CONLC (n = 14), CONHC (n = 15)), or combined with 3-NOP (DSM Nutritional Products AG, Kaiseraugst, Switzerland) (NOPLC, 48.4 mg/kg dry matter (DM) (n = 14); NOPHC, 51.2 mg 3-NOP/kg DM (n = 12)) in the ration from d 28 ante-partum (a.p.) until d 120 post-partum (p.p.). The whole experimental period (d 28 a.p. until d 120 p.p.) was split into three periods, namely the ante-partum (Per 1: d 28 a.p. until parturition) and post-partum (Per 2: d 1 until d 28 p.p.) phase of the transition period and the early-lactation period (Per 3: d 29 until d 120 p.p.) in order to compare metabolic and respiratory changes assessed by indirect calorimetry with energy expenditures and supply between the different periods. The experimental groups were balanced for calculated date of calving, 4% fat-corrected milk yield (FCM) in their previous lactation (6207 ± 1248 kg; mean ± SD), body condition score six weeks ante-partum (a.p.) (3.3 ± 0.4) and number of lactations (3.0 ± 1.1). The cows were housed in a free stall barn with high bed cubicles and slatted floor. Three cows out of the initial 58 did not complete the trial (two cases of abomasal displacement and one case of necrotising endometritis in the NOPLC group). Ten out of the 55 cows were cannulated (three cows in each of the 3-NOP and two cows in each of the CON groups). During the a.p. period, CFP amounted to 15% for LC and 40% for HC groups. Starting from the day of parturition until d 21 p.p., a gradual increase in CFP from 30 to 55%, where it remained until the end of the experiment, was scheduled in HC groups. In LC groups, CFP was fixed at 30% from the day of parturition until termination of the trial. The target CFP was administered by computerized self-feeding stations.
Cows were offered a partial mixed ration (PMR) for ad libitum intake in weighing troughs (type RIC, Insentec B.V., Marknesse, the Netherlands) which was composed of 70% maize silage, 20% grass silage and 10% of a pelletized concentrate including either 3-NOP or the placebo (DM basis). Further 3-NOP compound was incorporated into pelletized concentrates, which was provided by the concentrate feeders to adjust the aforementioned 3-NOP target concentration. This two-way method of supplementing concentrate pellets, including 3-NOP via mixing with the PMR and the concentrate feeders, facilitated the regulation of 3-NOP target consumption and the 3-NOP supply synchronously to the meal event [15]. The CONLC and CONHC groups received a placebo in the concentrate feed pellets that contained propylene glycol, with SiO2 also being part of the 3-NOP supplement.

2.2. Sample Collection

The DMI of the PMR and concentrates was continuously monitored by the computerized weighing troughs and concentrate feeders. Concentrates and PMR were sampled once and twice a week and pooled to collective samples of four-week periods, respectively.
Continuously from d 28 a.p. until d 120 p.p., gas samples were collected from the exhaust air pipe to measure gas mass fluxes (g/d) of O2 consumption and CH4 and CO2 emissions using the GF system (C-Lock Inc., Rapid City, SD, USA) as described previously [15].
Rectal temperature was measured each time before blood sampling. Blood samples were taken by puncturing a Vena jugularis externa at d 28, 14, 7, 3 a.p. and d 1, 3, 7, 14, 21, 28, 35, 49, 73, 98, and 120 p.p. after morning milking using heparinized sample syringes (Werfen GmbH, Kirchheim, Germany) and serum tubes. Serum tubes were allowed to clot for 30 min at 303 K, were subsequently centrifuged (Heraeus Varifuge 3.0R Heraeus Instruments GmbH, Hanau, Germany; 2123× g, 288 K, 15 min), and separated serum was stored at −80 °C until further analyses were conducted.
According to Raschka et al. [25], ultrasonic measurements (UM) of fat layer thickness in millimetres were conducted in duplicate at the seven topographic points on the right side of the cow at d 3 and 28 p.p. with the use of a Mindray M5 Vet (Mindray, Shenzhen, China) diagnostic ultrasound system equipped with a linear (6 MHz, Mindray 6LE5Vs) and a convex probe (3 MHz, Mindray 3C5s). The description of the seven topographic measurement points was detailed in Schäfers et al. [26].

2.3. Analyses

Samples of concentrates and PMR components were dried for 72 h at 55 °C, ground to pass a 1-mm screen (SM 1, Retsch GmbH, Haan, Germany) and analysed for chemical composition according to the standard methods published by the Association of German Agricultural Analysis and Research Centers [27]. The chemical composition of the experimental diets is illustrated in Table 1. The 3-NOP contents in concentrate feed samples were analysed by DSM Nutritional Products AG, Kaiseraugst, Switzerland.
Gas samples and background gases were analysed by the already installed GF sensors. CH4 and CO2 concentrations were analysed by non-dispersive infrared absorption sensors and O2 was analysed using a paramagnetic sensor. Sensor calibration was performed automatically on a daily basis using a zero (O2 = 200,000 mg/kg, N2 = 800,000 mg/kg) and a span gas (CH4 = 1004 mg/kg, CO2 = 10,000 mg/kg, O2 = 210,000 mg/kg H2 = 9.50 mg/kg, H2S = 9.80 mg/kg, while the remainder of the gas was nitrogen). The air velocity in the pipe was measured by an anemometer to determine total mass flow of all gases. CO2 recovery tests were conducted once a month (recovery rate ± SD: 101% ± 5.7). The amount of bait feed delivered per feed drop was calibrated on a weekly basis.
Serum samples were photometrically analysed (Indiko Plus, Thermo Scientific GmbH, Dreieich, Germany) for concentrations of BHB, NEFA, triacylglycerides (TAG) and glucose. An automated blood gas and electrolyte analyser (GEM Premier 4000, Werfen GmbH, Kirchheim, Germany) was used to determine the temperature-corrected pH, hydrogen carbonate ions, haemoglobin and lactate concentrations immediately after sample collection.

2.4. Calculation of Energy Metabolism Parameters by Indirect Calorimetry and Ultrasonography

Processing and validation of gas exchange data were conducted by C-Lock Inc. Gas measurements were converted from g/d to L/d according to the gas density of 0.717 kg/m3 for CH4, 1.977 kg/m3 for CO2 and 1.729 g/m3 for O2 under standard conditions (1013.25 hPa). The cow´s visiting time and head position in the GF were used to check for data plausibility [31]. Daily means of GF data were averaged to weekly means using the previously described arithmetic averaging method [32]. Due to technical reasons, O2 consumption in CON groups was estimated from weekly means of CO2 production and DMI using the following regression equation:
O2 (g/d) = 2056 − 72.5 × dry matter intake (kg/d) + 0.62 × CO2 (g/d)
with R2 = 0.90 and a residual standard error (RSE) of 371 g/d on 337 degrees of freedom.
In ruminants, total CO2 production (VCO2) is the sum of fermentative (VCO2fermentative) and metabolic (VCO2metabolic) CO2 derived from microbial fermentation in the rumen and the intermediary metabolism, respectively [33]. A differentiation between the two is essential in order to refer to the intermediary substrate oxidation [34]. As proposed by Chwalibog et al. [33], VCO2fermentative was calculated by applying the stoichiometrically derived factor of 1.7, which was confirmed to be applicable for a variety of ration compositions [35].
VCO2fermentative (L/d) =1.7 × VCH4 (L/d)
Then, VCO2fermentative was subtracted from VCO2 to obtain VCO2metabolic, which was used to calculate the RQmetabolic mirroring the intermediary oxidation of the macronutrients of carbohydrates, fat and protein [36]:
RQmetabolic = VCO2metabolic (L/d) ÷ VO2 (L/d)
The total RQ (RQtotal = total VCO2 production (L/d) ÷ VO2 consumption (L/d)) reflected the cow´s nutritional plane. Gross energy (GE) content of the feedstuffs was calculated according to GfE [24]. The metabolizable energy (ME) content of the concentrates was derived from tabular values according to DLG [29] and that of silages was derived according to VDLUFA [27] analyses.
HP was quantified according to the Brouwer [22] formula:
HP (kJ) = 16.18 × VO2 (L/d) + 5.02 × VCO2 (L/d) − 2.17 × VCH4 (L/d) − 5.99 × NU (g/d),
whereby urinary nitrogen excretion (NU) was set to 50 g/d [37] even though the real NU in dairy cows varies between 75 and 150 g/d [38]. However, the NU contribution to HP is negligible and an error of about 0.3% in the absolute HP values was accepted [39].
Methane energy (CH4E; MJ/d) was derived from the multiplication of the energy equivalent value of 39.54 kJ/L of CH4 [22] and the daily CH4 production (L/d).
The partitioning of EE for energy retention (ER) was computed as follows:
ER in body tissues and milk (ERtotal) (MJ/d) = ME intake − HP
ER in body tissues (ERtissue) (MJ/d) = ME intake − HP − MEE − NEP
Analyses and calculations of milk energy excretion (MEE; MJ/d) according to GfE [24] were used from Schilde et al. [15]. Net energy demand for pregnancy (NEP; MJ/d) was averaged for period 1 according to constants proposed by GfE [24] with 13 MJ NEL/d for week 4 a.p. and 18 MJ NEL/d for week 3 a.p. until calving resulting in an average of 17 MJ NEL/d for period 1. The EBGFE data were extracted from Schilde et al. [15] in which EBGFE was calculated according to GfE [24].
The residual ER in body protein and intramuscular fat was assessed as:
ERresidual (MJ/d) = ERtissue − ERfat depot
ERfat depot was calculated from UM as described in the following:
ERfat depot (MJ/d) = daily mobilized fat depot masses (kg/d) × 39.8 (MJ/kg) × 0.84
The daily mobilization of fat depot masses from each AT depot was described by the difference in AT masses between d 3 p.p. and d 28 p.p. divided by the number of days. The energy release from mobilized fat depots being used for milk production was calculated based on the assumption that 1 g of body fat corresponds to 39.8 kJ of GE [22], whereby 16% is lost as heat energy when body tissue energy is used for milk synthesis [40].
Depot masses of each AT, namely the retroperitoneal (RAT), mesenteric (MAT) and omental (OAT), collectively referred as the visceral AT (VAT), and the subcutaneous AT (SAT) were estimated in kg from ultrasonographically measured distances of the different sites as described in Schäfers et al. [26] according to the following regression equations established by Raschka et al. [25]:
SAT = –6.66 + 0.72 × R12 + 0.31 × AW3c
RAT = −9.55 + 0.62 × R12 + 0.06 × KD3b
OAT = −2.32 + 0.55 × BFT + 0.37 × AW3b
MAT = −12.8 + 0.38 × AW1b + 1.73 × AW3b − 1.45 × AW3c + 0.07 × KD2c
VAT = RAT + OAT + MAT
The efficiency of utilization of ME for lactation (kl) was calculated according to AFRC [41]:
kl = (MEE + a × ERtissue)/(ME intake − MEm),
where MEE is adjusted to zero energy balance with a coefficient of a = 0.84 for negative ERtissue or a = 1/0.95 for positive ERtissue. ERtissue is the energy balance obtained by indirect calorimetry using the GreenFeed system. The maintenance requirement (MEm) was estimated using the equation from GfE [24]:
MEm (MJ/d) = 0.488 × BW0.75 (kg),
where BW0.75 is the metabolic body weight.

2.5. Statistical Analyses

Prior to statistical evaluation, means were calculated per cow and week for variables used in indirect calorimetry. A.p. blood samples were retrospectively assigned to the actual day relative to parturition by tolerating a deviation of 24 h for the d −3 sample and a deviation of 2 days for the d −7 and d −14 samples. Due to gas leakage through the fistula, cannulated cows were excluded from statistics except for blood and ultrasonic variables. The statistical analyses were conducted using the SAS software package (version 9.4; SAS Institute Inc., Cary, NC, USA) and a repeated measures mixed model (PROC MIXED) fitted by a restricted maximum likelihood [42]. The sequence of day, week of sampling or period (PER) was a repeated measure. 3-NOP, CFP, time relative to parturition and the interaction between them were set as fixed effects and each cow within treatment was set as a random effect. Data on indirect calorimetry and gas measurements were evaluated according to periods fixed at d 28 a.p. until parturition (period 1), d 1 until d 28 p.p. (period 2) and d 29 until d 120 p.p. (period 3). For clinical chemistry parameters, the autoregressive variance–covariance structure was selected based on the best fit according to the lowest Akaike Information Criterion and the result of the first measurement at d 28 before 3-NOP supplementation was regarded as a covariate. Parameters of indirect calorimetry and ultrasonic measurements were tested using a compound symmetry structure. Effects were regarded as statistically significant at p-values ≤ 0.05 and a trend was implied at p-values between 0.05 and 0.10. Multiple t-tests (PROC PDIFF) with Tukey-adjusted p-values were computed to evaluate significant means.
The R software package (version 3.6.1, R Foundation for Statistical Computing, Vienna, Austria) was used to calculate Pearson correlation coefficients and to perform linear regression of EBGFE and ERtissue data. Further, R was applied to estimate the O2 consumption in CON groups in a linear regression model, whereby significant independent variables and related regression coefficients were estimated in a forward stepwise manner.
The degree of agreement between both methods to estimate the energy balance (ERtissue and EBGFE) was assessed according to Bland and Altman [43]. The differences between EBGFE and ERtissue were plotted against the arithmetic mean of these pairs at each cow and period. The bias as the mean difference including a 95% confidence interval and the standard deviation (SD) of the differences were calculated. The lower and upper limits of agreement (LoA) were calculated (bias ± 1.96 SD) and used to define the range within which 95% of the differences lay. A regression line was plotted through the differences to detect changes in the bias depending on the magnitudes of the measurements themselves. The normality of differences was tested using the Shapiro–Wilk test in R.

3. Results

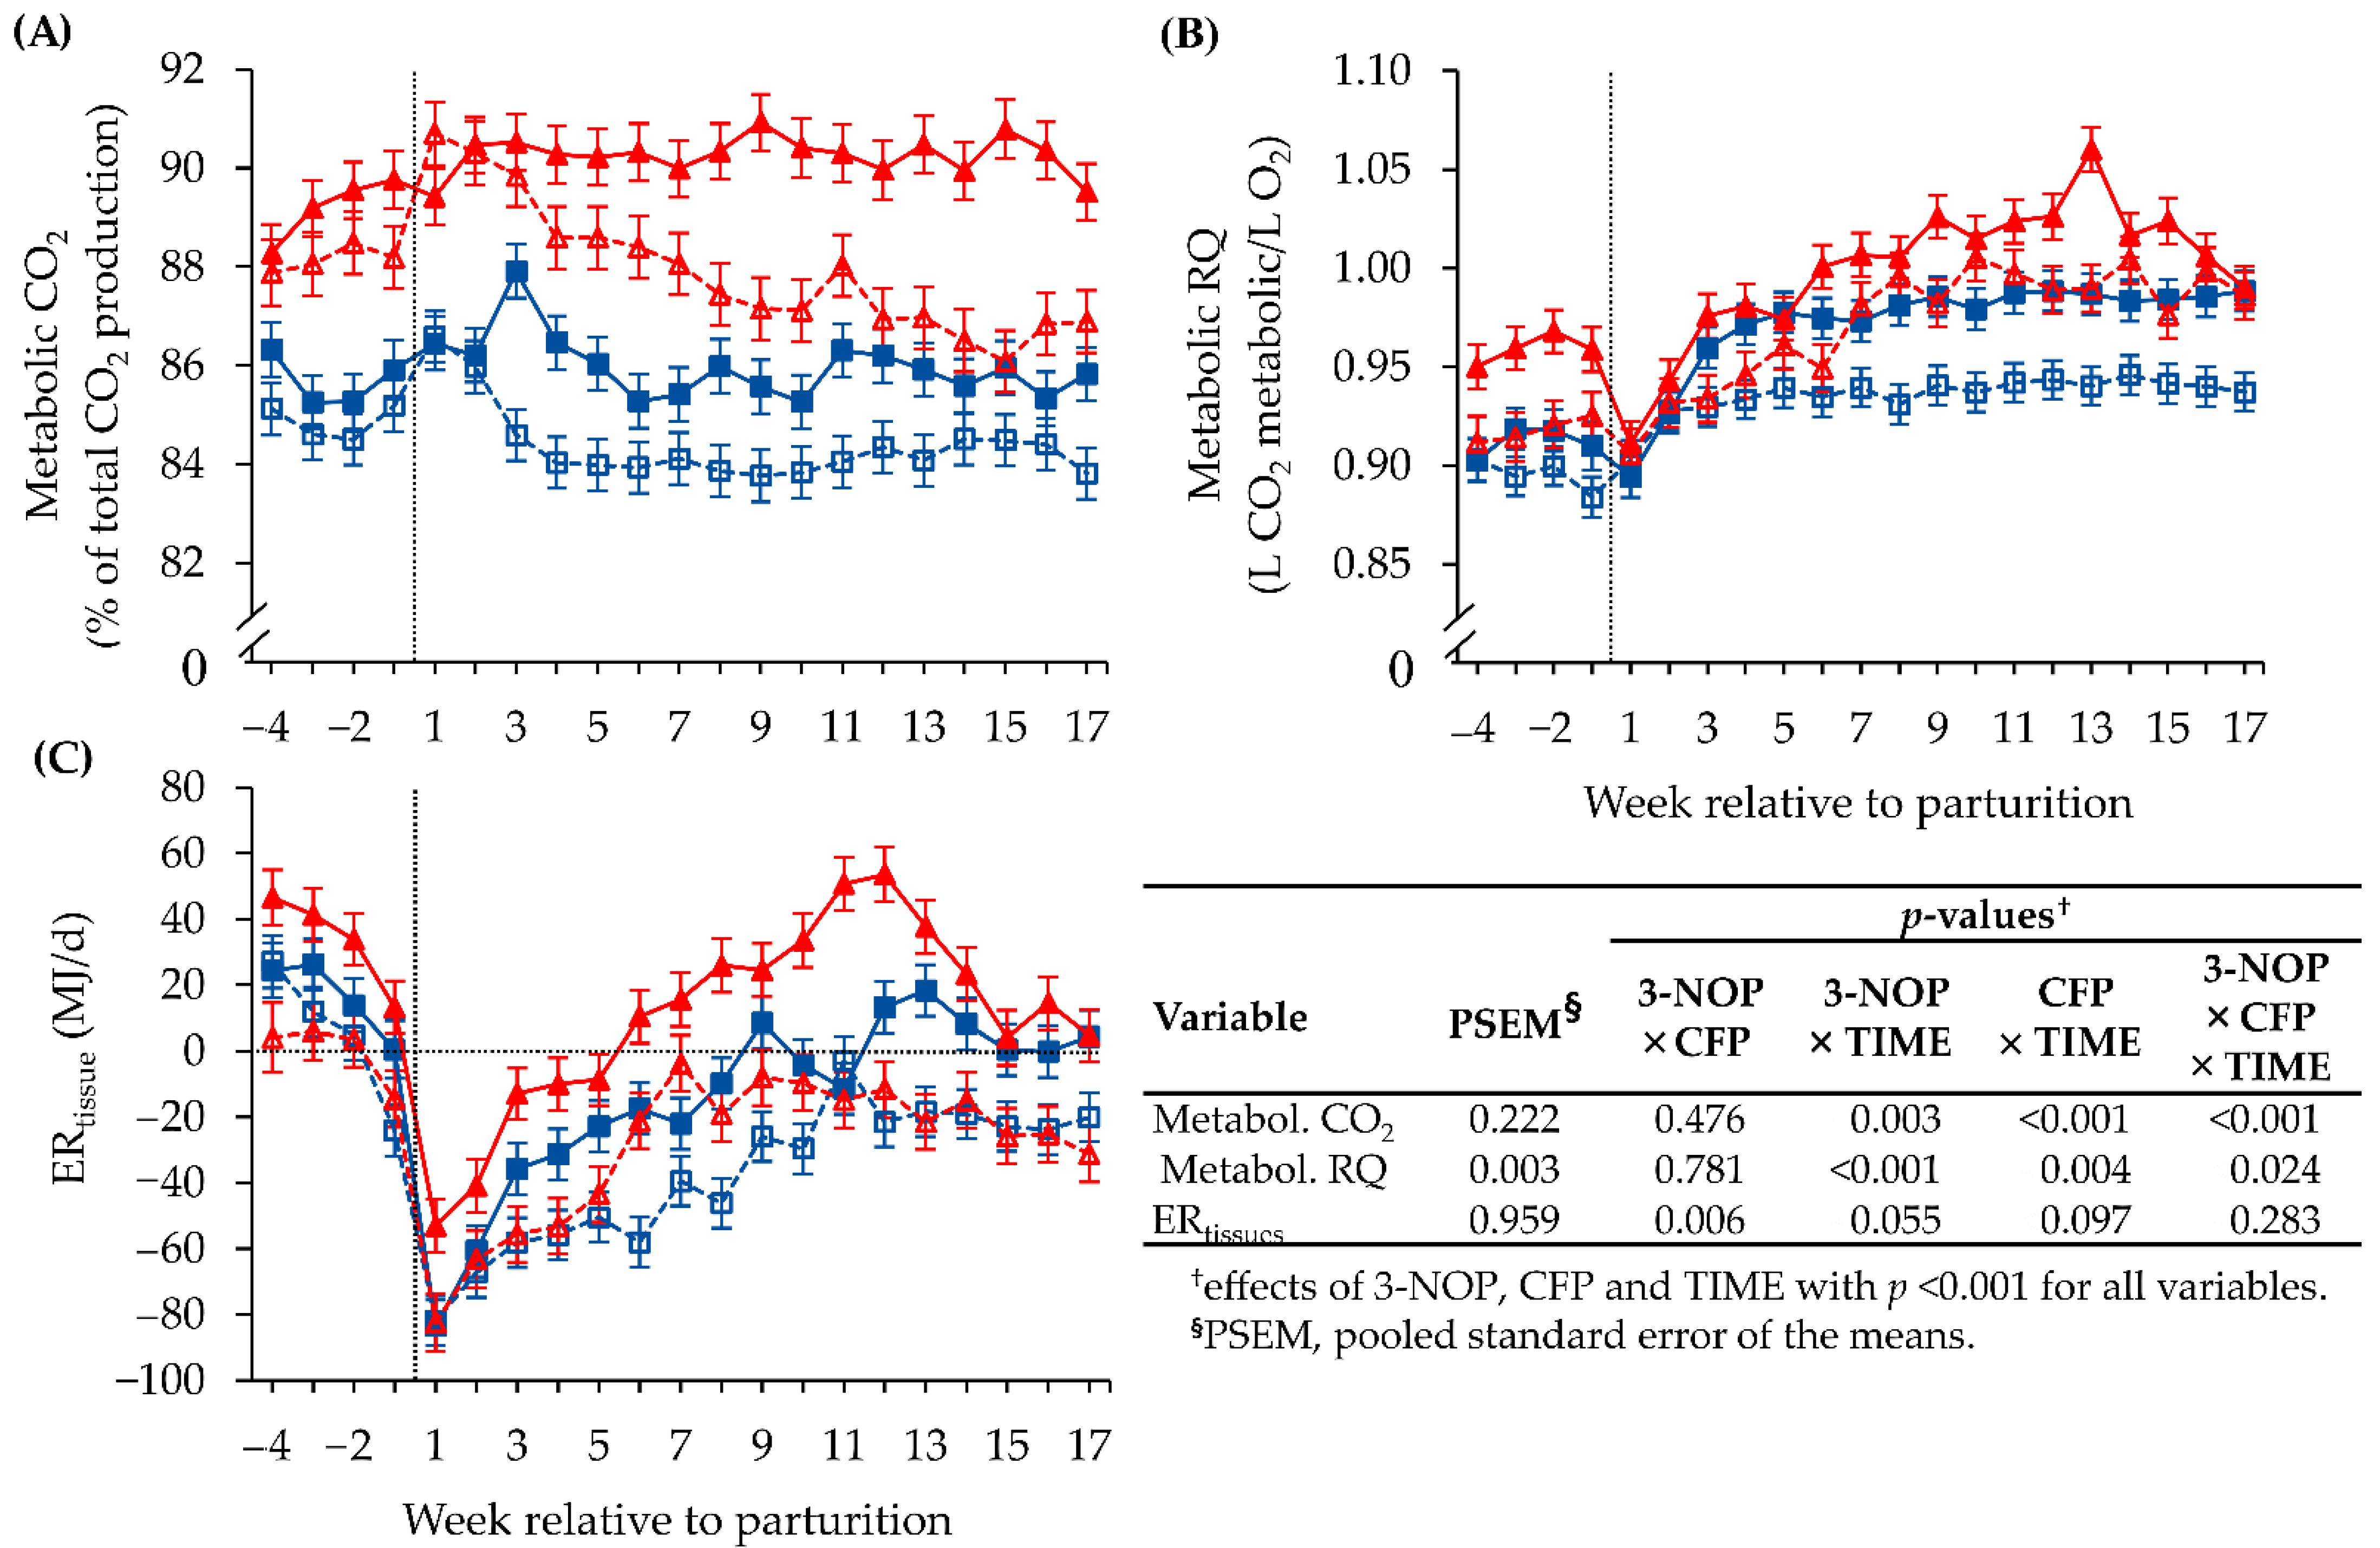
3.1. Methane Emission and Respiratory Gas Exchange Measured with the GreenFeed SYSTEM

Data on the emitted fermentation gases and metabolic respiratory gas exchange are presented in Table 2 while detailed dynamics of VCH4 and VCO2 emissions on a weekly basis are presented in Schilde et al. [15]. The VCO2metabolic expressed as a percentage of total VCO2 decreased after parturition until week 4 p.p. in the LC groups, as depicted in Figure 1A. VCO2metabolic in NOPLC continued to decline over the course of the experiment (Figure 1A; 3-NOP × CFP × PER; p < 0.001). The mean VCH4 over the three periods was reduced by 24.2% in NOPLC and 29% in NOPHC when compared to the respective CON group (Table 2). VCH4 increased from an average of 315 L/d in period 2 by 27.7% to 438 L/d in NOPLC and by 8% to 341 L/d in NOPHC in period 3 and, therefore, to a greater extent in the NOPLC than in the NOPHC group. VCH4 (L/d) positively correlated to VCO2 (L/d) (r = 0.67; p < 0.001; N = 917). Both VCH4 and VCO2 production (total and metabolic VCO2) decreased from the a.p. period to parturition but increased thereafter over the p.p. period, which was also the case for VO2 consumption (Table 2). In period 3, VCO2 and VCH4 emissions were affected by 3-NOP and the high CFP (Table 2; 3-NOP × CFP × PER; p < 0.001). Hence, VCO2 was significantly higher in CONHC, whereas VCH4 decreased, which was most apparent for NOPHC. VCO2 production was positively correlated to VO2 consumption (r = 0.92; p < 0.001; N = 915). VO2 consumption decreased in the 3-NOP groups over the course of the experiment (Table 2; 3-NOP × PER; p < 0.001), whereas CFP did not exert an influence. Both the RQtotal and RQmetabolic were affected by the 3-NOP × CFP × TIME interaction (Table 3; p < 0.001). The RQmetabolic markedly dropped from approximately 0.92 ± 0.03 during the a.p. period to its lowest point of 0.90 ± 0.007 in week 1 p.p. (Figure 1B; Table 2). Afterwards, the RQmetabolic increased to 0.99 in NOPLC and 0.94 in CONLC until week 4 p.p. and remained more or less constant. In contrast, the RQmetabolic continued to slightly increase to 1.01 in NOPHC and 0.98 in CONHC until week 9 p.p., respectively (Table 2; Figure 1B; 3-NOP × CFP × TIME; p = 0.024).

3.2. Energy Turnover Estimated by Indirect Calorimetric and Ultrasonic Methods

The parameters of BW0.75, GEI, metabolizable energy intake (MEI), EE and ER are presented in Table 3. GEI and MEI significantly increased in the HC groups by an average of 28% from period 1 to period 2 and by 31% up to period 3, whereas in the LC groups, GEI and MEI increased, on average, by 35% from period 1 to period 2 and by 23% up to period 3 (CFP × PER; p < 0.001). The experimentally intended gradual increase in energy intake resulted, during period 3, in significantly higher daily GE and ME uptakes in the HC groups, by about 0.4 MJ and 0.32 MJ/kg BW0.75 and d, respectively, when compared to the LC groups.
The 3-NOP × PER interaction (p < 0.001) of HP was driven by a decreasing HP from 3-NOP when compared to the CON groups in period 3 (Table 3). HP was positively correlated with MEI, which was not different between treatment groups (r = 0.37; p < 0.001; N = 895. During the course of the experiment, MEE decreased in the LC groups, whereas that of the HC groups increased (CFP × PER; p < 0.001). With regard to period 3, CH4E was lowest in NOPHC, in contrast with the NOPLC and the CON groups (3-NOP × CFP × PER; p < 0.001).
During the course of the experiment ERtotal and ERtissue increased with elevated CFP in the diet (Table 3; CFP × PER; p < 0.05). ERtissue was more positive in the NOPHC group over the experimental periods (Table 3; Figure 1C: 3-NOP × CFP; p = 0.006). ERtissue is shown on a weekly basis in Figure 1C and a sharp drop can be seen in ERtissue starting from the initiation of the trial until week 1 p.p., when the tissue energy balance was the most negative, independent of the experimental group (Figure 1C; TIME; p < 0.001). In all of the treatment groups, a continuous rise in ERtissue was observed from week 1 p.p. onwards, with this being the most distinctive in the HC groups (CFP; p < 0.001). In the NOPHC group, ERtissue reached a positive range in week 4 p.p. which was earlier when compared to CONHC (positive ERtissue from week 8 p.p.). In contrast, ERtissue in the LC groups remained in a negative range until termination of the trial.
The described group differences concerning the extent of energy retained in body tissues were, however, not recovered in the ERfat depot (Table 3; 3-NOP × CFP; p = 0.637) which was estimated ultrasonographically during period 2. The effect of time (Table A1; TIME; p < 0.001) was reflected by a decrease in each AT depot (Table 4). Irrespective of treatment group, the average lipomobilization from the visceral and subcutaneous AT of 0.69 kg of fat depot masses per day contributed to a daily energy release of about 177.5 kJ/kg BW0.75 and d being potentially utilizable for milk synthesis (Table 3). Correspondingly, back fat and rib fat thickness decreased, on average, by 0.14 and 0.15 cm/d, respectively (Table 4). In addition, the visceral fat deposit was mobilized to a larger extent when compared to the subcutaneous one (0.53 kg/d vs. 0.17 kg/d; Table 4).
Due to the described differences in ERtissue between groups but the missing effects of 3-NOP and CFP on depot fat mobilization from ultrasonic measurements, ERresidual was higher in the 3-NOP and HC groups (Table 3; 3-NOP; p = 0.058; CFP; p = 0.001).

3.3. Validation of the ERtissue Outcome of the GreenFeed Indirect Calorimetry Method

The EBGFE varied between experimental periods, which was similar to ERtissue (Table 3; PER; p < 0.001). In contrast to ERtissue, the EBGFE of the NOPHC group was more positive during each of the experimental periods when compared to the other treatment groups (Table 3; 3-NOP × CFP; p = 0.082). The Bland–Altman analysis (Figure 2A; mean bias of 70 kJ NEL/kg BW0.75 and d; p < 0.001 over all of the experimental periods) and the slope of the regression line of the linear relationship indicated that the EBGFE was estimated to be approximately 33% (Figure 2B) higher when compared to ERtissue. The slope of the regression line through the data points of differences was not significant (p = 0.756), indicating a constant bias over the experimental periods (Figure 2A). Nevertheless, greater differences between both methods with increasing magnitude of a positive energy balance can be visually identified regarding the a.p. period 1 (Figure 2A,B). Furthermore, the agreement between the EBGFE and the calorimetrically obtained ERtissue was most accurate concerning period 2 and 3 (Figure 2A,B). Hence, a non-significant mean bias of 21 kJ NEL/kg BW0.75 and d (p = 0.051) was calculated for the agreement between both methods for period 2 and 3. In contrast, greater differences between EBGFE and ERtissue were found in period 1, with a mean bias of 167 kJ NEL/kg BW0.75 and d (p < 0.001). The average kl over the experimental groups and periods totalled 0.61 (data not shown).

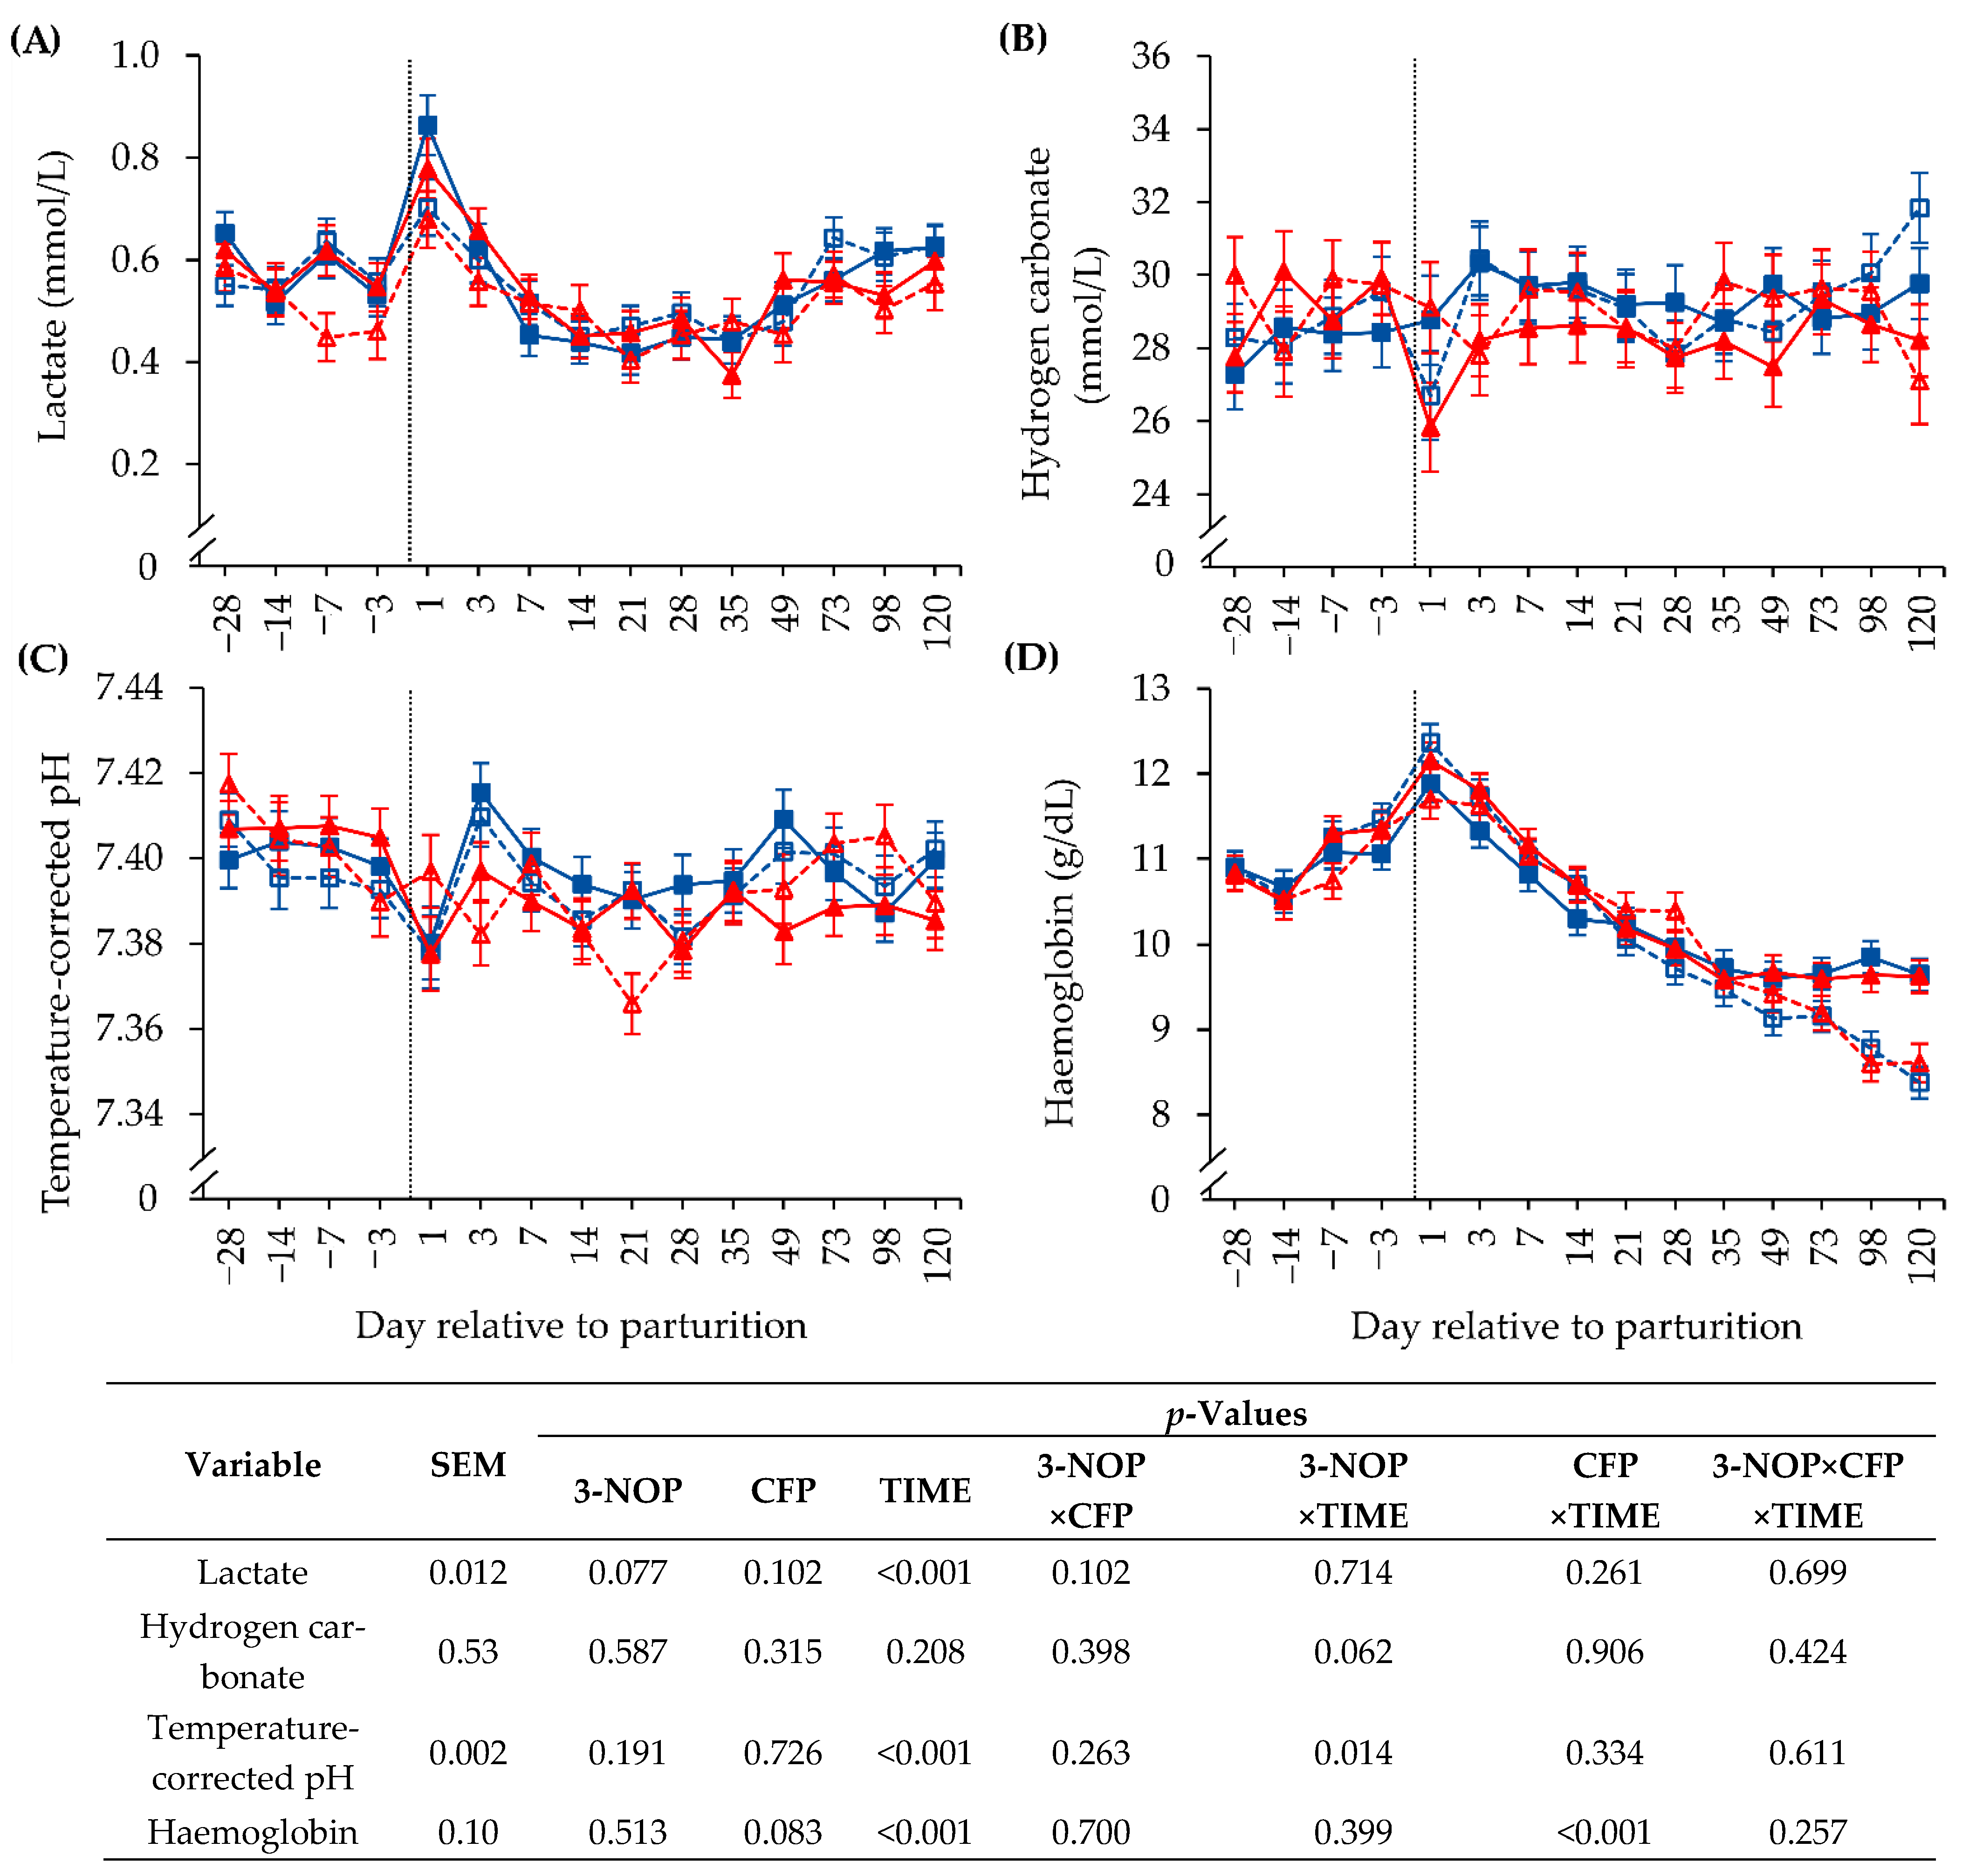
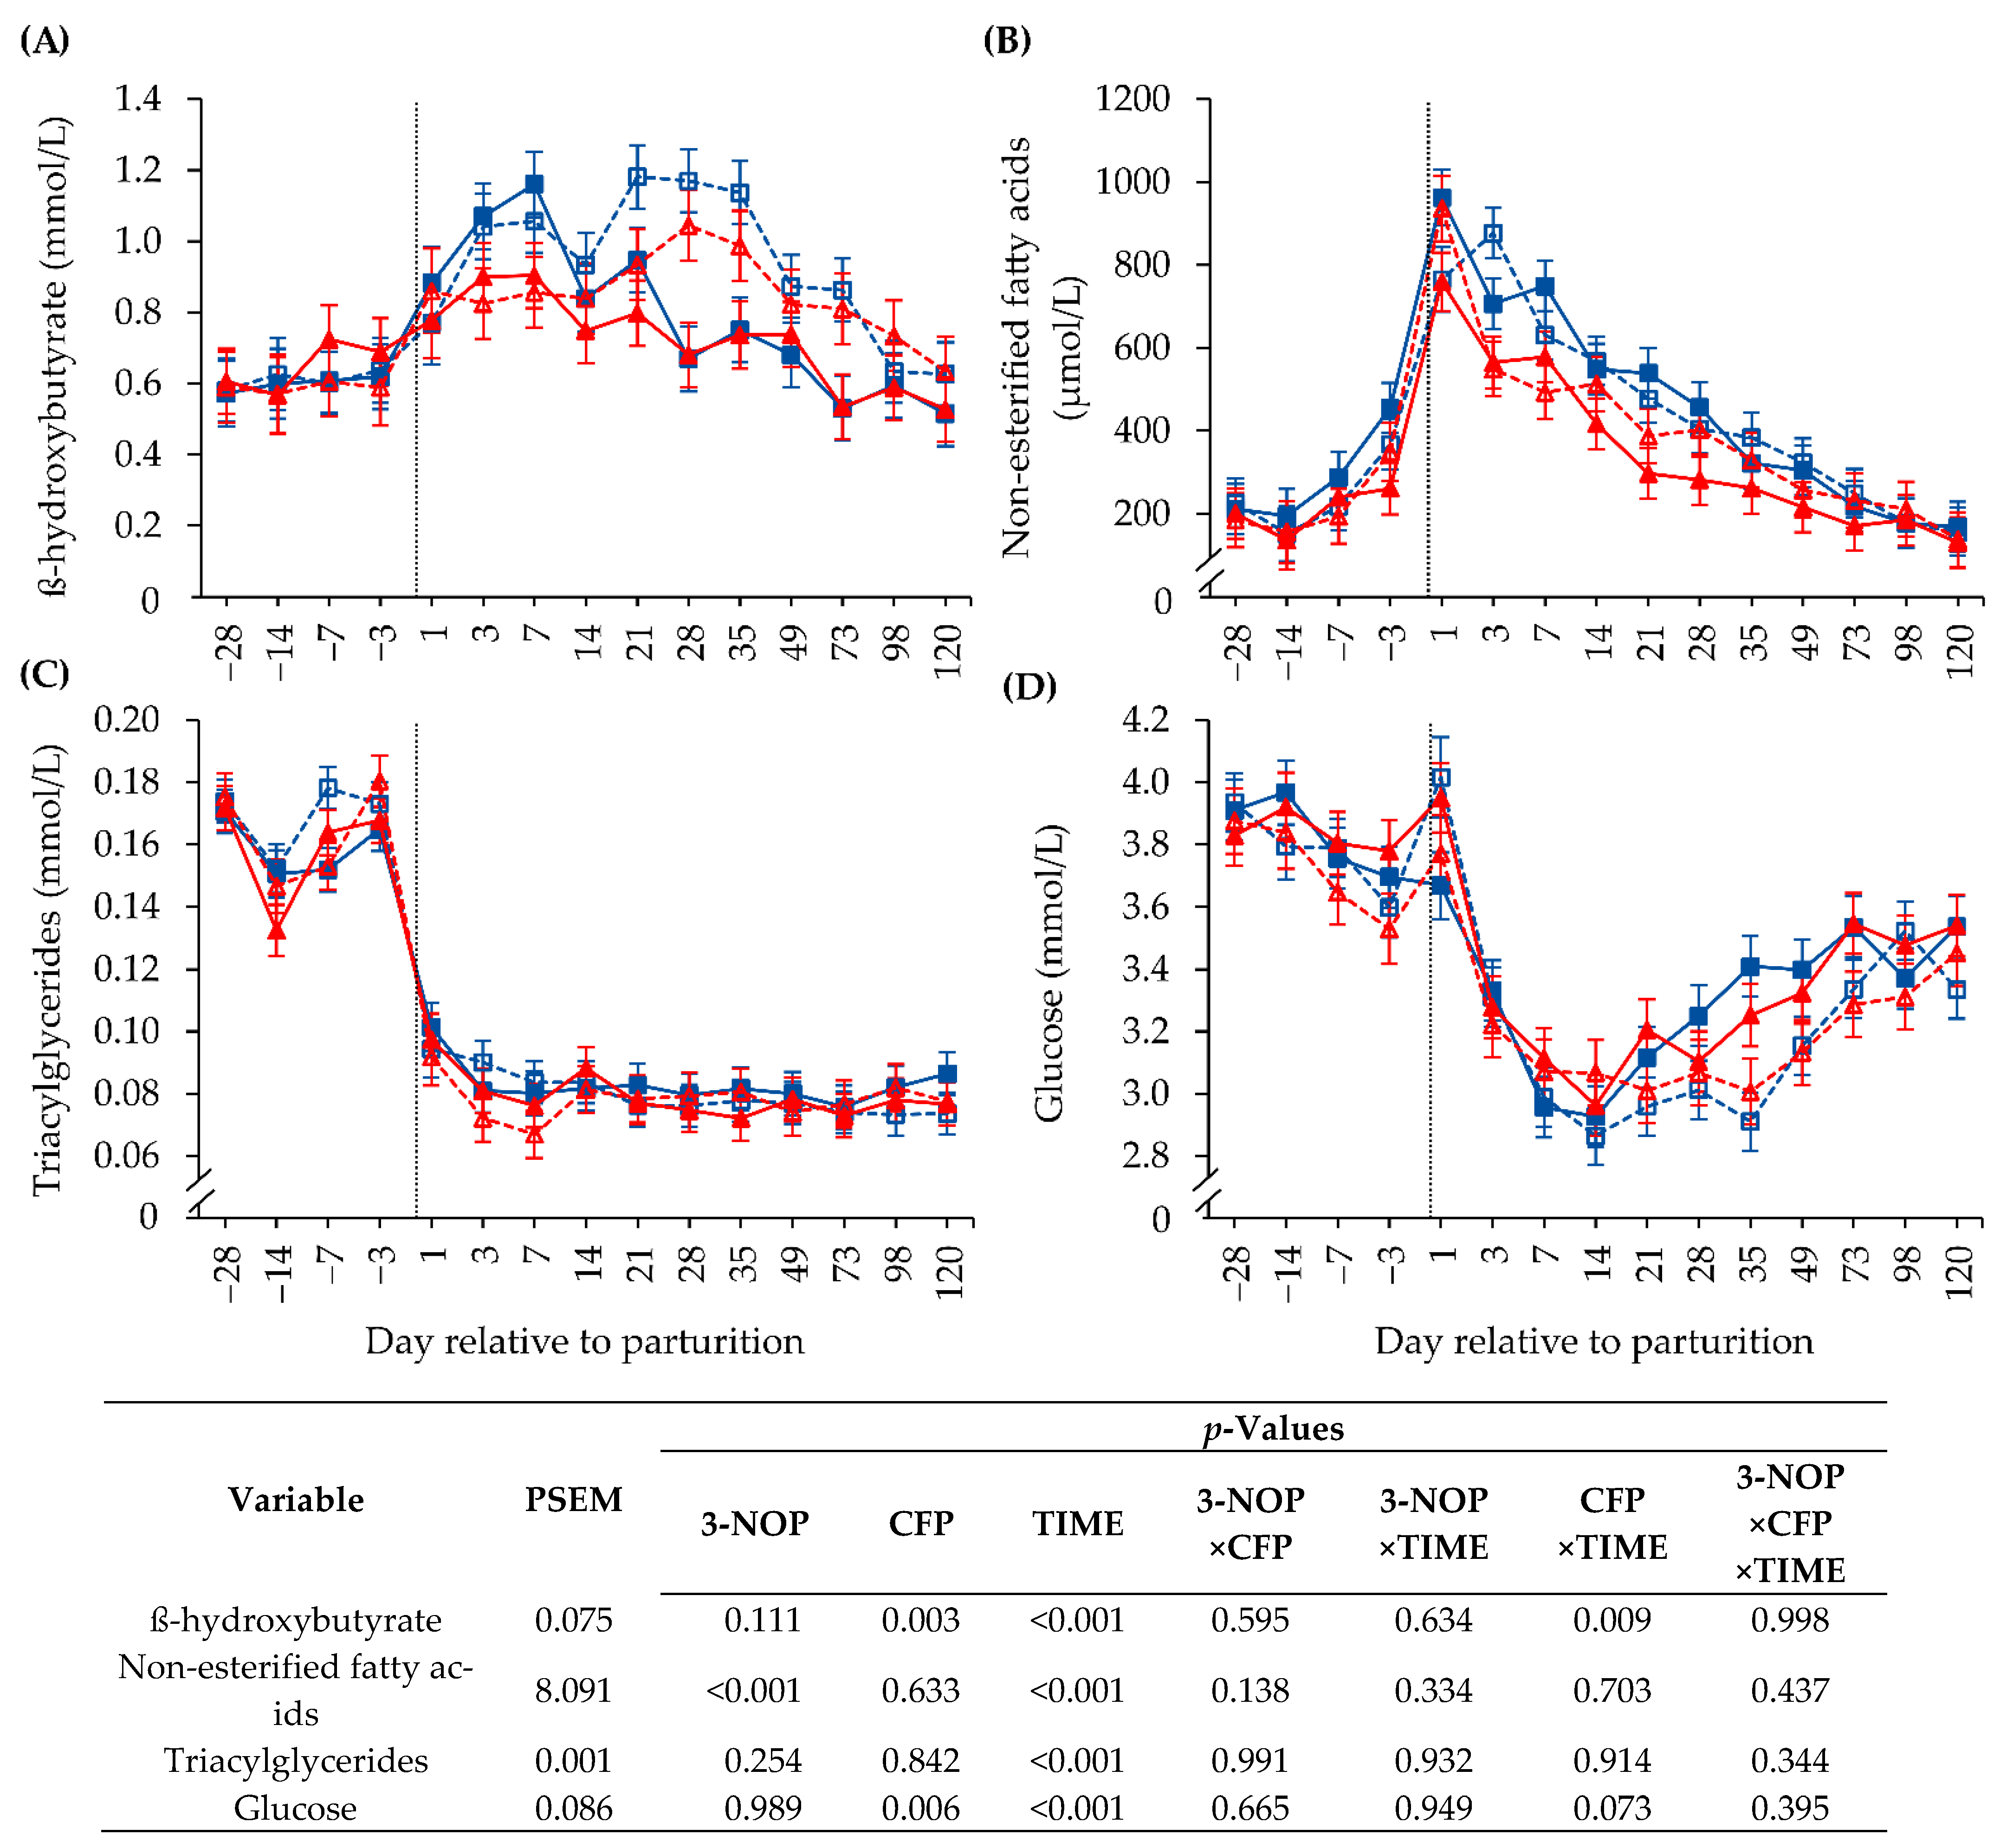
3.4. Biochemical Blood Parameters

Lactate peaked on the day of calving (Figure 3A; TIME; p < 0.001). Hydrogen carbonate and the temperature-corrected blood pH marginally fluctuated around their mean of 28.9 mmol/L (TIME; p = 0.208; Figure 3B) and 7.39, respectively. However, a slight drop in blood pH values was observed at d 1 p.p. (TIME; p < 0.001; Figure 3C). Antepartal haemoglobin levels slightly increased, on average, from 10.6 to 12.0 g/dL on the day of parturition but continuously decreased by approximately 24% afterwards. From d 49 until termination of the experiment, haemoglobin diverged to constant levels of 9.5 g/dL in the HC groups but still decreased to approximately 8.5 g/dL in the LC groups (Figure 3D; CFP × TIME; p < 0.001).
Blood serum concentrations of BHB, NEFA, TAG and glucose are presented in Figure 4. During the transitional period, the characteristic changes of BHB, NEFA, TAG and glucose were observed in all treatment groups (TIME; p < 0.001; Figure 4). In all experimental groups, TAG and glucose decreased by 68% from d 3 a.p. until d 3 p.p. and by 11% from d 1 p.p. to d 7 p.p., respectively. Starting from an initial value of 0.205 mmol/L, the NEFA concentration peaked to 0.856 mmol/L at d 1 p.p. followed by a decline to the a.p. baseline level until d 98 p.p. BHB increased from 0.63 mmol/L at d 3 a.p. to 1.11 mmol/L at d 7 p.p. in the CON groups, whereas a numerically lower peak of 0.88 mmol/L was observed in the 3-NOP groups. 3-NOP treatment did not impact the BHB, TAG and glucose concentrations but lowered that of NEFA by approximately 19.5% in the 3-NOP compared to the CON groups (3-NOP; p < 0.001). CFP affected neither NEFA nor TAG but did affect BHB (CFP × TIME; p = 0.009). Thus, a more pronounced decrease in BHB serum concentrations was observed in the HC compared to the LC groups from d 7 p.p. until termination of the experiment. Elevated blood glucose levels in the HC groups were considered significant from d 21 p.p. until d 73 p.p., in contrast with the LC groups (CFP × TIME; p = 0.073; CFP; p = 0.006). NEFA concentration was correlated with TAG after parturition (r = 0.47; p < 0.001; N = 350). Blood glucose was positively related to TAG (r = 0.49; p < 0.001; N = 532) and HP (r = 0.24; p < 0.001; N = 512) but negatively associated with both serum NEFA (r = −0.28; p < 0.001; N = 532) and BHB (r = −0.47; p < 0.001; N = 532). NEFA and BHB were significantly interrelated (r = 0.42; p < 0.001; N = 532) and decreased with elevated ERtissue (r = −0.52; p < 0.001 for NEFA and r = −0.29; p < 0.001 for BHB; N = 511) and MEI (r = −0.29; p < 0.001; N = 525 for NEFA and r = −0.18; p < 0.001; N = 514 for BHB). Accordingly, increased MEI went along with increased ERtissue (r = 0.39; p < 0.001; N = 914) and CO2 yield (g CO2/kg DMI) (r = 0.41; p < 0.001; N = 914). CO2 yield had a strongly positive correlation with TAG (r = 0.56; p < 0.001; N = 511) and postpartal NEFA levels (r = 0.44; p = 0.001; N = 350) but had a negative relationship with ERtissue (r = −0.35; p < 0.001; N = 914).

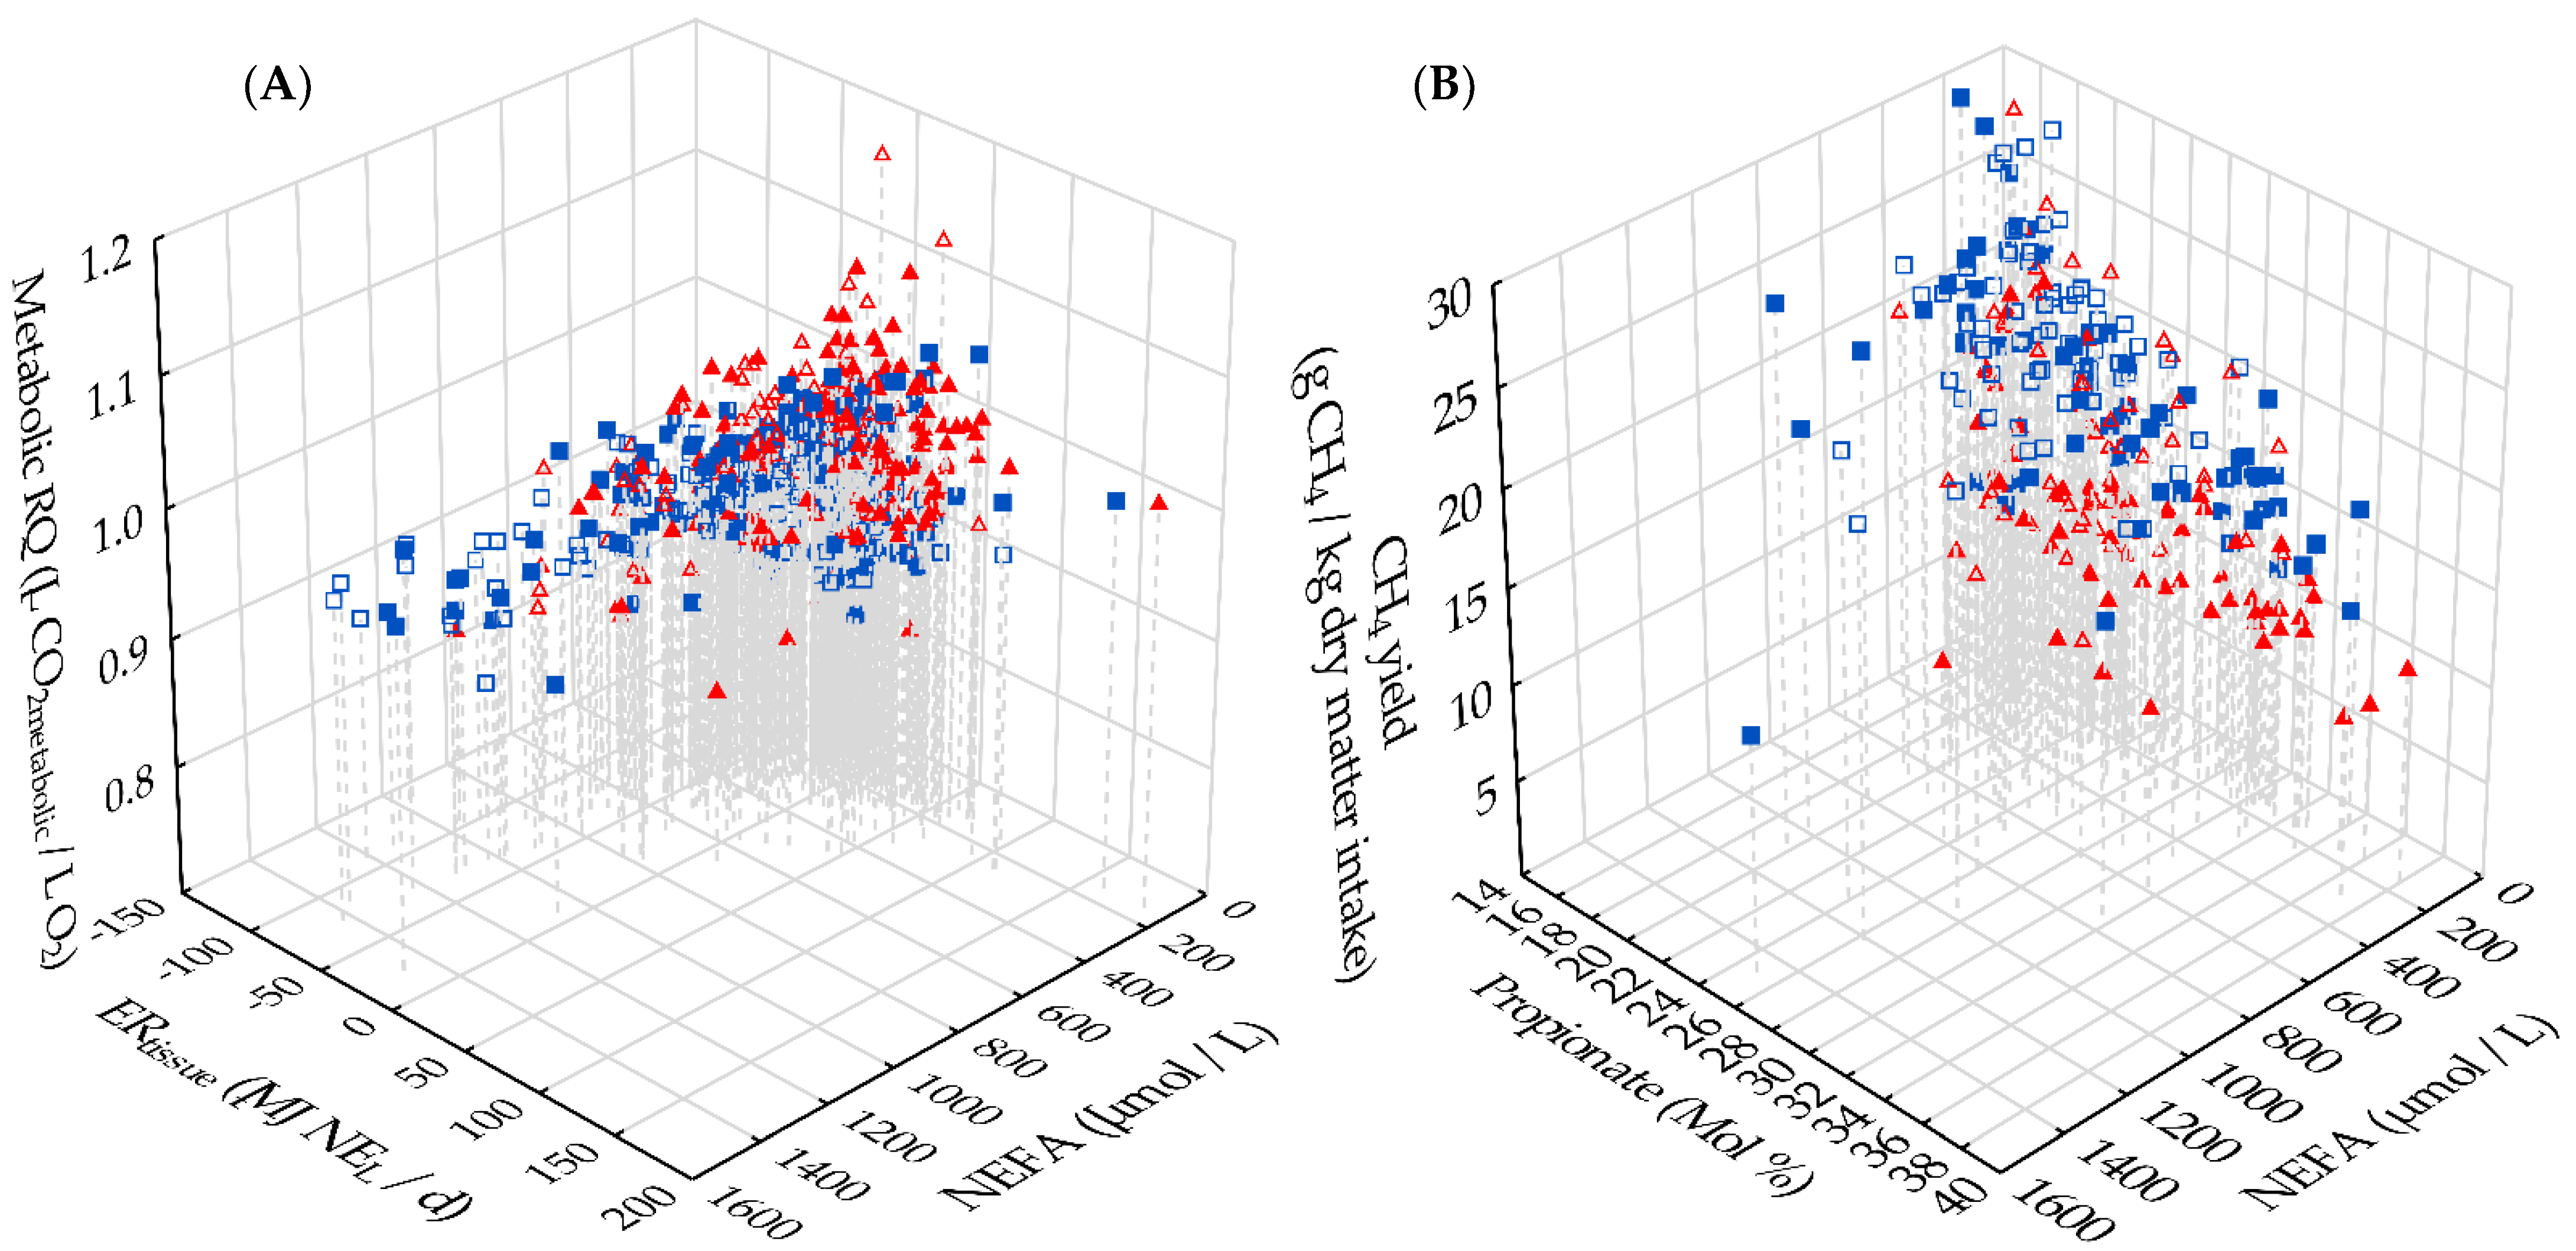
3.5. Interrelations between Metabolic RQ, Energy Metabolism and Methane Emission

Figure 5A shows that RQmetabolic was positively correlated with ERtissue (r = 0.37; p < 0.001; N = 912) and negatively with serum NEFA (r = −0.29; p < 0.001; N = 510) (multiple R2 = 0.37; p = 0.015). ERtissue and serum NEFA levels were adversely interrelated. Lower serum NEFA concentrations could be identified for 3-NOP groups (Figure 5A) and the NOPHC group showed increased ERtissue (Figure 5A). Figure 5B shows that CH4 yield was negatively related to molar propionate proportions in rumen fluid (r = −0.46; p < 0.001; N = 165; data from Schilde et al. [15]), whereby the opposite holds true concerning p.p. NEFA concentration (multiple R2 = 0.59, p < 0.001). Serum NEFA and propionate were inversely related (r = −0.22; p = 0.007; N = 165) and affected CH4 yield in an interactive manner (Figure 5B). Approximately, 59% of the variation of the CH4 yield can be explained by the explanatory variables (multiple R2 = 0.59, p < 0.001). The CH4 yield was decreased by 3-NOP supplementation (Figure 5B).

4. Discussion

4.1. Limitations of the GreenFeed Technology for Its Use in Indirect Calorimetry

The accurate indirect calorimetric calculation of the HP and RQ depends on precise gas respiration measurements [44]. Due to technical reasons, the VO2 consumption of CON groups needed to be regressively predicted from VCO2 and DMI. Even though slightly increased VO2 consumption rates were temporarily observed in the CON groups, the highly predictive performance of the applied model (R2 = 0.90; RSE = 371 g/d) confirmed its validity. In contrast to RC, a reliable within-day gas exchange pattern could not be obtained from GF measurements, which precluded investigations on intraday HP and RQ kinetics [23] and potentially explained some of the variations, as shown for RQmetabolic and HP. Over the present trial period, the coefficients of variation for the within-day GF spot measurements of VCH4, VO2 and VCO2 were, on a weekly average, 22.1, 10.0 and 11.1%, respectively. Correspondingly, this could have resulted in deviations of HP of approximately ± 1.3 MJ (1.02% of total HP), ± 9.7 MJ (7.65% of total HP) and ± 3.5 MJ (2.76% of total HP), respectively, indicating that HP estimation is most sensitive towards variations in O2 consumption. In conclusion, the overall variability of the present GF gas mass flux measurements was stated to be low. This was related to an accurate data acquisition, which was realized by a high-sampling frequency being evenly distributed throughout the day. In addition, GF data were averaged over seven days and validated for visiting time and head positioning of the cow in the GF hood. Hence, the measurement procedure applied herein (detailed in Schilde et al. [15]) was previously noted to produce comparable results to those obtained from RC [23,32]. In particular, both RC and GF used the same equations and sensor types for O2 (para-magnetic), CH4 and CO2 (non-dispersive infrared) respiration measurements. However, in particular, further validation of the GF algorithm principles is needed as O2 sensor validation data from RC measurements are lacking. In the present study, the VCO2metabolic was differentiated from the fermentative VCO2 to calculate RQmetabolic at the intermediary level. Indeed, this fractionation can be visually conducted for each cow visit from the VCO2 gas-measurement trajectory depicted in the GF graphical online interface. In this way, a “baseline” CO2 level reflects the amount of expired lung-derived CO2 (VCO2metabolic) that needs to be corrected for background CO2 gas concentration. The “baseline” CO2 level is temporarily interrupted by CO2 eructation peaks (VCO2fermentative) [45]. However, this visual evaluation is impractical for large datasets and, therefore, algorithms for an automatized graphical assessment should be developed in the future. As a consequence, the commonly applied factor of 1.7 [34,36] was used, resulting in VCO2fermentative proportions of 12 ± 0.5% in CONHC, 9 ± 0.5% in NOPHC and, more incrementally, 13 ± 0.4% in CONLC and 10 ± 1.1% in NOPLC (mean ± SD) (Figure 1A; Table 2). Comparatively, Caetano et al. [45] visually estimated the VCO2fermentative from the GF online interface to be between 6 and 20% of the total VCO2 production in beef cattle offered diets of varying energy density for ad libitum and restricted intake.

4.2. Validation of the Energy Partitioning Estimated by Indirect Calorimetry and Ultrasonography

The present GF method of indirect calorimetry resulted in ERtissue values that strongly corresponded to the EBGFE values measured for period 2 and 3. However, both methods significantly differed with regard to the a.p. period (period 1; Figure 2A; compare ERtissue and EBGFE in Table 3). Erdmann et al. [39] compared the EBGFE with that calculated from indirect calorimetric RC measurements over the same antepartal period as the present period 1 and also reported higher EBGFE values (by about 33 MJ/d) when compared to the RC energy balance. The higher EBGFE could have been a result of an underestimation of EE during the ante-partum period 1 when compared to the calorimetrically derived ERtissue. Thus, the dynamically increasing antepartal energy requirements for the onset of lactogenesis and foetal growth could have been captured more accurately by continuous calorimetric measurements in contrast with the constants applied in EBGFE calculations. Furthermore, the impact of maintenance requirements on the EB outcome was proportionally higher during the dry period when compared to the lactation period. The factors applied in the German NE system for calculating MEm were derived from 40-year-old data. Meanwhile, the breeding of higher genetic merit cows resulted in generally increased body sizes of cows and a greater proportion of liveweight as body protein mass while back fat thickness decreased [46]. As a consequence, the increased feed intake resulted in greater digestive loads and blood flow-rates in the total splanchnic tissues being paralleled by increased metabolic rates, internal organ masses and O2 consumption [47]. These metabolic changes are related to higher energy demands for maintenance metabolism, which implies an underestimation of maintenance energy requirements in the German NE feeding system and a further explanation of the higher EBGFE when compared to the ERtissue values.
The mean kl value of 0.61 is within the range of kl values (0.60 to 0.67) summarized in a literature review by Agnew and Yan [47] and close to the kl value of 0.60 reported by Van Es [48], which confirms the suitability of the GreenFeed system as an indirect calorimeter.
The estimated energy released from the ultrasonographically assessed lipolysis in AT depots (ERfat depot; Equation (8)) was subtracted from the negative ERtissue in period 2 (Table 3) yielding the remaining fraction of glycogen, triglycerides and proteins deposited in skeletal muscles and organs (ERresidual). It was supposed that protein and lipid breakdown in skeletal muscles around parturition partially compensated for the observed negative ERtissue (Figure 1C; Table 3) and contributed to the decreased RQmetabolic (Figure 1B) [11]. Thus, gluconeogenesis from the oxidation of alanine, one of the most important glucogenic amino acids (AA) [11], and intramuscular lipids result in very low RQmetabolic values of 0.13 and 0.7, respectively. Tamminga et al. [49] estimated the fractional rate of skeletal muscle protein breakdown in dairy cows to be 0.38, 0.22, 0.04 and 0.02 kg per day in week 1, 2, 3 and 4 p.p. From a rough calculation, this would correspond to a total of 4.6 kg mobilized body protein (92 MJ NEL) during the complete period 2 and an energy equivalent of 3.3 MJ NEL/d (92 MJ NEL from proteolysis divided by 28 days in period 2 = 3.3 MJ NEL/d; 1 g of body protein = 23.8 kJ [22]; energy efficiency of 84% [50]). Comparatively, von Soosten et al. [51] reported a lower energy yield from body protein mobilization, which amounted to an average of 2.1 MJ/d over the period from d 1 until d 42 p.p. in primiparous cows measured by the comparative slaughter technique. However, those results are not directly comparable to the present periparturient pluriparous dairy cows and observation period (d 1 until d 28). Von Soosten et al. [51] assumed protein accretion in the growing primiparous cows (BW of approximately 490 kg) and protein mobilization is generally supposed to change to repletion from d 35 p.p. onwards [52]. The non-explained remainder of the difference between ERresidual and the estimated energy supply from skeletal muscle proteolysis can be partially assigned to energy mobilized from inter- and intramuscular and organ tissues. Furthermore, the corresponding models estimating the fat depot masses are, to some extent, prone to error. Although ERtissue was more positive in the HC groups (Figure 1C), the ultrasonographically assessed lipolysis from AT and serum NEFA levels (indicative for negative EB) were not different between the HC and LC groups (Table 3; Figure 4B). Raschka et al. [25] validated the ultrasonographic-based multiple regression model for the predicted weights of the SAT and VAT depots as highly accurate with R2 values of 0.88 and 0.94 and root mean square errors of 3.4 and 6.1 kg, respectively. In the present experiment, an assumed ± 10% variation between the predicted and actual daily changes in SAT and VAT would result in ERfat depot variations of approximately ± 2.3 MJ NEL/d.

4.3. Effects of 3-NOP, CFP and Parturition on Energy Metabolism Parameters

Both RQ and HP notably depend on the magnitude of MEI (r = 0.69 and r = 0.22 resp.; p < 0.001; N = 914), its utilization for maintenance and productive purposes [53], whether substrates are either deposited or mobilized in tissues (Figure 5A) and, finally, on the type of the metabolized substrate itself [22,34]. In contrast to LC groups, the higher RQmetabolic (Figure 1B) and ERtissue (Figure 1C) in HC groups reflected their increased GEI:EE ratio (Table 3) and dietary content of non-fibre carbohydrates (Table 1) being microbially degraded into gluconeogenic substrates. Correspondingly, increased blood glucose (Figure 4C) and reduced BHB (Figure 4A) concentrations were observed in the HC groups.
During the a.p. period, the pro-lipogenic effect of the dietetically designed energetic oversupply was manifested in the positive ERtissue (Figure 1C) and RQmetabolic values of 0.92 (Figure 1B). In principle, lipid deposition in AT would result in RQmetabolic values above 1.0 [44] but RQmetabolic reflects the net oxidation rates of a mixture of substrates irrespective of the metabolic interconversions of the substrate [44]. Hence, flowing transitions between oxidation and de novo synthesis of lipids were assumed, which became apparent in the steady decrease in ERtissue since the beginning of the trial in spite of the energetic oversupply (Figure 1C). The present energy-deficient transition from gestation to lactation was accompanied by significant metabolic adaptations (Figure 4). The decreased RQmetabolic corresponded to the negative ERtissue and accumulation of serum NEFA (Figure 5A), collectively indicating excessive fat oxidation from AT resulting in increased O2 consumption (NEFA vs. O2 consumption (g/d); r = 0.18; p < 0.001; N = 511) and ketogenesis from acetyl-CoA and NEFA (NEFA vs. BHB; r = 0.42; p < 0.001; N = 532). The observed increased circulating BHB (Figure 4A) likely originated from an oxaloacetate deficiency [10] and a concomitant hepatic overload to completely oxidize the excessively flooding NEFA (Figure 4B), released by lipolysis in AT (Table A1 and Table 4), into ATP and CO2 [11]. It can be summarized that the decrease in RQmetabolic could be partially explained by the increased O2 consumption due to lipolysis in AT, whereby CO2 did not increase due to the aforementioned incomplete metabolization of NEFA into BHB but not into CO2. Correspondingly, the RQmetabolic did not behave in the same manner as the RQtotal because the latter also reflected CO2 production arising from rumen fermentation. Hence, in the early-lactation period, increased fermentative CO2 production from high-forage diets led to higher RQtotal values, whereby RQmetabolic decreased due to the abovementioned increased but incomplete fat oxidation resulting in less intermediary CO2 formation when NEFA were converted to BHB, rather than CO2 and ATP. Accordingly, as previously published for the present experiment, the CO2 yield (g CO2 production/kg DMI) was significantly higher in LC when compared to the HC groups, but the opposite was the case when it came to total CO2 production (g CO2/d) over the complete experimental period [15].
In the present experiment, the tendency for an increased ERtotal in the NOPHC group (Table 3; Figure 1C) confirmed similar results reported by van Gastelen et al. [13]. The increased ERtissue, ERresidual and RQmetabolic of 1.01 in the NOPHC group (Figure 1B; Table 2) could be explained by an improved energy budget in that group. Hence, decreased NEFA levels were associated with increased ruminal propionate concentrations, and both were inversely related to CH4 production (Figure 5B). Recently, it was observed that supplementing 3-NOP combined with high CFP in the ration shifted rumen fermentation pathways to hydrogen-consuming glucogenic propionate and decreased loss of CH4 energy in a synergistic manner (Table 2 and Table 3) (details in Schilde et al. [15]). Correspondingly, lower serum NEFA concentrations were observed in the 3-NOP cows (Figure 4B) although neither 3-NOP nor CFP affected ERfat depot and lipomobilization in AT depots (Table 3 and Table 4). This could indicate that the increased glucogenic propionate proportions in the 3-NOP groups improved the intramitochondrial oxaloacetate availability and, therefore, the hepatic capacity for NEFA oxidation. Interestingly, neither blood glucose (NEFA oxidation and conversion of elevated propionate levels to glucose and CO2) nor TAG (re-esterification of NEFA) and BHB (reduced incomplete NEFA oxidation) were affected by 3-NOP, which confirms previous findings [20]. This opens the question as to whether the direct extrapolation of NEFA concentrations to circulating BHB levels is appropriate in the present CH4 mitigation experiment. Accordingly, in the companion study, Schilde et al. [15] observed that butyrate formation was preferred to that of acetate in the 3-NOP-treated cows, which can be explained by the reduced hydrogen release when carbohydrates are degraded into butyrate and not into acetate [54]. Butyrate also serves as a carbon source for ketone body synthesis in the rumen epithelium [55]; therefore, increased circulating BHB originating from enhanced intraepithelial ketogenesis could have masked the assumed causal relationship that decreased serum NEFA concentrations in the 3-NOP-treated cows, which would necessarily have led to reduced BHB in the blood stream. Besides the intraepithelial butyrate metabolization, propionate can be metabolized to lactate in the rumen epithelium, which could also have reduced the propionate flux to the liver, thereby eliminating the energetic advantage of the 3-NOP-mediated increased propionate formation in the rumen. The observed accumulation of ketoacids (BHB) and the blood lactate peak at d 1 p.p. (Figure 3A) could have increased the risk for metabolic acidosis [44]. Indeed, blood pH was observed to slightly drop from 7.41 to 7.38 at parturition contemporaneously to the lactate peak at d 1 p.p. (Figure 3C; TIME; p < 0.001). In this context, the temporal decrease in the 3-NOP groups (Figure 3C; 3-NOP × TIME; p = 0.014) is, however, difficult to explain as blood lactate and BHB were not affected by 3-NOP treatment. The pH decrease at d 1 p.p. possibly caused buffering reactions via the largest CO2 body pool, hydrogen carbonate, which could have led to an overestimation of HP and RQmetabolic [44]. Indirect calorimetry is stated to be accurate as long as body pool sizes of energy-related metabolites (ketone bodies, lactate) and intermediary products (O2 and CO2, NU) remain stable [44]. However, the potential effects of intermediary pool sizes on HP from nutrient oxidation and RQmetabolic were considered negligible because the bicarbonate and pH values remained within their physiological area [56,57] (Figure 3B,C). In general, the CO2 pool size is supposed to be subjected to greater fluctuations when compared to the O2 body pool [44]. Accordingly, blood concentrations of haemoglobin, the main O2 body pool, remained stable within the physiological range [57] although a slight divergence was observed between the LC and HC groups at the end of the experiment (Figure 3D; CFP × TIME; p < 0.001).

5. Conclusions

The present study revealed that using the GF system as an indirect calorimetry chamber for the assessment of cows’ energy metabolisms is a promising approach, although further validations of the O2 sensor and algorithm principles are needed. The ERtissue determined by indirect calorimetry coincided with that calculated from GfE [24], except for the antepartal period. The hypothesis that feeding 3-NOP in combination with high CFP synergistically improves the cows’ energy budgets was partially confirmed because effects were not apparent in all of the examined parameters. 3-NOP combined with high CFP increased RQmetabolic and ERtissue and decreased serum NEFA. In contrast, lipomobilization from fat depots and blood lactate were neither affected by 3-NOP nor CFP and 3-NOP did not affect blood glucose, TAG and BHB levels. Blood pH and bicarbonate remained within their physiological range and metabolic adaptations to energy-related changes via the CO2 body pool were not observed. High CFP decreased BHB but increased blood glucose and, at the end of the trial, haemoglobin levels, which possibly indicates that the cows adapted differently to metabolic changes. Future research will be focused on the relationship between the 3-NOP-induced changes in the rumen VFA profile and gene expression in the liver.

Author Contributions

Conceptualization, M.S. and S.D.; Data curation, M.S., J.F. and S.K.; Formal analysis, M.S.; Funding acquisition, D.v.S., S.K. and U.M.; Investigation, M.S. and J.F.; Methodology, M.S. and S.D.; Project administration, D.v.S. and U.M.; Resources, D.v.S., J.F., S.K., U.M. and S.D.; Supervision, A.Z. and S.D.; Validation, M.S., A.Z. and S.D.; Visualization, M.S.; Writing—original draft, M.S.; Writing—review and editing, M.S. All authors have read and agreed to the published version of the manuscript.

Funding

The project is supported by funds from the Federal Ministry of Food and Agriculture (BMEL) based on a decision of the Parliament of the Federal Republic of Germany via the Federal Office for Agriculture and Food (BLE) under the innovation support programme (grant number 281B101416).

Institutional Review Board Statement

The experiment was conducted according to the guidelines of the German Animal Welfare Act, and approved by the LAVES (Lower Saxony State Office for Consumer Protection and Food Safety, Germany) (approval number: 33.19-42502-04-15/1858).

Informed Consent Statement

Not applicable.

Data Availability Statement

The data presented in this study are available in the present article and in the previously published manuscript of the comprehensive experiment by Schilde et al. [15] (article number: 1877986).

Acknowledgments

The authors thank the staff of the Institute of Animal Nutrition, Friedrich-Loeffler-Institut (FLI) and the co-workers of its experimental station for taking care of the experimental animals and supporting the sample collection and analysis. The authors also thank DSM Nutritional Products AG (Kaiseraugst, Switzerland) for their support in providing 3-NOP and 3-NOP analyses in the feedstuffs.

Conflicts of Interest

The authors declare no conflict of interest.

Appendix A

Table A1. Thickness and absolute masses of adipose tissue (AT) depots of the experimental groups at d 3 and d 28 post-partum (p.p.).
ItemTreatments SEMp-Values §
CONHC
(n = 14)
CONLC
(n = 15)
NOPHC
(n = 14)
NOPLC
(n = 12)
3-NOPCFP3-NOP
×CFP
3-NOP
×TIME
CFP
×TIME
3-NOP
×CFP×TIME
Back fat thickness (cm)
d1 3 p.p.1.491.341.431.490.080.3410.5380.1520.5510.9380.924
d 28 p.p.1.161.011.151.21
Rib fat thickness (cm)
d1 3 p.p.1.61.51.61.60.080.4240.6710.3950.7390.3950.355
d 28 p.p.1.21.11.21.3
Absolute masses of AT depot (kg)
Mesenteric AT
d1 3 p.p.13.511.713.913.80.840.1970.3000.4150.4520.5510.486
d 28 p.p.7.37.07.67.4
Omental AT
d 1 3 p.p.14.813.314.414.30.660.3950.3200.3050.3530.5880.806
d 28 p.p.10.49.310.510.6
Retroperitoneal AT
d1 3 p.p.9.48.89.79.50.530.4220.8370.5390.6030.1840.552
d 28 p.p.6.86.66.67.3
Subcutaneous AT
d1 3 p.p.13.612.813.913.30.730.4530.4990.5940.5590.4680.336
d 28 p.p.9.68.79.610.0
Visceral AT +
d1 3 p.p.37.733.837.937.51.720.2760.3870.3590.6830.3240.679
d 28 p.p.24.522.924.825.3
Values presented as LS-means; CONHC, control high concentrate; CONLC, control low concentrate; NOPHC, 3-nitrooxypropanol (3-NOP) high concentrate; NOPLC, 3-NOP low concentrate. § Effects of 3-NOP, concentrate feed proportion (CFP), time relative to parturition (TIME), and interactions between them; effect of TIME with p < 0.001 for all variables. + Visceral AT = mesenteric + omental + retroperitoneal AT.

References

  1. Knapp, J.R.; Laur, G.L.; Vadas, P.A.; Weiss, W.P.; Tricarico, J.M. Invited review: Enteric methane in dairy cattle production: Quantifying the opportunities and impact of reducing emissions. J. Dairy Sci. 2014, 97, 3231–3261. [Google Scholar] [CrossRef] [PubMed] [Green Version]
  2. Hristov, A.N.; Oh, J.; Giallongo, F.; Frederick, T.W.; Harper, M.T.; Weeks, H.L.; Branco, A.F.; Moate, P.J.; Deighton, M.H.; Williams, S.R.; et al. An inhibitor persistently decreased enteric methane emission from dairy cows with no negative effect on milk production. Proc. Natl. Acad. Sci. USA 2015, 112, 10663–10668. [Google Scholar] [CrossRef] [Green Version]
  3. Patra, A.; Park, T.; Kim, M.; Yu, Z. Rumen methanogens and mitigation of methane emission by anti-methanogenic compounds and substances. J. Anim. Sci. Biotechnol. 2017, 8, 13. [Google Scholar] [CrossRef] [Green Version]
  4. Dijkstra, J.; Bannink, A.; France, J.; Kebreab, E.; van Gastelen, S. Short communication: Antimethanogenic effects of 3-nitrooxypropanol depend on supplementation dose, dietary fiber content, and cattle type. J. Dairy Sci. 2018, 101, 9041–9047. [Google Scholar] [CrossRef] [Green Version]
  5. Reynolds, C.K.; Humphries, D.J.; Kirton, P.; Kindermann, M.; Duval, S.; Steinberg, W. Effects of 3-nitrooxypropanol on methane emission, digestion, and energy and nitrogen balance of lactating dairy cows. J. Dairy Sci. 2014, 97, 3777–3789. [Google Scholar] [CrossRef] [PubMed]
  6. Haisan, J.; Sun, Y.; Guan, L.L.; Beauchemin, K.A.; Iwaasa, A.; Duval, S.; Barreda, D.R.; Oba, M. The effects of feeding 3-nitrooxypropanol on methane emissions and productivity of Holstein cows in mid lactation. J. Dairy Sci. 2014, 97, 3110–3119. [Google Scholar] [CrossRef] [Green Version]
  7. Gerber, P.J.; Steinfeld, H.; Henderson, B.; Mottet, A.; Opio, C.; Dijkman, J.; Falcucci, A.; Tempio, G. Tackling Climate Change through Livestock: A Global Assessment of Emissions and Mitigation Opportunities; 9789251079201; Food and Agriculture Organization of the United Nations (FAO): Rome, Italy, 2013. [Google Scholar]
  8. Johnson, K.A.; Johnson, D.E. Methane emissions from cattle. J. Anim. Sci. 1995, 73, 2483–2492. [Google Scholar] [CrossRef]
  9. Penner, G.B.; Taniguchi, M.; Guan, L.L.; Beauchemin, K.A.; Oba, M. Effect of dietary forage to concentrate ratio on volatile fatty acid absorption and the expression of genes related to volatile fatty acid absorption and metabolism in ruminal tissue. J. Dairy Sci. 2009, 92, 2767–2781. [Google Scholar] [CrossRef]
  10. Aschenbach, J.R.; Kristensen, N.B.; Donkin, S.S.; Hammon, H.M.; Penner, G.B. Gluconeogenesis in dairy cows: The secret of making sweet milk from sour dough. IUBMB Life 2010, 62, 869–877. [Google Scholar] [CrossRef]
  11. Drackley, J.K.; Overton, T.R.; Douglas, G.N. Adaptations of glucose and long-chain fatty acid metabolism in liver of dairy cows during the periparturient period. J. Dairy Sci 2001, 84, E100–E112. [Google Scholar] [CrossRef]
  12. Gross, J.; van Dorland, H.A.; Bruckmaier, R.M.; Schwarz, F.J. Performance and metabolic profile of dairy cows during a lactational and deliberately induced negative energy balance with subsequent realimentation. J. Dairy Sci. 2011, 94, 1820–1830. [Google Scholar] [CrossRef]
  13. Van Gastelen, S.; Dijkstra, J.; Binnendijk, G.; Duval, S.M.; Heck, J.M.L.; Kindermann, M.; Zandstra, T.; Bannink, A. 3-Nitrooxypropanol decreases methane emissions and increases hydrogen emissions of early lactation dairy cows, with associated changes in nutrient digestibility and energy metabolism. J. Dairy Sci. 2020, 103, 8074–8093. [Google Scholar] [CrossRef]
  14. Haisan, J.; Sun, Y.; Guan, L.; Beauchemin, K.A.; Iwaasa, A.; Duval, S.; Kindermann, M.; Barreda, D.R.; Oba, M. The effects of feeding 3-nitrooxypropanol at two doses on milk production, rumen fermentation, plasma metabolites, nutrient digestibility, and methane emissions in lactating Holstein cows. Anim. Prod. Sci. 2017, 57, 282–289. [Google Scholar] [CrossRef]
  15. Schilde, M.; von Soosten, D.; Hüther, L.; Meyer, U.; Zeyner, A.; Dänicke, S. Effects of 3-nitrooxypropanol and varying concentrate feed proportions in the ration on methane emission, rumen fermentation and performance of periparturient dairy cows. Arch. Anim. Nutr. 2021, 75, 79–104. [Google Scholar] [CrossRef]
  16. Jayanegara, A.; Sarwono, K.A.; Kondo, M.; Matsui, H.; Ridla, M.; Laconi, E.B. Nahrowi Use of 3-nitrooxypropanol as feed additive for mitigating enteric methane emissions from ruminants: A meta-analysis. Ital. J. Anim. Sci. 2018, 17, 650–656. [Google Scholar] [CrossRef] [Green Version]
  17. Melgar, A.; Welter, K.C.; Nedelkov, K.; Martins, C.M.M.R.; Harper, M.T.; Oh, J.; Räisänen, S.E.; Chen, X.; Cueva, S.F.; Duval, S.; et al. Dose-response effect of 3-nitrooxypropanol on enteric methane emissions in dairy cows. J. Dairy Sci. 2020, 103, 6145–6156. [Google Scholar] [CrossRef] [PubMed]
  18. Kim, H.; Lee, H.G.; Baek, Y.-C.; Lee, S.; Seo, J. The effects of dietary supplementation with 3-nitrooxypropanol on enteric methane emissions, rumen fermentation, and production performance in ruminants: A meta-analysis. J. Anim. Sci. Technol. 2020, 62, 31–42. [Google Scholar] [CrossRef] [Green Version]
  19. Grummer, R.R. Impact of changes in organic nutrient metabolism on feeding the transition dairy cow. J. Anim. Sci. 1995, 73, 2820–2833. [Google Scholar] [CrossRef]
  20. Melgar, A.; Harper, M.T.; Oh, J.; Giallongo, F.; Young, M.E.; Ott, T.L.; Duval, S.; Hristov, A.N. Effects of 3-nitrooxypropanol on rumen fermentation, lactational performance, and resumption of ovarian cyclicity in dairy cows. J. Dairy Sci. 2020, 103, 410–432. [Google Scholar] [CrossRef] [Green Version]
  21. Gerrits, W.J.J.; Labussiere, E. Indirect Calorimetry: Techniques, Computations and Applications; Wageningen Academic Publishers: Wageningen, The Netherlands, 2015; p. 294. [Google Scholar]
  22. Brouwer, E. Report of sub-committee on constants and factors. In Proceedings of the 3rd Symposium on Energy Metabolism; Blaxter, K.L., Ed.; Academic Press: London, UK, 1965; pp. 441–443. [Google Scholar]
  23. Hammond, K.J.; Humphries, D.J.; Crompton, L.A.; Green, C.; Reynolds, C.K. Methane emissions from cattle: Estimates from short-term measurements using a GreenFeed system compared with measurements obtained using respiration chambers or sulphur hexafluoride tracer. Anim. Feed Sci. Technol. 2015, 203, 41–52. [Google Scholar] [CrossRef]
  24. GfE. Empfehlung zur Energie- und Nährstoffversorgung der Milchkühe und Aufzuchtrinder; Deutsche Landwirtschafts-Gesellschaft-Verlags-GmbH: Frankfurt am Main, Germany, 2001; p. 136. [Google Scholar]
  25. Raschka, C.; Ruda, L.; Wenning, P.; von Stemm, C.I.; Pfarrer, C.; Huber, K.; Meyer, U.; Dänicke, S.; Rehage, J. In vivo determination of subcutaneous and abdominal adipose tissue depots in German Holstein dairy cattle. J. Anim. Sci. 2016, 94, 2821–2834. [Google Scholar] [CrossRef] [PubMed]
  26. Schäfers, S.; von Soosten, D.; Meyer, U.; Drong, C.; Frahm, J.; Kluess, J.; Raschka, C.; Rehage, J.; Tröscher, A.; Pelletier, W.; et al. Influence of conjugated linoleic acid and vitamin E on performance, energy metabolism, and change of fat depot mass in transitional dairy cows. J. Dairy Sci. 2017, 100, 3193–3208. [Google Scholar] [CrossRef] [Green Version]
  27. III Die chemische Untersuchung von Futtermitteln. In Handbuch der Landwirtschaftlichen Versuchs-und Untersuchungsmethodik (VDLUFA-Methodenbuch); VDLUFA-Verlag: Darmstadt, Germany, 2006.
  28. Lammers, B.P.; Buckmaster, D.R.; Heinrichs, A.J. A simple method for the analysis of particle sizes of forage and total mixed rations. J. Dairy Sci. 1996, 79, 922–928. [Google Scholar] [CrossRef]
  29. DLG-Verlags-GmbH. Futterwerttabellen-Wiederkäuer; DLG-Verlags-GmbH: Frankfurt am Main, Germany, 1997. [Google Scholar]
  30. GfE. Zur Energiebewertung beim Wiederkäuer. Proc. Soc. Nutr. Physiol. 1995, 4, 121–123. [Google Scholar]
  31. Huhtanen, P.; Cabezas-Garcia, E.H.; Utsumi, S.; Zimmerman, S. Comparison of methods to determine methane emissions from dairy cows in farm conditions. J. Dairy Sci. 2015, 98, 3394–3409. [Google Scholar] [CrossRef] [PubMed] [Green Version]
  32. Manafiazar, G.; Zimmerman, S.; Basarab, J.A. Repeatability and variability of short-term spot measurement of methane and carbon dioxide emissions from beef cattle using GreenFeed emissions monitoring system. Can. J. Anim. Sci. 2016, 97, 118–126. [Google Scholar] [CrossRef] [Green Version]
  33. Chwalibog, A.; Jensen, K.; Thorbek, G. Oxidation of nutrients in bull calves treated with beta-adrenergic agonists. Arch. Tierernaehr 1996, 49, 255–261. [Google Scholar] [CrossRef] [PubMed]
  34. Chwalibog, A.; Tauson, A.-H.; Thorbek, G. Quantitative oxidation of nutrients in growing calves. Z. Ernährungswiss 1997, 36, 313–316. [Google Scholar] [CrossRef]
  35. Blümmel, M.; Aiple, K.-P.; Steingaβ, H.; Becker, K. A note on the stoichiometrical relationship of short chain fatty acid production and gas formation in vitro in feedstuffs of widely differing quality. J. Anim. Physiol. Anim. Nutr. 1999, 81, 157–167. [Google Scholar] [CrossRef]
  36. Derno, M.; Nürnberg, G.; Schön, P.; Schwarm, A.; Röntgen, M.; Hammon, H.M.; Metges, C.C.; Bruckmaier, R.M.; Kuhla, B. Short-term feed intake is regulated by macronutrient oxidation in lactating Holstein cows. J. Dairy Sci. 2013, 96, 971–980. [Google Scholar] [CrossRef] [Green Version]
  37. Derno, M.; Nürnberg, G.; Kuhla, B. Characterizing the metabotype and its persistency in lactating Holstein cows: An approach toward metabolic efficiency measures. J. Dairy Sci. 2019, 102, 6559–6570. [Google Scholar] [CrossRef] [PubMed] [Green Version]
  38. Dijkstra, J.; Oenema, O.; van Groenigen, J.W.; Spek, J.W.; van Vuuren, A.M.; Bannink, A. Diet effects on urine composition of cattle and N2O emissions. Animal 2013, 7, 292–302. [Google Scholar] [CrossRef] [PubMed] [Green Version]
  39. Erdmann, S.; Derno, M.; Schäff, C.T.; Börner, S.; Kautzsch, U.; Kuhla, B.; Hammon, H.M.; Tuchscherer, A.; Röntgen, M. Comparative analyses of estimated and calorimetrically determined energy balance in high-yielding dairy cows. J. Dairy Sci. 2019, 102, 4002–4013. [Google Scholar] [CrossRef] [Green Version]
  40. Moe, P.W.; Tyrrell, H.F.; Flatt, W.P. Energetics of body tissue mobilization. J. Dairy Sci. 1971, 54, 548–553. [Google Scholar] [CrossRef]
  41. Agricultural and Food Research Council (AFRC). Energy and Protein Requirements of Ruminants: An Advisory Manual Prepared by the AFRC Technical Committee on Responses to Nutrients; CAB Int.: Wallingford, UK, 1993; p. 183. [Google Scholar]
  42. Littell, R.C.; Henry, P.R.; Ammerman, C.B. Statistical analysis of repeated measures data using SAS procedures. J. Anim. Sci. 1998, 76, 1216–1231. [Google Scholar] [CrossRef] [PubMed] [Green Version]
  43. Bland, J.M.; Altman, D.G. Statistical methods for assessing agreement between two methods of clinical measurement. Lancet 1986, 1, 307–310. [Google Scholar] [CrossRef]
  44. Van den Borne, J.J.G.C.; Heetkamp, M.J.W.; Alferink, S.J.J.; Gerrits, W.J.J. Moving from a complete energy balance towards substrate oxidation: Use of stable isotopes. In Indirect Calorimetry Techniques, Computations and Applications; Gerrits, W.J.J., Labussiere, E., Eds.; Wageningen Academic Publishers: Wageningen, The Netherlands, 2015; pp. 87–106. [Google Scholar]
  45. Caetano, M.; Wilkes, M.J.; Pitchford, W.S.; Lee, S.J.; Hynd, P.I. Energy relations in cattle can be quantified using open-circuit gas-quantification systems. Anim. Prod. Sci. 2018, 58, 1807–1813. [Google Scholar] [CrossRef]
  46. Gruber, L.; Knaus, W.; Susenbeth, A.; Schwarz, F.J.; Guggenberger, T.; Fischer, B.; Spiekers, H.; Steingaß, H.; Meyer, U.; Münger, A.; et al. Evaluation of the net energy for lactation system and estimation of the energy requirements of dairy cows based on a comprehensive analysis of feeding trials. Arch. Anim. Nutr. 2021, 75, 1–17. [Google Scholar] [CrossRef]
  47. Agnew, R.E.; Yan, T. Impact of recent research on energy feeding systems for dairy cattle. Livest. Prod. Sci. 2000, 66, 197–215. [Google Scholar] [CrossRef]
  48. Van Es, A.J.H. Feed evaluation for dairy cows. Livest. Prod. Sci. 1975, 2, 95–107. [Google Scholar] [CrossRef]
  49. Tamminga, S.; Luteijn, P.A.; Meijer, R.G.M. Changes in composition and energy content of liveweight loss in dairy cows with time after parturition. Livest Prod. Sci. 1997, 52, 31–38. [Google Scholar] [CrossRef]
  50. Moe, P.W. Energy metabolism of dairy cattle. J. Dairy Sci. 1981, 64, 1120–1139. [Google Scholar] [CrossRef]
  51. von Soosten, D.; Meyer, U.; Piechotta, M.; Flachowsky, G.; Dänicke, S. Effect of conjugated linoleic acid supplementation on body composition, body fat mobilization, protein accretion, and energy utilization in early lactation dairy cows. J. Dairy Sci. 2012, 95, 1222–1239. [Google Scholar] [CrossRef]
  52. Komaragiri, M.V.; Erdman, R.A. Factors affecting body tissue mobilization in early lactation dairy cows. 1. Effect of dietary protein on mobilization of body fat and protein. J. Dairy Sci. 1997, 80, 929–937. [Google Scholar] [CrossRef]
  53. Williams, C.B.; Jenkins, T.G. A dynamic model of metabolizable energy utilization in growing and mature cattle. I. Metabolizable energy utilization for maintenance and support metabolism. J. Anim Sci. 2003, 81, 1371–1381. [Google Scholar] [CrossRef]
  54. Janssen, P.H. Influence of hydrogen on rumen methane formation and fermentation balances through microbial growth kinetics and fermentation thermodynamics. Anim. Feed. Sci. Tech. 2010, 160, 1–22. [Google Scholar] [CrossRef]
  55. Reynolds, C.K.; Aikman, P.C.; Lupoli, B.; Humphries, D.J.; Beever, D.E. Splanchnic metabolism of dairy cows during the transition from late gestation through early lactation. J. Dairy Sci. 2003, 86, 1201–1217. [Google Scholar] [CrossRef]
  56. Bigner, D.R.; Goff, J.P.; Faust, M.A.; Burton, J.L.; Tyler, H.D.; Horst, R.L. Acidosis effects on insulin response during glucose tolerance tests in Jersey cows. J. Dairy Sci. 1996, 79, 2182–2188. [Google Scholar] [CrossRef]
  57. Kraft, W.; Dürr, U.M. Klinische Labordiagnostik in der Tiermedizin, 7th ed.; Moritz, A., Ed.; Schattauer Verlag: Stuttgart, Germany, 2013; p. 934. [Google Scholar]
Figure 1. Effects of 3-nitrooxypropanol (3-NOP), dietary concentrate feed proportion (CFP) and time relative to parturition (TIME) on (A) metabolic CO2 production, (B) metabolic respiration quotient (Metabolic RQ) and (C) energy retention in body tissues (ERtissue) in peripartal dairy cows. , solid line = control high CFP (CONHC, n = 12); , dashed line = control low CFP (CONLC, n = 13); , solid line = 3-NOP high CFP (NOPHC, n = 11); , dashed line = 3-NOP low CFP (NOPLC, n = 9). Values are presented as LS-means.
Dairy 03 00009 g001
Figure 2. Bland–Altman plot (A) and linear relationship (B) of energy balance (EBGFE) and energy retention in body tissues (ERtissue) during ■ = period 1 (d 28 ante-partum − d 1 post-partum (p.p.)), = period 2 (d 1 p.p. − d 28 p.p.) and = period 3 (d 28 p.p. − d 120 p.p.). ERtissue was calculated by indirect calorimetry using the GreenFeed system and EBGFE according to GfE [24]. Formula EBGFE: EB (kJ NEL/kg body weight0.75 (BW0.75) and d) = net energy intake − net energy requirements for maintenance (NEM) − net energy for pregnancy (NEP) − net energy for lactation (NEL) with NEM (kJ NEL/d) = 0.293 × BW0.75 (kg), milk energy (kJ NEL/d) = 0.3 × milk fat % + 0.21 × milk protein % + 0.95, and NEL (kJ NEL/d) = milk energy (kJ NEL/d) + 0.1 × milk yield (kg/d). Formula ERtissue: ER in body tissues (kJ NEL/kg BW0.75 and d) = metabolizable energy intake − heat production − NEL − NEP (period 1). Statistics 2A: Bias (Dairy 03 00009 i001): 70 kJ NEL/kg BW0.75 and d; p < 0.001 with confidence interval (Dairy 03 00009 i002); lower limits of agreement (LoA) (Dairy 03 00009 i003): −149 kJ NEL/kg BW0.75 and d; upper LoA: 288 kJ NEL/kg BW0.75 and d; regression line (Dairy 03 00009 i004): y = 0.01x + 71 (RSE = 112 kJ/kg BW0.75 and d on 133 degrees of freedom, R2 = 0.0007, p = 0.756). Statistics 2B: regression line (Dairy 03 00009 i005; period 2 and 3): y = 0.67(0.02) x − 51(7); (RSE = 51 kJ NEL/kg BW0.75 and d on 88 degrees of freedom, R2 = 0.92, p < 0.001).
Dairy 03 00009 g002
Figure 3. Effects of 3-nitrooxypropanol (3-NOP), concentrate feed proportion in the ration (CFP) and time relative to parturition (TIME) on blood chemical parameters of (A) lactate, (B) hydrogen carbonate, (C) temperature-corrected pH, and (D) haemoglobin in peripartal dairy cows. , solid line = control high CFP (CONHC, n = 14); , dashed line = control low CFP (CONLC, n = 15); , solid line = 3-NOP high CFP (NOPHC, n = 14); , dashed line = 3-NOP low CFP (NOPLC, n = 12). Values are presented as LS-means. SEM, standard error of the means. Statistics with first measured value as covariate.
Dairy 03 00009 g003
Figure 4. Effects of 3-nitrooxypropanol (3-NOP), concentrate feed proportion in the ration (CFP) and time relative to parturition (TIME) on energy-related biochemical blood parameters of (A) ß-hydroxybutyrate, (B) non-esterified fatty acids, (C) triacylglycerides, and (D) glucose in peripartal dairy cows. , solid line = control high CFP (CONHC, n = 14); , dashed line = control low CFP (CONLC, n = 15); , solid line = 3-NOP high CFP (NOPHC, n = 14); , dashed line = 3-NOP low CFP (NOPLC, n = 12). Values are presented as LS-means. PSEM, pooled standard error of the means. Statistics with first measured value as covariate.
Dairy 03 00009 g004
Figure 5. (A) Relationship between (A) metabolic respiratory quotient (metabolic RQ), energy retention in body tissues (ERtissue (MJ/d)) and non-esterified fatty acids (NEFA (µmol/L)) as well as (B) Relationship between CH4 yield (g CH4/kg dry matter intake), molar propionate proportion in rumen fluid (Mol %) (data are shown in Schilde et al. [15] © 2021 The Author(s). Published by Informa UK Limited, trading as Taylor & Francis Group (https://www.tandfonline.com/) under the terms of the Creative Commons Attribution-NonCommercial-NoDerivatives License (https://creativecommons.org/licenses/by-nc-nd/4.0/), which permits non-commercial re-use, distribution, and reproduction in any medium, provided the original work is properly cited, and is not altered, transformed, or built upon in any way) and NEFA (µmol/L) from d 28 ante-partum until d 120 post-partum in experimental dairy cows supplied with 3-nitrooxypropanol (3-NOP) and varying concentrate feed proportion (CFP) in the ration. = control high CFP (CONHC); = control low CFP (CONLC); = 3-NOP high CFP (NOPHC); = 3-NOP low CFP (NOPLC). Statistics (A): multiple R2 = 0.38, p < 0.001. Statistics (B): multiple R2 = 0.59, p < 0.001.
Dairy 03 00009 g005
Table 1. Chemical composition, peNDF and energy (means) of the total rations offered during the experimental period from d 28 ante-partum until d 120 post-partum (reproduced from and with permission from Schilde et al. [15] at Taylor & Francis Group https://www.tandfonline.com/) © 2021 The Author(s). Published by Informa UK Limited, trading as Taylor & Francis Group (https://www.tandfonline.com/) under the terms of the Creative Commons Attribution-NonCommercial-NoDerivatives License (https://creativecommons.org/licenses/by-nc-nd/4.0/), which permits non-commercial re-use, distribution, and reproduction in any medium, provided the original work is properly cited, and is not altered, transformed, or built upon in any way.
ItemCON 3-NOP §
LCHCLCHC
DM + (g/kg)467582467597
Nutrient (g/kg of DM)
Crude ash63616361
Crude protein130138129140
Utilizable crude protein142150142151
Ether extract32353236
aNDFom 402344404337
Acid detergent fibreom226191227187
peNDF>8 mm #268269274273
Starch249303246307
Sugar17251727
Energy $ (MJ/kg of DM)
GE18.418.518.418.4
ME11.011.511.011.5
NEL6.67.06.67.1
Control (CON) groups were provided a placebo and low (LC) or high (HC) concentrate feed proportion in the ration. § 3-nitrooxypropanol (3-NOP) groups were supplemented with 48.4 and 51.2 mg of 3-NOP/kg of DM and LC and HC in the ration. + DM, dry matter. aNDFom, α-amylase treated neutral detergent fibre without residual ash. # peNDF>8 mm, physically effective NDF in the partial mixed ration defined as the proportion of DM retained by a 8-mm screen multiplied by the dietary NDF content [28]. $ Calculations for concentrates based on table values according to DLG [29], silages according to VDLUFA [27] analyses and GE calculated according to GfE [30].
Table 2. Fermentation and respiration gases (L/d; measured using the GreenFeed system), total (RQtotal) and metabolic respiration quotient (RQmetabolic) of the experimental groups during period (Per) 1 (d 28 ante-partum until day of calving), 2 (d 1 until d 28 post-partum (p.p.)) and 3 (d 29 until d 120 p.p.).
ItemTreatments SEMp-Values §
CONHC
(n = 12)
CONLC
(n = 13)
NOPHC
(n = 11)
NOPLC
(n = 9)
3-NOPCFP3-NOP
×PER
CFP
×PER
3-NOP
×CFP ×PER
VCH4 production
Per 1 0490 0495 0381 0397 20<0.001 <0.156 <0.001<0.001<0.001
Per 2 0440 0475 0314 0316
Per 3 0535 0542 0341 0438
Total VCO2 production
Per 16632637866626369160 <0.064 <0.132 <0.001 <0.282 <0.001
Per 26368628960025823
Per 37278671965576553
VCO2metabolic +
Per 15798553760145695140 <0.653 <0.041 <0.001 <0.043 <0.003
Per 25621548154685285
Per 36368579759785809
VO2 consumption
Per 16348619062676205138 <0.073 <0.436 <0.001 <0.342 <0.166
Per 25988593357095693
Per 36480616759105911
RQmetabolic
Per 10.910.900.960.920.007<0.001<0.001<0.001 <0.014 <0.001
Per 20.940.920.950.93
Per 30.980.941.010.99
RQtotal #
Per 11.041.031.061.030.0080.6380.0040.0010.602<0.001
Per 21.061.061.051.02
Per 31.121.091.111.11
Values presented as LS-means; CONHC, control high concentrate; CONLC, control low concentrate; NOPHC, 3-nitrooxypropanol (3-NOP) high concentrate; NOPLC, 3-NOP low concentrate. § Effects of 3-NOP, concentrate feed proportion (CFP), time period relative to parturition (PER), and interactions between them; effect of PER with p < 0.001 and 3-NOP×CFP with p > 0.1 for all variables. + VCO2metabolic (L/d) = Total VCO2 production (L/d) − VCO2fermentative (L/d), whereby VCO2fermentative (L/d) = 1.7 × VCH4 production (L/d). RQmetabolic = VCO2metabolic (L/d) ÷ VO2 (L/d), corrected for fermentative VCO2. # RQtotal = VCO2 (L/d) ÷ VO2 (L/d).
Table 3. Energy intake, expenditure and retention of the experimental groups during period (Per) 1 (d 28 ante-partum until day of calving), Per 2 (d 1 until d 28 post-partum (p.p.)) and Per 3 (d 29 until d 120 p.p.) estimated according to gas measurements presented in Table 4.
ItemTreatments SEMp-Values §
CONHC
(n = 12)
CONLC
(n = 13)
NOPHC
(n = 11)
NOPLC
(n = 9)
3-NOPCFP3-NOP
×CFP
3-NOP
×PER
CFP
×PER
3-NOP
×CFP
×PER
Metabolic body weight (kg BW0.75)
Per 11461441441462.90.7800.8680.5170.227<0.0010.417
Per 2132131129131
Per 3131127128128
Energy intake (kJ/kg BW0.75 and d)
Gross energy intake (GEI)
Per 11963181220221738640.546<0.0010.2100.146<0.0010.092
Per 22468243426202335
Per 33272290033792961
Metabolizable energy intake (MEI)
Per 11193107612881031400.325<0.0010.1100.379<0.0010.084
Per 21529145816311402
Per 32032173421111769
Energy expenditures (kJ/kg BW0.75 and d)
Net energy demand for pregnancy (NEP) +
Per 11151171181162.90.7020.9510.575
Milk energy excretion (MEE)
Per 2978991945960250.1950.4920.4760.852<0.0010.056
Per 31010931948935
Heat production (HP) #
Per 1916905930896170.0280.2110.738<0.0010.7500.267
Per 2967966940918
Per 3107110441001987
Methane energy (CH4E)
Per 11341371061065.3<0.0010.0990.913<0.001<0.001<0.001
Per 21321449695
Per 3161170106134
Energy retention (kJ/kg BW0.75 and d)
Energy retention in body tissues and milk (ERtotal)
Per 1295183372125410.084<0.0010.1370.002<0.0010.176
Per 2562492697485
Per 39616901103783
Energy retention in body tissues (ERtissue)
Per 1170652546450.036<0.0010.1010.0030.0220.715
Per 2−396−499−222−474
Per 3−23−230167−139
Energy balance calculated according to GfE [24] (EBGFE)
Per 1323245379216280.104<0.0010.0770.0660.0590.982
Per 2−323−397−229−398
Per 3−58−17154−154
Energy retention in fat depots (ERfat depot)
Per 2−185−175−169−181240.8410.9740.637
Residual energy retention (ERresidual)
Per 2−211−324−55−292480.0580.0010.205
Values presented as LS-means; CONHC, control high concentrate; CONLC, control low concentrate; NOPHC, 3-nitrooxypropanol (3-NOP) high concentrate; NOPLC, 3-NOP low concentrate. § Effects of 3-NOP, concentrate feed proportion (CFP), time period relative to parturition (PER), and interactions between them; effect of PER with p < 0.001 for all variables. + NEP (MJ/kg) = mean of 13 MJ of NEL/d in week 4 a.p. and 18 MJ of NEL/d during week 3 until parturition according to GfE [24]. MEE (MJ/kg) data from Schilde et al. [15]. # HP (MJ/d) = 16.18 × O2 (L/d) + 5.02 × CO2 (L/d) − 2.17 × CH4 (L/d) − 5.99 × 50 (g of urine nitrogen excretion/d) [22], gas volumes used from Table 4. CH4E (MJ/kg) = CH4 (L/d) × 0.03954 (MJ/L) [22]. ERtotal (MJ/d) = MEI − HP. ERtissue = MEI − HP − NEP and MEE, resp. EBGFE (MJ/d) = energy balance data from Schilde et al. [15] and calculated according to GfE [24] (footnote Figure 2). ERfat depot (MJ/d) = loss of fat depot masses (kg/d) from d 3 until d 28 p.p. from ultrasonic measurements × 39.8 (MJ/kg) × 0.84, 1 kg of body fat corresponds to 39.8 MJ of GE [22], whereby 16% is lost as heat when body tissue energy is converted into milk [40], 1 kg of body fat corresponds to 39.8 MJ of GE [22]. ERresidual (MJ/d) = ERtissue − ERfat depot.
Table 4. Changes in fat layer thickness (mm/d) and adipose tissue (AT) depot mass (kg/d) estimated from ultrasonic measurements of the experimental cows from d 3 until d 28 post-partum.
ItemTreatments SEMp-Values §
CONHC
(n = 14)
CONLC
(n = 15)
NOPHC
(n = 14)
NOPLC
(n = 12)
3-NOPCFP3-NOP
×CFP
Change in fat layer thickness
Back fat thickness−0.15−0.15−0.14−0.120.030.7090.8470.786
Rib fat thickness−0.16−0.15−0.17−0.130.030.8140.4930.699
Change in AT depot mass
Mesenteric−0.26−0.22−0.20−0.310.050.7750.4790.136
Omental−0.18−0.18−0.16−0.150.020.2850.9560.952
Retroperitoneal−0.12−0.10−0.13−0.110.020.7800.3670.894
Subcutaneous−0.17−0.18−0.17−0.140.020.4100.6160.399
Visceral +−0.56−0.50−0.48−0.570.070.9980.9960.330
Visceral and subcutaneous−0.73−0.68−0.65−0.700.080.7580.9940.627
Values are presented as LS-means; CONHC, control high concentrate; CONLC, control low concentrate; NOPHC, 3-nitrooxypropanol (3-NOP) high concentrate; NOPLC, 3-NOP low concentrate. § Effects of 3-NOP, concentrate feed proportion (CFP), and interactions between them. + PSEM, pooled standard error of the means. + Visceral AT depot mass (kg/d) = mesenteric + omental + retroperitoneal AT depot mass (kg/d).
Publisher’s Note: MDPI stays neutral with regard to jurisdictional claims in published maps and institutional affiliations.

