Abstract
Subclinical mastitis (SCM) is a very common disease of dairy cows. Currently, somatic cell count (SCC) is used for SCM diagnoses. There are no prognostic tests to detect which cows may develop SCM during the dry-off period. Therefore, the objectives of this study were to identify metabolic alterations in the serum of pre-SCM cows during the dry-off period, at −8 and −4 weeks before calving, through a targeted mass spectrometry (MS) assay. Fifteen cows, free of any disease, and 10 cows affected only by SCM postpartum served as controls (CON) and the SCM group, respectively. Results showed 59 and 47 metabolites that differentiated (p ≤ 0.05) CON and pre-SCM cows at –8 and −4 weeks prior to the expected date of parturition, respectively. Regression analysis indicated that a panel of four serum metabolites (AUC = 0.92, p < 0.001) at −8 weeks and another four metabolites (AUC = 0.92, p < 0.01) at −4 weeks prior to parturition might serve as predictive biomarkers for SCM. Early identification of susceptible cows can enable development of better preventive measurements ahead of disease occurrence.
1. Introduction
Subclinical mastitis (SCM) is the most common intramammary infection (IMI) of dairy cows. It poses a significant challenge for cow’s health and profitability of dairy farms [1,2]. Routinely, the most frequently used methods to identify SCM cows are the California Mastitis Test (CMT), Somatic Cell Count (SCC), and Electrical Conductivity (EC) tests which are normally attached to milking systems in the barn [3,4]. It should be noted that there are no SCM tests available during the nonlactating (dry-off) period [5].
During the dry-off period, cows have been found to be in a state of low-grade chronic inflammation at −8 and −4 weeks prepartum [6,7]. The potential reason for the chronic low-grade inflammatory state might be translocation of pathogenic bacteria, presence of bacterial endotoxins, or transport of proinflammatory cytokines from the sub-clinically infected udder to the systemic circulation [8]. Thus, the need to monitor cows during the dry-off period to identify cows at risk of SCM is critical in developing preventative measures and better farm management strategies.
Given that not all dairy cows are equally susceptible to mastitis or subclinical mastitis [9,10], there is a need to develop a pen-side test with a panel of metabolites that can distinguish between cows that are more susceptible to developing mastitis from healthy controls. Our hypothesis is that serum metabolic changes might occur at the beginning (−8 weeks) and in the middle (−4 weeks) of the dry period in pre-subclinical mastitis cows. We also hypothesized that a panel of screening biomarkers with high accuracy could be identified that can be used in the future to develop reliable pen-side tests for predicting SCM. Therefore, the objectives of this study were to identify prognostic serum metabolites at −8 weeks and −4 weeks for SCM in dry-off cows.
2. Materials and Methods
2.1. Animals, Diets, and Blood Samples
In this nested case-control study, a total of 145 multiparous Holstein cows were selected from which blood samples were collected from the coccygeal vein. Primiparous cows were excluded because milk samples were collected prior to dry off to determine SCC. Cows were selected from a commercial dairy farm in the province of Alberta, Canada. All experimental procedures were approved by the University of Alberta Animal Care and Use Committee for Livestock and conducted following the Canadian Council’s guidelines on Animal Care [11], with protocol number AUP00003216.
Cows were selected based on their expected date of calving. Sampling occurred at the beginning of the dry-off period and in the middle, respectively, at −8 weeks (55–58 days) and −4 weeks (27–30 days) before parturition. The blood samples were allowed to clot in ice. All metabolomic analyses were conducted at The Metabolomics Innovation Centre (TMIC, University of Alberta, Edmonton, AB, Canada). Blood samples were centrifuged at 2090 RCF (relative centrifugal force × g) for 15 min (Rotanta 460 R centrifuge, Hettich Zentrifugan, Tuttlingen, Germany) to collect serum samples. The separated serum was aspirated into sterile tubes using a transfer pipette (Fisher Scientific, Toronto, ON, Canada). Two hundred μL of serum were transferred into aliquots and stored at −80 °C to be run later on liquid chromatography tandem mass spectrometry (LC-MS/MS).
Cows sampled prepartum presented various disease conditions including mastitis, metritis, retained placenta, laminitis, displaced abomasum, milk fever, and ketosis postpartum. Health records for the periparturient diseases were gathered from the farm’s database. Data were collected for the number of culled cows or those that were removed by the veterinarian’s decision. Positive SCM cases were considered only for those cows having two or more consecutive weeks with milk SCC equal to or higher than 200,000 cells/mL. By this judgement, 15 dairy cows were considered healthy (CON), whereas only 10 cows had abnormally high SCC levels and were free of other diseases which were classified as pre-SCM. SCM cows did not develop clinical mastitis for the entire postpartum observational period (55–58 days). Body condition score (BCS) was measured for both groups during the sampling weeks. The feed ingredients, on a dry matter basis, offered to cows pre- and postpartum is presented in Table 1 and Table 2.

Table 1.
Ingredients of the prepartum diet for the dry-off cows.
Table 2.
Feed ingredients of cows during early lactation.
2.2. Animals, Diets, and Blood Samples
2.2.1. Sample Preparation
Blood samples were collected before the morning feed, between 07:00–08:00, using 10 mL vacutainer tubes (clot activator and serum separator tube; Becton Dickinson, Franklin Lakes, NJ, USA). Samples were then thawed on ice and vortexed before analysis. For the analysis of biogenic amines (BAs), amino acids (AAs), lipids, acylcarnitines (ACs), and glucose, 10 μL each of flow injection analysis (FIA) running buffer and LC internal standards (ISTD) were loaded into a 96-well filter plate, except for the first well, which acted as a double blank. From the second to the 14th well of the filter plate, three phosphate-buffer saline (PBS) “zero-point” control samples, seven calibration curve standards, and three quality control (QC) samples were added. Thawed serum samples were then added to the remaining wells. For samples and standards, a total of 10 μL was added to the respective wells. The plate was then incubated and dried under a flow of nitrogen (Zanntek Analytical Evaporator (Glas-Col, Terre Haute, IN, USA)) for 30 min. After being dried, 50 μL of 5% phenylisothiocyanate (PITC) solution was added to each well, and the plate was incubated at room temperature for 20 min. The plate was then dried again for 90 min under a flow of nitrogen. Extraction of the metabolites was accomplished by adding 300 μL methanol, containing 5 mM ammonium acetate. The plate was then placed on a shaker, shaking at 330 rpm for 30 min and then centrifuged for 5 min at 50× g, (Sorvall Evolution RC Superspeed Centrifuge (Fisher Scientific, Toronto, ON, Canada)), into the lower 96 deep-well plate. For the analysis of AAs and BAs, the extract was diluted with water 1:1, and 10 μL was injected into the column. For the analysis of ACs, lipids, and glucose, 150 μL of the extract was diluted with 400 μL of FIA running buffer, and 20 μL was injected in the column.
Protein precipitation was first conducted for the analysis of organic acids. In 1.5 mL Eppendorf tubes, 10 μL of an ISTD mixture solution, 50 μL of the samples (three phosphate-buffered saline (PBS) blank samples, seven calibration standards, three quality control samples and serum samples) and 150 μL ice-cold methanol were added. In total, 3:1 methanol: water was used in place of methanol for the blanks, calibration standards, and QC samples. Tubes then were vortexed and placed at −20 °C overnight. Samples were centrifuged at 21,000× g for 15 min before use. Following centrifugation, 50 μL of the samples were pipetted into the 96-deep well plate’s wells. Twenty-five microliters of each of the following three solutions: (1) 3-nitrophenylhydrazine (250 mM in 50% aqueous methanol), 1-Ethyl-3-(3-dimethyl aminopropyl) carbodiimide (150 mM in methanol) and pyridine (7.5% in 75% aqueous methanol) were added to each well. The whole plate was then shaken at 450 rpm for 2 h at room temperature to complete the derivatization reaction. After the reaction, 350 μL of water and 50 μL MeOH were added to each well to dilute and stabilize the solution for LC-MS/MS analysis.
2.2.2. FIA/LC—MS/MS Method
Identification of metabolites in serum samples was done through a targeted metabolomics approach using a TMIC Prime kit in Agilent 1100 series liquid chromatographic system (LC) (Agilent, Palo Alto, CA, USA) equipped with an Agilent reversed-phase Zorbax Eclipse XDB C18 column (3.0 × 100 mm, 3.5 μM particle size, 80 Å pore size) with a Phenomenex (Torrance, CA, USA) SecurityGuard C18 pre-column (4.0 × 3.0 mm) coupled with AB SCIEX QTRAP® 4000 mass spectrometer (Sciex Canada, Concord, ON, Canada). LC/MS grade formic acid and HPLC grade water were purchased from Fisher Scientific (Ottawa, ON, Canada). Ammonium acetate, phenylisothiocyanate (PITC) and HPLC grade acetonitrile (ACN) were purchased from Sigma-Aldrich (St. Louis, MO, USA). The LC-MS assay workflow was controlled through the Analyst® 1.6.2 software (Sciex Canada, Concord, ON, Canada).
The LC parameters used to analyze AAs and BAs were as follows: mobile phase A 0.2% (v/v) formic acid in water and mobile phase B 0.2% (v/v) formic acid in acetonitrile. The gradient profile was as follows: t = 0 min, 0% B; t = 0.5 min, 0% B; t = 5.5 min, 95% B; t = 6.5 min, 95% B; t = 7.0 min, 0% B; and t = 9.5 min, 0% B. The column oven was set at 50 °C. The flow rate was 500 μL/min, and the sample injection volume was 10 μL.
For the analysis of organic acids by LC-MS/MS, the solvents used were (A) 0.01% (v/v) formic acid in water and (B) 0.01% (v/v) formic acid in methanol. The column oven temperature was set to 40 °C. The flow rate was 300 μL/min, and the sample injection volume was 10 μL. The mass spectrometer was assigned to a negative electrospray ionization mode with scheduled multiple reaction monitoring (MRM) scanning.
2.3. Statistcal Analysis
Univariate analyses were conducted using Wilcoxon rank-sum test from the emmeans package in R (v4.0.2; Vienna, Austria (r-project.org)) with a significance level of p ≤ 0.05. The adjusted p values were performed using the false discovery rate (FDR) method and a value of q < 0.005. Multivariate statistical and biomarker analyses were run using MetaboAnalyst (v4.0; Edmonton, AB, Canada (metaboanalyst.ca)) following specific guidelines described in reference protocols [12,13]. Data normalization of all metabolite concentrations was done using data transformation and scaling options to create a Gaussian distribution (a bell-shaped curve). Metabolites with >50% of missing values were removed from further analysis. Half of the minimum concentration value was imputed in those with <50% of missing values.
To perform a standard cross-sectional two-group analysis, we compared healthy cows (CON) and the pre-SCM group at each time point, −8 weeks and −4 weeks prepartum. Multivariate statistical analyses, such as principal component analysis (PCA) and partial least-squares–discriminant analysis (PLS-DA), were conducted via MetaboAnalyst (v4.0; Edmonton, AB, Canada (metaboanalyst.ca)). Metabolic pathway analysis and identification of biomarker profiles were also performed following guidelines with MetaboAnalyst [13]. PCA and PLS-DA were used to distinguish the CON and pre-SCM cows using Score plots. Model validation was carried out using a cross-validation test, and a 2000 set permutation test was implemented to validate the reliability of the model [14]. In addition, the most influential compounds were ranked using Variable Importance in Projection (VIP) plots. Metabolites with p < 0.05 and VIP scores > 1 were the most discriminatory between the groups.
Metabolite set enrichment analysis (MSEA) was used to identify perturbed metabolic pathways, as implemented in MetaboAnalyst (v4.0; Edmonton, AB, Canada (metaboanalyst.ca)). Metabolite sets obtained from quantitative enrichment pathway analysis were considered statistically significant if the Holm corrected p value was < 0.05. The quality of the biomarker sets was determined using the receiver-operating characteristic (ROC) curve as generated by Monte-Carlo cross-validation (MCCV). ROC curves are often assessed using a single metric known as the area under the ROC curve (AUROC), which indicates a test’s accuracy for correctly distinguishing one group from another, such as pre-SCM cows from CON cows. A general guide for assessing the utility of a biomarker set based on its AUROC is: 0.9–1.0 = excellent; 0.8–0.9 = good; 0.7–0.8 = fair; 0.6–0.7 = poor; 0.5–0.6 = fail [15]. Supervised classification methods, such as support vector machine (SVM) and logistic regression analyses for several significant metabolites, were also performed to train the model.
3. Results
Cows were selected based on the development of SCM postpartum. The distinction between pre-SCM and CON was made possible by measuring SCC postpartum in the milk. We grouped cows into those that presented SCM against the CON group (Table 3 and Table 4). A cut-off value of > 200,000 SCC/mL of milk is a good indicator of an infected udder and for the diagnosis of SCM [16,17]. Of the recorded data, just 10 cows were diagnosed as affected by subclinical mastitis only (SCM, n = 10; 424,710 SCC/mL), free of other diseases, and 15 cows that were ascertained to be completely free of periparturient diseases (CON, n = 15; 27,450 SCC/mL). Control and pre-SCM cows had an average BCS of 3.78 and 3.95 and 3.70 and 3.92 at −8 and −4 weeks, respectively. See Table 3 for lactation data, BCS (body condition score), and milk yield.
Table 3.
General cow performance data (average), such as body condition score (BCS) and lactation number at −8 weeks and −4 weeks prior to the expected date of calving as well as somatic cell count (SCC) and milk yield measured for 8 weeks after calving.
Table 4.
Concentration of serum metabolites (MEAN ± SEM, (p ≤ 0.05)) in pre-subclinical mastitis cows only (pre-SCM, n = 10) and healthy controls (CON, n = 15) cows at −8 weeks before parturition, as identified by LC-MS/MS.
In this study, a total of 126 metabolites were identified and quantified by FIA/LC-MS/MS from the samples collected prior to disease diagnosis. From this set, we found 59 metabolites at −8 weeks and 47 metabolites at −4 weeks prepartum that differentiated the two groups (p ≤ 0.05), presented in Table 4 and Table 5. Non-significant metabolites are found in Tables S1 and S2 in Supplementary Materials.
Table 5.
Concentration of serum metabolites (MEAN ± SEM, (p ≤ 0.05)) in pre-subclinical mastitis cows only (pre-SCM, n = 10) and healthy controls (CON, n = 15) cows at −4 weeks before parturition, as identified by LC-MS/MS.
The univariate mean ± SEM concentration values, p values, and direction of change of these metabolites are provided in respective tables (Table 4 and Table 5), for both −8 and −4 weeks prepartum. Multivariate analysis, using both PCA and PLS-DA, showed a clear separation between pre-SCM (n = 10) vs. CON (n = 15) with respect to serum metabolites at −8 weeks prior to calving (Figure 1a,b).
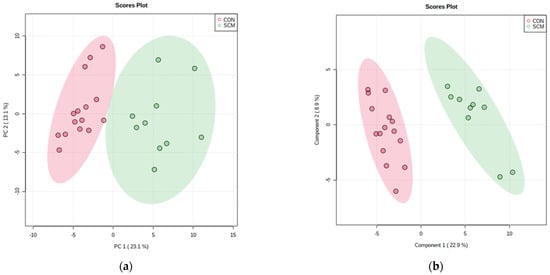
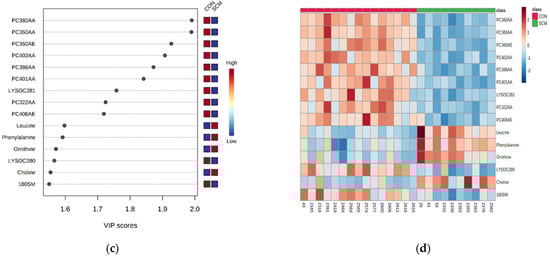
Figure 1.
(a) Principal component analysis (PCA) and (b) partial least square—discriminant analysis (PLS-DA; permutation test: p < 0.05) showing two separate clusters for CON and pre-SCM cows at −8 weeks before parturition; (c) metabolites ranked by variable importance in projection (VIP) and (d) heatmap of both samples and features based on PLS-DA to further investigate the identified variables.
The VIP plot (Figure 1c) for the PLS-DA ranks the top metabolites responsible for the differentiation between the two groups of cows, highlighting several glycerophospholipids and one sphingomyelin (SM) which were lower in the pre-SCM group than the CON group, as seen on heatmap as well (Figure 1d). At the same time, four metabolites, namely Leu, Phe, Orn, and choline were found to be higher in pre-SCM cows. Permutation testing with 2000 repetitions yielded a p = 0.007, which shows that the PLS-DA separation was statistically significant.
The top five metabolites found from the PLS-DA VIP plot showed an excellent performance in their respective ROC curve models (Figure 2a; AUC = 1; 95% CI: 1–1; p = 0.002).
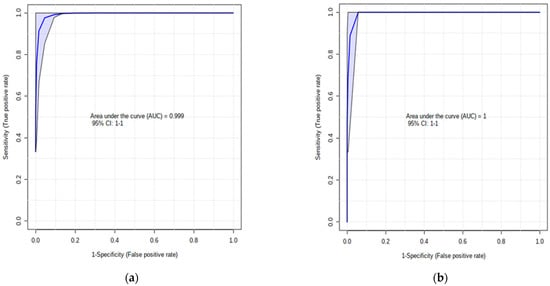
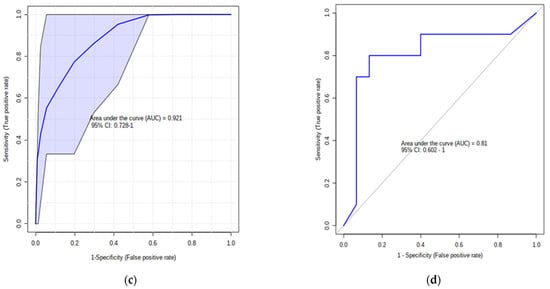
Figure 2.
(a) AUC of the top 5 VIP PLS-DA metabolites (PC aaC38:0, PC aa C36:0, PC ae C36:0, PC aa C40:2, PC aa C38:6) at −8 weeks before parturition; (b) AUC of model’s classification; (c) default linear SVM AUC of Leu, Betaine, Ala, and Orn (AUC = 0.92; p = 0.001) and (d) ROC plot with 10-fold CV for logistic regression of these 4 amino acids (AUC = 0.81; p = 0.05).
Overall, the multivariate exploratory analysis presented the best AUROC for the first 10 most important features with zero samples classified to the wrong group (Figure 2b). In support of building a significant panel of biomarkers, we selected specific variables from the univariate analysis (Table 4 and Table 5), the VIP plot (Figure 1c), and the metabolic pathways (Table 6) to build a default linear support vector machine (SVM) model (AUC = 0.92; p = 0.001; Figure 2c) and a logistic regression model (AUC = 0.81; p = 0.05; Figure 2d). To prevent optimistic and over-fitting results, 10-fold cross-validation (CV) was used to evaluate performance of each model.
Table 6.
Significant metabolic pathways identified from quantitative enrichment analysis and involved prior to occurrence of subclinical mastitis at −8 and −4 weeks before calving.
Unsupervised multivariate analysis such as PCA managed to satisfactorily separate the two groups of cows at −4 weeks before calving, whereas PLS-DA yielded excellent separation (Figure 3a,b).
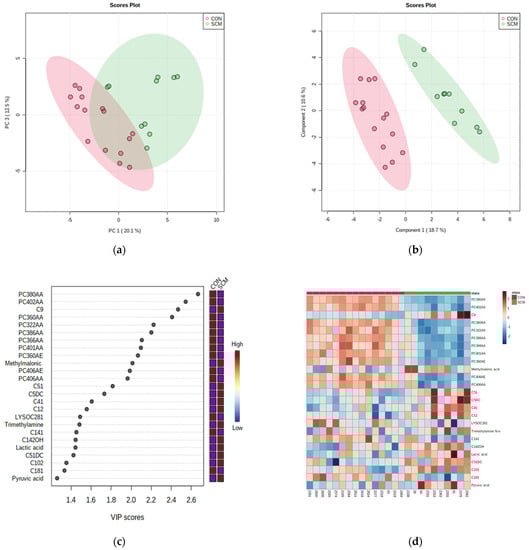
Figure 3.
(a) Principal component analysis (PCA) and (b) PLS-DA (permutation test: p < 0.05) of 15 CON and 10 pre-SCM cows at −4 weeks before parturition; (c) VIP plot of top 25 important features, and (d) heatmap of both samples and features based on PLS-DA to further investigate the identified variables.
Figure 3c,d show the metabolites that had the most impact in separating the two groups. Among those, methylmalonate, trimethylamine N-oxide, lactate, pyruvate, and eight ACs were higher in the serum of those cows that developed SCM. This time, we selected the top 25 important features from VIP to display other variables apart from several glycerophospholipids similar to the −8 weeks group. Indeed, those new metabolites were able to differentiate between both classes, even during pathway analysis. For example, as seen on the VIP plot (Figure 3c), pyruvate and lactate were found to be higher in pre-SCM cows than CON cows at −4 weeks prepartum.
The top scoring metabolites from the PLS-DA contributed the most to the separation of clusters. In particular, PC aa 38:0, PC aa 40:0, C9, PC aa 36:0, and PC aa 32:2 (Figure 3c) demonstrated excellent cluster separation between the pre-SCM group and the CON group (Figure 4a; p = 0.001) at −4 weeks prepartum.
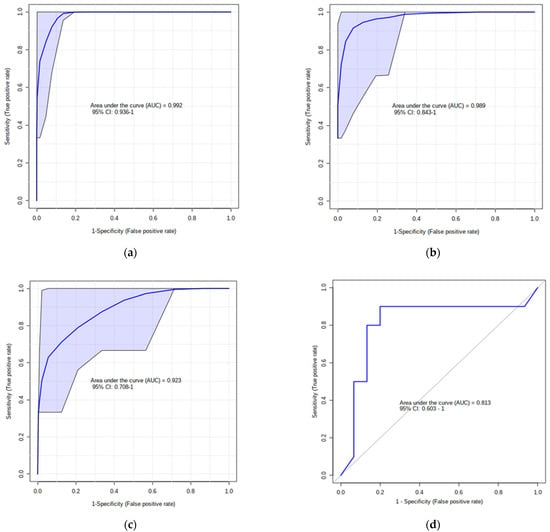
Figure 4.
(a) AUC of the top 5 VIP PLS-DA metabolites at −4 weeks before parturition and (b) AUC of model’s classification; (c) default linear SVM AUC model (AUC = 0.92; p = 0.01); (d) ROC plot with 10-fold CV for logistic regression algorithm (AUC = 0.81, p = 0.04).
In general, the best multivariate ROC curves, based on the cross-validation performance, were achieved from a model with 10 features, which generated a zero-confusion matrix (Figure 4b). Specific metabolites (methylmalonate, lactate, pyruvate, and Ala) that showed outstanding performance throughout the analysis, produced two AUCs using two different algorithms: respectively, the default linear SVM model (AUC = 0.92; p = 0.01; Figure 4c) and logistic regression model (AUC = 0.81; p = 0.04; Figure 4c).
Figure 5 displays the results of the quantitative enrichment analysis performed via MetaboAnalyst using various summary plots.
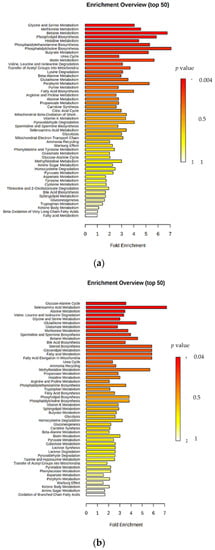
Figure 5.
Summary plots for quantitative enrichment analysis at (a) −8 weeks and (b) −4 weeks before calving.
At the same time, Table 6 presents the significant components of the metabolic pathways involved in the onset and progression of subclinical mastitis (Holm p ≤ 0.05).
Metabolites involved in betaine, methionine, glycine, and serine metabolism were significantly higher in pre-SCM at −8 weeks before parturition. Pathway analysis also indicated that up to −4 weeks before parturition, other perturbed metabolic sets, such as glucose-alanine cycle and seleno-amino acid metabolism were affected in cows susceptible to SCM.
The most discriminatory metabolites between pre-SCM and CON at −8 weeks (Figure 1c) and at −4 weeks (Figure 3c) were phosphatidylcholines (PCs) and lysophosphatidylcholines (LPCs), which have lower concentrations compared to other metabolites in the serum. The rationale for selecting the specific metabolites (Figure 2c,d; Figure 4c,d) for our predictive biomarker model is because these are more abundant and easily measured in a convenient pen-side test. However, a lab-based mass-spec test could use PCs and LPCs for high-throughput blood analysis.
4. Discussion
We hypothesized that cows affected postpartum by SCM might show serum metabolic changes starting from −8 and −4 weeks prior to calving. If this is proved to be correct, a panel of serum biomarkers could be constructed for predicting SCM. Indeed, the results of this study indicated that multiple serum metabolites were altered between pre-SCM and CON cows during the two dry-off time points measured. As a result, two specific metabolite panels were constructed. Given that cows were in a state of pre-SCM, it is assumed that systemic metabolite-changes were triggered from local immune responses in the mammary gland to support the host in the fight against mammary infection. Our data showed that in pre-SCM cows at −8 weeks prepartum, there was a total of 10 PCs, 10 LPCs, 10 SMs, 6 ACs, 17 AAs, and 6 organic acids (OAs) that differentiated pre-SCM from the CON cows. At −4 weeks prepartum, there was a total of 12 AAs, 3 OAs, 1 glucose/hexose, 2 LPCs, 10 PCs, 6 SMs, and 13 ACs that differentiated healthy cows from the pre-SCM ones. Identifying and understanding these metabolic changes is essential to predict the risk of cows developing SCM prior to diagnosis of SCM infection.
4.1. Blood Lipid Alterations and Related Metabolites in Pre-SCM Cows
One of the most important findings of the present study is the large number of PC species (10 out of 10 identified and measured) that differentiate the pre-SCM cows from healthy CON. All serum PCs were lowered in pre-SCM versus CON cows. These PCs were very-long-chain fatty acid species with C:32-C:40 carbon atoms. Most of the PCs found in blood are produced in the liver and secreted as part of lipoprotein fractions. It should be noted that PCs, triacylglycerol, and cholesterol are required for the assembly of the lipoprotein particles in the liver [18]. If production of any of these three lipid components is suppressed, then lipoprotein synthesis and secretion is downregulated. Suppression of lipid synthesis from the liver is associated with accumulation of lipids in hepatic cells and development of fatty liver. It is not clear why serum PCs decreased in the systemic circulation. One potential reason might be the inhibitory effects of systemic lipopolysaccharide (LPS) on lipoprotein synthesis and release from the liver. In support of this hypothesis are data reported by Minuti et al. (2015) that showed that intramammary infusion of LPS was associated with systemic inflammation and accumulation of triacylglycerols in the liver. Previously, we demonstrated that pre-SCM cows starting from −8 and −4 weeks prepartum were in a state of systemic inflammation [6]. Besides being part of lipoproteins, PCs have been proven to have anti-inflammatory activities [19]. Given that concentrations of PCs in the blood of pre-SCM cows were lowered, this might perpetrate the presence of a chronic low-grade inflammatory state in those cows.
Concentrations of all SMs (10 species at −8 weeks) and LysoPCs (10 species at −8 weeks) that differentiated pre-SCM cows from CON ones in pre-SCM cows were lower. Lower SMs in the blood is potentially desirable because they have been shown to suppress inflammatory responses against LPS. It has been shown that feeding 0.1% (wt/wt) milk sphingomyelins in an obesogenic diet lowers concentrations of proinflammatory cytokines including tumor necrosis factor (TNF), interleukin-6 (IL-6), and interferon-g (IFN-g) [20]. Given that pre-SCM cows had lowered SMs in the systemic circulation, this might have favored inflammatory processes that are necessary to clean bacterial antigens. In a previous study we reported that pre-SCM cows were in a state of chronic inflammatory condition during the dry-off period (at −8 and −4 weeks prepartum and during diagnosis week) as indicated by greater TNF and serum amyloid A (SAA) in the serum [6].
Results of this study showed that several serum LPCs were lowered in pre-SCM compared with CON cows. It is of note that LPCs have very important immunological functions, especially in infectious disease states. Not only do LPCs have bactericidal effects by increasing permeability of bacterial cell membrane, but at the same time they can also increase the antibiotic sensitivity of antibiotic resistant bacteria [21,22]. LPCs have also anti-inflammatory effects, which are related to the length of fatty acid associated with them. For example, arachidonoyl-LysoPC and 2-docohexaenoyl LPC have been reported to inhibit leakage of plasma, whereas docosahexaenoic acid at the sn-1 position and 18:0 LPC can lower concentration of several cytokines including TNF, IL-6, interleukin-1 (IL-1), and interleukin-10 (IL-10) [23,24]. The number of carbon atoms in the fatty acids’ component of LPCs in our study ranged from C14 to C28. All these important and potential antibacterial components were lowered in pre-SCM cows. Besides their direct bactericidal activities, LPCs can stimulate nicotinamide adenine dinucleotide phosphate oxidase (NADPH oxidase) activity and production of superoxide ions in neutrophils, increasing their antibacterial and inflammatory activity [25]. Neutrophils are the most dominant cells in the mammary gland during mastitis. Therefore, the decrease in several species of LPC in the serum of pre-mastitis cows during the dry off might have lowered the immune functions of cows and predisposed them to infection from bacterial pathogens.
Acylcarnitines were altered at both time points of this study. Out of six ACs identified as altered at −8 weeks prepartum in pre-SCM cows, five ACs were downregulated and only one was upregulated. At −4 weeks prepartum there were seven ACs that were upregulated and five that were downregulated. Therefore, there was not a specific trend with regard to changes in blood ACs in pre-SCM cows. Acylcarnitines derive from defective fatty acid b-oxidation in mitochondria [26] and they have been shown to affect cytokine production in T helper-17 (Th17 cells) [27]. Additionally, high ACs are correlated with the increased presence of pro-inflammatory mediators such as toll-like receptor (TLR), TNF, and interleukin-8 (IL-8) [28]. Most elevated AC in our study were short-chain fatty acids ACs, which are common during states of high reactive oxygen species (ROS) in the body [29]. Our results are in line with our earlier findings showing increased blood ACs in pre-ketotic and pre-metritic cows and the fact that those cows were in a state of chronic inflammatory state during the pre-calving period [30,31,32].
4.2. Blood Amino Acid Changes in Pre-SCM Cows
It is important to note that concentrations of AAs in the serum had no specific trends. Thus, at −8 weeks prepartum there were 11 AAs that were upregulated and six AAs that were downregulated in pre-SCM-O cows vs. the CON cows. Similarly, at −4 weeks prepartum there were eight AAs that were upregulated and four AAs that were downregulated in pre-SCM cows vs. the CON cows. There are only two amino acids that were consistently increased at both −8 and −4 weeks prepartum: Val and Ile.
Branched-chain amino acids (BCAA) including Val, Leu, and Ile were higher in the serum of pre-SCM vs. CON ones. These results agree with a previous study from our lab demonstrating greater blood concentrations of all three BCAA in pre-SCM cows [33]. Unlike most AAs, only a minor fraction of the dietary BCAAs are metabolized by the liver; whereas the majority of them enter the systemic circulation to reach their main metabolism sites, including skeletal muscles, adipose tissue, and brain [34,35]. Earlier data show that BCAA can trigger direct production of ROS and activation of nuclear factor-κB (NF-κB) in systemic peripheral blood mononuclear cells (PBMCs), as well as overexpression of proinflammatory cytokines including TNF and IL-6 [36]. The latter immune cells consist of lymphocytes (T-, B-, and natural killer (NK) cells) and monocytes.
Two other serum amino acids, Ser and Gly, were lower in the pre-SCM cows compared to CON ones at −8 weeks prepartum. It is interesting to note that both serine and glycine have been found to decrease in the systemic circulation during Gram-negative bacterial infection including Listeria monocytogenes and Pasteurella multocida [37]. A recent study in a rodent model showed that intramuscular administration of L-serine in mice infected with P. multocida increased survival rate [37]. Furthermore, the same authors indicated that exogenous L-serine lowered bacterial colonization of the lungs as well as suppressed cytokine production by macrophages and neutrophils. On the other hand, glycine has been shown to play an anti-inflammatory activity by lowering ROS production by macrophages and neutrophils [38]. There are two aspects of the effects of serine and glycine. The first one is that lowered Ser and Gly might help macrophages and neutrophils to produce proinflammatory cytokines to address the potential subacute infection in pre-SCM cows. The second aspect of lower Ser and Gly can be interpreted as a weakening of innate immune responses and increased susceptibility of those cows to periparturient infections including mammary gland infection. In support of this speculation, researchers have provided data indicating that long-term glycine exposure blunts activation of alveolar macrophages and neutrophils by lipopolysaccharide [39].
Two amino acid derivatives, choline and betaine, were higher in pre-SCM cows at −8 weeks prior to parturition but not at −4 weeks prepartum. These two metabolites are interconnected. Choline is an essential nutrient for the host because it takes part in many processes, including lipid metabolism and cell signaling. It is a constituent of PC, lysoPC, SM, acetylcholine, and a precursor for methyl-group donors such as betaine and Met [40,41]. At −8 weeks, choline and betaine were higher in pre-SCM cows, but PC and Met were lower than the CON cows. On the other hand, betaine is not only a metabolite of choline but also a methyl group donor that participates in methylation. Methylation, such as that of DNA and protein, is an essential biochemical process in animals. A previous study has shown that the availability of methyl group donors influences methylation levels [42]. It has been acknowledged that betaine, methionine, and choline are the most important methyl group donors present in diets. Betaine has several anti-inflammatory effects including inhibition of NF-κB and NLRP3 (NOD-, LRR- and pyrin domain-containing protein (3) activation) [43]. NF-κB includes a variety of genes involved in inflammation including TNF, IL-1, and interleukin-23 (IL-23) [43]. In an in vitro study, betaine treatment prevented LPS-induced (LPS is specific activator of TLR-4) NF-κB activation in RAW 264.7 murine macrophage cells [44]. Additionally, an earlier study demonstrated that betaine treatment can significantly inhibit NLRP3 inflammasome-related proteins, such as NLRP3 and mature caspase-1, and the levels of pro-inflammatory cytokines, including IL-1 [45].
4.3. Changes in Carbohydrate and Organic Acids in the Blood of Pre-SCM Cows
Blood glucose was higher at -8 prepartum but not at −4 weeks prepartum in pre-SCM cows. Among other functions of glucose, as a source of energy for multiple body functions and cells it is necessary to supply immune cells with sufficient energy, especially neutrophils [46]. Neutrophils are the most predominant cells in the mammary gland during both subclinical and clinical mastitis. They are predominantly glycolytic cells that produce ROS through the cytosolic enzyme NOX (nicotinamide adenine dinucleotide phosphate-oxidase). This process is essential for pathogen killing and regulation of inflammation. A recent study reported that induction of inflammation by administration of LPS was associated with increased glucose uptake by neutrophils, high production of ROS, and downregulation of genes associated with TCA (tricarboxylic acid) cycle [47]. Given that pre-mastitis cows during the dry-off period have been found to be under a chronic inflammatory state, it is plausible that high glucose might serve as a metabolite to energize neutrophils to migrate to the udder of pre-mastitis cows.
Another metabolite found to be higher in the serum and that differentiated the pre-SCM cows from the healthy ones was trimethylamine-N-oxide (TMAO). This is a molecule that derives from trimethylamine (TMA), which is produced when gut microbiota metabolizes choline, choline-containing compounds, betaine, and carnitine in the ration [42]. Once in the liver, TMA is converted to TMAO. TMAO has been shown to induce pathological changes to endothelial cells that increase adhesion of monocytes and leukocytes to blood vessels [48,49]. A growing body of evidence has shown that human subjects with high blood TMAO are in a state of systemic inflammation [50,51]. On the other hand, TMAO is suspected to be a danger-associated molecular pattern (DAMP) that interacts with the host’s PRR (pattern-recognition receptors), activating the innate immune response [52]. This is in line with our previous finding that pre-SCM cows were in a chronic low-grade inflammatory state [6].
5. Conclusions
In conclusion, preliminary results of this study showed that there were major changes in the concentrations of several lipid species, AAs, and OAs metabolites in pre-SCM cows versus CON ones at both −8 and −4 weeks prepartum. Data showed that most of the lipid species of PCs, SMs, LPC, and ACs were lowered in pre-SCM cows. Lipid metabolites, besides their structural and energy roles, play important roles in immune responses. Phosphatidylcholines, SMs, LPCs, and ACs have been shown to have anti-inflammatory effects. All lipid species measured in the blood of pre-SCM cows were lowered, which suggests that this creates conditions for mounting of an inflammatory response to clear the mammary gland from potential udder subclinical infections. Regarding blood AAs, some of them were increased and some others were lowered. Data showed that BCAAs were increased in pre-SCM cows, whereas Ser and Gly were lowered. BCAAs have been shown to trigger proinflammatory responses in peripheral blood mononuclear cells. Lowered Ser and Gly might also create conditions to support proinflammatory responses in pre-SCM cows. However, increased betaine and choline in pre-SCM cows might contribute to downregulation of inflammatory responses. Among organic compounds, glucose and TMAO were increased in the blood of pre-SCM cows. Glucose is used by neutrophils to support production of ROS and TMAO, which might serve as DAMP to activate innate immune responses. It should be noted that the study has a few limitations regarding the small number of cows in both experimental groups and related to the fact that experimental animals were taken from one dairy farm only. There were also no microbiological analyses to determine the potential presence of pathogenic bacterial at the time of sampling which might have caused the subclinical inflammatory condition. Additionally, all predictive biomarkers identified require further validation analysis in a larger and multiple site cohort of animals.
Supplementary Materials
The following are available online at https://www.mdpi.com/article/10.3390/dairy3010005/s1, Table S1: Concentration of serum metabolites (MEAN ± SEM) in pre-subclinical mastitis cows only (pre-SCM, n = 10) and healthy controls (CON, n = 15) cows at –8 weeks before parturition, as identified by LC-MS/MS, Table S2: Concentration of serum metabolites (MEAN ± SEM) in pre-subclinical mastitis cows only (pre-SCM, n = 10) and healthy controls (CON, n = 15) cows at −4 weeks before parturition, as identified by LC-MS/MS.
Author Contributions
Conceptualization, D.S.W. and B.N.A.; data curation, K.H., Z.L. and M.J.; formal analysis, K.H., Z.L. and M.J.; funding acquisition, D.S.W. and B.N.A.; methodology, M.J., S.M.D., D.S.W. and B.N.A.; project administration, K.H., Z.L., M.J., S.M.D., D.S.W. and B.N.A.; resources, S.M.D., D.S.W. and B.N.A.; supervision, S.M.D., D.S.W. and B.N.A.; validation, K.H., D.S.W. and B.N.A.; visualization, K.H. and Z.L.; writing—original draft, K.H. and Z.L.; writing—review & editing, K.H., M.J., D.S.W. and B.N.A. All authors have read and agreed to the published version of the manuscript.
Funding
This research was funded by Agriculture Funding Consortium and Alberta Milk, Canada, project#2018F003R.
Institutional Review Board Statement
All experimental procedures were approved by the University of Alberta Animal Care and Use Committee for Livestock and conducted following the Canadian Council’s guidelines on Animal Care [11], with protocol number AUP00003216.
Informed Consent Statement
Not applicable.
Data Availability Statement
Data are not available for intellectual property issues.
Acknowledgments
We are grateful to Sunalta Farms Inc. (Ponoka, AB, Canada) for their help and care to the cows used in this study. We acknowledge the partial help of two undergraduate students, Jacqueline Chang and Sandy Chow, in the collection of the samples. We also thank E. Dervishi, M. Berjanskii, R. Mandal, E. Dong, and J. Zheng from The Metabolomics Innovation Centre (Edmonton, AB, Canada) for their involvement and help with laboratory and statistical analysis.
Conflicts of Interest
The authors declare no conflict of interest.
References
- Thompson-Crispi, K.A.; Miglior, F.; Mallard, B.A. Incidence rates of clinical mastitis among Canadian Holsteins classified as high, average, or low immune responders. Clin. Vaccine Immunol. 2013, 20, 106–112. [Google Scholar] [CrossRef] [Green Version]
- Ruegg, P.L.; Petersson-Wolfe, C.S. Mastitis in dairy cows. Vet. Clin. N. Am. Food Anim. Pract. 2018, 34, ix–x. [Google Scholar] [CrossRef] [PubMed]
- Viguier, C.; Arora, S.; Gilmartin, N.; Welbeck, K.; O’Kennedy, R. Mastitis detection: Current trends and future perspectives. Trends Biotechnol. 2009, 27, 486–493. [Google Scholar] [CrossRef]
- Khatun, M.; Clark, C.E.F.; Lyons, N.A.; Thomson, P.C.; Kerrisk, K.L.; Garciá, S.C. Early detection of clinical mastitis from electrical conductivity data in an automatic milking system. Anim. Prod. Sci. 2017, 57, 1226–1232. [Google Scholar] [CrossRef]
- Hurley, W.L.; Theil, P.K. Perspectives on immunoglobulins in colostrum and milk. Nutrients 2011, 3, 442–474. [Google Scholar] [CrossRef]
- Dervishi, E.; Zhang, G.; Hailemariam, D.; Dunn, S.M.; Ametaj, B.N. Innate immunity and carbohydrate metabolism alterations precede occurrence of subclinical mastitis in transition dairy cows. J. Anim. Sci. Technol. 2015, 57, 46. [Google Scholar] [CrossRef] [Green Version]
- Rollin, E.; Dhuyvetter, K.C.; Overton, M.W. The cost of clinical mastitis in the first 30 days of lactation: An economic modeling tool. Prev. Vet. Med. 2015, 122, 257–264. [Google Scholar] [CrossRef] [PubMed] [Green Version]
- Eckel, E.F.; Ametaj, B.N. Invited Review: Role of bacterial endotoxins in the etiopathogenesis of periparturient diseases of transition dairy cows. J. Dairy Sci. 2016, 99, 5967–5990. [Google Scholar] [CrossRef] [PubMed]
- Ruegg, P.L. A 100-year review: Mastitis detection, management, and prevention. J. Dairy Sci. 2017, 100, 10381–10397. [Google Scholar] [CrossRef] [Green Version]
- Welderufael, B.G.; Løvendahl, P.; de Koning, D.J.; Janss, L.L.G.; Fikse, W.F. Genome-wide association study for susceptibility to and recoverability from mastitis in Danish Holstein cows. Front. Genet. 2018, 9, 141. [Google Scholar] [CrossRef] [Green Version]
- CCAC. CCAC Guidelines on: The Care and Use of Farm Animals in Research, Teaching, and Testing. 2009. Available online: https://ccac.ca/Documents/Standards/Guidelines/Farm_Animals.pdf (accessed on 22 October 2021).
- Xia, J.; Psychogios, N.; Young, N.; Wishart, D.S. MetaboAnalyst: A web server for metabolomic data analysis and interpretation. Nucleic Acids Res. 2009, 37, W652–W660. [Google Scholar] [CrossRef] [Green Version]
- Chong, J.; Wishart, D.S.; Xia, J. Using MetaboAnalyst 4.0 for comprehensive and integrative metabolomics data analysis. Curr. Protoc. Bioinform. 2019, 68, E86. [Google Scholar] [CrossRef]
- Xia, J.; Wishart, D.S. Web-based inference of biological patterns, functions and pathways from metabolomic data using MetaboAnalyst. Nat. Protoc. 2011, 6, 743–760. [Google Scholar] [CrossRef] [PubMed]
- Xia, J.; Sinelnikov, I.V.; Han, B.; Wishart, D.S. MetaboAnalyst 3.0-Making metabolomics more meaningful. Nucl. Acids Res. 2015, 43, W251–W257. [Google Scholar] [CrossRef] [PubMed] [Green Version]
- Schukken, Y.H.; Wilson, D.J.; Welcome, F.; Garrison-Tikofsky, L.; Gonzalez, R.N. Monitoring udder health and milk quality using somatic cell counts. Vet. Res. 2003, 34, 579–596. [Google Scholar] [CrossRef] [Green Version]
- Sargeant, J.M.; Leslie, K.E.; Shirley, J.E.; Pulkrabek, B.J.; Lim, G.H. Sensitivity and specificity of somatic cell count and California Mastitis Test for identifying intramammary infection in early lactation. J. Dairy Sci. 2001, 84, 2018–2024. [Google Scholar] [CrossRef]
- Alves-Bezerra, M.; Cohen, D.E. Triglyceride Metabolism in the Liver. Compr. Physiol. 2017, 8, 1–8. [Google Scholar] [CrossRef]
- Jung, Y.Y.; Nam, Y.; Park, Y.S.; Lee, H.S.; Hong, S.A.; Kim, B.K.; Park, E.S.; Chung, Y.H.; Jeong, J.H. Protective Effect of phosphatidylcholine on lipopolysaccharide-induced acute inflammation in multiple organ injury. Korean J. Physiol. Pharmacol. 2013, 17, 209–216. [Google Scholar] [CrossRef] [PubMed]
- Norris, G.H.; Porter, C.M.; Jiang, C.; Millar, C.L.; Blesso, C.N. Dietary sphingomyelin attenuates hepatic steatosis and adipose tissue inflammation in high fat diet-induced obese mice. J. Nutr. Biochem. 2017, 40, 36–43. [Google Scholar] [CrossRef] [PubMed]
- Miyazaki, H.; Midorikawa, N.; Fujimoto, S.; Miyoshi, N.; Yoshida, H.; Matsumoto, T. Antimicrobial effects of lysophosphatidylcholine on methicillin-resistant Staphylococcus aureus. Ther. Adv. Infect. Dis. 2017, 4, 89–94. [Google Scholar] [CrossRef] [Green Version]
- Parra Millán, R.; Jiménez Mejías, M.E.; Sánchez Encinales, V.; Ayerbe Algaba, R.; Gutiérrez Valencia, A.; Pachón Ibáñez, M.E.; Díaz, C.; Pérez Del Palacio, J.; López Cortés, L.F.; Pachón, J.; et al. Efficacy of Lysophosphatidylcholine in Combination with Antimicrobial Agents against Acinetobacter baumannii in Experimental Murine Peritoneal Sepsis and Pneumonia Models. Antimicrob. Agents Chemother. 2016, 60, 4464–4470. [Google Scholar] [CrossRef] [Green Version]
- Smani, Y.; Dominguez-Herrera, J.; Ibanez-Martinez, J.; Pachon, J. Therapeutic ef-ficacy of lysophosphatidylcholine in severe infections caused by Acinetobacterbaumannii. Antimicrob. Agents Chemother. 2015, 59, 3920–3924. [Google Scholar] [CrossRef] [Green Version]
- Li, W.; Zhang, W.; Deng, M.; Loughran, P.; Tang, Y.; Liao, H.; Zhang, X.; Liu, J.; Billiar, T.R.; Lu, B. Stearoyl lysophosphatidylcholine inhibits endotoxin-inducedcaspase-11 activation. Shock 2018, 50, 339–345. [Google Scholar] [CrossRef]
- Ojala, P.J.; Hirvonen, T.E.; Hermansson, M.; Somerharju, P.; Parkkinen, J. Acylchain-dependent effect of lysophosphatidylcholine on human neutrophils. J. Leukoc. Biol. 2007, 82, 1501–1509. [Google Scholar] [CrossRef] [PubMed]
- Mihalik, S.J.; Goodpaster, B.H.; Kelley, D.E.; Chace, D.H.; Vockley, J.; Toledo, F.G.S.; Delany, J.P. Increased levels of plasma acylcarnitines in obesity and type 2 diabetes and identification of a marker of glucolipotoxicity. Obesity 2010, 18, 1695–1700. [Google Scholar] [CrossRef] [PubMed] [Green Version]
- Nicholas, D.A.; Proctor, E.A.; Agrawal, M.; Belkina, A.C.; Van Nostrand, S.C.; Panneerseelan-Bharath, L.; Jones, A.R., 4th; Raval, F.; Ip, B.C.; Zhu, M.; et al. Fatty Acid Metabolites Combine with Reduced β Oxidation to Activate Th17 Inflammation in Human Type 2 Diabetes. Cell Metab. 2019, 30, 447–461.e5. [Google Scholar] [CrossRef]
- Rutkowsky, J.M.; Knotts, T.A.; Ono-Moore, K.D.; McCoin, C.S.; Huang, S.; Schneider, D.; Singh, S.; Adams, S.H.; Hwang, D.H. Acylcarnitines activate proinflammatory signaling pathways. Am. J. Physiol. Endocrinol. Metab. 2014, 306, E1378–E1387. [Google Scholar] [CrossRef] [PubMed] [Green Version]
- Schönfeld, P.; Wojtczak, L. Short- and medium-chain fatty acids in energy metabolism: The cellular perspective. J. Lipid Res. 2016, 57, 943–954. [Google Scholar] [CrossRef] [Green Version]
- Hailemariam, D.; Mandal, R.; Saleem, F.; Dunn, S.M.; Wishart, D.S.; Ametaj, B.N. Identification of predictive biomarkers of disease state in transition dairy cows. J. Dairy Sci. 2014, 97, 2680–2693. [Google Scholar] [CrossRef] [PubMed] [Green Version]
- Zhang, G.; Dervishi, E.; Dunn, S.M.; Mandal, R.; Liu, P.; Han, B.; Wishart, D.S.; Ametaj, B.N. Metabotyping reveals distinct metabolic alterations in ketotic cows and identifies early predictive serum biomarkers for the risk of disease. Metabolomics 2017, 13, 43. [Google Scholar] [CrossRef]
- Zhang, G.; Deng, Q.; Mandal, R.; Wishart, D.S.; Ametaj, B.N. DI/LC-MS/MS-based metabolic profiling for identification of early predictive serum biomarkers of metritis in transition dairy cows. J. Agric. Food Chem. 2017, 65, 8510–8521. [Google Scholar] [CrossRef]
- Dervishi, E.; Zhang, G.; Dunn, S.M.; Mandal, R.; Wishart, D.S.; Ametaj, B.N. GC-MS metabolomics identifies metabolite alterations that precede subclinical mastitis in the blood of transition dairy cows. J. Proteome Res. 2017, 16, 433–446. [Google Scholar] [CrossRef]
- Fernstrom, J.D. Branched-chain amino acids and brain function. Am. Soc. Nutr. Sci. 2005, 135, 1539S–1546S. [Google Scholar] [CrossRef]
- Hagenfeldt, L.; Eriksson, S.; Wahren, J. Influence of leucine on arterial concentrations and regional exchange of amino acids in healthy subjects. Clin. Sci. 1980, 59, 173–181. [Google Scholar] [CrossRef]
- Zhenyukh, O.; Civantos, E.; Ruiz-Ortega, M.; Sánchez, M.S.; Vázquez, C.; Peiró, C.; Egido, J.; Mas, S. High concentration of branched-chain amino acids promotes oxidative stress, inflammation and migration of human peripheral blood mononuclear cells via MTORC1 activation. Free Radic. Biol. Med. 2017, 104, 165–177. [Google Scholar] [CrossRef] [PubMed]
- He, F.; Yin, Z.; Wu, C.; Xia, Y.; Wu, M.; Li, P.; Zhang, H.; Yin, Y.; Li, N.; Zhu, G.; et al. L-Serine lowers the inflammatory responses during Pasteurella multocida infection. Infect. Immun. 2019, 87, e00677-19. [Google Scholar] [CrossRef] [PubMed] [Green Version]
- Ryan, T.P.; Aust, S.D. The role of iron in oxygen-mediated toxicities. Crit Rev Toxicol. 1992, 22, 119–141. [Google Scholar] [CrossRef] [PubMed]
- Wheeler, M.D.; Rose, M.L.; Yamashima, S.; Enomoto, N.; Seabra, V.; Madren, J.; Thurman, R.G. Dietary glycine blunts lung inflammatory cell influx following acute endotoxin. Am. J. Physiol. Lung Cell Mol. Physiol. 2000, 279, L390–L398. [Google Scholar] [CrossRef] [PubMed]
- Ishidate, K. Choline/ethanolamine kinase from mammalian tissues. Biochim. Biophys. Acta Lipids Lipid Metab. 1997, 1348, 70–78. [Google Scholar] [CrossRef]
- Vance, D.E.; Vance, J.E. Phospholipid biosynthesis in eukaryotes. In Biochemistry of Lipids, Lipoproteins and Membranes, 5th ed.; Elsevier: Amsterdam, The Netherlands, 2008; pp. 213–244. [Google Scholar] [CrossRef]
- Zeisel, S.H.; Warrier, M. Trimethylamine N-oxide, the microbiome, and heart and kidney disease. Annu. Rev. Nutr. 2017, 37, 157–181. [Google Scholar] [CrossRef] [PubMed]
- Go, E.K.; Jung, K.J.; Kim, J.Y.; Yu, B.P.; Chung, H.Y. Betaine suppresses proinflammatory signaling during aging: The involvement of nuclear factor-ΚB via nuclear factor-inducing kinase/IκB kinase and mitogen-activated protein kinases. J. Gerontol. Ser. A Biol. Sci. Med. Sci. 2005, 60, 1252–1264. [Google Scholar] [CrossRef] [Green Version]
- Kim, D.H.; Sung, B.; Kang, Y.J.; Jang, J.Y.; Hwang, S.Y.; Lee, Y.; Kim, M.; Im, E.; Yoon, J.H.; Kim, C.M.; et al. Anti-inflammatory effects of betaine on AOM/DSS-induced colon tumorigenesis in ICR male mice. Int. J. Oncol. 2014, 45, 1250–1256. [Google Scholar] [CrossRef] [PubMed] [Green Version]
- Zhang, W.; Wang, L.W.; Wang, L.K.; Li, X.; Zhang, H.; Luo, L.P.; Song, J.C.; Gong, Z.J. Betaine protects against high-fat-diet-induced liver injury by inhibition of high-mobility group box 1 and Toll-like receptor 4 expression in rats. Dig. Dis. Sci. 2013, 58, 3198–3206. [Google Scholar] [CrossRef] [PubMed]
- Bell, A.W.; Bauman, D.E. Adaptations of glucose metabolism during pregnancy and lactation. J. Mammary Gland Biol. Neoplasia 1997, 2, 265–278. [Google Scholar] [CrossRef]
- Khatib-Massalha, E.; Bhattacharya, S.; Massalha, H.; Biram, A.; Golan, K.; Kollet, O.; Kumari, A.; Avemaria, F.; Petrovich-Kopitman, E.; Gur-Cohen, S.; et al. Lactate released by inflammatory bone marrow neutrophils induces their mobilization via endothelial GPR81 signaling. Nat. Commun. 2020, 11, 3547. [Google Scholar] [CrossRef] [PubMed]
- Ma, G.H.; Pan, B.; Chen, Y.; Guo, C.X.; Zhao, M.M.; Zheng, L.M.; Chen, B.X. Trimethylamine N-oxide in atherogenesis: Impairing endothelial self-repair capacity and enhancing monocyte adhesion. Biosci. Rep. 2017, 37, BSR20160244. [Google Scholar] [CrossRef] [PubMed] [Green Version]
- Seldin, M.M.; Meng, Y.; Qi, H.; Zhu, W.F.; Wang, Z.; Hazen, S.L.; Lusis, A.J.; Shih, D.M. Trimethylamine N-oxide promotes vascular inflammation through signaling of mitogen-activated protein kinase and nuclear factor-kb. J. Am. Heart Assoc. 2016, 5, e002767. [Google Scholar] [CrossRef] [Green Version]
- Missailidis, C.; Hällqvist, J.; Qureshi, A.R.; Barany, P.; Heimbürger, O.; Lindholm, B.; Stenvinkel, P.; Bergman, P. Serum Trimethylamine-N-oxide is strongly related to renal function and predicts outcome in chronic kidney disease. PLoS ONE 2016, 11, e0141738. [Google Scholar] [CrossRef] [Green Version]
- Rohrmann, S.; Linseisen, J.; Allenspach, M.; Von Eckardstein, A.; Müller, D. Plasma concentrations of trimethylamine- N-oxide are directly associated with dairy food consumption and low-grade inflammation in a german adult population. J. Nutr. 2016, 146, 283–289. [Google Scholar] [CrossRef] [Green Version]
- Chan, M.M.; Yang, X.; Wang, H.; Saaoud, F.; Sun, Y.; Fong, D. The microbial metabolite trimethylamine N-oxide links vascular dysfunctions and the autoimmune disease rheumatoid arthritis. Nutrients 2019, 11, 1821. [Google Scholar] [CrossRef] [PubMed] [Green Version]
Publisher’s Note: MDPI stays neutral with regard to jurisdictional claims in published maps and institutional affiliations. |
© 2022 by the authors. Licensee MDPI, Basel, Switzerland. This article is an open access article distributed under the terms and conditions of the Creative Commons Attribution (CC BY) license (https://creativecommons.org/licenses/by/4.0/).