1. Introduction
Subclinical ketosis (SCK) is defined as a metabolic disorder of dairy cows, characterized by an accumulation of ketone bodies. It is indicated by an increased β-hydroxybutyrate (BHBA) level in body fluids (blood, milk, and urine) without obvious clinical signs [
1,
2]. It occurs predominantly in the first weeks of lactation due to a negative energy balance as a consequence of the onset of milk production. During this period, the energy demand of dairy cows is higher than the energy supply from the diet due to an insufficient feed intake. To meet the higher energy demand, the mobilization of body fat is a normal physiological regulation process in dairy cattle at the start of lactation [
3]. The amount of non-esterified fatty acids (NEFA) that are mobilized is the major determinant for SCK. In the liver, NEFA are either completely oxidized for energy use, re-esterified and exported from or stored in the liver, or incompletely oxidized to ketone bodies (BHBA, acetone, and acetoacetate). A high level of BHBA in the blood is also considered the reason for a decreasing feed intake. However, for ruminants, inconsistent results are reported for the influence of BHBA levels in blood on feed intake [
4]. A decreasing feed intake, followed by even less available energy, can result in a downward spiral into a more critical metabolic state during the peripartal period [
5].
First of all, SCK must be considered to impair cattle welfare. In addition, the economic losses are, according to [
6], even higher for SCK than for clinical ketosis due to its greater incidence. Disorders and diseases associated with SCK present higher risks of milk yield losses and clinical ketosis, displaced abomasum, lameness, metritis, mastitis, retained placenta, and impaired reproductive performance [
7,
8]. Due to its considerable prevalence and the involved production losses, it is important for herdsmen to be able to identify SCK fast and on-site at low costs. The standard method for the detection of SCK is the BHBA level in serum or plasma. In recent research works, several BHBA levels are discussed as thresholds. They vary from BHBA ≥0.9 mmol/L to ≥1.4 mmol/L or higher for different diseases associated with SCK or for SCK alone [
6,
9,
10]. The most commonly used thresholds for the detection of SCK are BHBA ≥1.0, ≥1.2 and ≥1.4 mmol/L.
Analyzing blood samples in the laboratory is expensive and the results are not available immediately. To help the herdsmen with the diagnosis and management of SCK, several methods and tools were developed. With on-farm tests for ketone bodies in blood, milk and urine, the detection of SCK becomes easier and more economic.
Various devices measuring BHBA in blood have been assessed regarding suitability and accuracy on the farm. For the interpretation of test results, sensitivity (Se) and specificity (Sp) are used. Sensitivity is the proportion of cows that are tested sick and are actually sick (true positive), and Sp is the proportion of cows that are tested healthy and are actually healthy (true negative).
In recent literature, high values of Se and Sp are reported for the BHB-Check (TD, TaiDoc Technology Corporation, Taiwan) (Se: 100%; Sp: 74%) and Freestyle Precision Neo (FSP; Abbott GmbH & Co. KG, Wiesbaden, Germany) (Se: 98%; Sp: 95%) at a threshold of ≥1.2 mmol/L [
11,
12]. With the same threshold, only slightly lower values (Se = 80%; Sp = 87%) were reached by a different device (Gluco Men LX Plus, GLP; A. Menarini Diagnostics, Berlin, Germany) [
11,
12,
13].
Early detection of a ketotic metabolic state is an important management tool in dairy husbandry. The main objective of this study was to give an overview on the performance and accuracy of commercially available devices for measuring BHBA in the blood for the on-farm indication of hyperketonemia.
2. Materials and Methods
The study was conducted in accordance with the German legislation on animal protection (Animal Welfare Act) and approved by the Lower Saxony State Office for Consumer Protection and Food Safety (LAVES, Oldenburg, Germany, AZ: 33.9-42502-05-17A106). Data were collected from April 2017 to March 2018 on 10 commercial dairy farms in north-western Germany. All herds were kept in loose-housing stalls with resting cubicles. The study was conducted over three weeks on each farm, consisting of one preparation week and 11 days of trial. Ten Holstein Friesian dairy cows per farm were chosen for the trial. They were selected from the dry cows on each farm based on the proximity of the calving date to the main sampling period (estimated parturition date within 2–3 weeks before the actual start). The lactation numbers were random due to the first requirement. A mean of 3.1 lactations with a minimum of 1 and a maximum of 8 lactations was reached. The average days in milk (DIM) during the trial (test day 1 to 11) was 19.6 d with a minimum of 5 d and a maximum of 38 d. The parity of the cows was distributed as follows: 1 = 15%, 2 = 29%, 3 = 20%, ≥4 = 36%. The average herd size was 337 cows (dry and lactating) and ranged from 191 to 584. In 2017, the herds’ energy-corrected milk yield (ECM, based on 4.0% fat, 3.4% protein) had a mean value of 10,124 kg, with a minimum of 9117 kg and a maximum of 11,606 kg.
Blood samples were collected on test days 2, 4, 9 and 11 from the ten test cows on each farm. The blood was taken from the coccygeal vessels and collected in 6 mL tubes with clot activator for analysis of BHBA in serum in the laboratory. The blood samples were left for clotting for 2 h at a temperature of approximately 15 °C. After that, they were centrifuged for 10 min at 2450× g. Two aliquots of serum were stored in vials at −18 °C until transportation to the laboratory of the Institute of Veterinary Medicine at the University of Goettingen. There, BHBA concentrations in serum were measured photometrically with the RANBUT RX MONZA BHBA Kit, No. RB 1007 (Randox, Crumlin, UK).
The measurement of BHBA on farm was conducted using four handheld devices (TD: BHB-check, TaiDoc Technology Corporation, Taiwan; GLP: Gluco Men LX Plus, A. Menarini Diagostics, Berlin, Germany; WVB: WellionVet BELUA, MED TRUST GmbH, Ottendorf-Okrilla, Germany; FSP: Freestyle Precision Neo, Abbott GmbH & Co. KG, Wiesbaden, Germany). Within 15 min after the blood sampling for the laboratory, the blood for analysis with the handheld devices was extracted from the coccygeal vessels with a cannula, BD Microlance™ 3, 1.2 mm × 50 mm (Becton Dickinson GmbH, Heidelberg, DE, Germany). The order in which the devices were used was random. For each analysis, new test strips were inserted into the instruments. After the devices indicated readiness to operate, the blood was inserted into the sensor openings on the test strips. The amount of blood needed for analysis with the devices ranged between 0.7 and 1.5 μL, and the measuring range was between 0 or 0.1 mmol/L and 8 mmol/L, both depending on the device. After 5 to 10 s, the results were shown on the display and noted on the data collection form for each handheld device and cow. In case of lower outside temperatures, the devices were kept warm to avoid failures of tests due to sensitivity for temperatures lower than 10 °C.
Both methods, the detection of BHBA with handheld devices and in the laboratory, are based on the same chemical reaction: β-hydroxybutyrate is oxidized to acetoacetate by the D-3-hydroxybutyrate-dehydrogenase. At the same time, NAD+ is reduced to NADH + H+. In the laboratory, the change of absorbance is measured photometrically. With the handheld devices, the change of the electric current due to the change of ions in the solution, detected by the sensor on the test strip, is measured amperometrically. Both measured values (absorbance and current) are directly correlated to the concentration of BHBA in serum.
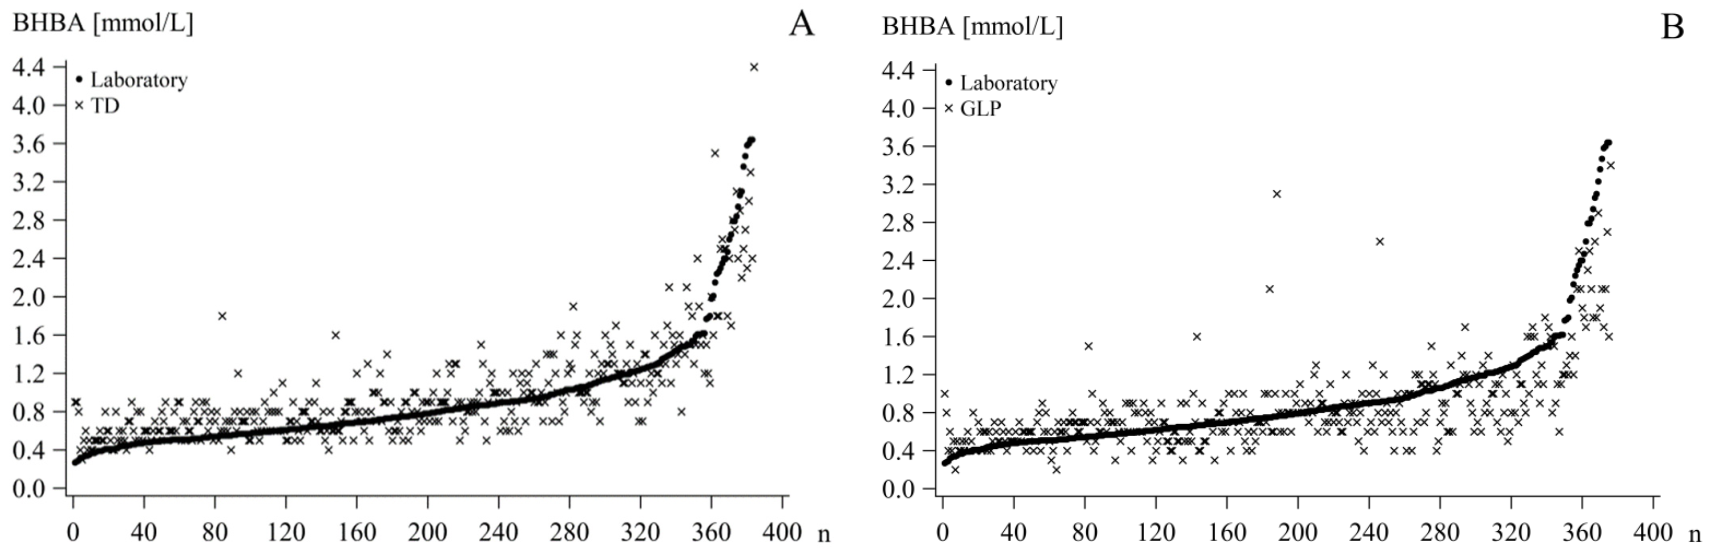
Statistical analyses were performed using SAS 9.4 (SAS Institute Inc., Cary, NC, USA), R Studio, R version 3.5.0, 2018 (The R Foundation for Statistical Computing, Vienna, Austria), and Microsoft Excel 2016 (Microsoft Corp., Redmond, WA, USA). Descriptive analyses were performed with PROC MEANS in SAS. Scatterplots were created for graphical analysis with PROC SGPLOT to illustrate the distribution of the BHBA from the handheld devices (BHBA
TD/GLP/WVB/FSP) depending on the BHBA analyzed in serum in the laboratory (BHBA
LAB) as the reference method (
Figure 1).
The BHBA
LAB as well as the corresponding device BHBA were assigned in three classes: low—BHBA
LAB ≤ 0.9 mmol/L; high—BHBA
LAB > 0.9 mmol/L; and total—all values unclassified. This cut-off was chosen due to the initial negative effects on the health and performance of cows with BHBA levels at this level [
7,
9].
Spearman correlation coefficients for BHBA
LAB and BHBA
TD/GLP/WVB/FSP were calculated with PROC CORR for each device to test the closeness of their association. The Spearman correlation coefficient was chosen due to a lack of normal distribution in the dataset and a lower outlier vulnerability Using only correlation coefficients to evaluate the degree of agreement of two methods can be inadequate; therefore, the data were further analyzed graphically and statistically [
14].
To evaluate the precision of measurement of the devices based on the reference analysis in the laboratory, the Se and Sp, as well as the false negative rate (FNR) and the false positive rate (FPR) were calculated with SAS PROC FREQ for 3 thresholds (BHBA ≥1.0, ≥1.2, or ≥1.4 mmol/L). The degree of agreement was calculated as the Phi (φ) coefficient. It ranges from −1 to +1, where 0 represents no agreement of the variables and ±1 represents perfect agreement/disagreement. The FPR is calculated as FPR = 1−Sp or the proportion of false positive results to the sum of true negative and false positive results. The FNR is defined as the proportion of false negative results to the sum of true positive and false negative results, or FNR = 1−Se. Positive test results are defined as BHBA concentrations of ≥1.0, ≥1.2, or ≥1.4 mmol/L, measured by the devices and the laboratory, respectively. Negative results are below the mentioned thresholds. True positive results are positive test results of the devices as well as the reference test. False positive results show a positive BHBATD/GLP/WVB/FSP and a negative BHBALAB. True negative means that the BHBATD/GLP/WVB/FSP as well as the BHBALAB show negative test results. A false negative entails negative BHBATD/GLP/WVB/FSP but positive BHBALAB. The main goal should be a high Se and Sp. However, a higher FPR is preferred to a higher FNR due to the superior goal of animal welfare—more weight is given to the higher costs of SCK cases that have not been diagnosed earlier, as opposed to the treatment costs for cows falsely identified as sick. It also favors a strategy of maximal detection of SCK animals.
Bland–Altman plots, created in SAS with PROC SGPLOT, were used for graphically analyzing the agreement of the two methods. For each sample pair, the mean and the difference were calculated. The difference between the two methods was plotted against their means. The zero-bias line and the mean difference of the BHBA
TD/GLP/WVB/FSP and BHBA
LAB, as well as the confidence limits (standard deviation (SD) * 1.96) above and below the mean difference, were added (
Figure 2).
To evaluate the strength of the agreement between the BHBA
TD/GLP/WVB/FSP and the BHB
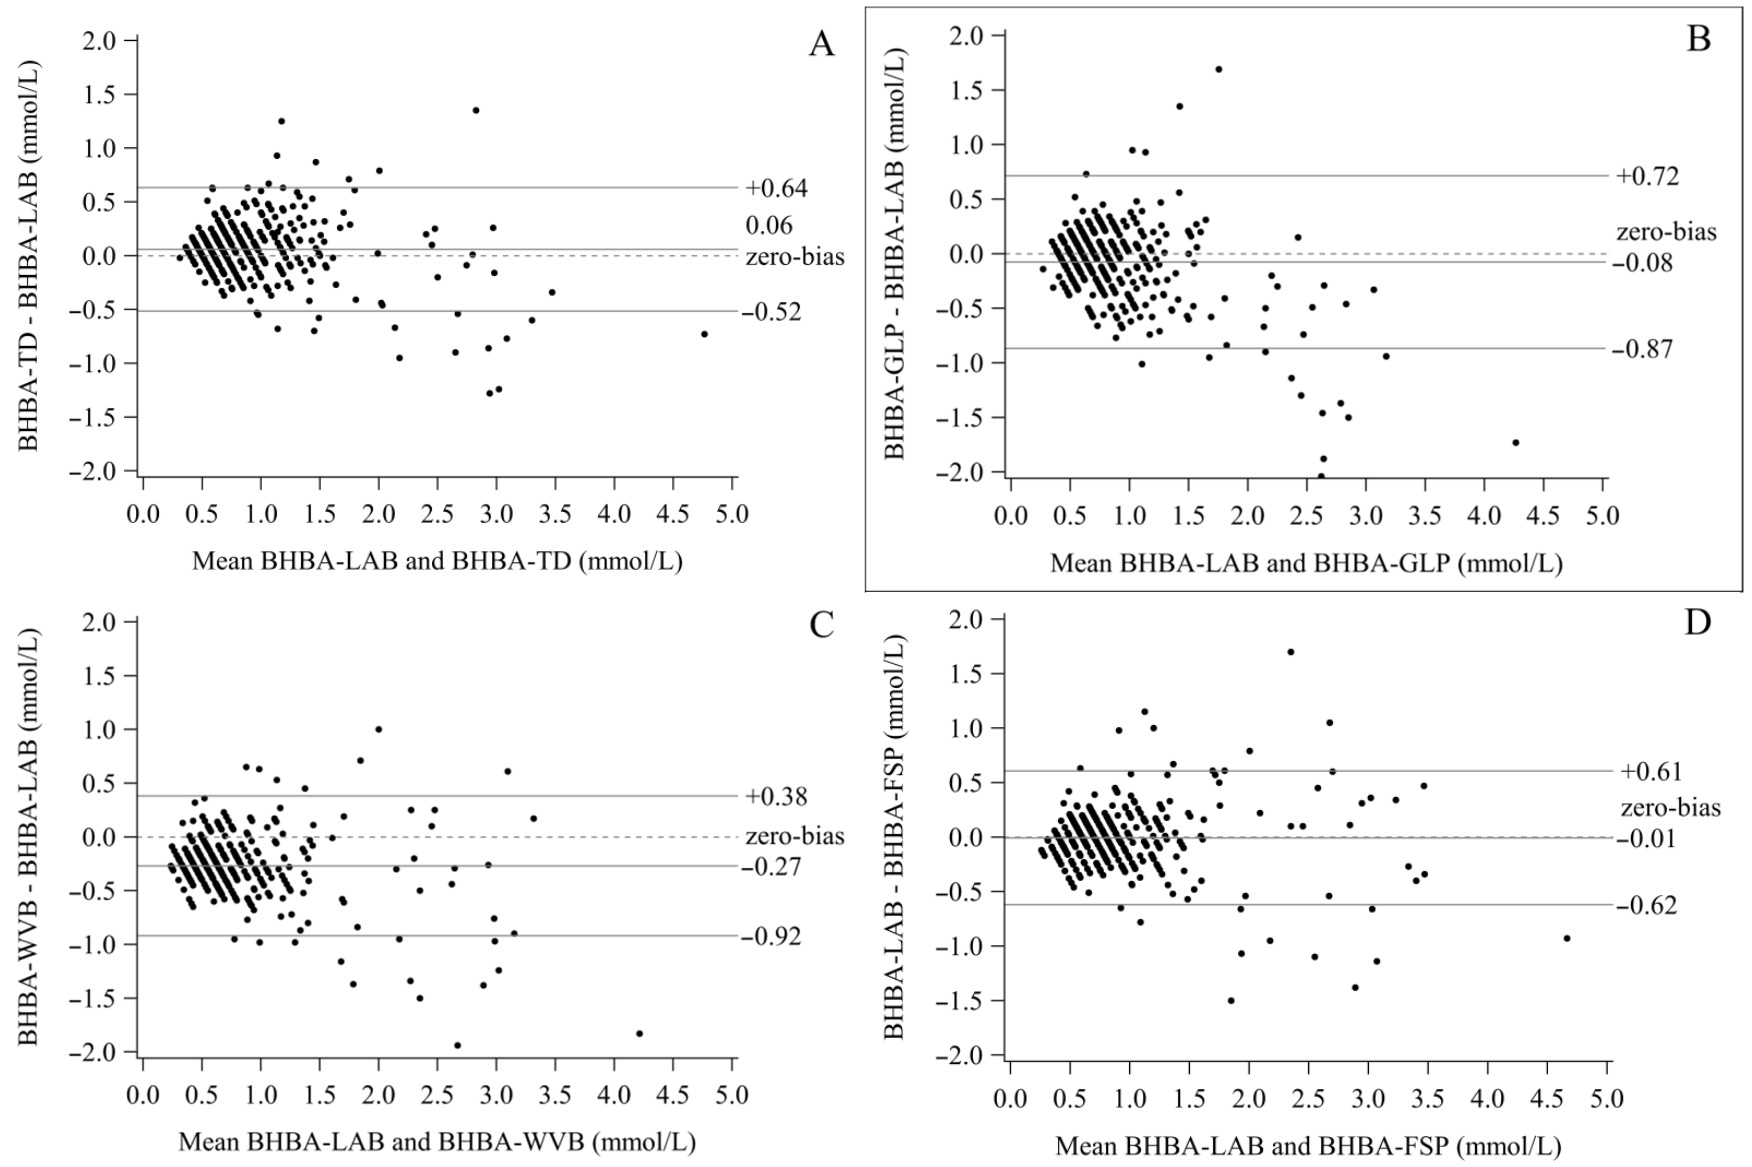
LAB, Passing–Bablok regressions (PBR) were developed in R with the mcr package. This method is less sensitive to outliers compared to normal linear regression because it assumes errors in both methods (x and y). A perfect agreement between the two methods is represented through an intercept (a) of 0 and a slope (b) of 1. Based on this, assumptions are made. If the confidence interval (CI) of the intercept includes 0, it is assumed that there is no considerable constant bias. If it does not include 0, the two tested methods differ at least by a constant concentration of BHBA. Similarly, it was suggested for the slope that there is no bias if 1 is included in the CI. If 1 is not included, at least a proportional difference between the two methods is present [
15]. The bias was calculated for the range of BHBA
LAB of 0–5 mmol/L and plotted. A positive bias is preferred to a negative based on the same arguments favoring a higher FPR over a higher FNR. Due to our interest in the accuracy, especially in the higher range of BHBA (>0.9 mmol/L), the regression was calculated for all three classes. The bias was calculated and plotted for the high and total of each class (
Figure 3).
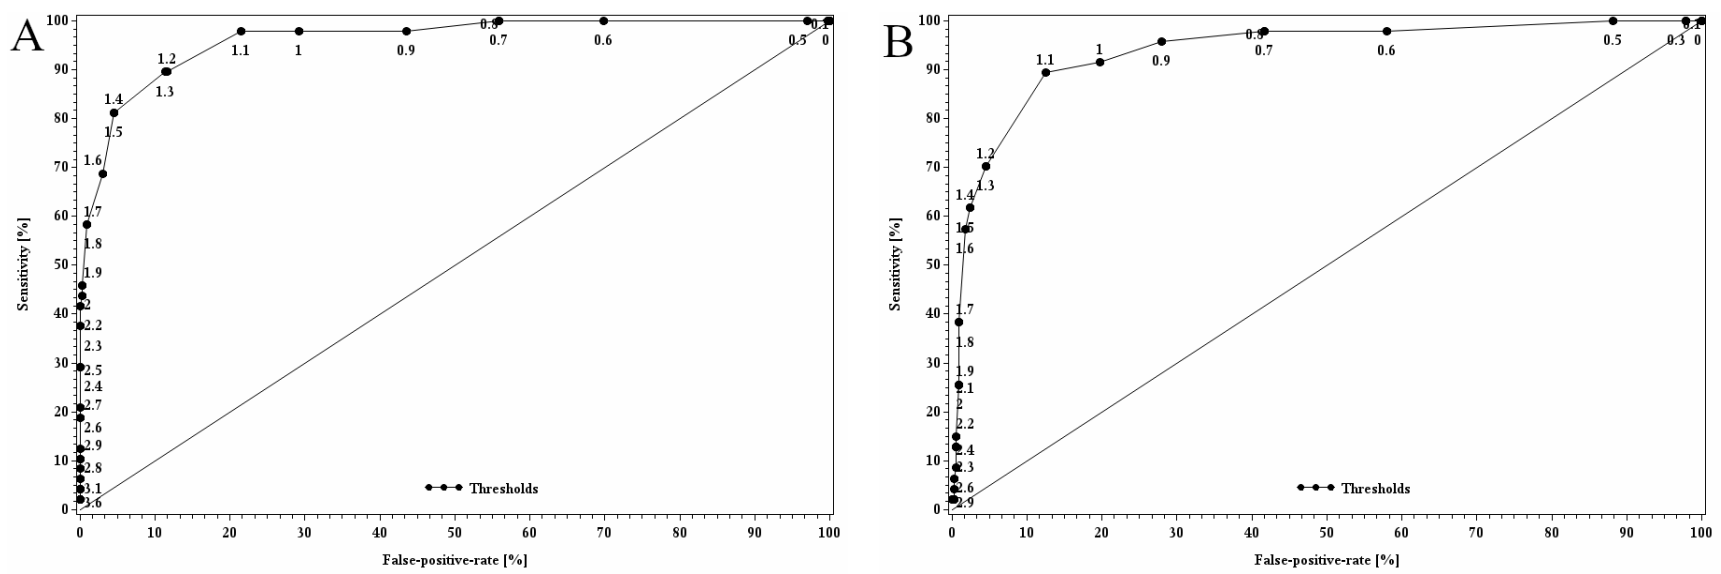
To determine a device-specific threshold, the receiver operating characteristics curve (ROC) for each device was developed in SAS. ROC analysis is a tool used to optimize thresholds. Possible cut-offs between 0 and 5 mmol/L, with increments of 0.1 mmol/L, were tested. The Se and FPR were calculated for each and plotted against each other for each possible cut-off. To determine the best cut-off for each device, the one with the largest Youden Index was chosen. The Youden Index (YI) is calculated as YI = Se (%) + Sp (%) − 100. As an assessment of the quality of the adjusted threshold, the area under the ROC (AUC) was calculated. The AUC is equal to the probability of discriminating correctly between a randomly chosen sick cow (BHBA in blood serum above threshold) and a randomly chosen healthy cow (BHBA in blood serum below threshold) if the adjusted threshold is used (
Figure 4).
3. Results
The mean BHBA
LAB was 0.94 mmol/L blood serum with a standard error of the mean of 0.03 mmol/L and a median of 0.76 mmol/L. The values ranged from 0.27 to 5.13 mmol/L. During the trial, a total of 395 blood samples were obtained for the laboratory. The number of analyzed values varied slightly between the devices due to errors shown at individual measurements (
Table 1). Only BHBA values that had a corresponding BHBA
LAB were entered into the statistical analysis (TD:
n = 384; GLP:
n = 376; WVB:
n = 344; FSP:
n = 388). The Spearman correlation coefficients of BHBA
LAB with BHBA
TD/GLP/WVB/FSP showed high correlations: BHBA
TD—0.78; BHBA
GLP—0.67; BHBA
WVB—0.76; and BHBA
FSP—0.80.
Figure 1 depicts scatterplots with the distribution of BHBA
TD/GLP/WVB/FSP based on BHBA
LAB. The TD shows higher BHBA concentrations for the lower range of BHBA
LAB. However, they seem to be evenly distributed for higher BHBA
LAB. The BHBA
GLP concentrations in the lower range of BHBA
LAB are higher as well, but in the higher BHBA
LAB range, they seem to be below the BHBA
LAB. The WVB shows, for the whole range, lower values than BHBA
LAB. For the FSP, the BHBA concentrations seem to be slightly higher for lower BHBA
LAB concentrations and evenly distributed for the higher range. Based on these results, a separate analysis of the higher, lower, and total BHBA
LAB values appeared to be appropriate. Therefore, further analysis of the BHBA measured with the four devices was conducted for three classes: low, high, and total.
The results based on the BHBA
LAB as the reference can be seen in
Table 2. For all four devices, the highest YI was reached at the threshold of ≥1.4 mmol/L (TD = 79, GLP = 63, WVB = 60, FSP = 74). The lowest YI was calculated at the threshold of ≥1.2 mmol/L (TD = 68, GLP = 54, WVB = 50, FSP = 66). The Se was between 52.9 and 83.1% at the threshold of 1.2 mmol/L and between 61.2 and 85.4% at the threshold of ≥1.4 mmol/L. Sp was higher than Se as well at the threshold of ≥1.4 mmol/L with 93.2 to 99.0% in contrast to 85.3 to 97.5% (≥1.2 mmol/L). FPR was high due to the relatively low Se, whereas the Sp was high with a low FNR. Phi showed a strong association between the variables of 0.57 to 0.66, 0.56 to 0.63 and 0.67 to 0.72 for the applied thresholds (
Table 2).
To analyze the agreement of the two methods, the BHBA concentrations, analyzed by each of the four handheld devices, were compared to the BHBA measured in the laboratory using the Bland–Altman plot (
Figure 2). With a mean difference (± SD) of 0.060 ± 0.29 mmol/L, the TD showed a positive bias, while a negative bias was calculated for the GLP (total mean difference of 0.075 ± 0.40 mmol/L). The WVB showed the largest deviation from the zero-bias line with a mean difference of −0.269 ± 0.33 mmol/L. The FSP showed the lowest deviation from the zero-bias line, with a bias of −0.007 ± 0.31 mmol/L. The spreading increased for higher BHBA values for all devices. The highest SD was found for the GLP with 0.40 mmol/L in comparison to 0.29 to 0.33 mmol/L (
Table 3).
In the following, only the classes’ total and high values are analyzed with the PBR since only they include the critical range of values as opposed to the low values of the classes. The PBR showed different slopes and intercepts for each class (
Table 4). The intercepts in the classes’ totals ranged from −0.186 (WVB) to 0.123 (GLP) mmol/L. In the classes’ high values, they were considerably lower, with −0.416 (WVB) to −0.089 (TD). For the classes’ total values, 0 was only included in the CI of the FSP; for the classes’ high values, 0 was included by TD and GLP. For the classes’ total values, the slope was below 1 for TD, GLP, and WVB, whereas the slope of FSP was 1.009. Only TD and FSP included 1 in the CI of the slope in the classes’ total values. For the classes’ high values, the slope was above 1 for all devices except GLP. The value of 1 was included in the CI for all four devices.
Figure 3 shows the absolute biases of BHBA
TD/GLP/WVB/FSP, plotted against the corresponding BHBA
LAB. It is shown for classes’ total and high values. For the classes’ total values, it shows that the absolute biases of BHBA
TD, BHBA
GLP and BHBA
WVB decreased with higher BHB
LAB, whereas the absolute bias of FSP became larger. In addition, the level of the absolute biases differed considerably between the devices. The TD and FSP show a positive absolute bias for the range of 0–5 mmol/L, the GLP and WVB show decreasing negative absolute biases for BHBA
LAB ≥ 1.0 mmol/L. For the classes’ high values, the absolute bias was more distinct. In the range of the applied thresholds, all four devices show negative absolute biases. They increased for TD, FSP, and WVB. However, the WVB stayed in the range of 0–5 mmol/L in the negative bias, whereas TD and FSP reached a positive absolute bias at BHBA
LAB = 1.7 mmol/L. The GLP shows a negative trend and was located in the negative.
To optimize the performance, adjusted thresholds for the devices were determined by performing ROC analyses for corresponding serum BHBA
LAB concentrations of ≥1.0 mmol/L, ≥1.2 mmol/L and ≥1.4 mmol/L (
Table 5). The largest YI was found for each device at a BHBA
LAB of ≥1.4 mmol/L. Here the adjusted thresholds varied between ≥0.9 and ≥1.3 mmol/L. The TD had, in this case, the highest adjusted threshold of ≥1.3 with Se = 90% and Sp = 89%. The FPR was 11%. The GLP had a device-specific threshold of ≥1.1 mmol/L with Se = 89% and Sp = 88%; the FPR was almost equal to that of TD, with 13%. The lowest adjusted threshold showed the WVB at ≥ 0.9 mmol/L. The Se was higher than for TD and GLP at 94%, and the Sp was 89%. The FPR of 11% was on the same level as TD and GLP. An adjusted threshold of ≥1.1 mmol/L was the result for the FSP with Se = 98% and Sp = 83%. The FPR was highest with 17%. The AUC was calculated as an indicator of the quality of the results of the ROC analysis. For all four devices, it was high. The AUC for TD (96%), WVB (97%), and FSP (96%) were slightly higher than for the GLP with 94%. Phi shows a strong agreement between the two variables. In comparison with the initial analysis of the performance (
Table 2), it slightly decreased. Here, the highest Phi for all four devices was found for the threshold of ≥1.0 mmol/L (0.66 to 0.72).
From the farmer’s point of view, the main goal of implementing tools for the detection of SCK should be to enable high detection accuracy. In this study, the quality of measurement of such tools was assessed. To evaluate the accuracy of rapid test methods, it is essential to compare the test results with a reference method. In this study, the BHBA in serum, analyzed photometrically in the laboratory, was used as a reference.
The Bland–Altman plots show, for the TD, GLP, and FSP, relatively small positive/negative biases (mean difference of BHBA
TD/GLP/WVB/FSP and BHBA
LAB), whereas the bias was larger for the WVB, at −0.269. This resulted in the underestimation of the BHBA in the mean. In consequence, fewer sick cows would be found and treated. Regarding the accuracy of the measurements, another factor that should be considered is the 95% limits of agreement (CI). The differences in the spread of values can have an impact on the mean difference and distort the results. The plots show heterogeneity of variance (heteroscedasticity) for all four devices. The standard deviations of TD and FSP, relative to previously reported evaluations, were slightly higher or on a similar level, whereas the standard deviation of GLP, at 0.40 mmol/L, was almost twice as high as reported in the literature [
2,
11,
12,
13,
16]. Narrower limits of agreement indicate a better agreement between the tested methods. Consequently, the agreement between the analyses in this study was comparable to previous reports, except for the GLP. The difference between the devices’ SDs was probably not a result of the handling of the blood samples because these processes were identical for all four devices. As a potential factor, the outside temperature may be considered, even though it was the same for all devices at the time of sampling. A further argument to this was made by [
2]; in this investigation, the sample temperature had an influence on the results but not the ambient temperature.
The difference in the agreement between methods was also reflected in the Spearman correlation coefficients. Individually they were considered high but, in comparison to similar studies with the same meters (0.81 to 0.95), they were low [
2,
11,
12,
13,
16]. Due to taking both blood samples in this study within a short time interval, factors such as temperature or diurnal variation should not have influenced the results.
The overall mean bias from the Bland–Altman plot allows no statement on the accuracy within the critical range of BHBA (≥0.9 mmol/L). To analyze the accuracy of the different classes, the PBR was developed for each. The negative slopes of TD, GLP, and WVB led to increasing underestimation of the class totals. The level differed between the devices. Here, the largest absolute biases for the applied thresholds were found for WVB (−0.30 to −0.34 mmol/L) and GLP (−0.07 to −0.14 mmol/L). The absolute biases for the TD and FSP were nearly constant (TD: 0.07 to 0.06 mmol/L; FSP: 0.01 mmol/L). For the classes’ high values, TD, WVB, and FSP showed positive slopes, which improved the biases of the devices in particular. TD showed biases between 0.4 and 0.2 mmol/L, and GLP underestimated the BHBALAB by −0.24 to −0.26 mmol/L. The bias of the WVB was in this case was nearly constant with −0.38 to −0.37 mmol/L and the FSP showed biases of −0.13 to −0.05 mmol/L. The largest biases were found for GLP and WVB. Overall, biases of this type can lead to lower performance if the measured BHBA are not corrected. One solution could be to use the mentioned biases as a correction factor, especially in the range where the thresholds are. The bias should be corrected to increase the detection rate. Generally, a device with a bias of −0.2 mmol/L at a BHBALAB of 2.0 mmol/L would still be able to identify a sick cow correctly at this level. Critical for the detection of SCK are especially severe underestimations in the range of the chosen threshold, which was the case for GLP and WVB. The considerable sample size difference between the classes’ high (n = 135) and total (n = 373) values should be mentioned as well.
Other useful parameters for the assessment of the quality of the devices’ measurements are Se and Sp as well as the FPR and FNR (
Table 2). For all four devices, the highest YI (YI
TD = 79, YI
GLP = 63, YI
WVB = 60, YI
FSP = 74) was reached at the threshold ≥1.4 mmol/L. The lowest was found for the threshold ≥ 1.2 mmol/L (YI
TD = 68, YI
GLP = 54, YI
WVB = 50, YI
FSP = 66). As an alternative approach to correction factors, the thresholds of the devices can be optimized to reach a maximal Se combined with a minimal FPR. From a farmer’s point of view, this might also be a more practical and useful approach.
By applying the optimized threshold for each device from ROC analyses, the Se could be improved greatly (+5 to +33%), the Sp was decreased by a few percent (−4 to −13%), and the FPR was elevated (
Table 6). Generally, a higher false-positive rate accompanied by possibly higher treatment costs is preferred to a higher false-negative rate because of the relatively uncritical measures to be taken and because the costs per case of SCK are much higher than the costs per treatment, even if the costs of the follow-up diseases are not included. Ref. [
6] calculated a cost-to-benefit ratio of 1:3 of the monitoring and treatment of SCK. Adjusted thresholds were reported in literature as well. Ref. [
2] found, for the GLP, an optimized threshold of ≥1.3 mmol/L, based on a BHBA
LAB ≥ 1.4 mmol/L, with an Se of 86% and an Sp of 96%. In this dataset, the adjusted threshold was lower, with ≥1.1 mmol/L; in addition, the Se was higher and the Sp was lower. For the FSP, an adjusted threshold of ≥1.1 mmol/L was found, based on BHBA
LAB ≥ 1.2 mmol/L. This was similar to the adjusted threshold in the present study. The calculated Se and Sp were higher, at 100% and 95%, respectively [
16]. The ROC-analyses are very beneficial for the improvement of the detection of SCK, especially for devices with a continuous systematic error. In this study, the improvement was the greatest. Even though the Phi was higher in the initial analysis, the adjustment of the threshold was preferable due to the improvement of Se and FPR. The threshold ≥1.4 mmol/L, with the best results in this study, is often considered too high, especially for herd monitoring. With a lower threshold, more cows in the critical range are registered and closer monitoring of those cows can take place. Consequently, the use of a lower cut-off should be considered for the monitoring of dairy herds. This standpoint is also supported by [
13,
16]. The AUC of the ROC indicates that the measurements of all four devices were highly accurate (AUC > 90%) and that they were able to identify SCK-positive cows.


