Article

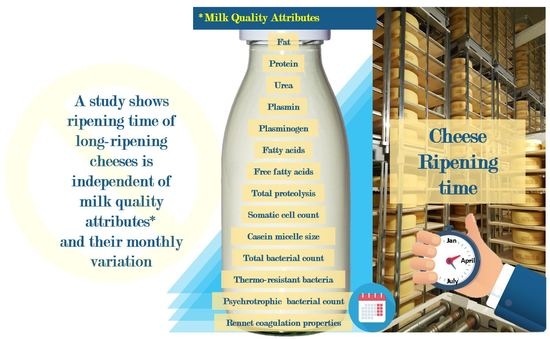
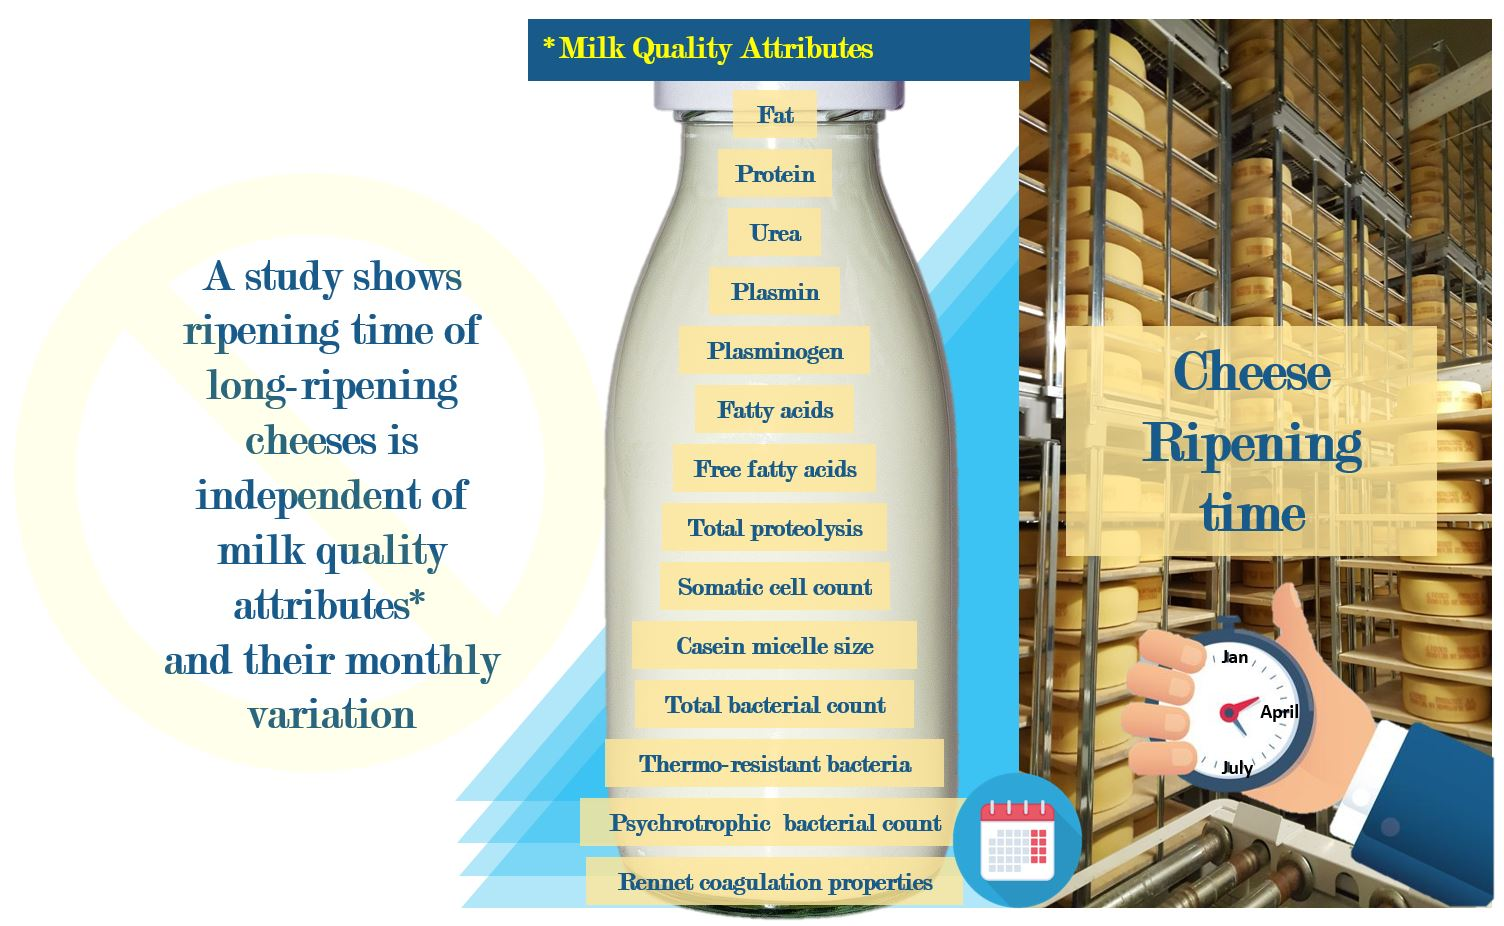
Variation in Dairy Milk Composition and Properties Has Little Impact on Cheese Ripening: Insights from a Traditional Swedish Long-Ripening Cheese

1
Department of Molecular Sciences, Swedish University of Agricultural Sciences, P.O. Box 7015, SE-750 07 Uppsala, Sweden
2
Department of Agricultural Research for Northern Sweden, Swedish University of Agricultural Sciences, SE-901 83 Umeå, Sweden
3
Norrmejerier, Mejerivägen 2, SE-906 22 Umeå, Sweden
*
Author to whom correspondence should be addressed.
Dairy 2021, 2(3), 336-355; https://doi.org/10.3390/dairy2030027
Submission received: 3 June 2021 / Revised: 18 June 2021 / Accepted: 22 June 2021 / Published: 29 June 2021

Abstract

:
The monthly variation in raw dairy silo milk was investigated and related to the ripening time of the resulting cheese during an industrial cheese-making trial. Milk composition varied with month, fat and protein content being lowest in August (4.19 and 3.44 g/100 g, respectively). Casein micelle size was largest (192–200 nm) in December–February and smallest (80 nm) in August. In addition, SCC, total bacteria count, proteolytic activities, gel strength, and milk fatty acid composition were significantly varied with month. Overall sensory and texture scores of resulting cheese were mainly influenced by plasmin and plasminogen activity, indicating the importance of native proteolytic systems. Recently, concepts based on the differentiated use of milk in dairy products have been suggested. For the investigated cheese type, there might be little to gain from such an approach. The variation in the investigated quality characteristics of the dairy milk used for cheese making had little effect on cheese ripening in our study. In contrast to our hypothesis, we conclude that as long as the quality of the milk meets certain minimum criteria, there are only weak associations between cheese milk characteristics and the time required for the development of aroma and texture in the cheese. To find answers behind the observed variation in cheese ripening time, studies on the effects of process parameters are needed.

Graphical Abstract

1. Introduction

The process of cheese making and the characteristics of the resulting cheese are associated with the composition and properties of the raw milk used. Hence, an in-depth understanding of the variation in raw milk quality and of factors contributing to this variation is important for assessing the suitability of raw milk for cheese making. The composition and properties of raw milk vary with numerous management and animal-related factors, e.g., feeding, milking practices, genetics, lactation, cow health status, and occasionally seasonality [1].
The concept of “seasonal variation” is well documented in the literature and has been shown to be associated with calving pattern, feed, and climate conditions [1,2,3]. Examples of milk characteristics reported to be associated with seasonal variation include protein and fat content [1,4], casein micelle size [5], pH [6], free fatty acid concentration [7], proportions of mono- and poly-unsaturated fatty acids [8], and somatic cell count [9]. The effect of seasons on milk quality attributes has been demonstrated by many researchers across the globe for different dairy farming systems, e.g., seasonal calving and pasture-based systems [10,11] and year-round calving systems [1,5]. In recent work characterizing milk samples collected over one year from farms with continuous calving in northern Sweden, we observed variations in the characteristics of farm milk by sampling months [12]. Thus, it is apparent that milk composition and properties are subject to variation throughout the year, irrespective of the dairy farming system, potentially creating challenges or opportunities for dairy processors [6].
Despite the relatively high number of studies reporting variations in raw milk, the association with the maturation time of the resulting cheeses is not a well-researched area. The maturation of cheese to acquire characteristic organoleptic properties is important for consumer acceptability [13]; therefore, a release to the market of fully matured cheese is crucial for the cheese manufacturer. Traditionally, assessment of maturation is based on four key factors: appearance of the outer surface, appearance of the cut surface, consistency, and organoleptic properties (smell, taste, and aroma). In recent years, an increasing variation in the time required for maturation of a traditional long-ripening hard Swedish cheese has been observed by the cheese manufacturer. Using near-infrared (NIR)-hyperspectral image analysis, we demonstrated variation in the ripening process both within and between cheeses in that case [14]. In a parallel study, we evaluated monthly variations in the composition and properties of raw tank milk sourced from the farms that deliver milk to the cheese-making plant [12] and assessed whether the type of dairy farm contributed to the observed variation [15]. Dairy farms all over the world are undergoing rapid intensification [16], giving rise to variations in farm milk characteristics. An in-depth understanding of variations in dairy silo milk, i.e., a batch of pooled milk from individual farms, is equally important. However, it may be misleading to predict the composition and properties of dairy silo milk based only on the variation in milk from individual farms, since factors such as pooling of different volumes of milk from individual farms, mechanical stresses applied during pumping and transportation, and short-term storage at dairy silos could concomitantly impose influences not apparent on studying tank milk from individual farms.
Linking the variation in farm milk with variations in cheese maturation and ripening time is thus difficult. The aim of the present study was to investigate whether the observed variation in cheese ripening time is associated with variations in the composition and properties of the raw milk in the silo at the cheese-making plant. The hypothesis tested was that the variation in cheese ripening time is associated with variations in dairy silo milk quality.

2. Materials and Methods

2.1. Experimental Design and Sample Collection

Dairy silo milk was sampled monthly (2 or 4 times per month) at a full-scale commercial cheese-making plant between February 2016 and February 2017. In total, 65 dairy milk silos containing milk delivered from approximately 80 dairy farms located between 64°2′–65°0′ N and 19°3′–21°5′ E in the region of Västerbotten in northern Sweden were sampled for this study. The quality characteristics of tank milk from 42 of these dairy farms, most of which deliver all their milk to the cheese-making plant, are described in a previous study [15]. During the trial period, on every sampling, approximately 100 mL of milk was sampled from a dairy silo and transported at 4 °C to the official milk-testing laboratory (Eurofins Steins Laboratory, Jönköping, Sweden) for routine raw milk quality analyses. Another sample of 250 mL of milk sampled from the same silo on the same sampling occasion was transported at 4 °C to the Department of Molecular Sciences, Swedish University of Agricultural Sciences (SLU), Uppsala, for further detailed analysis of milk composition and properties. Upon arrival, the pH of milk samples was measured using a pH meter (Seven Compact S210, Mettler Toledo, Switzerland). For practical reasons, not all milk quality parameters could be analyzed at every sampling point, resulting in different numbers of data points for the different milk quality parameters. Certain milk quality traits, e.g., casein micelle size and rennet-induced coagulation properties, were analyzed using fresh skimmed milk. Due to logistical difficulties, on rare occasions, coagulation properties were analyzed in milk that had been stored frozen at −20 °C for a maximum of two weeks. The remaining milk sample was aliquoted (as whole milk) and stored at −80 °C until further analyses (i.e., milk fat composition, plasmin/plasminogen activity, and total proteolytic activity).

2.2. Raw Milk Gross Composition, SCC, and Bacteria

Raw milk gross composition, i.e., concentration of fat, protein, urea, and free fatty acids (FFA), was analyzed at the official milk testing laboratory using Fourier-transform infrared spectral analysis (CombiFoss 6000, Foss, Hillerød, Denmark). Somatic cell count (SCC) was determined using a Fossomatic electronic cell counter (Foss Electric, Hillerød, Denmark). Thermo-resistant bacteria were analyzed by a culture method [17]. Total bacteria and psychrotrophic bacteria counts were analyzed using colony-count techniques at 30 °C [18] and 21 °C [19], respectively, in the dairy laboratory of the cheese-making plant.

2.3. Casein Micelle Size

Casein micelle size was determined on freshly skimmed milk by nanoparticle tracking analysis (NTA), according to Priyashantha et al. [20], using a NanoSight NS500 device (Malvern Instruments, UK). Video clips were captured using a camera fixed at 90° angle and 658 nm wavelength for 2000-fold diluted sample flow through the laser beam. Recorded video clips were batch-processed using NanoSight 2.3 NTA to obtain the average casein micelle size.

2.4. Rennet-Induced Coagulation

Rennet-induced coagulation properties of skimmed milk were studied at 35 °C using calf rennet (75/25 chymosin/bovine pepsin, 180 international milk clotting units (IMCU), Kemikalia, Skurup, Sweden) at a concentration of 0.18 IMCU/mL according to the method described by Johansson et al. [21]. Rennet coagulation time (RCT, s) and gel strength (Pa) after 20 min of rennet addition (G20) were analyzed in duplicate, using a Bohlin CVOR-150–900 rheometer (Malvern Instruments Nordic AB, Uppsala, Sweden).

2.5. Plasmin Activity

Plasmin- and plasminogen (PL/PG)-derived activity were determined in duplicate using a spectrophotometric method, as described by de Vries et al. [22]. Plasmin activity was measured in ultracentrifuged milk serum using 2.5 mg/mL of a chromogenic substrate, pyro-GLU-Phe-Lys-p-nitroanilide hydroxy chloride (Aniara, West Chester, OH, USA). Plasminogen, i.e., the inactive precursor of the enzyme, was converted into plasmin after activation with urokinase (49.5 Plough units), and both plasmin activity and total activity (i.e., plasmin and plasminogen activity) were measured using a multimode microplate reader (FLUOstar Omega, BMG Labtech, Ortenberg, Germany) at 37 °C. Plasminogen activity was finally calculated as the difference between total activity and plasmin activity.

2.6. Total Proteolysis

Total proteolysis was estimated in triplicate by a fluorescamine method, as described by Johansson et al. [23], using a PerkinElmer LS55 luminescence spectrometer (Waltham, MA, USA). In brief, milk mixed with an equal volume of 24% trichloroacetic acid was kept on ice for 30 min before centrifugation at 16,000× g for 20 min. The resulting supernatant was mixed with sodium tetraborate, and fluorescamine was added before loading into a 96-microwell plate to measure the fluorescence at excitation wavelength 390 nm and emission wavelength 480 nm. The extent of proteolysis, i.e., the content of primary amino groups of trichloroacetic acid-soluble peptides and free amino acids, was expressed as leucine equivalents (mM Leuc. Eq.).

2.7. Milk Fat Composition

Fat extraction was performed in duplicate according to Hara & Radin [24] using 2 mL of milk sample, 10 mL of HIP (hexane:isopropanol (3:2), v/v), and 4.5 mL of a Na2SO4 solution (6.67%). The fat content was determined gravimetrically by weighing the dissolved extract on a microbalance (Mettler, Toledo, Switzerland). Fatty acids were methylated with BF3 according to the method described by Appelqvist [25]. The fatty acid composition was then analyzed by gas chromatography using a CP 3800 instrument (Varian AB, Stockholm, Sweden), as described in Blomqvist et al. [26]. Peaks were identified according to their retention time in comparison with that of the standard mixture GLC 68A (Nu-check Prep, Elysian, MN, USA) and other authentic standards. Peak areas were integrated using Galaxie chromatography data system software version 1.9 (Varian AB, Stockholm, Sweden).

2.8. Cheese Production

The cheese in this study was commercially produced at the local cheese-making plant of the collaborating dairy company. The cheese originated from the characterized milk from 65 dairy silos and was evaluated for sensory properties and maturity during the ripening process. Within the total number of cheese batches (n = 208), 34 batches were produced from a combination of milk from two silos, for logistics reasons in the cheese-making plant. In such cases, the milk composition of the cheese batch was calculated proportionately, using values from the individual silos. The cheeses were manufactured in full production scale according to Rehn et al. [27]. In brief, a precultured bulk starter was added to the pasteurized milk and rennet (180 IMCU, Kemikalia, Skurup, Sweden), containing 75:25 chymosin: bovine pepsin, was added at a concentration of 0.3 mL L−1 milk. Cheese was produced in 18 kg cylinders (~16 cm height), which were brine-salted up to 1.2% salt content. The cheese surfaces were waxed and the cheeses were transferred to the manufacturer’s ripening facility, for ripening at constantly monitored and controlled moisture and temperature.

2.9. Cheese Final Sensory Evaluation and Ripening Time

The sensory properties of the cheese were evaluated by at least three trained sensory panelists from the dairy company, starting with cheese aged 14 months and repeated at two-month intervals until full maturity was achieved [14]. The cheeses were evaluated against an in-house standard protocol concerning outer appearance, smell and taste, and texture, to determine whether they met the criteria for release to market. Comments on quality for the different cheese batches were noted in a specific protocol, e.g., the appearance of the cut surface (number and distribution of eyes, color, mold, and smear formation), smell and taste (cheese flavor, acidic taste, saltiness, sweetness, rancidity, burned, and fruity) and texture (evaluated with a finger, i.e., hardness, toughness and evaluated with the mouth, i.e., chewing resistance, dryness, grainy, rubbery, etc.). On each sensory evaluation occasion, each of the cheese batches was given a smell and taste score by the sensory panelists. These scores essentially reflected the assessed market readiness of a particular cheese batch. The ripening time (days), defined as time from production to final sensory approval, was recorded for each cheese batch.

2.10. Statistical Design

Minitab 18.1 software (Minitab Inc., State College, PA, USA) and Simca 16.0 software (Sartorius Stedim Data Analytics AB, Umeå, Sweden) were used for univariate and multivariate analysis, respectively. The monthly variation in milk quality attributes was analyzed by ANOVA with the Tukey post hoc test, using Minitab. Two different methods of multivariate analysis were used, principal component analysis (PCA) [28] and orthogonal projections to latent structures (OPLS) [29]. In constructing the PCA plots, individual values deviating by more than four standard deviations from the mean were considered outliers and excluded from further analysis. All the milk quality attributes were UV-scaled, auto-transformed, and displayed in PCA loading plots, while silo milk samples were visualized in the PCA score plot. The OPLS approach was used to investigate the relationship between milk quality attributes, ripening time, and sensory scores. For the OPLS model, a loading plot was inspected to identify significant influencers (e.g., milk quality attributes) associated with the studied responses (e.g., ripening time and sensory scores).

3. Results and Discussion

3.1. Variation in Raw Milk Composition and Properties

The monthly variation in the composition and properties of the milk used for commercial full-scale cheese production was investigated based on the PCA results. The PCA score plot showed a tendency for silo milk samples obtained during June–August to be located on the right side, while silo milk from the other months grouped towards the left side of the plot (Figure 1A). The PCA loading plot suggested that the differences were mainly related to the fat and protein content, casein micelle size, SCC, and proportions of saturated or unsaturated fatty acids in the milk (Figure 1B).
The monthly variation in the milk quality attributes investigated in this study is shown in Table 1, which presents the average values for the silo milk at the dairy plant during each month. The highest and lowest fat and protein content were seen in November–December and May, respectively. This is in agreement with findings in our previous study based on farm tank milk [12], where fat and protein concentrations were lower in May–August than in other months, and in other studies based on Swedish bulk milk samples [30,31]. Heck et al. [1] attributed lower fat and protein content during the outdoor period to changes in feeding regimen associated with the season, and suggested that the increase in readily fermentable carbohydrate content in the feed as a result of higher concentrate:forage ratio in winter could lead to higher production of propionic acid in the rumen. Since propionic acid is the major precursor of glucose, modification of hormonal signals with the glucogenic nutrient supply could stimulate milk protein synthesis. Heck et al. [1] also suggested that higher linolenic acid content in fresh grass compared with silage inhibits de novo fatty acid synthesis in the mammary gland, thereby reducing the milk fat content. Variations in protein and fat content are likely to have an influence on cheese yield, considering that 77% of fresh cheese yield derives from the fat and protein content [32]. However, in the present case cheese milk is standardized at the cheese-making plant with regard to fat content and protein:fat ratio, and therefore this variation would have less impact on the production process.
The average urea concentration in dairy silo milk did not vary with month, which is in agreement with our previous results for urea concentrations in farm tank milk [12]. By contrast, Karlsson et al. [33] observed seasonal variation in urea content in dairy silo milk sampled from the same dairy company, with the lowest urea content in summer months. In the present study, FFA levels did not vary by month, contradicting findings in our previous study on FFA in farm tank milk [12]. A probable explanation for this is that the dairy silos contained farm milk from other herds, in addition to those described in our previous study. Another explanation could be bulking of milk from farms delivering differing volumes of milk. The average FFA level in silo milk over the year was always below 1.0 mmol/100 g (Table 1), which is considered the threshold value for no distinguishable off-flavor associated with the raw milk or final product [34]. Elevated levels of FFAs may cause a rancid flavor in cheese [35]. The pH value of silo milk showed monthly variation, with the lowest value in September (6.48) and the highest in February 2017 (6.81). Likewise, we observed the lowest pH (6.60) in farm milk in September [12]. However, Lindmark-Månsson [31] reported no seasonal variation in pH in another similar study. Variation in pH affects cheese making through modification of protein interactions and their functionality, with lower pH resulting in a higher content of soluble calcium and contraction of the protein matrix in the resulting cheese [36].
The PL- and PG-derived activity varied significantly with month but with no clear seasonal pattern (Table 1). Likewise, in our previous characterization of tank milk from individual farms, we observed significant monthly variation in PL and PG activity with no seasonal pattern [12]. The PL and PG activity is critically important for the maturation of many types of long-ripening cheeses, as it reflects an important source of proteolytic enzyme that facilitates development of texture and flavor of cheese through a series of reactions mediating the degradation of protein [35,36,37].
Proteolysis plays a crucial role in texture and flavor development in aged cheeses [38]. During the ripening process, protein hydrolysis takes place due to the action of coagulants, plasmin, and microbial and somatic cell proteinases [39]. The resulting intermediate peptides are further degraded by the activity of starter and nonstarter lactic acid bacteria (LAB), which produce proteinases and peptidases, catalyzing the hydrolysis of proteins and peptides during the aging of cheese. Nonstarter LAB, which dominate towards the end of cheese ripening, continue the proteolytic activity and are important for the characteristic cheese flavor of many types of cheeses [40]. In the present study, total proteolysis, measured as free amino terminals, varied with sampling month, with the lowest value in December (20.73 mM Leuc. Eq.) and the highest in July (40.53 mM Leuc. Eq.). We observed a similar tendency in the individual farm tank milk samples, with an increase in total proteolytic activity during the summer/outdoor months (May–July) [12]. However, a recent study by Glantz et al. [41], conducted in three geographical regions of Sweden, found that protease activity in dairy silo milk did not differ between the outdoor (May–September) and indoor (October–March) periods. This discrepancy may depend on differences in the technique used for measuring proteolytic activity. In the present study, we used fluorescamine (at 480 nm) as a substrate, while Glantz et al. [41] used azocasein (at 345 nm). It could also be associated with the differences in SCC we found between outdoor and indoor seasons, whereas Glantz et al. [41] observed no such differences. Higher SCC could have acted as an additional source of proteolytic vector during the outdoor months, since SCC is often correlated with higher plasmin activity in milk [42].
In the present study, SCC and TBC also varied by month, with higher counts during the main outdoor months and the highest values observed in August (233 × 103/mL and 109 × 103/mL, respectively). Higher SCC and TBC could be a contributor to the observed increase in total proteolysis seen during July, since elevated SCC and TBC can contribute to the proteolytic activity [43,44]. Bobbo et al. [45] reported higher SCC associated with higher milk pH and resulting negative effects on cheese-making properties. In general, stress caused by changing environmental conditions, in addition to poor hygiene practices at milking and cow nutritional status, can contribute to increased SCC in dairy milk [46,47]. As an example, Frössling et al. [9] found that SCC was higher in Swedish bulk milk during the latter part of the pasture season (August–September). In general, increased SCC (above 200 × 103/mL) results in greater protein losses in whey, thereby reducing dry matter yield of cheese [48]. Further, higher SCC has been shown to have a negative influence on the suitability of milk for cheese making, with e.g., a decrease in the proportion of casein and breakdown of β-casein, while releasing γ-casein [49]. However, it is difficult to assess the effect of SCC on potential quality defects in the final product, as specific threshold levels and effects of different types of somatic cells are not known for this particular type of cheese. According to Auldist [49], a negative effect can be detected from 100 × 103/mL onwards in some dairy products but not until 500 × 103/mL in others.
The higher TBC in the outdoor period (mainly August) may be related to contamination of the animals by the environment (soil, pasture, and water), compared with conditions during the indoor period [50]. However, unlike in this study investigating dairy silo milk, in our previous study on farm tank milk [12], we did not observe a significant effect of sampling month on TBC. Nevertheless, the TBC in the present study ranged between 14 and 109 × 103 colony-forming units (CFU)/mL (Table 1), which is higher than observed in the farm milk samples (range 8–14 × 103 CFU/mL) [12]. This could be an effect of longer cold storage of dairy silo milk compared with farm tank milk, i.e., the increment could be associated with growth of psychrotrophs over time. In most dairy marketing systems, analysis of SCC and TBC is compulsory, and milk values exceeding the cut-off level have a severe effect on the price paid to the dairy farmer [51]. In this regard, the milk used in cheese production in this study met the highest quality standards stipulated by the cheese manufacturer.
In this study, psychrotrophic bacterial counts in dairy silo milk did not vary significantly, and there was no seasonal pattern. In general, the presence of high numbers of psychrotrophic bacteria in raw milk poses challenges for the quality of milk, and the resulting cheeses. Psychrotrophs are capable of growth at temperature ≤ 7 °C [52]. Increasing numbers of psychrotrophic bacteria have therefore been associated with prolonged cold storage and longer time between milk collections at farms, whereas freshly drawn milk from the udder does not contain psychrotrophic bacteria [53]. These bacteria are eliminated by pasteurization, but their extracellular, heat-resistant enzymes can remain active in pasteurized milk and lead to a slight reduction in cheese yield, as a result of degradation of casein into soluble end-products that may be lost in the whey fraction [54]. Another negative effect associated with psychrotrophic bacteria is flavor defects, which are often associated with characteristics such as rancidity and bitterness.
The number of thermo-resistant bacteria (mainly Enterococcus and Streptococcus) in raw milk can be used as an indicator of the efficacy of cleaning of milking equipment at farm level [55]. It is also an important consideration for the suitability of milk for cheese making, since thermo-resistant bacteria can survive heating at 60 °C for 30 min and can thus be present in the pasteurized milk and in cheeses [56]. In the present study, the number of thermo-resistant bacteria did not vary significantly with sampling month. In a Danish study [57], nine different nonstarter Lb. paracasei strains demonstrated thermo-resistant properties in association with thermization (60 °C, 5 min), and pasteurization (73 °C, 15 s). This suggests that the thermo-resistant bacteria observed in the present study might be important in cheese production, as they are likely to survive pasteurization and may be active in the cheese during the ripening process.
Casein micelles are important structural components in milk and crucial functional units in cheese making. The size of casein micelles is known to influence the cheese-making process, with larger micelles reported to result in stronger gels [20] and smaller micelles in weaker gels [58]. In this study, we observed a seasonal variation, with casein micelles being smaller in the main outdoor period than in the indoor period. The smallest average casein micelle size was observed in August (80 nm) and the largest in December (192 nm), January (200 nm), and February 2017 (197 nm). This is in agreement with findings in our previous study on farm tank milk samples [12], where casein micelle size varied from 72 nm in August to 184 nm in February. In a study by Holt and Muir [5] on milk samples originating from seasonal calving dairy farming systems in Scotland, casein micelle size was significantly smaller in summer milk than in milk from other months of the year.
The dairy farms in the present study followed a year-round calving system; therefore, observations from dairy farming systems with seasonal calving may not be directly applicable. The similarity of the observations, irrespective of calving system, could be because casein micelle size has been shown to be unaffected by lactation stage of the cow or fat or protein content of the milk [59]. The seasonal difference in casein micelle size observed in our study could instead be attributable to differences in minerals in the feed during the summer months (e.g., higher Ca and lower P), as discussed in our previous study [12].
There was a significant effect of month on gel strength (described as G20), with the highest G20 values observed in May (67 Pa) and the lowest in February (42 Pa) and July (52 Pa). The RCT ranged from 581 s in February 2017 to 450 s in May, indicating the inverse correlation between RCT and G20 [20], as also observed in our previous study in the region [12]. One potential reason for the low G20 quality in February might be the higher pH in milk sampled during that month (Table 1), since higher pH decreases the soluble calcium content [36] and free calcium is critical in creating a firm gel [60]. Gel firmness depends on milk protein concentration to the power of three for milk from Jersey cows [61]. However, multiple factors in addition to the protein content co-vary to influence gel strength, e.g., genetic milk protein variants are decisive for milk coagulation properties [62]. However, this was not covered during the present study when analyzing the pooled dairy silo milk.
The variation in fatty acid composition of the milk at the dairy plant is shown in Table 2. In general, the fatty acid composition of milk determines the fatty acid composition in cheeses, since processing has a negligible influence on fatty acids, highlighting the importance of studying the variation in the raw material [63]. We observed lower concentrations of saturated fatty acids (SFA) and higher concentrations of monounsaturated fatty acids (MUFA) in the main outdoor period (June–August) compared with the rest of the year (Figure 1). In an earlier study on the composition of dairy silo milk in Sweden, Lindmark-Månsson [31] also observed significant variation in MUFA over the year, with the highest levels in July and the lowest in January. However, Lindmark-Månsson [31] did not observe any significant variation in the polyunsaturated fatty acid (PUFA) content of the milk between seasons or regions. Similarly, in the present study, PUFA content seemed to be less affected by seasonality, as illustrated in Figure 1. In another study characterizing dairy milk destined for ultrahigh temperature treatment at a dairy plant in the same region as in this study (Luleå, Sweden), it was found that the milk contained a higher content of PUFA in July than in other months [64]. Similar results were found in a Swiss study comparing the fatty acid composition in milk delivered to dairies in the mountain regions of Switzerland in summer and winter months [8]. A French study concluded that milk fatty acid composition is closely associated with feeding and husbandry practices [65]. The participating dairy farms in our previous study in northern Sweden applied a wide range of feeding practices during the outdoor period [12]. Some farms had full indoor feeding even during summer, with the time cows spent on pasture mainly serving as exercise, whereas other farms had pasture providing up to 95% of the animals feed intake. On average, pasture provided about 30% of the feed intake from mid-June until mid-August on those farms [12]. Despite the variation in feeding strategies during outdoor months on participating farms, we observed a significant effect of month on the FA composition of milk at the dairy plant [12]. In the present study, we observed lower dairy silo milk fat content during the summer (main grazing period) than in winter (commonly fed silage). Since the high C18:3 (linolenic acid) content in fresh grass is associated with ruminal production of trans-10- and cis-12-conjugated linoleic acids, inhibiting de novo fatty acid synthesis in the mammary gland [66], this could contribute to the lower milk fat content observed during outdoor months.
Medium-chain fatty acids (C12:0, C14:0 and C16:0) were more associated with indoor months, whereas long-chain fatty acids (C18) were located on the right side of the PCA, indicating that they were more associated with outdoor months (Figure 1). July (the main outdoor month in this study) had the lowest concentrations of C10:0 (capric acid), C12:0 (lauric acid), and C14:0 (myristoleic acid), and the highest concentrations of C17:0 (margaric acid), C18:0 (stearic acid), and C18:1 (oleic acid) (Table 2). The fatty acids C8:0 and C10:0 are not naturally present in feedstuffs and are synthesized de novo in the mammary gland, whereas C16:0 and long-chain fatty acids (C18) are taken up from the blood in the udder. The differences in FA profiles can be attributed to differences in feeding strategy during indoor and outdoor months. In a study in central and southern Sweden, Larsen et al. [4] also observed lower fat content and higher amounts of C18:1 cis-9, conjugated linoleic acid cis-9 and trans-11, and lower amounts of C4-C16 fatty acids, in bulk milk in summer compared with winter.
The amount and composition of milk fat are known to influence the physicochemical and organoleptic properties of cheeses (e.g., flavor, aroma, mouthfeel, hardness, melting properties, etc.). Short-chain volatile fatty acids in particular play a crucial role in the development of cheese aroma, in addition to being precursors of strong volatiles (not covered in the present study). The composition of fatty acids in milk has a strong, yet complex and indirect, relationship with the composition of the animal’s diet, as rumen microbial activity largely converts unsaturated fatty acids into saturated fatty acids [67,68].

3.2. Cheese Ripening Time

The overall aim of our research is to determine how different factors contribute to the observed variation in ripening time of a traditional Swedish long-ripening cheese produced by our dairy collaborative partner. In this study, cheese-ripening time varied between 485–721 days, with no clear seasonal pattern (Figure 2). However, the average ripening time showed greater variation for cheeses produced during the period June–October, which includes the transition to and from pasture feeding. Visualizations of the variation in cheese maturation using NIR-hyperspectral images of cheese resulting from the same project [14] showed that cheeses within the same batch and cheese from different batches matured at different rates. Owing to the cost associated with an extended cheese ripening period, there is great commercial interest in controlling and predicting the cheese ripening process [69].

3.3. Ripening Time and Milk Quality

Based on the variation observed in milk quality attributes and ripening time of the resulting cheese over one year, we evaluated the relationship between milk quality and cheese ripening time. For this, we performed an OPLS analysis to explore the influence of milk quality parameters on the ripening time of the resulting cheese (Figure 3). We found that none of the milk quality parameters studied had a strong effect on cheese-ripening time. Some fatty acids had a weaker influence, e.g., longer ripening time was associated with C14:1, and shorter ripening time was associated with C18:0 and C18:1. This was probably because the concentration of C18:1 was highest in July (Table 2), when the ripening time was comparatively short. The C18:1 and C18:0 acids are closely associated with pasture feeding, and it has been shown that cheeses made from milk from pasture-fed cows have higher lipolytic activity, with a more elastic and creamier texture, and a yellower tone, than cheeses made from milk from silage-fed cows [70]. However, identifying a link between cheese ripening and milk quality aspects is challenging, since in industrial cheese production, there is greater scope for variation in cheese quality, e.g., between samples of cheeses, between cheeses produced from a vat, between vats produced within a day, and between different production days. Factors not covered in this study, e.g., the microbiota in the raw milk and cheese and minor variations in process parameters, also contribute to variation in ripening time of the cheeses. For these reasons, direct and obvious relationships between milk quality parameters were not found in this study.

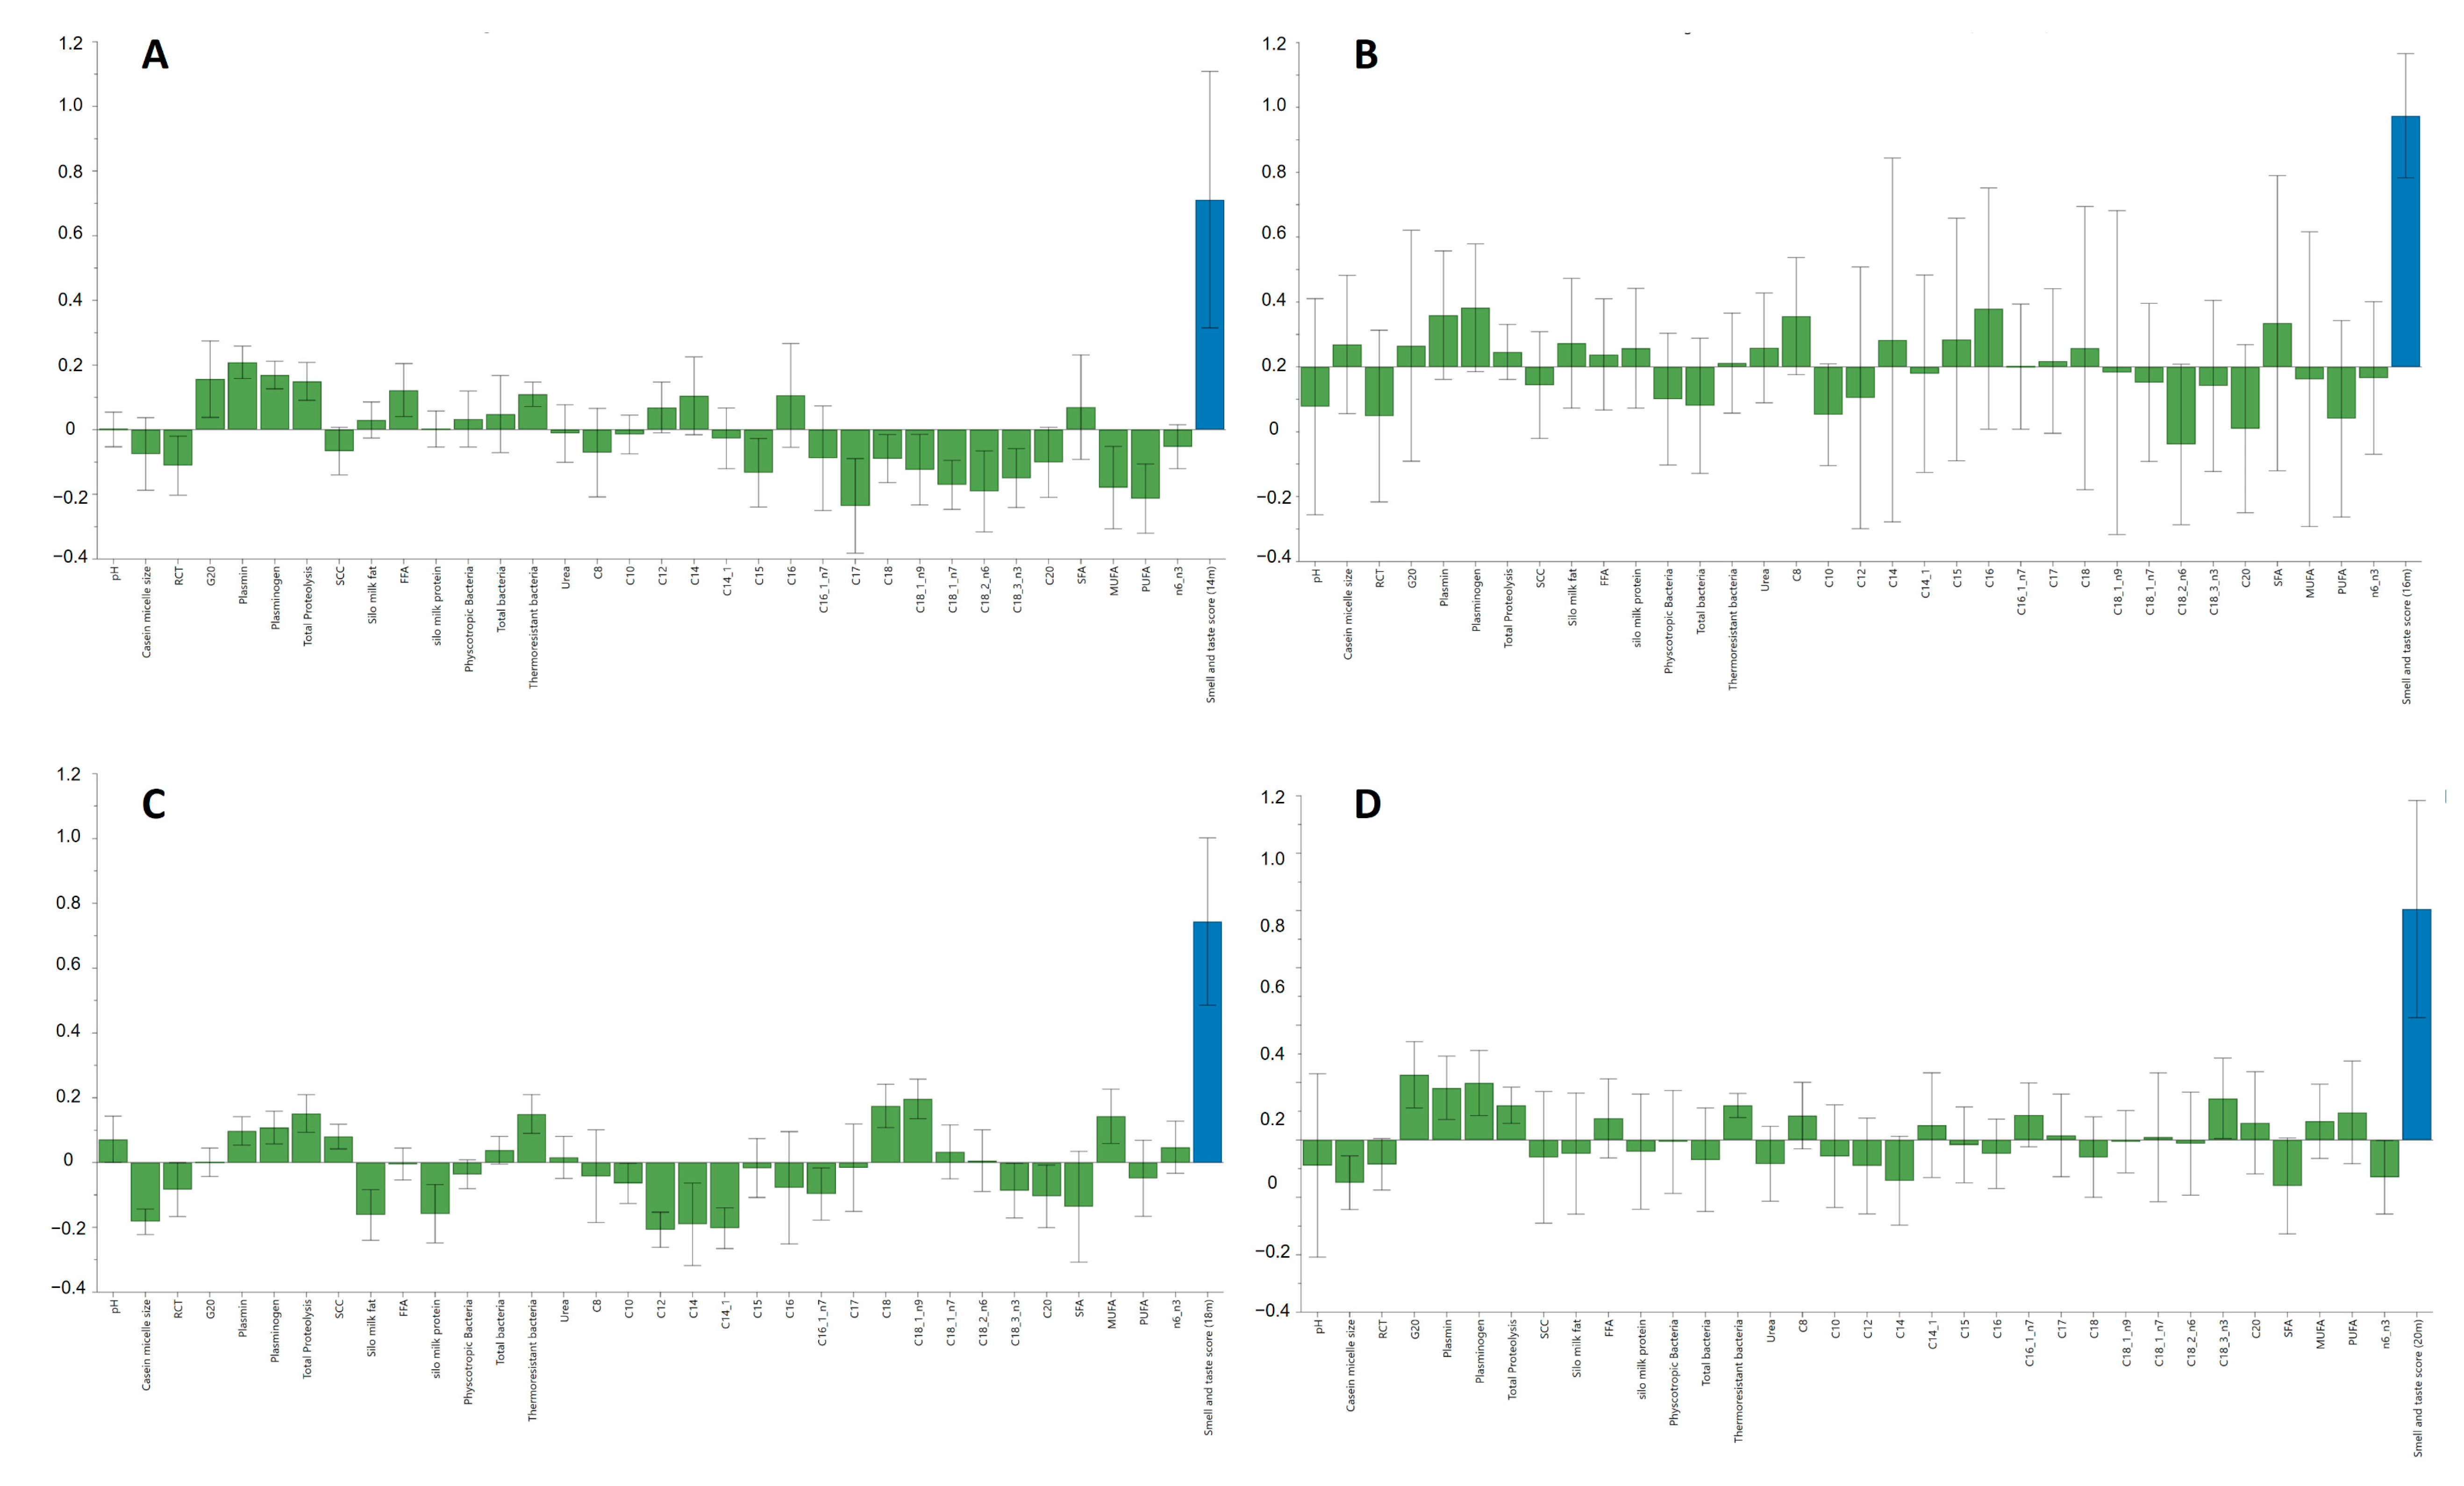
3.4. Effect of Raw Milk Quality Attributes on “Smell and Taste” Sensory Score Values during Ripening

Figure 4 shows the relationship between the sensory score values given to the cheeses and the quality attributes of the corresponding dairy silo milk for each of the occasions when sensory evaluation of the cheese was conducted. Interestingly, the influence of milk components on sensory score values varied between different occasions during the ripening process. In the cheeses at 14, 18, and 20 months of ripening, the PL/PG and total proteolysis values contributed positively to the sensory score values, i.e., higher sensory score values were obtained for cheese produced from milk with high proteolytic potential. One likely explanation is that in cheese with high proteolytic activity, protein is degraded into flavor and odor active components, resulting in higher sensory score values. Fatty acids had a varying influence on sensory score values on different occasions during ripening, illustrating the complexity of the cheese-ripening process.

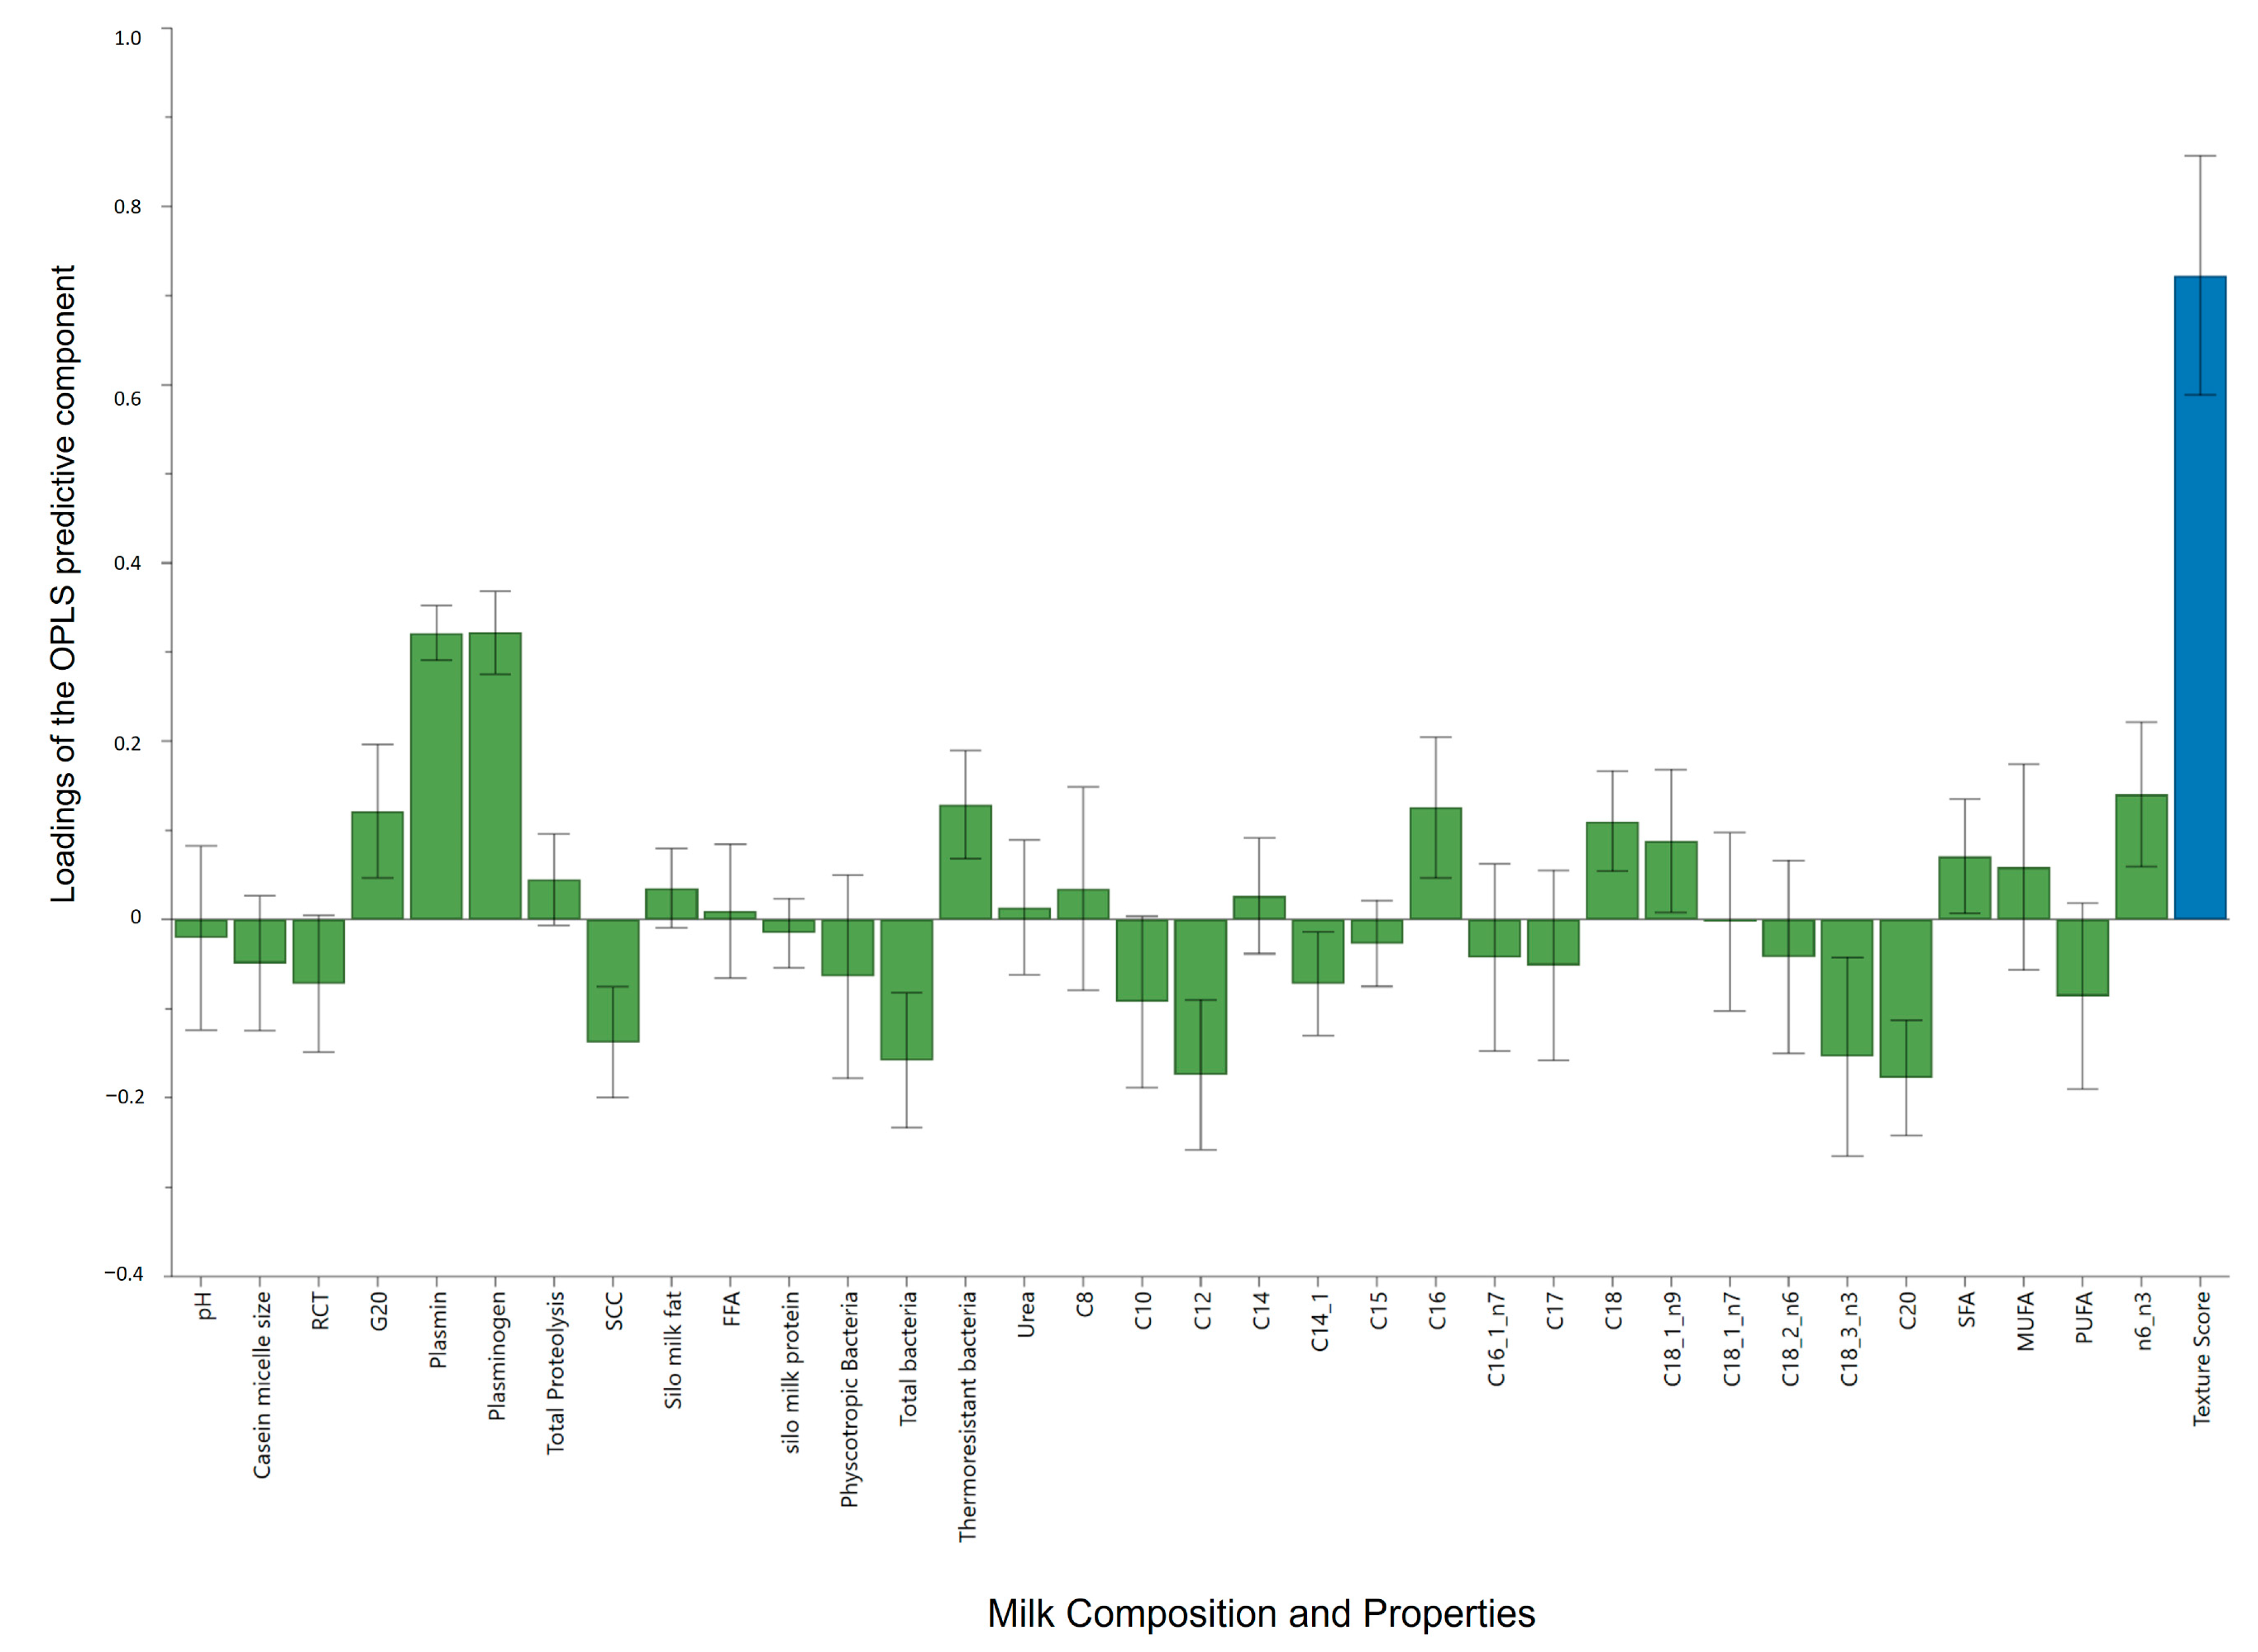
3.5. Effect of Milk Quality Attributes on Texture Scores of Cheeses

Since the texture of cheese plays a crucial role in determining the total ripening time, we also evaluated the effect of milk composition and properties on the texture score of the resulting cheeses at 14 months of ripening, using OPLS analysis (Figure 5). The texture score was positively influenced by gel strength (G20). Firmer gels are likely to retain more protein and fat than less firm gels [20], resulting in better gel properties and higher texture scores of the cheeses. We observed a positive influence of PL/PG on the texture score, probably due to a favorable proteolytic effect on the cheese matrix. However, the other two potent contributors to total proteolytic activity (i.e., SCC and TBC) had a negative influence on texture score, with higher values resulting in lower texture score values for the cheeses. This most likely indicates that indigenous enzymatic activity in milk results in favorable effects, whereas endogenous proteolytic activity results in weaker texture in sensory panel evaluations. However, elevated SCC and TBC may also be associated with overall milk compositional changes and catabolic activities with negative impacts on cheese texture. The causes of the observed differences need to be identified in a wider sensory evaluation.
Specific fatty acids also influenced the texture scores of the cheeses, with C16:0 and C18:0, and to some extent also C18:1, having a positive effect, while C12:0, C18:3, and C20:0 had a negative effect. Among the fatty acids, C16:0 and C18:1 are of major interest for cheese texture, since they are the major saturated and unsaturated fatty acid, with high and low melting points, respectively. A higher proportion of C16:0 results in a firmer cheese, while a higher proportion of C18:1 results in a creamier texture [71,72]. Since those aspects (overall textural quality assessment) were rated as favorable traits in the sensory evaluation, such cheeses received higher texture scores than cheeses with lower levels of C16 and C18:1 (Figure 5).

4. Conclusions

This study demonstrated that the composition and properties of dairy silo milk are subject to monthly variation, with some quality attributes showing significant differences between the main indoor and outdoor periods of the year. However, investigated milk quality parameters showed weak relationships with the ripening time of the resulting long-ripening cheeses. This shows even though milk quality characteristics vary on monthly basis, the time required for the development of aroma and texture in resulting cheese is not associated with raw milk being used in cheese making, especially when the milk quality is of high standards. Hence, differential use of high-quality raw milk for cheese production is discouraged only based on raw milk quality characteristics. The sensory and texture scores of the cheeses were influenced by plasmin and plasminogen in the silo milk, highlighting the important role of the native proteolytic system during ripening for this Swedish cheese type. These findings indicate a need for more in-depth, holistic studies to identify the reasons for the variation in the time needed to reach the full maturity of the cheese.

Author Contributions

Conceptualization, Å.L., A.H., K.H.S. and H.P.; methodology, M.J., A.H., Å.L., S.S. and H.P.; software, H.P. and A.H.; validation, Å.L., A.H., M.J., M.L., S.S., S.J., K.H.S., M.H. and H.P.; formal analysis, M.J., A.H. and S.J.; investigation, H.P.; resources, Å.L. and K.H.S.; data curation, H.P. and A.H.; writing—original draft preparation, H.P.; writing—review and editing, Å.L., A.H., M.J., M.L., S.S., S.J., K.H.S., M.H. and H.P.; visualization, H.P.; supervision, Å.L., A.H., M.J., M.L. and M.H.; project administration, Å.L.; funding acquisition, Å.L. and A.H. All authors have read and agreed to the published version of the manuscript.

Funding

This research was funded by Swedish Farmers’ Foundation for Agricultural Research, grant number O-16-20-764; the Kamprad Family Foundation, grant number 20160098; the Regional Fund for Agricultural Research in Northern Sweden, grant number 4/2015 and the Faculty of Natural Resources and Agriculture, SLU.

Institutional Review Board Statement

Not applicable.

Informed Consent Statement

Not applicable.

Data Availability Statement

The data (results on silo milk) presented in this study are available on request from the corresponding author. The data are not publicly available due to the privacy and confidentiality of the industrial partner.

Acknowledgments

Authors would like to thank David Nilsson at Computational Life Science Cluster, Department of Chemistry, Umeå University, Sweden, for expert advice and discussions regarding the multivariate analysis of data. Gayani Madushani is thanked for performing the total proteolytic activity. All dairy farmers who participated in this study are gratefully recognized for their participation. Thanks also to the staff at the cheese-making plant.

Conflicts of Interest

The authors declare no conflict of interest. The funders had no role in the design of the study; in the collection, analyses, or interpretation of data; in the writing of the manuscript, or in the decision to publish the results.

References

  1. Heck, J.M.L.; van Valenberg, H.J.F.; Dijkstra, J.; van Hooijdonk, A.C.M. Seasonal Variation in the Dutch Bovine Raw Milk Composition. J. Dairy Sci. 2009, 92, 4745–4755. [Google Scholar] [CrossRef]
  2. O’Brien, B.; Guinee, T.P. Milk|Seasonal Effects on Processing Properties of Cows’ Milk. In Encyclopedia of Dairy Sciences, 2nd ed.; Fuquay, J.W., Ed.; Academic Press: San Diego, CA, USA, 2011; pp. 598–606. ISBN 978-0-12-374407-4. [Google Scholar]
  3. Williams, R.P.W. The Relationship between the Composition of Milk and the Properties of Bulk Milk Products. Aust. J. Dairy Technol. 2002, 57, 30–44. [Google Scholar]
  4. Larsen, M.K.; Nielsen, J.H.; Butler, G.; Leifert, C.; Slots, T.; Kristiansen, G.H.; Gustafsson, A.H. Milk Quality as Affected by Feeding Regimens in a Country with Climatic Variation. J. Dairy Sci. 2010, 93, 2863–2873. [Google Scholar] [CrossRef]
  5. Holt, C.; Muir, D.D. Natural Variations in the Average Size of Bovine Casein Micelles II. Milk Samples from Creamery Bulk Silos in South West Scotland. J. Dairy Res. 1978, 45, 347–353. [Google Scholar] [CrossRef]
  6. Chen, B.; Lewis, M.J.; Grandison, A.S. Effect of Seasonal Variation on the Composition and Properties of Raw Milk Destined for Processing in the UK. Food Chem. 2014, 158, 216–223. [Google Scholar] [CrossRef]
  7. Walker, G.P.; Wijesundera, C.; Dunshea, F.R.; Doyle, P.T.; Walker, G.P.; Wijesundera, C.; Dunshea, F.R.; Doyle, P.T. Seasonal and Stage of Lactation Effects on Milk Fat Composition in Northern Victoria. Anim. Prod. Sci. 2013, 53, 560–572. [Google Scholar] [CrossRef]
  8. Collomb, M.; Bisig, W.; Bütikofer, U.; Sieber, R.; Bregy, M.; Etter, L. Seasonal Variation in the Fatty Acid Composition of Milk Supplied to Dairies in the Mountain Regions of Switzerland. Dairy Sci. Technol. 2008, 88, 631–647. [Google Scholar] [CrossRef] [Green Version]
  9. Frössling, J.; Ohlson, A.; Hallén-Sandgren, C. Incidence and Duration of Increased Somatic Cell Count in Swedish Dairy Cows and Associations with Milking System Type. J. Dairy Sci. 2017, 100, 7368–7378. [Google Scholar] [CrossRef] [PubMed]
  10. Li, S.; Ye, A.; Singh, H. Seasonal Variations in Composition, Properties, and Heat-Induced Changes in Bovine Milk in a Seasonal Calving System. J. Dairy Sci. 2019, 102, 7747–7759. [Google Scholar] [CrossRef]
  11. Lin, Y.; O’Mahony, J.A.; Kelly, A.L.; Guinee, T.P. Seasonal Variation in the Composition and Processing Characteristics of Herd Milk with Varying Proportions of Milk from Spring-Calving and Autumn-Calving Cows. J. Dairy Res. 2017, 84, 444–452. [Google Scholar] [CrossRef]
  12. Priyashantha, H.; Lundh, Å.; Höjer, A.; Bernes, G.; Nilsson, D.; Hetta, M.; Saedén, K.H.; Gustafsson, A.H.; Johansson, M. Composition and Properties of Bovine Milk: A Case Study from Dairy Farms in Northern Sweden; Part II. Effect of Monthly Variation. J. Dairy Sci. 2021, 104. [Google Scholar] [CrossRef]
  13. Delahunty, C.M.; Drake, M.A. Sensory Character of Cheese and its Evaluation. In Cheese: Chemistry, Physics and Microbiology; Fox, P.F., McSweeney, P.L.H., Cogan, T.M., Guinee, T.P., Eds.; General Aspects; Academic Press: Cambridge, MA, USA, 2004; Volume 1, pp. 455–487. [Google Scholar]
  14. Priyashantha, H.; Höjer, A.; Saedén, K.H.; Lundh, Å.; Johansson, M.; Bernes, G.; Geladi, P.; Hetta, M. Use of Near-Infrared Hyperspectral (NIR-HS) Imaging to Visualize and Model the Maturity of Long-Ripening Hard Cheeses. J. Food Eng. 2020, 264, 109687. [Google Scholar] [CrossRef]
  15. Priyashantha, H.; Lundh, Å.; Höjer, A.; Bernes, G.; Nilsson, D.; Hetta, M.; Saedén, K.H.; Gustafsson, A.H.; Johansson, M. Composition and Properties of Bovine Milk: A Case Study from Dairy Farms in Northern Sweden; Part I. Effect of Dairy Farming System. J. Dairy Sci. 2021, 104. [Google Scholar] [CrossRef]
  16. Clay, N.; Garnett, T.; Lorimer, J. Dairy Intensification: Drivers, Impacts and Alternatives. Ambio 2020, 49, 35–48. [Google Scholar] [CrossRef] [Green Version]
  17. Wehr, H.M.; Frank, J.F. Standard Methods for the Examination of Dairy Products; American Public Health Association: Washington, DC, USA, 2004; ISBN 978-0-87553-002-4. [Google Scholar]
  18. NordVal International-NMKL 86 Aerobic Microorganisms. Determination in Foods at 37 °C, 30 °C, 25 °C, 20 °C, 17/7 °C or 6.5 °C by the Colony Count Method. 2013. Available online: https://www.nmkl.org/index.php/en/publications/item/aerobe-mikroorgansimer-bestemmelse-i-levnedsmidler-ved-37-c-30-c-25-c-20-c-17-7-c-eller-65-c-efter-kolonitalsmetoden-nmkl-86-5-utg-2013 (accessed on 24 April 2021).
  19. ISO/TC 34/SC 9 ISO 8552:2004 IDF 132:2004 Specifies a Rapid Method for Estimating the Number of Psychrotrophic Microorganisms by Means of the Colony-Count Technique at 21 °C. Available online: https://www.iso.org/cms/render/live/en/sites/isoorg/contents/data/standard/03/18/31881.html (accessed on 24 April 2021).
  20. Priyashantha, H.; Lundh, Å.; Höjer, A.; Hetta, M.; Johansson, M.; Langton, M. Interactive Effects of Casein Micelle Size and Calcium and Citrate Content on Rennet-induced Coagulation in Bovine Milk. J. Texture Stud. 2019, 50, 508–519. [Google Scholar] [CrossRef]
  21. Johansson, M.; Högberg, M.; Andrén, A. Relation between AS1-Casein Content and Coagulation Properties of Milk from Swedish Dairy Goats. Open Food Sci. J. 2015, 9. [Google Scholar] [CrossRef] [Green Version]
  22. de Vries, R.; Brandt, M.; Lundh, Å.; Holtenius, K.; Hettinga, K.; Johansson, M. Short Communication: Influence of Shortening the Dry Period of Swedish Dairy Cows on Plasmin Activity in Milk. J. Dairy Sci. 2016, 99, 9300–9306. [Google Scholar] [CrossRef] [PubMed]
  23. Johansson, M.; Lundh, Å.; de Vries, R.; Sjaunja, K.S. Composition and Enzymatic Activity in Bulk Milk from Dairy Farms with Conventional or Robotic Milking Systems. J. Dairy Res. 2017, 84, 154–158. [Google Scholar] [CrossRef]
  24. Hara, A.; Radin, N.S. Lipid Extraction of Tissues with a Low-Toxicity Solvent. Anal. Biochem. 1978, 90, 420–426. [Google Scholar] [CrossRef] [Green Version]
  25. Appelqvist, L.-Å. Rapid Methods of Lipid Extraction and Fatty Acid Methyl Ester Preparation for Seed and Leaf Tissue with Special Remarks on Preventing the Accumulation of Lipid Contaminants; Almqvist & Wiksell: Stockholm, Sweden, 1968. [Google Scholar]
  26. Blomqvist, J.; Pickova, J.; Tilami, S.K.; Sampels, S.; Mikkelsen, N.; Brandenburg, J.; Sandgren, M.; Passoth, V. Oleaginous Yeast as a Component in Fish Feed. Sci. Rep. 2018, 8, 15945. [Google Scholar] [CrossRef] [Green Version]
  27. Rehn, U.; Petersen, M.A.; Saedén, K.H.; Ardö, Y. Ripening of Extra-Hard Cheese Made with Mesophilic DL-Starter. Int. Dairy J. 2010, 20, 844–851. [Google Scholar] [CrossRef]
  28. Wold, S.; Esbensen, K.; Geladi, P. Principal Component Analysis. Chemom. Intell. Lab. Syst. 1987, 2, 37–52. [Google Scholar] [CrossRef]
  29. Trygg, J.; Wold, S. Orthogonal projections to latent structures (O-PLS). J. Chemom. 2002, 16, 119–128. [Google Scholar] [CrossRef]
  30. Lindmark-Månsson, H.; Fondén, R.; Pettersson, H.-E. Composition of Swedish Dairy Milk. Int. Dairy J. 2003, 13, 409–425. [Google Scholar] [CrossRef]
  31. Lindmark-Månsson, H. Den Svenska Mejerimjölkens Sammansättning 2009; Svensk Mjölk Forskning; Swedish Dairy Association: Stockholm, Sweden, 2012. [Google Scholar]
  32. Verdier-Metz, I.; Coulon, J.-B.; Pradel, P. Relationship between Milk Fat and Protein Contents and Cheese Yield. Anim. Res. 2001, 50, 365–371. [Google Scholar] [CrossRef]
  33. Karlsson, M.A.; Langton, M.; Innings, F.; Wikström, M.; Lundh, Å.S. Short Communication: Variation in the Composition and Properties of Swedish Raw Milk for Ultra-High-Temperature Processing. J. Dairy Sci. 2017, 100, 2582–2590. [Google Scholar] [CrossRef] [PubMed] [Green Version]
  34. McSweeney, P.L.H.; Nursten, H.E.; Urbach, G. Flavours and off-Flavours in Milk and Dairy Products. In Advanced Dairy Chemistry Volume 3: Lactose, Water, Salts and Vitamins; Fox, P.F., Ed.; Springer: Boston, MA, USA, 1997; pp. 403–468. ISBN 978-1-4757-4409-5. [Google Scholar]
  35. Bynum, D.G.; Senyk, G.F.; Barbano, D.M. Determination of Free Fatty Acid Content of Cheddar Cheese by a Copper Soap Method. J. Dairy Sci. 1984, 67, 1521–1524. [Google Scholar] [CrossRef]
  36. Pastorino, A.J.; Hansen, C.L.; McMahon, D.J. Effect of PH on the Chemical Composition and Structure-Function Relationships of Cheddar Cheese. J. Dairy Sci. 2003, 86, 2751–2760. [Google Scholar] [CrossRef] [Green Version]
  37. France, T.C.; O’Mahony, J.A.; Kelly, A.L. The Plasmin System in Milk and Dairy Products. In Agents of Change: Enzymes in Milk and Dairy Products; Kelly, A.L., Larsen, L.B., Eds.; Food Engineering Series; Springer: Cham, Switzerland, 2021; pp. 11–55. ISBN 978-3-030-55482-8. [Google Scholar]
  38. Adda, J.; Gripon, J.C.; Vassal, L. The Chemistry of Flavour and Texture Generation in Cheese. Food Chem. 1982, 9, 115–129. [Google Scholar] [CrossRef]
  39. Fox, P.F. Proteolysis during Cheese Manufacture and Ripening. J. Dairy Sci. 1989, 72, 1379–1400. [Google Scholar] [CrossRef]
  40. Ardö, Y.; McSweeney, P.L.H.; Magboul, A.A.A.; Upadhyay, V.K.; Fox, P.F. Chapter 18-Biochemistry of Cheese Ripening: Proteolysis. In Cheese, 4th ed.; McSweeney, P.L.H., Fox, P.F., Cotter, P.D., Everett, D.W., Eds.; Academic Press: San Diego, CA, USA, 2017; pp. 445–482. ISBN 978-0-12-417012-4. [Google Scholar]
  41. Glantz, M.; Rosenlöw, M.; Lindmark-Månsson, H.; Johansen, L.B.; Hartmann, J.; Höjer, A.; Waak, E.; Löfgren, R.; Saedén, K.H.; Svensson, C.; et al. Impact of Protease and Lipase Activities on Quality of Swedish Raw Milk. Int. Dairy J. 2020, 104724. [Google Scholar] [CrossRef]
  42. Barbano, D.M.; Ma, Y.; Santos, M.V. Influence of Raw Milk Quality on Fluid Milk Shelf Life. J. Dairy Sci. 2006, 89, E15–E19. [Google Scholar] [CrossRef]
  43. Senyk, G.F.; Barbano, D.M.; Shipe, W.F. Proteolysis in Milk Associated with Increasing Somatic Cell Counts. J. Dairy Sci. 1985, 68, 2189–2194. [Google Scholar] [CrossRef]
  44. Ismail, B.; Nielsen, S.S. Invited Review: Plasmin Protease in Milk: Current Knowledge and Relevance to Dairy Industry. J. Dairy Sci. 2010, 93, 4999–5009. [Google Scholar] [CrossRef] [Green Version]
  45. Bobbo, T.; Cipolat-Gotet, C.; Bittante, G.; Cecchinato, A. The Nonlinear Effect of Somatic Cell Count on Milk Composition, Coagulation Properties, Curd Firmness Modeling, Cheese Yield, and Curd Nutrient Recovery. J. Dairy Sci. 2016, 99, 5104–5119. [Google Scholar] [CrossRef] [PubMed] [Green Version]
  46. Chassagne, M.; Barnouin, J.; Le Guenic, M. Expert Assessment Study of Milking and Hygiene Practices Characterizing Very Low Somatic Cell Score Herds in France. J. Dairy Sci. 2005, 88, 1909–1916. [Google Scholar] [CrossRef]
  47. Sant’Anna, A.C.; Paranhos da Costa, M.J.R. The Relationship between Dairy Cow Hygiene and Somatic Cell Count in Milk. J. Dairy Sci. 2011, 94, 3835–3844. [Google Scholar] [CrossRef] [Green Version]
  48. Silva, N.M.A.; Bastos, L.P.F.; Oliveira, D.L.S.; Oliveira, M.C.P.P.; Fonseca, L.M. Influence of Somatic Cell Count and Total Bacterial Counts of Raw Milk in Cheese Yield Using Small-Scale Methodology. Arq. Bras. Med. Veterinária E Zootec. 2012, 64, 1367–1372. [Google Scholar] [CrossRef] [Green Version]
  49. Auldist, M. Milk Quality and Udder Health|Effect on Processing Characteristics. In Encyclopedia of Dairy Sciences, 2nd ed.; Fuquay, J.W., Ed.; Academic Press: San Diego, CA, USA, 2011; pp. 902–907. ISBN 978-0-12-374407-4. [Google Scholar]
  50. Slaghuis, B.; Wolters, G.; Reinemann, D.J. Milking and Handling of Raw Milk|Milking Hygiene. In Encyclopedia of Dairy Sciences, 2nd ed.; Fuquay, J.W., Ed.; Academic Press: San Diego, CA, USA, 2002; pp. 632–637. ISBN 978-0-12-374407-4. [Google Scholar]
  51. Kelly, A.L.; Leitner, G.; Merin, U. Milk quality and udder health|test methods and standards. In Encyclopedia of Dairy Sciences, 2nd ed.; Fuquay, J.W., Ed.; Academic Press: San Diego, CA, USA, 2011; pp. 894–901. ISBN 978-0-12-374407-4. [Google Scholar]
  52. Stepaniak, L. Psychrotrophic Bacteria|Other Psychrotrophs. In Encyclopedia of Dairy Sciences, 2nd ed.; Fuquay, J.W., Ed.; Academic Press: San Diego, CA, USA, 2011; pp. 384–389. ISBN 978-0-12-374407-4. [Google Scholar]
  53. de Oliveira, G.B.; Favarin, L.; Luchese, R.H.; McIntosh, D. Psychrotrophic Bacteria in Milk: How Much Do We Really Know? Braz. J. Microbiol. 2015, 46, 313–321. [Google Scholar] [CrossRef]
  54. McPhee, J.D.; Griffiths, M.W. Psychrotrophic Bacteria|Pseudomonas spp. In Encyclopedia of Dairy Sciences, 2nd ed.; Fuquay, J.W., Ed.; Academic Press: San Diego, CA, USA, 2011; pp. 379–383. ISBN 978-0-12-374407-4. [Google Scholar]
  55. Reinemann, D.; Wolters, G.; Rasmussen, M. Review of Practices for Cleaning and Sanitation of Milking Machines. Int. Dairy Fed. Bull. 2003, 381, 3–18. [Google Scholar]
  56. García de Fernando, G. Lactic Acid Bacteria|Enterococcus in Milk and Dairy Products. In Encyclopedia of Dairy Sciences, 2nd ed.; Fuquay, J.W., Ed.; Academic Press: San Diego, CA, USA, 2011; pp. 153–159. ISBN 978-0-12-374407-4. [Google Scholar]
  57. Christiansen, P.; Nielsen, E.W.; Vogensen, F.K.; Brogren, C.-H.; Ardö, Y. Heat Resistance of Lactobacillus Paracasei Isolated from Semi-Hard Cheese Made of Pasteurised Milk. Int. Dairy J. 2006, 16, 1196–1204. [Google Scholar] [CrossRef]
  58. Glantz, M.; Devold, T.G.; Vegarud, G.E.; Månsson, H.L.; Stålhammar, H.; Paulsson, M. Importance of Casein Micelle Size and Milk Composition for Milk Gelation. J. Dairy Sci. 2010, 93, 1444–1451. [Google Scholar] [CrossRef] [PubMed] [Green Version]
  59. de Kruif, C.G. (Kees); Huppertz, T. Casein Micelles: Size Distribution in Milks from Individual Cows. J. Agric. Food Chem. 2012, 60, 4649–4655. [Google Scholar] [CrossRef] [Green Version]
  60. Sandra, S.; Ho, M.; Alexander, M.; Corredig, M. Effect of Soluble Calcium on the Renneting Properties of Casein Micelles as Measured by Rheology and Diffusing Wave Spectroscopy. J. Dairy Sci. 2012, 95, 75–82. [Google Scholar] [CrossRef] [Green Version]
  61. Frederiksen, P.D.; Hammershøj, M.; Bakman, M.; Andersen, P.N.; Andersen, J.B.; Qvist, K.B.; Larsen, L.B. Variations in Coagulation Properties of Cheese Milk from Three Danish Dairy Breeds as Determined by a New Free Oscillation Rheometry-Based Method. Dairy Sci. Technol. 2011, 91, 309–321. [Google Scholar] [CrossRef] [Green Version]
  62. Hallén, E.; Allmere, T.; Näslund, J.; Andrén, A.; Lundén, A. Effect of Genetic Polymorphism of Milk Proteins on Rheology of Chymosin-Induced Milk Gels. Int. Dairy J. 2007, 17, 791–799. [Google Scholar] [CrossRef]
  63. Lucas, A.; Rock, E.; Chamba, J.-F.; Verdier-Metz, I.; Brachet, P.; Coulon, J.-B. Respective Effects of Milk Composition and the Cheese-Making Process on Cheese Compositional Variability in Components of Nutritional Interest. Le Lait 2006, 86, 21–41. [Google Scholar] [CrossRef] [Green Version]
  64. Lu, J.; Langton, M.; Sampels, S.; Pickova, J. Lipolysis and Oxidation in Ultra-High Temperature Milk Depend on Sampling Month, Storage Duration, and Temperature. J. Food Sci. 2019, 84, 1045–1053. [Google Scholar] [CrossRef]
  65. Ferlay, A.; Agabriel, C.; Sibra, C.; Journal, C.; Martin, B.; Chilliard, Y. Tanker Milk Variability in Fatty Acids According to Farm Feeding and Husbandry Practices in a French Semi-Mountain Area. Dairy Sci. Technol. 2008, 88, 193–215. [Google Scholar] [CrossRef] [Green Version]
  66. Baumgard, L.H.; Corl, B.A.; Dwyer, D.A.; Saebø, A.; Bauman, D.E. Identification of the Conjugated Linoleic Acid Isomer That Inhibits Milk Fat Synthesis. Am. J. Physiol. Regul. Integr. Comp. Physiol. 2000, 278, R179–R184. [Google Scholar] [CrossRef] [Green Version]
  67. Glover, K.E.; Budge, S.; Rose, M.; Rupasinghe, H.P.V.; MacLaren, L.; Green-Johnson, J.; Fredeen, A.H. Effect of Feeding Fresh Forage and Marine Algae on the Fatty Acid Composition and Oxidation of Milk and Butter. J. Dairy Sci. 2012, 95, 2797–2809. [Google Scholar] [CrossRef] [PubMed] [Green Version]
  68. Chilliard, Y.; Glasser, F.; Ferlay, A.; Bernard, L.; Rouel, J.; Doreau, M. Diet, Rumen Biohydrogenation and Nutritional Quality of Cow and Goat Milk Fat. Eur. J. Lipid Sci. Technol. 2007, 109, 828–855. [Google Scholar] [CrossRef]
  69. Wilkinson, M.G. Acceleration of Cheese Ripening. In Cheese: Chemistry, Physics and Microbiology: Volume 1 General Aspects; Fox, P.F., Ed.; Springer: Boston, MA, USA, 1993; pp. 523–555. ISBN 978-1-4615-2650-6. [Google Scholar]
  70. Frétin, M.; Martin, B.; Buchin, S.; Desserre, B.; Lavigne, R.; Tixier, E.; Cirié, C.; Bord, C.; Montel, M.-C.; Delbès, C.; et al. Milk Fat Composition Modifies the Texture and Appearance of Cantal-Type Cheeses but Not Their Flavor. J. Dairy Sci. 2019, 102, 1131–1143. [Google Scholar] [CrossRef] [Green Version]
  71. Hurtaud, C.; Peyraud, J.L.; Michel, G.; Berthelot, D.; Delaby, L. Winter Feeding Systems and Dairy Cow Breed Have an Impact on Milk Composition and Flavour of Two Protected Designation of Origin French Cheeses. Animal 2009, 3, 1327–1338. [Google Scholar] [CrossRef] [PubMed] [Green Version]
  72. Coppa, M.; Ferlay, A.; Monsallier, F.; Verdier-Metz, I.; Pradel, P.; Didienne, R.; Farruggia, A.; Montel, M.C.; Martin, B. Milk Fatty Acid Composition and Cheese Texture and Appearance from Cows Fed Hay or Different Grazing Systems on Upland Pastures. J. Dairy Sci. 2011, 94, 1132–1145. [Google Scholar] [CrossRef] [Green Version]
Figure 1. Results of principal component analysis (PCA) of milk quality variables in silo milk (n = 65) collected over one year. (A) PCA score plot, with each dot representing an individual silo milk sample and (B) PCA loading plot. RCT: rennet coagulation time, G20: gel strength at 20 min, SCC: somatic cell count, FFA: free fatty acids, SFA: saturated fatty acids, MUFA: monounsaturated fatty acids, PUFA: polyunsaturated fatty acids, and n6_n3: linoleic acid/linolenic acid.
Dairy 02 00027 g001
Figure 2. Box and whisker plot illustrating the variation in ripening time (days) of long-ripening cheeses, arranged according to production month (X-axis), showing median values (black horizontal line), 25–75th percentile interquartile range (height of the box), and spread (red dots and whiskers). In total, 208 cheese batches are represented.
Dairy 02 00027 g002
Figure 3. Orthogonal projections to latent structures (OPLS) analysis of milk quality attributes (yellow bars) in response to ripening time of the resulting cheese (blue bar). Confidence intervals (95%) are given for each factor and the response. Bars are based on loadings of the OPLS predictive component, with bar length indicating level of influence (i.e., taller bars indicate a stronger influence).
Dairy 02 00027 g003
Figure 4. Orthogonal projections to latent structures (OPLS) analysis of quality attributes of the dairy silo milk (green bars) in response to smell and taste score values assigned by the sensory panel at (A) 14, (B) 16, (C) 18, and (D) 20 months of ripening of the resulting cheese (blue bar). Confidence intervals (95%) are given for each factor and the response. Bars are based on the loadings of the OPLS predictive component, with bar length indicating level of influence (i.e., taller bars indicate stronger influence). In total, 208 cheeses batches are represented.
Dairy 02 00027 g004
Figure 5. Orthogonal projections to latent structures (OPLS) analysis of milk and cheese quality attributes (green bars) in response to texture score (blue bar). Confidence intervals (95%) are given for each factor and the response. Bars are based on the loadings of the OPLS predictive component, with bar length indicating level of influence (i.e., taller bars indicate stronger influence). In total, 208 cheeses batches are represented.
Dairy 02 00027 g005
Table 1. Quality attributes of dairy silo milk samples (n = 65) collected monthly during one year at the participating cheese-making plant.
ParameterpSampling Month
February-16MarchAprilMayJuneJulyAugustSeptemberOctoberNovemberDecemberJanuary17-February
n = 2n = 4n = 5n = 7n = 5n = 7n = 7n = 1n = 5n = 6n = 7n = 4n = 5
FatMean**4.39 abc4.43 abc4.36 abc4.43 abc4.17 bc4.28 abc4.19 c4.40 abcNA4.42 a4.45 a4.39 ab4.36 ab
(g/100 g)(SD) (0.00)(0.00)(0.09)(0.09)(0.07)(0.22)(0.05)(0.00)NA(0.09)(0.04)(0.04)(0.10)
ProteinMean**3.50 abc3.47 abc3.52 abc3.45 bc3.43 c3.46 abc3.44 c3.53 abcNA3.59 a3.59 a3.57 ab3.48 abc
(g/100 g)(SD) (0.04)(0.00)(0.01)(0.02)(0.01)(0.00)(0.02)(0.00)NA(0.06)(0.04)(0.03)(0.23)
UreaMean0.554.354.204.054.004.604.004.244.10NA4.404.053.974.16
(mmol/L)(SD) (0.35)(0.00)(0.35)(0.28)(0.85)(0.14)(0.21)(0.00)NA(0.28)(0.37)(0.28)(0.22)
FFAMean0.990.820.810.740.880.830.720.760.81NA0.800.870.740.83
(mmol/100 g fat)(SD) (0.16)(0.00)(0.00)(0.15)(0.47)(0.00)(0.14)(0.00)NA(0.05)(0.26)(0.02)(0.09)
pHMean**6.73 abc6.70 abc6.72 ab6.74 ab6.80 ab6.73 ab6.76 ab6.48 c6.67 bc6.78 ab6.70 abc6.70 abc6.81 a
(SD) (0.02)(0.02)(0.03)(0.03)(0.10)(0.00)(0.06)(0.00)(0.02)(0.02)(0.03)(0.00)(0.00)
PLMean*NA2.91 aNA2.70 a2.81 aNA1.56 cNA2.67 abNA1.80 bcNA2.39 abc
(units/mL)(SD) NA(0.76)NA(0.73)(0.32)NA(0.54)NA(0.73)NA(1.03)NA(0.94)
PGMean**NA70.83 aNA66.59 a64.44 abNA43.51 cNA58.37 abcNA48.89 bcNA48.72 bc
(units/mL)(SD) NA(4.88)NA(9.91)(7.63)NA(9.74)NA(8.63)NA(6.69)NA(9.28)
TPMean**NA32.06 abNA33.82 ab29.23 bc40.53 aNANANANA20.73 cNANA
(mM Leuc. Eq.)(SD) NA(1.17)NA(2.74)(4.33)(8.88)NANANANA(4.78)NANA
SCCMean**174 abc180 abc133.5 c182.5 abc221 ab197 abc233.8 a231 abcNA174.8 bc191.3 abc174.2 bc197.2 abc
(103/mL)(SD) (9.90)(5)(7.78)(30.4)(20.7)(21)(41.1)(0)NA(6.5)(25.9)(18.8)(18.4)
TBCMean**27 b32 b15.2 b50.3 b58.2 ab60.4 ab109 a53 ab14.5 b64.0 ab65 b21.2 b36.6 b
(CFU 103/mL)(SD) (8.7)(12.19)(10.8)(29.6)(12.15)(36.0)(58.4)(0)(5.0)(59)(113)(9.3)(25.3)
PBCMean0.871.612.71.44.67.512.111.021.607.16.511.25.34.5
(CFU 103/mL)(SD) (0.7)(13.7)(1.3)(2.9)(5.9)(15.9)(12.4)(0)(9.8)(7.8)(17.5)(4.1)(3.4)
TRBCMean0.067.52.06.76.79.96.53.51.0NA1.90.71.14.3
(CFU 103/mL)(SD) (2.1)(0)(4.6)(4.5)(0)(5.5)(2.4)(0)NA(1.1)(0.3)(0.5)(2.9)
CMSMean**170 ab153 abc138 abc129 bc130 bcNA80 c117 abc127 bcNA192 a200 a197 a
(nm)(SD) (1)(16)(24)(39)(10)NA(2)(0)(29)NA(38)(28)(9)
G20Mean*60 ab66 ab66 ab67 a60 ab52 ab58 abNA65 abNA57 abNA42 b
(Pa)(SD) (5)(3)(2)(8)(3)(10)(21)NA(14)NA(5)NA(14)
RCTMean0.87504457467450471494461NA564NA462NA581
(s)(SD) (40)(11)(11)(39)(11)(59)(80)NA(174)NA(128)NA(50)
SD: standard deviation. NA = not analyzed. Due to practical circumstances, on some sampling occasions not all milk quality traits were evaluated. FFA: free fatty acids. PL: plasmin activity. PG: plasminogen-derived activity. TP: total proteolysis (measured as free amino terminals). SCC: somatic cell count. TBC: total bacterial count. PBC: psychrotrophic bacterial count. TRBC: thermo-resistant bacterial count. CFU: colony-forming units. CMS: casein micelle size. RCT: rennet coagulation time. G20: gel strength at 20 min. Mean values within rows with different superscripts are significantly different at p < 0.05 * or p < 0.01 **.
Table 2. Fatty acid composition of milk samples collected monthly during one year at the participating cheese-making plant.
Fatty AcidspSampling Month
February-16MarchAprilMayJuneJulyAugustSeptemberOctoberNovemberDecemberJanuary17-February
n = 2n = 2n = 2n = 5n = 4n = 4n = 6n = 2n = 3n = 6n = 8n = 4n = 3
C8:0 (Caprylic acid)Mean0.720.160.130.000.040.050.130.060.000.020.000.070.130.18
(SD) (0.22)(0.18)(0.00)(0.09)(0.05)(0.26)(0.15)(0.00)(0.02)(0.00)(0.11)(0.15)(0.16)
C10:0 (Capric acid)Mean**0.36 ab0.62 ab0.07 ab0.34 ab0.50 ab0.24 b1.01 a0.69 ab1.000.90 ab0.62 ab0.39 ab0.20 ab
(SD) (0.29)(0.49)(0.10)(0.25)(0.44)(0.27)(0.31)(0.68)(0.57)(0.43)(0.16)(0.04)(0.18)
C12:0 (Lauric acid)Mean**3.12 abc3.01 abc2.59 abc2.98 abc2.57 bc2.41 c3.30 ab2.52 abc3.38 abc3.61 a3.45 a3.27 abc2.66 abc
(SD) (0.14)(0.23)(0.27)(0.25)(0.55)(0.39)(0.43)(0.49)(0.35)(0.21)(0.29)(0.32)(0.81)
C14:0 (Myristoleic acid)Mean**13.85 ab13.64 abc13.66 abc13.57 ab12.74 bc12.54 c13.16 abc12.69 abc13.27 abc13.79 a13.79 a13.69 a13.80 a
(SD) (0.17)(0.43)(0.08)(0.07)(0.39)(0.82)(0.47)(0.00)(0.16)(0.30)(0.20)(0.48)(0.45)
C15:0 (Pentadecylic acid)Mean0.201.171.431.211.171.141.261.251.141.071.111.311.341.19
(SD) (0.03)(0.03)(0.04)(0.07)(0.04)(0.07)(0.16)(0.01)(0.33)(0.25)(0.16)(0.15(0.03)
C16:0 (Palmitoleic acid)Mean*38.59 abc37.73 abc39.09 abc39.01 a36.99 abc36.13 bc36.46 c38.08 abc37.13 abc37.47 abc38.05 abc37.48 abc38.20 abc
(SD) (0.01)(0.53)(1.16)(0.27)(1.68)(0.89)(0.86)(1.00)(2.02)(1.52)(0.83)(1.16)(0.50)
C17:0 (Margaric acid)Mean*0.55 ab0.55 ab0.62 ab0.53 b0.58 ab0.68 a0.56 ab0.52 ab0.55 ab0.55 ab0.56 ab0.66 ab0.57 ab
(SD) (0.00)(0.04)(0.09)(0.02)(0.04)(0.13)(0.03)(0.02)(0.04)(0.04)(0.03)(0.14)(0.03)
C18:0 (Stearic acid)Mean**12.28 abc12.06 abc12.10 abc12.16 bc13.22 ab13.53 a12.58 abc12.97 abc12.18 abc12.39 abc11.96 c12.19 bc12.52 abc
(SD) (0.60)(0.14)(0.09)(0.22)(0.63)(0.37)(0.70)(0.06)(0.53)(0.64)(0.45)(0.21)(0.85)
C20:0 (Arachidic acid)Mean0.350.200.180.230.230.190.200.310.200.270.200.210.390.24
(SD) (0.01)(0.01)(0.04)(0.05)(0.09)(0.05)(0.18)(0.02)(0.07)(0.05)(0.05)(0.22)(0.21)
C14:1 (Myristoleic acid)Mean**1.13 abcd1.29 abcd1.11 abcd1.23 abcd1.05 cd1.05 bd1.14 abcd1.05 abcd1.32 ab1.20 abcd1.27 a1.19 abcd1.14 abcd
(SD) (0.04)(0.06)(0.03)(0.15)(0.05)(0.09)(0.15)(0.01)(0.09)(0.05)(0.13)(0.02)(0.04)
C16:1 (Palmitoleic acid)Mean0.151.391.912.021.551.571.721.681.711.801.601.811.921.80
(SD) (0.60)(0.16)(0.34)(0.23)(0.13)(0.14)(0.22)(0.03)(0.11)(0.24)(0.24)(0.38)(0.14)
C18:1 (Oleic acid)Mean**23.84 bcd23.34 cd23.70 cd23.59 cd25.54 ab26.33 a24.51 bc25.16 abc24.12 bcd23.75 cd23.30 d23.42 cd23.81 cd
(SD) (0.08)(0.48)(0.25)(0.56)(0.59)(0.86)(0.86)(0.06)(0.31)(0.62)(0.45)(0.28)(0.73)
C18:2 (Linoleic acid)Mean0.731.691.761.751.711.961.881.851.661.991.741.811.891.74
(SD) (0.00)(0.19)(0.15)(0.15)(0.33)(0.20)(0.21)(0.01)(0.39)(0.07)(0.33)(0.17)(0.07)
C18:3 (Linolenic acid)Mean0.780.580.550.550.590.630.580.620.520.660.610.590.690.70
(SD) (0.03)(0.02)(0.00)(0.13)(0.08)(0.05)(0.11)(0.00)(0.10)(0.08)(0.09)(0.18)(0.23)
SD: standard deviation. n = number of samples analyzed. Mean values within rows with different superscripts are significantly different at p < 0.05 * or p < 0.01 **.
Publisher’s Note: MDPI stays neutral with regard to jurisdictional claims in published maps and institutional affiliations.

