Article

Monitoring the Transition Period in Dairy Cows through 1H NMR-Based Untargeted Metabolomics

by
Andrés López Radcenco
1,
María de Lourdes Adrien
2,
Gretel Ruprechter
3,
Elena de Torres
4,
Ana Meikle
3,* and
Guillermo Moyna
1,*
1
Departamento de Química del Litoral, CENUR Litoral Norte, Universidad de la República, Ruta 3 Km 363, Paysandú 60000, Uruguay
2
Departamento de Salud en los Sistemas Pecuarios, Facultad de Veterinaria, Universidad de la República, Ruta 3 Km 363, Paysandú 60000, Uruguay
3
Laboratorio de Endocrinología y Metabolismo Animal, Facultad de Veterinaria, Universidad de la República, Avenida Alberto Lasplaces 1550, Montevideo 11600, Uruguay
4
Campo Experimental 2, Facultad de Veterinaria, Universidad de la República, Ruta 1 Km 42.5, Libertad, San José 80100, Uruguay
*
Authors to whom correspondence should be addressed.
Dairy 2021, 2(3), 356-366; https://doi.org/10.3390/dairy2030028
Submission received: 19 March 2021 / Revised: 17 June 2021 / Accepted: 18 June 2021 / Published: 2 July 2021
(This article belongs to the Section Metabolomics and Foodomics)

Abstract

:
The metabolic alterations associated with the increase in milk production make the transition period critical to the health of dairy cows, usually leading to a higher incidence of disease in periparturient animals. In this manuscript, we describe the use of NMR-based untargeted metabolomics to follow how these changes impact the serum metabolome in a group of 28 transition dairy cows with no initial clinical diseases. Principal component analysis (PCA) of serum 1H NMR data from four weeks before calving to 8 weeks after parturition allowed us to clearly identify four stages during the transition period. Pairwise comparisons using orthogonal partial least square discriminant analysis (OPLS-DA) and univariate data analysis led to the identification of 18 metabolites that varied significantly through these stages. Species such as acetate, betaine, and creatine are observed early after calving, while other markers of metabolic stress, including acetone, β-hydroxybutyrate (BHB), and choline, accumulate significantly at the height of milk production. Furthermore, marked variations in the levels of lactate, allantoin, alanine, and other amino acids reveal the activation of different gluconeogenic pathways following parturition. Concomitant with a return to homeostasis, a gradual normalization of the serum metabolome occurs 8 weeks after calving. Correlations of metabolite levels with dietary and metabolic adaptations based on animal parity could also be identified. Overall, these results show that NMR-based chemometric methods are ideally suited to monitor manifestations of metabolic diseases throughout the transition period and to assess the impact of nutritional management schemes on the metabolism of dairy cows.

1. Introduction

During the transition period from late pregnancy to early lactation, dairy cows suffer dramatic changes in their metabolism due to the decrease in dry matter intake (DMI) occurring even before calving and the increased energetic needs associated with milk production [1]. These changes lead to a state of negative energy balance (NEB), which results in the activation of lipid and protein catabolic pathways [2,3]. If the NEB is severe or prolonged, it affects milk production and, more importantly, has effects on the immune and endocrine systems that are detrimental to animal health and reproductive performance [4,5,6,7]. Indeed, the transition period is characterized by an increase in the incidence of production diseases such as mastitis, metritis, ketosis, and hepatic lipidosis [3,8]. Furthermore, the process of continuous genetic selection that has been employed over recent decades to improve milk production yields has also led to an exacerbation of problems associated with metabolic stress [9,10].
Since the animal health issues observed during the transition period translate into important economic losses, considerable efforts have been dedicated to better understand the metabolic changes of dairy cows in peripartum. Several studies have focused on monitoring metabolites associated with NEB, particularly increases in the concentration of non-esterified fatty acids (NEFA) in blood [11,12], which are usually followed by increases in β-hydroxybutyrate (BHB), acetone, and acetoacetate levels [13]. The variation in the concentration of glucose, insulin and other hormones, and blood proteins also correlates with the metabolic challenges experienced by the animals around calving [6,11,14]. However, production diseases are etiologically interrelated and cannot be considered in isolation [8], and thus integrative analytical approaches in which groups of metabolites are monitored simultaneously are desirable. Metabolomic methods offer this possibility [15], and consequently they have been successfully employed to investigate dairy cattle health. For example, targeted metabolomics employing mass spectrometry (MS) have been used to investigate mastitis, metritis, ketosis, and hepatic lipidosis in periparturient cows [16,17,18,19,20], and untargeted approaches based on nuclear magnetic resonance (NMR) spectroscopy were also applied to the study of several of these conditions [20,21,22,23,24].
Targeted and untargeted MS-based metabolomics have also been applied to follow metabolite levels in transition cows in an attempt to identify biomarkers that could evidence early stages of disease [25,26,27,28,29]. Most of these studies have been conducted under confined dairy production systems. However, maximizing the proportion of pastures in the diet is a pivotal factor for minimizing production costs [30]. It is well known that grazing dairy cows do not have sufficient DMI to sustain the high milk production that could be achieved with their genetic potential [31], and supplements and concentrates are therefore given to achieve the desired production levels and minimize the magnitude and duration of the NEB. In contrast with total mixed ration (TMR) diet schemes, the prediction of nutrient availability in mixed systems where herbage is the primary diet component is complex because it includes uncertainties associated with grazing behavior. In this scenario, the availability of propionate and other glucogenic metabolites for liver demands may be limited so as to maintain adequate glucose supply for the mammary gland of the high-producing dairy cows. Thus, the characterization of alternative precursors and pathways involved in de novo glucose synthesis and the identification of liver and peripheral tissue adaptations to lactation could contribute to the optimization of herd nutritional management strategies. Moreover, this knowledge could be instrumental in the design of preventive medicine programs aimed at decreasing costly production diseases. With this in mind, we investigated the suitability of NMR-based untargeted metabolomics as a tool to follow changes in the serum metabolome of a group of dairy cows with no initial clinical conditions and access to pastures following calving.

2. Materials and Methods

2.1. Animals and Sample Collection

The experimental protocol was approved by the Comisión Honoraria de Experimentación Animal, Universidad de la República (111130-002261-13). The study was performed on a group of 26 Holstein, Jersey, and Holstein × Jersey crossbred cows managed together at the dairy farm of the Facultad de Veterinaria, Universidad de la República (San José, Uruguay). It included 17 heifers and 9 multiparous cows that had between three and seven calvings. Their diet consisted of a concentrate and silage based TMR before calving, and grazing was offered as an option after that (Table S1). Monitoring was carried out by trained veterinarians from ~30 days prepartum to ~60 days postpartum. Animals with clinical manifestations of hypocalcemia, retained placenta, metritis, or moderate or severe mastitis (i.e., grades 2 or 3) were excluded from the study [32,33,34,35], while those developing mild clinical mastitis (i.e., grade 1) or subclinical ketosis that did not show systemic affectation were not [35,36]. Bleeding was carried out every 15 days before calving, and once a week immediately after milking and before grazing after parturition. Blood samples were drawn from the coccygeal vein into tubes without anticoagulant, centrifuged at 3000 g for 10 min, and the resulting serum stored at −20 °C until analyzed.

2.2. Clinical Biochemistry

Cholesterol, total protein, albumin, urea, and calcium concentrations in serum were determined with commercial colorimetric kits (Weiner Laboratorios S.A.I.C., Rosario, Argentina), using a Vitalab Selectra 2 automated biochemistry analyzer. The globulin concentration was estimated as the difference between the total protein and albumin concentrations. NEFA concentrations were determined following the ACS ACOD method (NEFA-C kit, Wako Chemicals USA Inc., Richmond, VA, USA), and enzymatic methods were employed to obtain concentrations of BHB in all samples (Ranbut kit, Randox Laboratories Ltd., Crumlin, UK). Intra and inter-assay coefficients of variation for all commercial serum determinations were less or equal than 10%.

2.3. NMR Spectroscopy

Blood serum samples were allowed to thaw at room temperature, and 400 μL aliquots were mixed with 200 μL of a 0.9% NaCl solution in D2O and transferred to 5 mm NMR tubes (NE HL5 7, New Era Enterprises Inc., Vineland, NJ, USA). All NMR spectra were recorded at 25 °C on a Bruker AVANCE III 500 NMR spectrometer operating at 1H and 13C frequencies of 500.13 MHz and 125.76 MHz, respectively, and equipped with a z-gradient TXI probe. To attenuate broad signals from proteins and lipids, 1D 1H spectra were obtained using a water suppressed Carr Purcell Meiboom-Gill sequence with a τ of 0.4 ms and an n of 80 [37,38]. A spectral width of 10 KHz, a data size of 32 K, and a total of 128 scans were employed to record each spectrum, using a relaxation delay of 4 s between scans. When required, gradient enhanced HSQC and 1D TOCSY spectra were acquired using standard pulse sequences provided with the spectrometer.

2.4. Data Processing

All free induction decays were zero-filled to 64 K points and apodized with a 0.3 Hz exponential window function prior to Fourier transformation. 1H NMR spectra were manually phased and baseline corrected using MNova (version 10.0, MestreLab Research, S.L., Santiago de Compostela, Spain), and referenced to the lactate methyl resonance at 1.25 ppm present in all serum samples. Manually selected regions of the spectra were then aligned, and the data was normalized to the total spectral area after excluding the residual water resonance signal (4.60–5.00 ppm). Spectra were then segmented into bins of 0.001 ppm between 0.5 and 9.0 ppm [39]. The resulting data matrix was then exported as a text file for use in multivariate analyses.

2.5. Metabolite Concentrations

The molar ratios of unambiguously identified serum metabolites were obtained by integration of their 1H signals in the NMR spectrum of each sample. Together with the concentration of BHB obtained through enzymatic methods for the same sample, these estimations were employed to compute absolute metabolite concentrations.

2.6. Statistical Analysis

One-way analysis of variance (ANOVA) was performed using GraphPad Prism (version 7.0, GraphPad Software Inc., San Diego, CA, USA). Multivariate statistical analyses, including principal component analysis (PCA), partial least squares discriminant analysis (PLS-DA), and orthogonal partial least squares discriminant analysis (OPLS-DA), were carried out with the PLS_Toolbox package (version 8.5, Eigenvector Research Inc., Manson, WA, USA) implemented for MATLAB (revision 2014a, The MathWorks Inc., Natick, MA, USA). For all models, the data was mean-centered and scaled using a Pareto factor [40]. Analysis of the data was first performed with PCA, which reduces the dimensionality and facilitates the identification of data clusters or trends [41,42,43]. The PCA scores plot was also employed to identify strong outliers outside the 95% significance region of Hotelling’s T2 ellipse. OPLS-DA models were derived from the complete data matrix, as well as from subsets in the 6.0 to 9.0 ppm range. Cross-validation of all OLPS-DA models was achieved using the random subset method, which involved 20 iterations over data split into 10 equally sized parts. Receiver operating characteristic (ROC) curves were plotted, and area under the curve (AUC) values were calculated to ensure the goodness of fit of the resulting models [44,45]. A permutation test with 200 iterations was also performed to determine the degree of over-fitting and further validate the discriminant analyses [46]. The results from these validations are provided as Supplementary Materials.

3. Results and Discussion

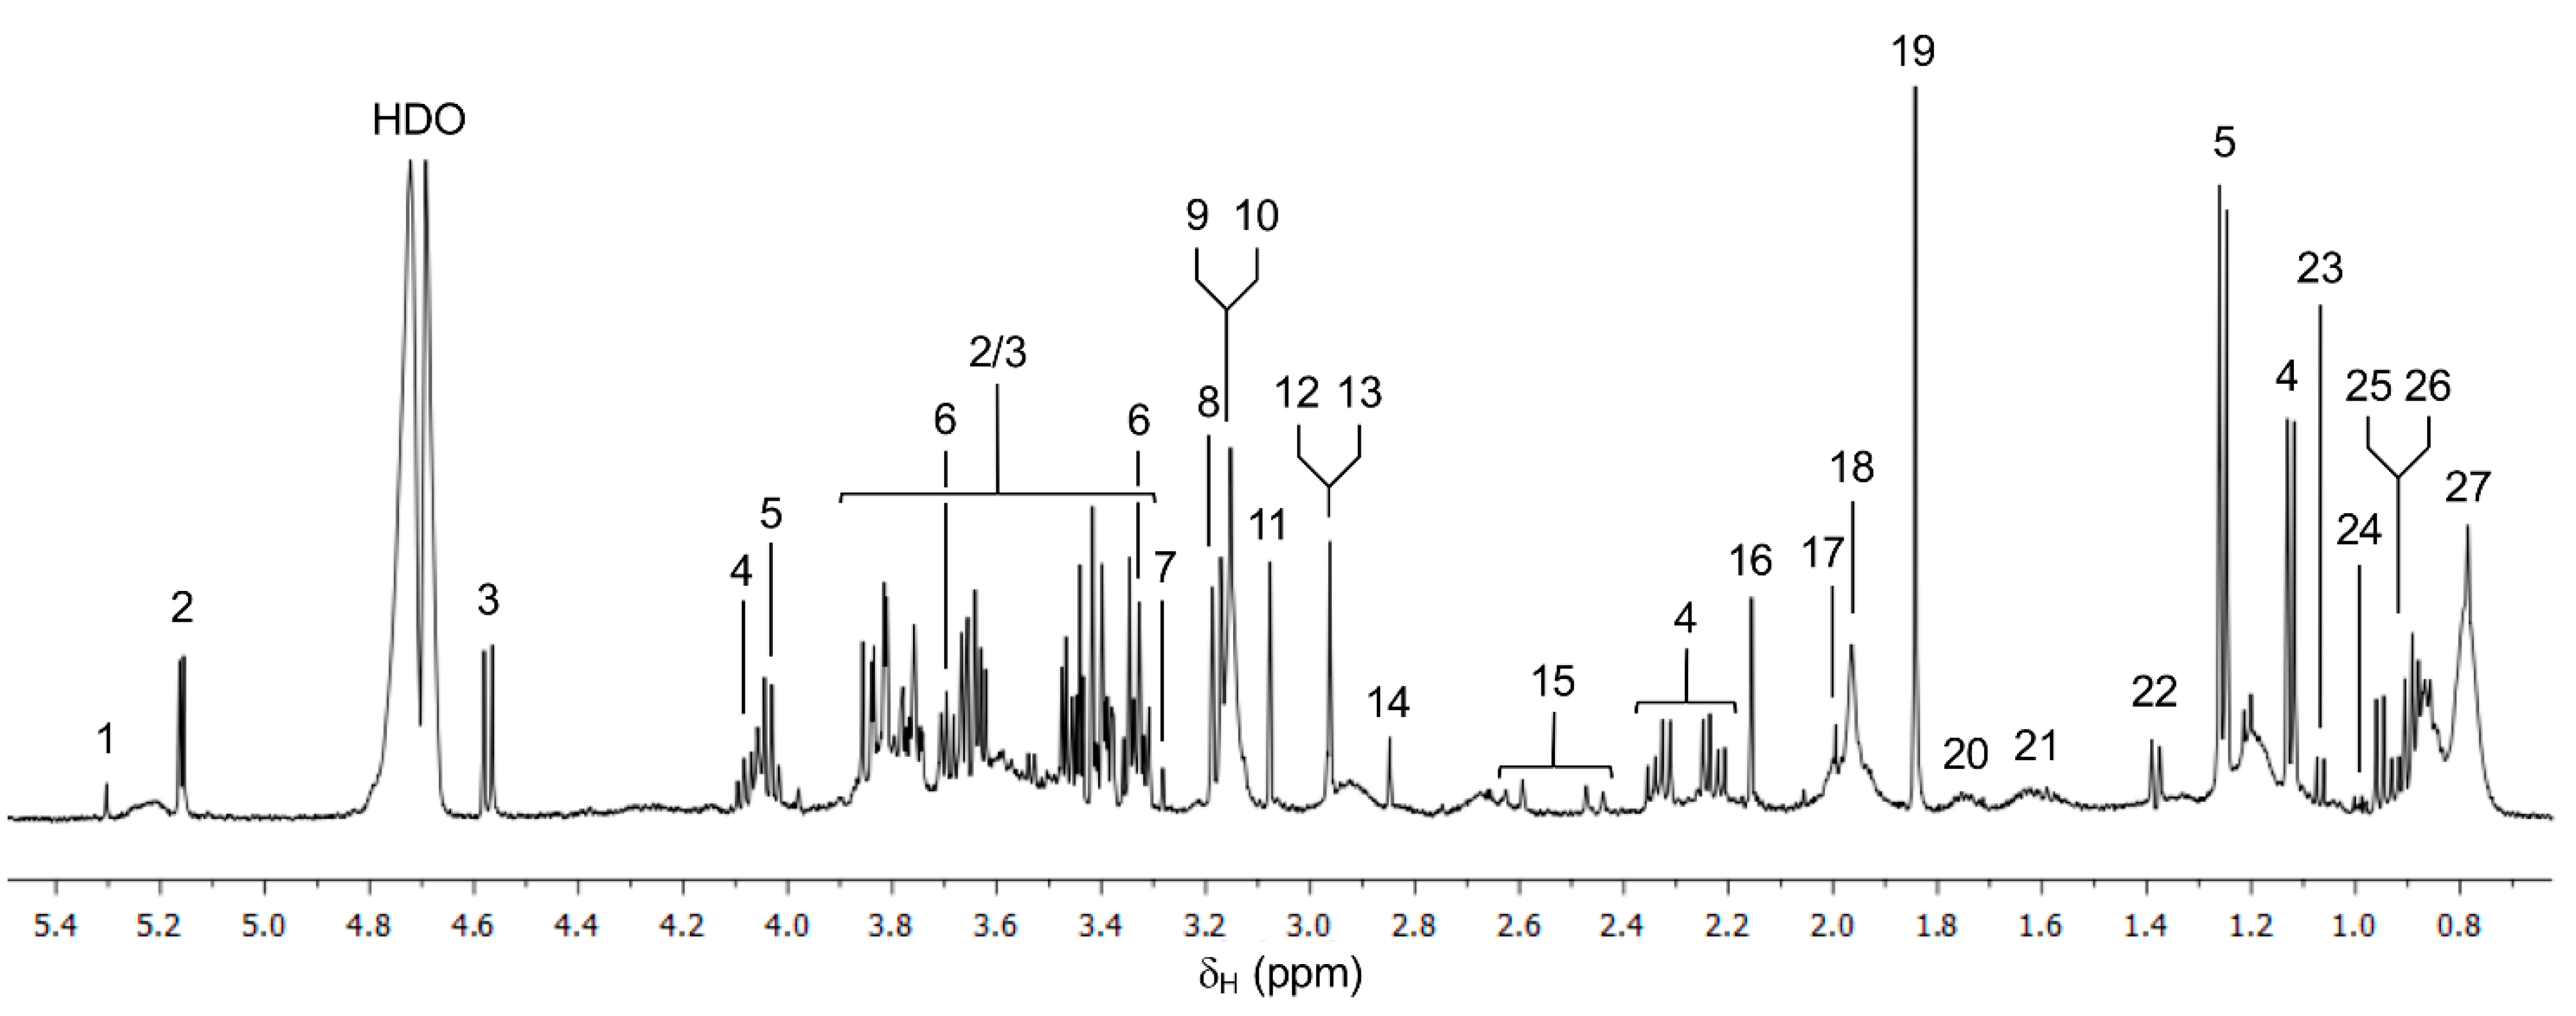
3.1. 1H NMR Spectra of Serum Samples

A representative 1H NMR spectrum of a serum sample used in the study is shown in Figure 1. In addition to signals corresponding to lipoproteins, sugars, and amino acids, resonances from metabolites such as acetate (1.84 ppm), acetone (2.16 ppm), allantoin (5.30 ppm), betaine (3.19 and 3.83 ppm), BHB (1.12, 2.22, 2.33, and 4.06 ppm), choline (3.08, 3.36, and 3.90 ppm), citrate (2.45 and 2.61 ppm), citrulline (1.43, 1.73, 3.00, and 3.63 ppm), creatine (2.96 and 3.86 ppm), creatinine (2.97 and 3.98 ppm), formate (8.38 ppm), glycerolphosphocholine (3.15, 3.54, 3.60, 3.83, and 4.23 ppm), isobutyrate (1.04 and 2.55 ppm), lactate (1.25 and 4.03 ppm), phosphocholine (3.17, 3.58, and 4.10 ppm), trimethylamine (TMA) (2.84 ppm), trimethylamine N-oxide (TMAO) (3.28 ppm), and tyramine (6.85 and 7.05 ppm) can be assigned by comparison to literature data [22,37,47]. These assignments were, in some cases, further corroborated with the aid of HSQC and 1D TOCSY spectra. As discussed earlier, several of these species are related to NEB-related metabolic stress occurring in the transition period of the lactating cow.

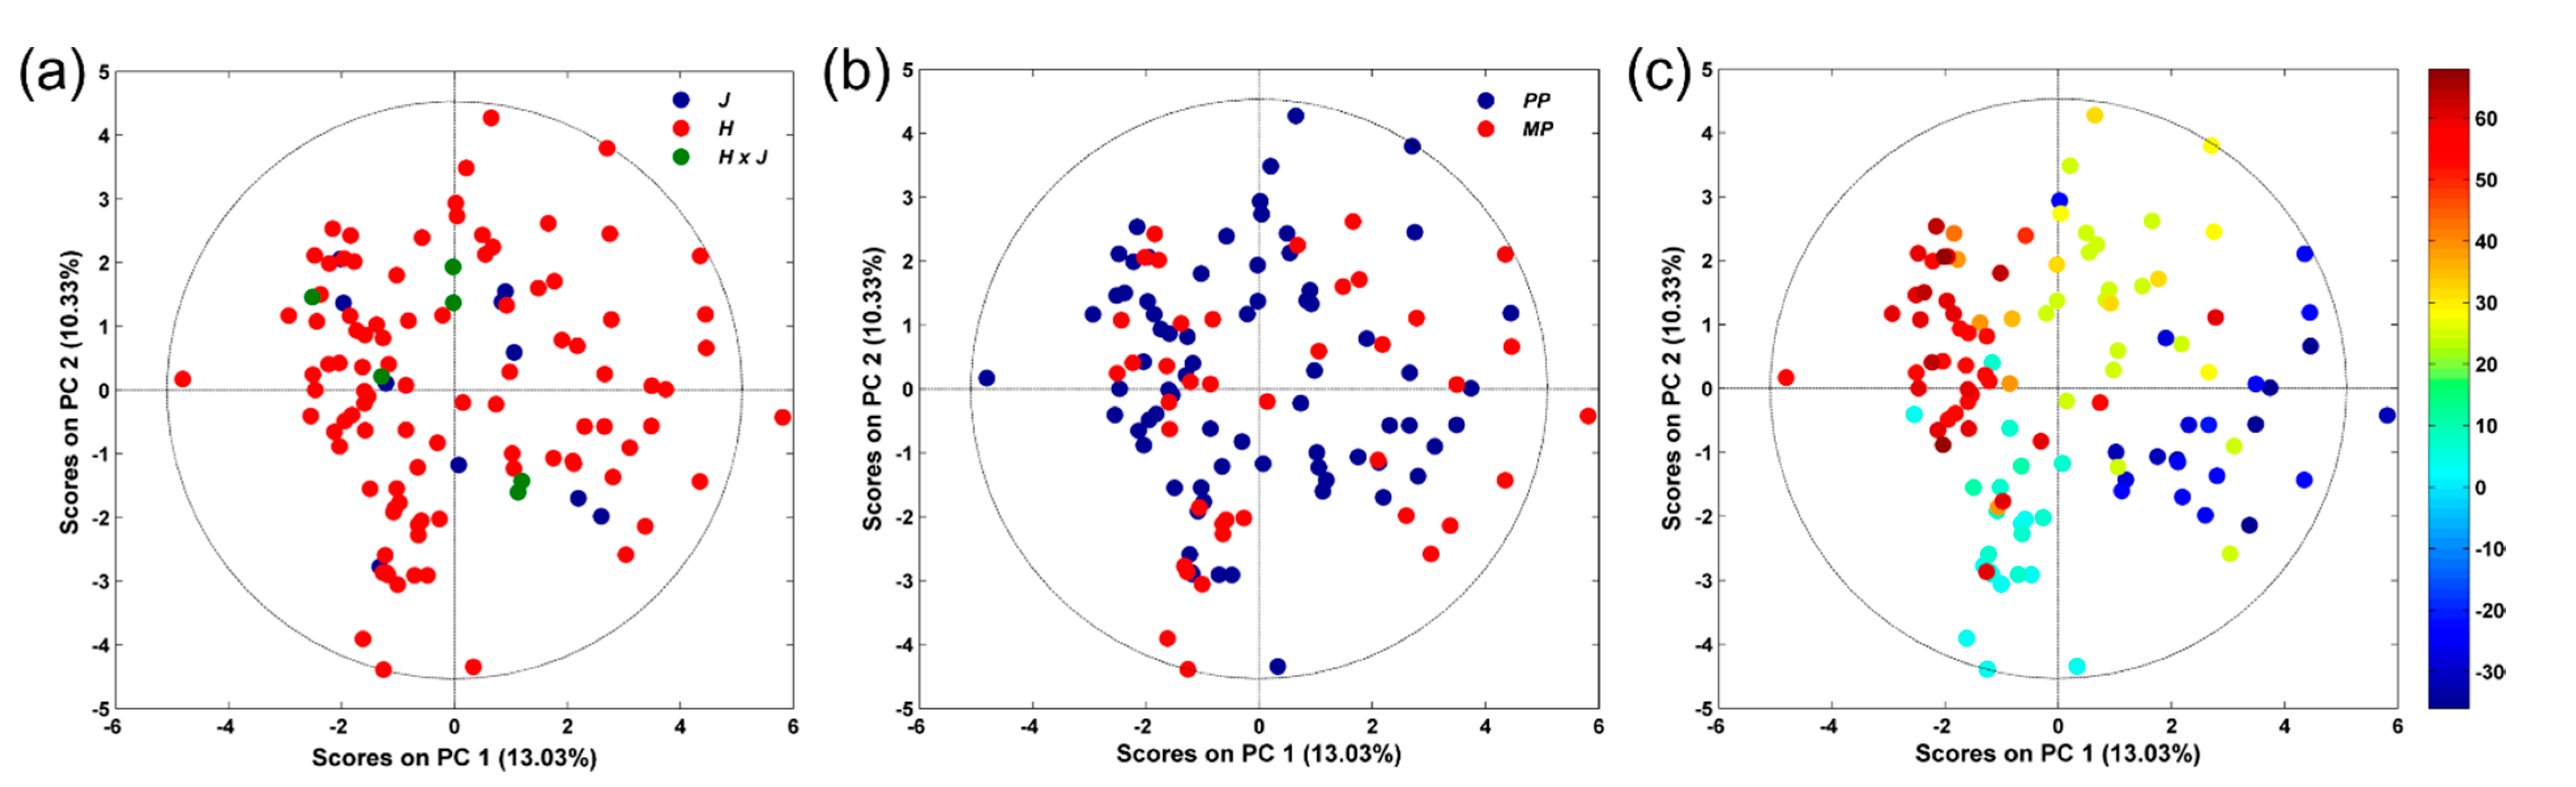
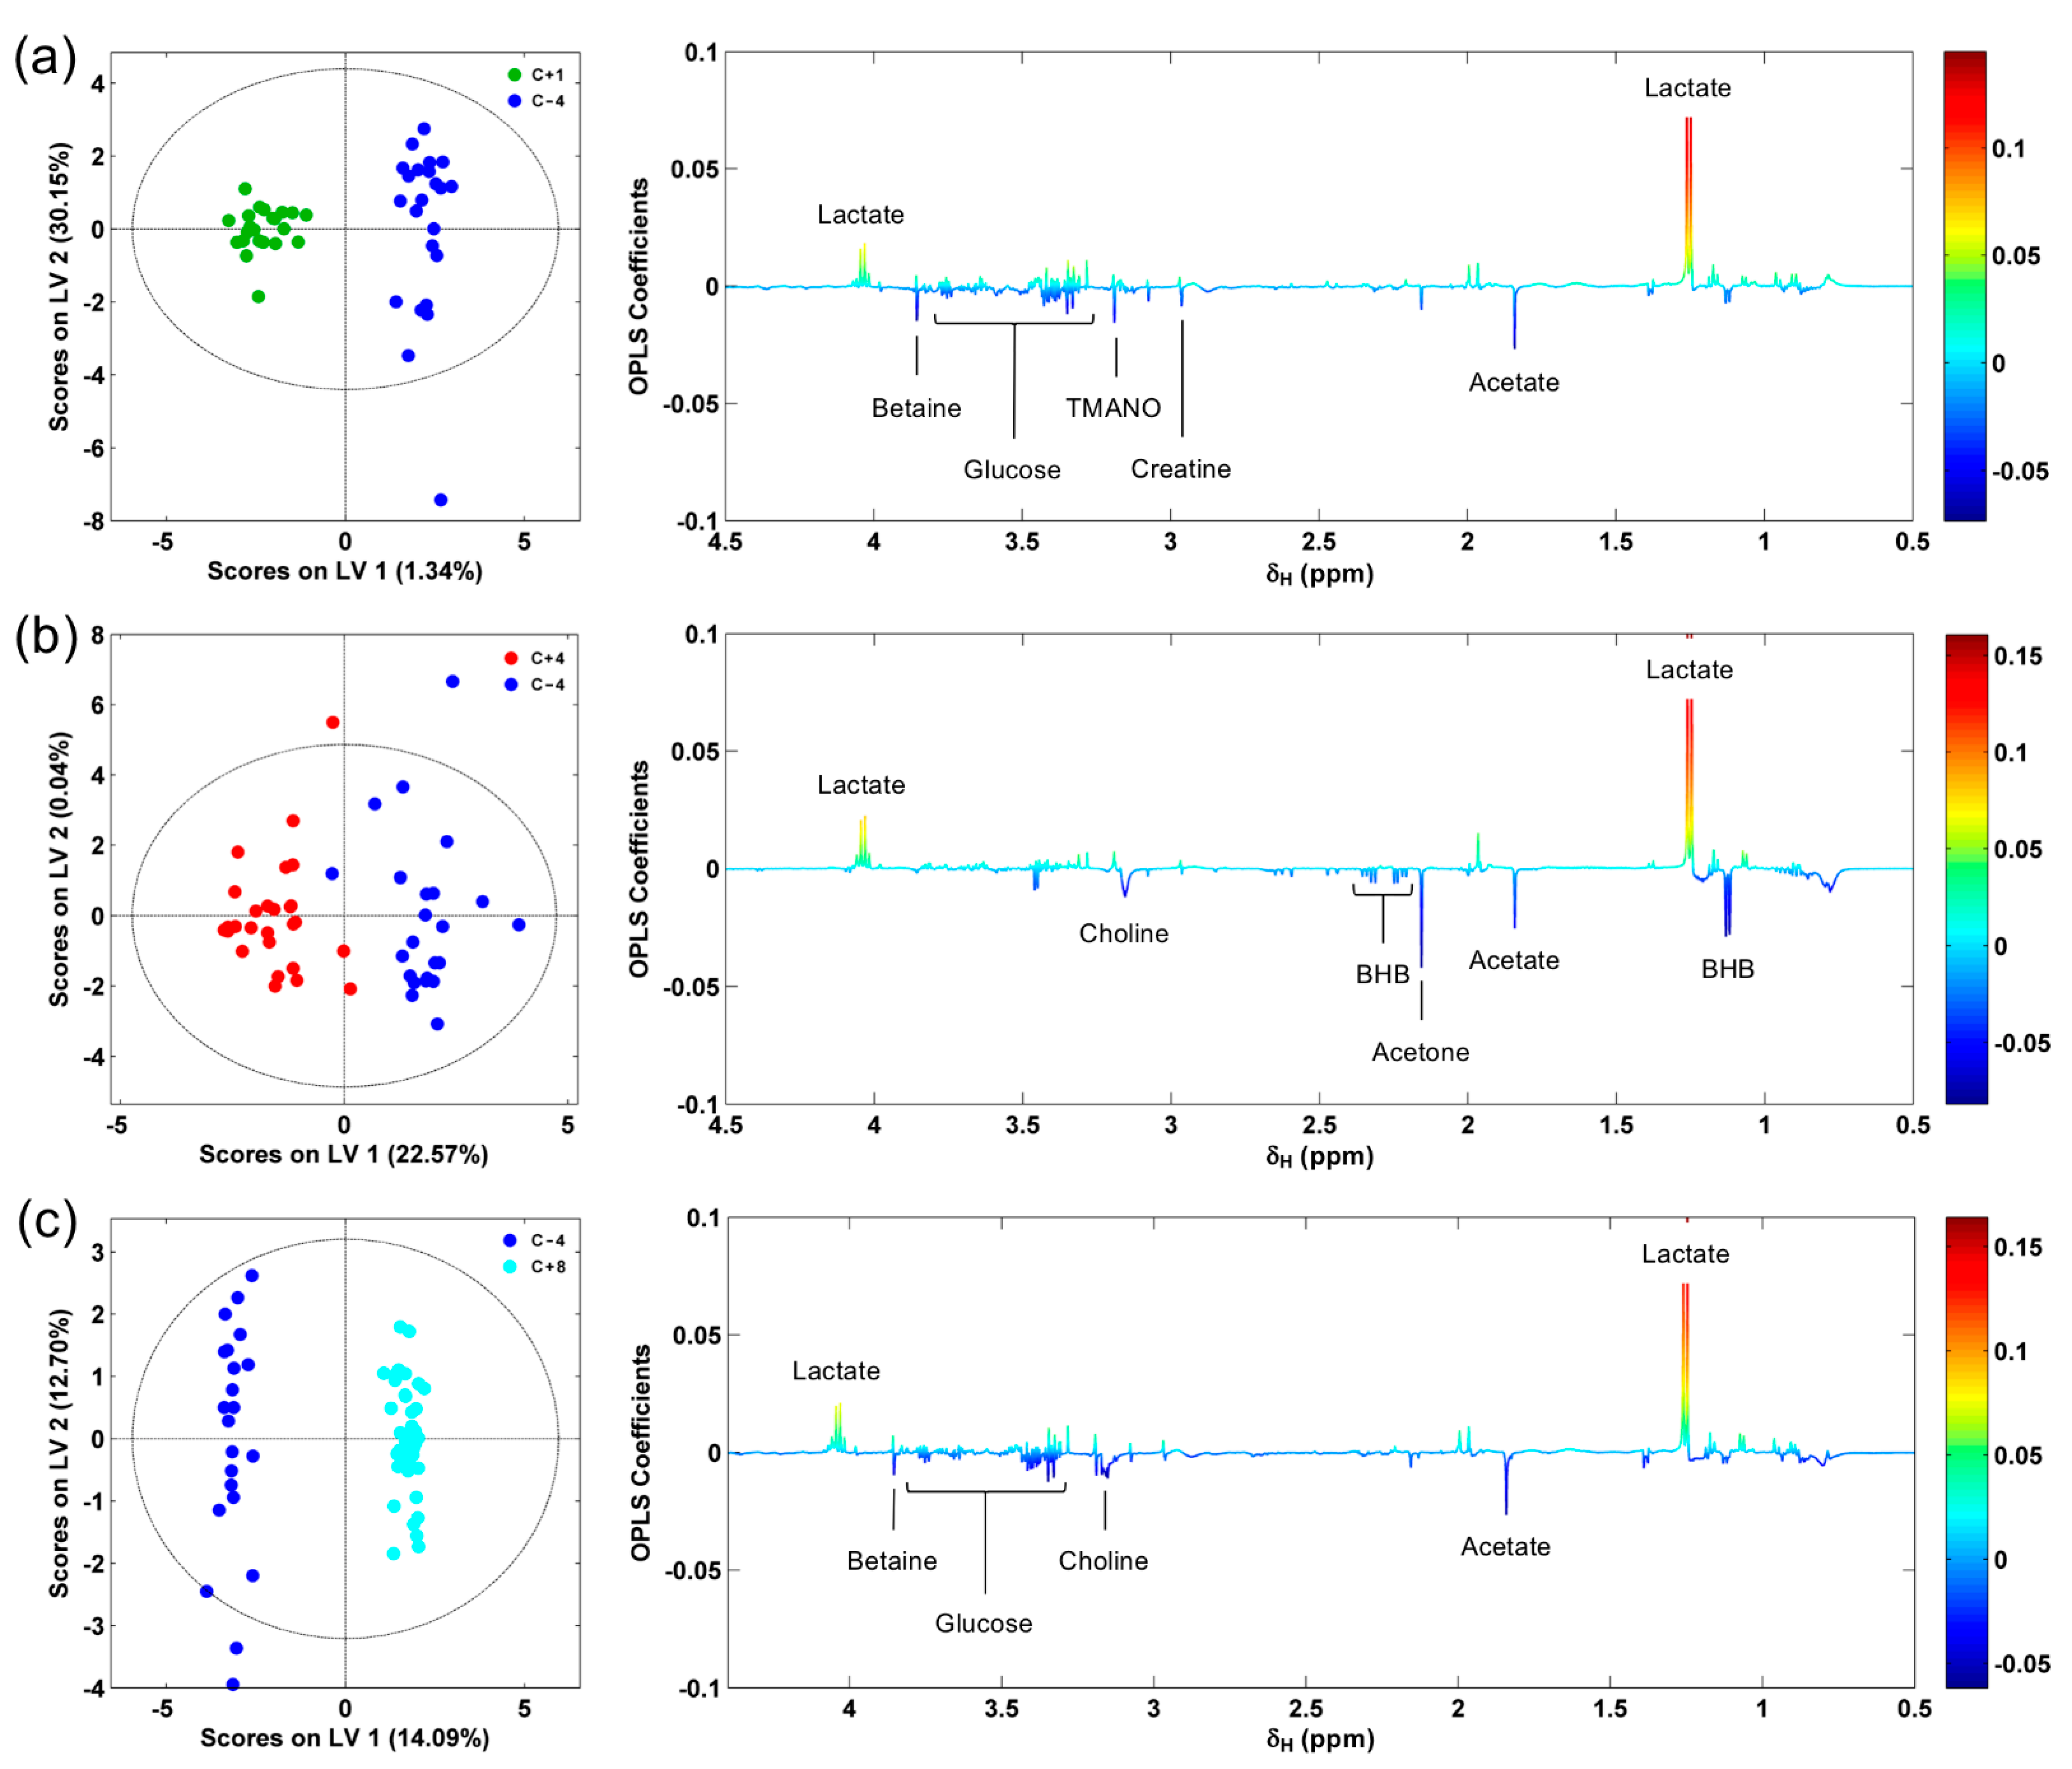
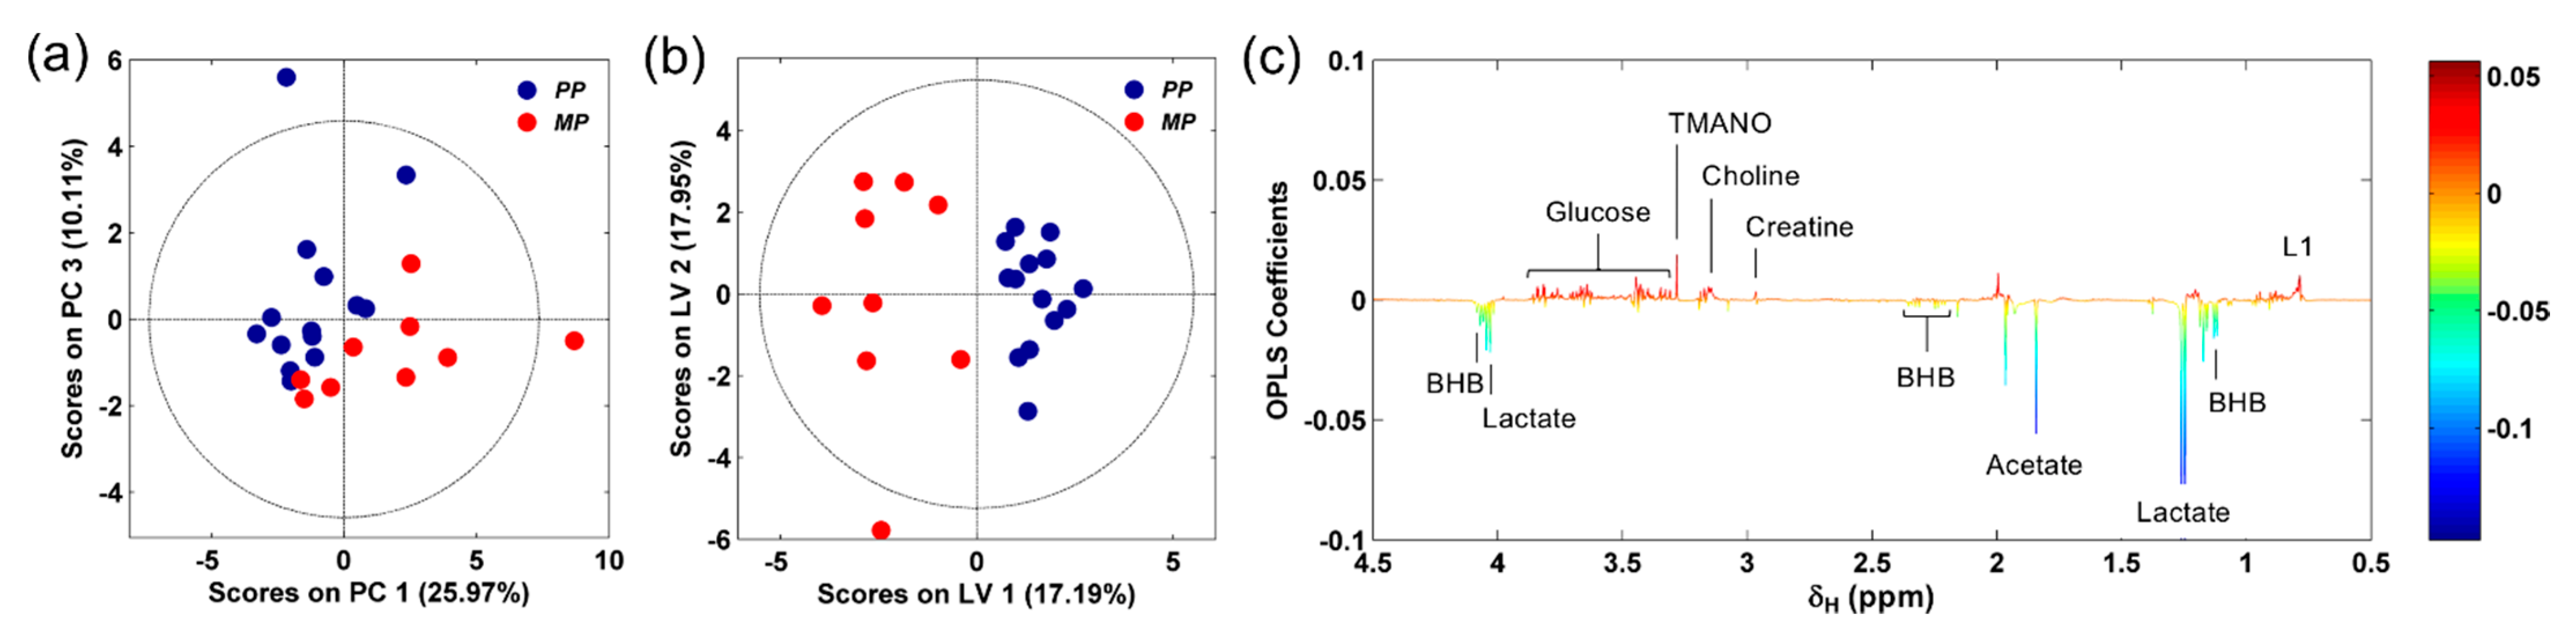
3.2. NMR-Based Serum Metabolomics

The initial step in the study involved the identification of groups among the animals through peripartum. For that purpose, we carried out a PCA considering the data derived from the 1H NMR spectra for all serum samples. The resulting score plot showed no differentiation according to parity or breed (Figure 2a,b, respectively). Similar results were obtained when principal components capturing less variance were considered in the score plots (Figures S1 and S2). However, when a continuous coloring scheme based on days around calving was employed to color the scores, four clear clusters were identified. These groups involved samples from animals four weeks before calving (C − 4), and one, four, and eight weeks after calving (C + 1, C + 4, and C + 8, respectively), and are colored blue, light-blue, yellow, and red in Figure 2c, respectively. Blood biochemistry data and other information on animals involved in each of these stages are summarized in Table 1.
Having identified four peripartum stages, we investigated variations in the serum metabolome, taking prepartum metabolite levels as reference. This was achieved through a pairwise comparison of the C − 4 against the C + 1, C + 4, and C + 8 groups, respectively, using OPLS-DA and univariate data analysis (Figure 3, Figure S3 and Table 2). In all cases, the large positive peak at 1.25 ppm observed in the OPLS-DA loading plots corresponds to a sharp drop in lactic acid concentration after calving. While there are several sources of this metabolite, including dehydrogenation of pyruvate through the glyoxalase system in the metabolism of fats, carbohydrates, and proteins [48], anaerobic bacterial fermentation in rumen and colon likely leads to the high levels of lactate observed before calving in this case [49,50]. As concluded in a recent large-scale NMR-based serum metabolomics study of clinically healthy dairy cattle [29], serum lactate can indeed be associated with an increased intake of fermentable carbohydrates such as those present in the TMR prepartum diet [51,52]. At the same time, the marked decrease in lactate levels following calving suggests that this metabolite is used to support glucose demands through gluconeogenesis by activation of the Cori cycle [53,54]. This, together with an increase in lipid metabolism through β-oxidation and the activation of the alanine cycle at the height of milk production (vide infra), is also consistent with the observed two- to three-fold rise in blood glucose levels after calving (Table 2), and could help explain why none of the animals had clinical manifestations of ketosis during the study.
One week after calving, negative values in the OPLS-DA loading plot for acetate, betaine, and creatine were observed (Figure 3a), indicating an increase in the levels of these metabolic stress markers [22,28]. The rise in the BHB and NEFA concentrations determined biochemically is also in agreement with this finding (Table 1). Overall, these data agree with the increase in lipid mobilization that reportedly takes place in early lactation [14,55]. As collected in Table 2, increases in asparagine, citrate, citrulline, glucose, and lysine are observed as well. This indicates alterations in the citric acid, urea, glycolytic, and gluconeogenic pathways immediately following parturition [14,28], and confirms that the animals enter a NEB condition. The rise in the levels of circulating allantoin (Table 2), a metabolite linked to purine catabolism, is consistent with higher ruminal microbial yields associated with the increase in DMI as well as the inclusion of forage in the diet after calving [56].
In addition to acetate and BHB, the loading plots for the OPLSA-DA contrasting the C − 4 and C + 4 groups show that the levels of other metabolic stress markers, such as acetone, choline, and formate rise significantly four weeks postpartum (Figure 3b and Figure S3b). Similarly, univariate data analysis indicates two- to four-fold increases for the species identified in the C + 1 stage, including acetate, BHB, betaine, and glucose, as well as for creatine and creatinine (Table 2). Greater accumulation of allantoin is also observed, which at this stage is likely to be associated not only with higher bacterial protein yields caused by the increase in DMI, but with an increase in tissue damage [57]. Indeed, the accumulation of alanine points to an activation of the alanine cycle, where muscle protein is catabolized to fuel liver gluconeogenesis [2,58]. The higher levels of acetate and citrate in blood also reveal a further increase in lipomobilization through lipolysis and β-oxidation. This, in turn, triggers the ketogenic pathway, leading to the marked rise observed in the concentrations of BHB, lysine, and, ultimately, acetone [28,57]. Not surprisingly, these pronounced changes occur when animals reach the peak of milk production (Table 1) and corroborate with the large shifts in metabolism that are required to meet energy demands during this period. Indeed, based exclusively on BHB levels, nearly one out of every four animals developed subclinical ketosis at this stage [36].
Metabolome data at C + 8 is of particular interest. Although cows are still at their peak of milk production, DMI also increases at this stage. As a result, animals tend to normalize their energy balance, which is evidenced by a decrease in the levels of NEFA (Table 1). This is also reflected in the OPLS-DA loading plot presented in Figure 3c, which reveals that the prepartum and C + 8 group are differentiated by metabolites such as acetate and glucose, but not by markers of severe metabolic stress present in the C + 4 group. In a similar way, univariate analysis shows that the metabolites with large fold changes for the C + 4 stage now present smaller variations when compared to their levels before calving. This indicates a trend towards the normalization of the metabolic pathways identified as altered by our analyses of the C + 1 and C + 4 groups and is consistent with the animals exiting the NEB condition and regaining homeostasis.
As stated above, no differences based on animal parity were observed when all the data were analyzed together. However, we decided to investigate if variations related to this condition could be evidenced within each of the four stages. For that purpose, a PCA for each of the peripartum group datasets was carried out. While no significant effects were observed at any stage after calving, a clear difference between primiparous and multiparous cows was evident in the C − 4 group (Figure 4a). Indeed, an OPLS-DA of these data readily reveals that the concentrations of lactate, acetate, and BHB are higher in multiparous cows before calving, while accumulation of creatine, TMAO, choline, glucose, and lipoproteins is observed in heifers (Figure 4b). These data likely reflect the feeding and herd behaviors of multiparous cows, which are known to be better adapted to prepartum TMR diets and to dominate primiparous animals, and thus have a greater DMI [59,60]. The higher intake of fermentable nutrients in these animals leads, in turn, to higher levels of volatile fatty acids in their bloodstream. In addition, heifers continue growing through pregnancy, and thus the concentration of anabolic hormones, such as IGF-1, is usually greater. This impacts the availability of nutrients in the mammary gland and could contribute to lowering the levels of circulating lactate and ketone bodies in these animals [61]. Few studies have analyzed the effect of parity on the entire serum metabolome of the lactating cow [29], and this is to our knowledge one of the first reports linking the observed variations with a combination of dietary and metabolic adaptations.

4. Conclusions

As detailed in the previous sections, NMR-based metabolomics allowed us to follow the changes of 18 serum metabolites during the transition period of dairy cows. The approach identified four clear stages through peripartum based on the metabolome composition and revealed alterations in important metabolic pathways. In particular, the data shows the sequential activation of several gluconeogenic routes after calving, including the Cori and alanine cycles. Analysis of metabolomic profiles also showed that the contribution of the former gluconeogenic pathway is affected by animal parity before calving. Although recent studies have yielded comparable results at two well-defined moments in the transition period [28], our findings indicate that markers of subjacent metabolic diseases, such as ketosis and liver lipidosis, are present through most of the lactation period but peak four weeks after calving. Furthermore, the results presented here are consistent with data obtained using targeted MS-based metabolomics [27].
Overall, our findings indicate that NMR-based methods are ideally suited to readily evaluate and follow the impact of nutritional management on the metabolic health of dairy herds throughout the transition period. We are currently using this approach to assess the effects of different postpartum dietary schemes on animal condition. In addition, the combined use of metabolomic data from serum, urine, and other biofluids to achieve higher specificity will be evaluated [47,62]. Work in this and related areas is underway, and our findings will be reported in due course.

Supplementary Materials

The following are available online at https://www.mdpi.com/article/10.3390/dairy2030028/s1, Table S1 and Figures S1–S17: Postpartum diet composition, additional PCA and OPLS-DA plots, and permutation test plots and ROC analysis curves for all OPLS-DA models.

Author Contributions

Conceptualization, A.M. and G.M.; experimental design, M.d.L.A., G.R., E.d.T. and A.M.; sample collection, M.d.L.A., G.R. and E.d.T.; data collection, data processing, and statistical analyses, A.L.R. and G.M.; writing—original draft preparation, G.M.; writing—review and editing, A.L.R., M.d.L.A., G.R., E.d.T., A.M. and G.M.; supervision, A.M. and G.M.; funding acquisition, M.d.L.A., A.M. and G.M. All authors have read and agreed to the published version of the manuscript.

Funding

This research was funded by the Agencia Nacional de Investigación e Innovación (ANII), grant number FSA_1_2013_12442, and the Programa de Desarrollo de las Ciencias Básicas (PEDECIBA).

Institutional Review Board Statement

The study was conducted according to guidelines and regulations approved by the Comisión Honoraria de Experimentación Animal, Universidad de la República (111130-002261-13).

Informed Consent Statement

Not applicable.

Data Availability Statement

The data presented in this study are available on request from the corresponding authors.

Acknowledgments

We wish to thank Lucas Irigoyen and Federico Hitta for their assistance in sample preparation and data collection, and Alberto Casal and Pablo Hoijemberg for critically reviewing the manuscript.

Conflicts of Interest

The authors declare no conflict of interest.

References

  1. Grummer, R.R. Impact of changes in organic nutrient metabolism on feeding the transition dairy cow. J. Anim. Sci. 1995, 73, 2820–2833. [Google Scholar] [CrossRef]
  2. Bauman, D.E.; Currie, W.B. Partitioning of nutrients during pregnancy and lactation: A review of mechanisms involving homeostasis and homeorhesis. J. Dairy Sci. 1980, 63, 1514–1529. [Google Scholar] [CrossRef]
  3. Ingvartsen, K.L. Feeding- and management-related diseases in the transition cow: Physiological adaptations around calving and strategies to reduce feeding-related diseases. Anim. Feed Sci. Technol. 2006, 126, 175–213. [Google Scholar] [CrossRef]
  4. Butler, W.R. Nutritional interactions with reproductive performance in dairy cattle. Anim. Reprod. Sci. 2000, 60–61, 449–457. [Google Scholar] [CrossRef]
  5. Drackley, J.K.; Overton, T.R.; Douglas, G.N. Adaptations of glucose and long-chain fatty acid metabolism in liver of dairy cows during the periparturient period. J. Dairy Sci. 2001, 84, E100–E112. [Google Scholar] [CrossRef]
  6. Meikle, A.; Kulcsar, M.; Chilliard, Y.; Febel, H.; Delavaud, C.; Cavestany, D.; Chilibroste, P. Effects of parity and body condition at parturition on endocrine and reproductive parameters of the cow. Reproduction 2004, 127, 727–737. [Google Scholar] [CrossRef] [PubMed] [Green Version]
  7. Ingvartsen, K.L.; Moyes, K. Nutrition, immune function and health of dairy cattle. Animal 2012, 7, 112–122. [Google Scholar] [CrossRef] [Green Version]
  8. Mulligan, F.J.; Doherty, M.L. Production diseases of the transition cow. Vet. J. 2008, 176, 3–9. [Google Scholar] [CrossRef]
  9. Ingvartsen, K.L.; Dewhurst, R.J.; Friggens, N.C. On the relationship between lactational performance and health: Is it yield or metabolic imbalance that cause production diseases in dairy cattle? A position paper. Livest. Prod. Sci. 2003, 83, 277–308. [Google Scholar] [CrossRef]
  10. Oltenacu, P.A.; Broom, D.M. The impact of genetic selection for increased milk yield on the welfare of dairy cows. Anim. Welf. 2010, 19, 39–49. [Google Scholar]
  11. Ingvartsen, K.L.; Andersen, J.B. Integration of metabolism and intake regulation: A review focusing on periparturient animals. J. Dairy Sci. 2000, 83, 1573–1597. [Google Scholar] [CrossRef]
  12. Burke, C.; Roche, R. Effects of pasture feeding during the periparturient period on postpartum anovulation in grazed dairy cows. J. Dairy Sci. 2007, 90, 4304–4312. [Google Scholar] [CrossRef]
  13. Enjalbert, F.; Nicot, M.C.; Bayourthe, C.; Moncoulon, R. Ketone bodies in milk and blood of dairy cows: Relationship between concentrations and utilization for detection of subclinical ketosis. J. Dairy Sci. 2001, 84, 583–589. [Google Scholar] [CrossRef]
  14. Giannesella, M.; Perillo, L.; Fiori, E.; Giudice, E.; Zumbo, A.; Morgante, M.; Piccione, G. Transition period in healthy and diseased dairy cows: Evaluation of metabolic modifications. Large Anim. Rev. 2018, 24, 107–111. [Google Scholar]
  15. Ceciliani, F.; Lecchi, C.; Urh, C.; Sauerwein, H. Proteomics and metabolomics characterizing the pathophysiology of adaptive reactions to the metabolic challenges during the transition from late pregnancy to early lactation in dairy cows. J. Proteom. 2018, 178, 92–106. [Google Scholar] [CrossRef]
  16. Zhang, H.; Wu, L.; Xu, C.; Xia, C.; Sun, L.; Shu, S. Plasma metabolomic profiling of dairy cows affected with ketosis using gas chromatography/mass spectrometry. BMC Vet. Res. 2013, 9, 186–199. [Google Scholar] [CrossRef] [PubMed] [Green Version]
  17. Imhasly, S.; Naegeli, H.; Baumann, S.; von Bergen, M.; Luch, A.; Jungnickel, H.; Potratz, S.; Gerspach, C. Metabolomic biomarkers correlating with hepatic lipidosis in dairy cows. BMC Vet. Res. 2014, 10, 122. [Google Scholar] [CrossRef] [PubMed] [Green Version]
  18. Dervishi, E.; Zhang, G.; Dunn, S.M.; Mandal, R.; Wishart, D.S.; Ametaj, B.N. GC-MS metabolomics identifies metabolite alterations that precede subclinical mastitis in the blood of transition dairy cows. J. Proteom. Res. 2017, 16, 433–446. [Google Scholar] [CrossRef]
  19. Zhang, G.; Dervishi, E.; Dunn, S.M.; Mandal, R.; Liu, P.; Han, B.; Wishart, D.S.; Ametaj, B.N. Metabotyping reveals distinct metabolic alterations in ketotic cows and identifies early predictive serum biomarkers for the risk of disease. Metabolomics 2017, 13, 43–58. [Google Scholar] [CrossRef]
  20. Zhang, G.; Ametaj, B.N. Ketosis: An old story under a new approach. Dairy 2020, 1, 42–60. [Google Scholar] [CrossRef]
  21. Sun, L.W.; Zhang, H.Y.; Wu, L.; Shu, S.; Xia, C.; Xu, C.; Zheng, J.S. 1H-Nuclear magnetic resonance-based plasma metabolic profiling of dairy cows with clinical and subclinical ketosis. J. Dairy Sci. 2014, 97, 1552–1562. [Google Scholar] [CrossRef] [PubMed]
  22. Xu, C.; Sun, L.-W.; Xia, C.; Zhang, H.-Y.; Zheng, J.-S.; Wang, J.-S. 1H-Nuclear magnetic resonance-based plasma metabolic profiling of dairy cows with fatty liver. Asian Australas. J. Anim. Sci. 2016, 29, 219–229. [Google Scholar]
  23. Dervishi, E.; Zhang, G.; Hailemariam, D.; Mandal, R.; Wishart, D.S.; Ametaj, B.N. Urine metabolic fingerprinting can be used to predict the risk of metritis and highlight the pathobiology of the disease in dairy cows. Metabolomics 2018, 14, 83. [Google Scholar] [CrossRef]
  24. Zhang, G.; Dervishi, E.; Zwierzchowski, G.; Mandal, R.; Wishart, D.S.; Ametaj, B.N. Urinary metabolomics around parturition identifies metabolite alterations in dairy cows affected postpartum by lameness: Preliminary study. Diary 2020, 1, 6–19. [Google Scholar] [CrossRef] [Green Version]
  25. Hailemariam, D.; Mandal, R.; Saleem, F.; Dunn, S.M.; Wishart, D.S.; Ametaj, B.N. Identification of predictive biomarkers of disease state in transition dairy cows. J. Dairy Sci. 2014, 97, 2680–2693. [Google Scholar] [CrossRef] [PubMed] [Green Version]
  26. Hailemariam, D.; Mandal, R.; Saleem, F.; Dunn, S.M.; Wishart, D.S.; Ametaj, B.N. Metabolomics approach reveals altered amino acid and sphingolipid profiles associated with pathological state in transition dairy cows. Curr. Metab. 2014, 2, 184–195. [Google Scholar] [CrossRef]
  27. Kenéz, Á.; Dänicke, S.; Rolle-Kampczyk, U.; von Bergen, M.; Huber, K. A metabolomics approach to characterize phenotypes of metabolic transition from late pregnancy to early lactation in dairy cows. Metabolomics 2016, 12, 165–176. [Google Scholar] [CrossRef]
  28. Luo, Z.Z.; Shen, L.H.; Jiang, J.; Huang, Y.X.; Bai, L.P.; Yu, S.M.; Yao, X.P.; Ren, Z.H.; Yang, Y.X.; Cao, S.Z. Plasma metabolite changes in dairy cows during parturition identified using untargeted metabolomics. J. Dairy Sci. 2019, 102, 1–12. [Google Scholar] [CrossRef] [Green Version]
  29. Luke, T.D.W.; Pryce, J.E.; Elkins, A.C.; Wales, W.J.; Rochfort, S.J. Use of large and diverse datasets for 1H NMR serum metabolic profiling of early lactation dairy cows. Metabolites 2019, 10, 180. [Google Scholar] [CrossRef] [PubMed]
  30. Fariña, S.R.; Chillibroste, P. Opportunities and challenges for the growth of milk production from pasture: The case of farm systems in Uruguay. Agric. Syst. 2019, 176, 102631. [Google Scholar] [CrossRef]
  31. Kolver, E.S.; Muller, L.D. Performance and nutrient intake of high producing Holstein cows consuming pasture or a total mixed ration. J. Dairy Sci. 1998, 81, 1403–1411. [Google Scholar] [CrossRef]
  32. Duffield, T.F.; Leslie, K.E.; Sandals, D.; Lissemore, K.; McBride, B.W.; Lumsden, J.H.; Dick, P.; Bagg, R. Effect of prepartum administration of a monensin controlled release capsule on cow health and reproduction. J. Dairy Sci. 1999, 82, 2377–2384. [Google Scholar] [CrossRef]
  33. LeBlanc, S. Postpartum uterine disease and dairy herd reproductive performance: A review. Vet. J. 2008, 176, 102–114. [Google Scholar] [CrossRef]
  34. Galvão, K.N.; Greco, L.F.; Vilela, J.M.; Sá Filho, M.F.; Santos, J.E. Effect of intrauterine infusion of ceftiofur on uterine health and fertility in dairy cows. J. Dairy Sci. 2009, 92, 1532–1542. [Google Scholar] [CrossRef] [PubMed]
  35. Ruegg, P.L. New perspectives in udder health management. Vet. Clin. Food Anim. 2012, 28, 149–163. [Google Scholar] [CrossRef]
  36. Duffield, T.F.; Lissemore, K.D.; McBride, B.W.; Leslie, K.E. Impact of hyperketonemia in early lactation dairy cows on health and production. J. Dairy Sci. 2009, 92, 571–580. [Google Scholar] [CrossRef] [PubMed] [Green Version]
  37. Nicholson, J.K.; Foxall, P.J.D.; Spraul, M.; Farrant, R.D.; Lindon, J.C. 750 MHz 1H and 13C NMR spectroscopy of human blood plasma. Anal. Chem. 1995, 67, 793–811. [Google Scholar] [CrossRef]
  38. Viant, M.R. Improved methods for the acquisition and interpretation of NMR metabolomic data. Biochem. Biophys. Res. Commun. 2003, 310, 943–948. [Google Scholar] [CrossRef] [PubMed]
  39. Purohit, P.V.; Rocke, D.M.; Viant, M.R.; Woodruff, D.L. Discrimination models using variance-stabilizing transformation of metabolomic NMR data. Omics 2004, 8, 118–130. [Google Scholar] [CrossRef] [PubMed] [Green Version]
  40. Van den Berg, R.A.; Hoefsloot, H.C.J.; Westerhuis, J.A.; Smilde, A.K.; van der Werf, M.J. Centering, scaling, and transformations: Improving the biological information content of metabolomics data. BMC Genom. 2006, 7, 142. [Google Scholar] [CrossRef] [Green Version]
  41. Wold, S.; Esbensen, K.; Geladi, P. Principal component analysis. Chemom. Intell. Lab. Syst. 1987, 2, 37–52. [Google Scholar] [CrossRef]
  42. Trygg, J.; Wold, S. Orthogonal projections to latent structures (O-PLS). J. Chemom. 2002, 16, 119–128. [Google Scholar] [CrossRef]
  43. Trygg, J.; Holmes, E.; Lundstedt, T. Chemometrics in metabonomics. J. Proteom. Res. 2007, 6, 469–479. [Google Scholar] [CrossRef] [PubMed]
  44. Simundic, A.-M. Diagnostic accuracy–Part 1. Basic concepts: Sensitivity and specificity, ROC analysis, STARD statement. Point Care 2012, 11, 6–8. [Google Scholar] [CrossRef]
  45. Ekelund, S. ROC curves–What are they and how are they used? Point Care 2012, 11, 16–21. [Google Scholar] [CrossRef]
  46. Ni, Y.; Su, M.; Lin, J.; Wang, X.; Qiu, Y.; Zhao, A.; Chen, T.; Jia, W. Metabolic profiling reveals disorder of amino acid metabolism in four brain regions from a rat model of chronic unpredictable mild stress. FEBS Lett. 2008, 582, 2627–2636. [Google Scholar] [CrossRef] [PubMed] [Green Version]
  47. Sun, H.Z.; Wang, D.M.; Wang, B.; Wang, J.K.; Liu, H.Y.; Guan, L.L.; Liu, J.X. Metabolomics of four biofluids from dairy cows: Potential biomarkers for milk production and quality. J. Proteom. Res. 2015, 14, 1287–1298. [Google Scholar] [CrossRef]
  48. Thornalley, P.J. Modification of the glyoxalase system in human red blood cells by glucose in vitro. Biochem. J. 1988, 254, 751–755. [Google Scholar] [CrossRef] [PubMed] [Green Version]
  49. Omole, O.O.; Nappert, G.; Naylor, J.M.; Zello, G.A. Both L- and D-lactate contribute to metabolic acidosis in diarrheic calves. J. Nutr. 2001, 131, 2128–2131. [Google Scholar] [CrossRef]
  50. Sako, T.; Urabe, S.; Kusaba, A.; Kimura, N.; Yoshimura, I.; Tazaki, H.; Imai, S.; Ono, K.; Arai, T. Comparison of plasma metabolite concentrations and lactate dehydrogenase activity in dogs, cats, horses, cattle and sheep. Vet. Res. Commun. 2007, 31, 413–417. [Google Scholar] [CrossRef]
  51. Krauze, K.M.; Oetzel, G.R. Understanding and preventing subacute ruminal acidosis in dairy herds: A review. Anim. Feed Sci. Technol. 2006, 126, 215–236. [Google Scholar] [CrossRef]
  52. Asanuma, N.; Hino, T. Regulation of fermentation in a ruminal bacterium, Streptococcus bovis, with special reference to rumen acidosis. Anim. Sci. J. 2002, 73, 313–325. [Google Scholar] [CrossRef]
  53. Overton, T.R.; Waldron, M.R. Nutritional management of transition dairy cows: Strategies to optimize metabolic health. J. Diary Sci. 2004, 87, E105–E119. [Google Scholar] [CrossRef] [Green Version]
  54. Aschenbach, J.R.; Kristensen, N.B.; Donkin, S.S.; Hammon, H.M.; Penner, B.G. Gluconeogenesis in dairy cows: The secret of making sweet milk from sour dough. IUBMB Life 2010, 62, 869–877. [Google Scholar] [CrossRef] [PubMed]
  55. Gonzáles, F.D.; Muiño, R.; Pereira, V.; Campos, R.; Bendito, J.L. Relationship among blood indicators of lipomobilization and hepatic function during early lactation in high-yielding dairy cows. J. Vet. Sci. 2011, 12, 251–255. [Google Scholar] [CrossRef] [Green Version]
  56. Vercoe, J.E. Urinary allantoine excretion and digestible dry-matter intake in cattle and buffalo. J. Agric. Sci. 1976, 86, 613–615. [Google Scholar] [CrossRef]
  57. Koch, F.; Lamp, O.; Eslamizad, M.; Weitzel, J.; Kuhla, B. Metabolic response to heat stress in late-pregnant and early lactation dairy cows: Implications to liver-muscle crosstalk. PLoS ONE 2016, 11, e0160912. [Google Scholar] [CrossRef] [PubMed]
  58. Bell, A.W. Regulation of organic nutrient metabolism during transition from late pregnancy to early lactation. J. Anim. Sci. 1995, 73, 2804–2819. [Google Scholar] [CrossRef]
  59. Hayirli, A.; Grummer, R.R.; Nordheim, E.V.; Crump, P.M. Animal and dietary factors affecting feed intake during the prefresh transition period in Holsteins. J. Dairy Sci. 2002, 85, 3430–3443. [Google Scholar] [CrossRef]
  60. Grant, R.J.; Albright, J.L. Effect of animal grouping on feeding behavior and intake of dairy cattle. J. Dairy Sci. 2001, 85, E156–E163. [Google Scholar] [CrossRef]
  61. Meikle, A.; de Brun, V.; Carriquiry, M.; Soca, P.; Sosa, C.; Adrien, M.L.; Chilibroste, P.; Abecia, J.A. Influences of nutrition and metabolism on reproduction of the female ruminant. Anim. Reprod. 2018, 15, 899–911. [Google Scholar] [CrossRef]
  62. Kim, H.S.; Kim, E.D.T.; Eom, J.S.; Choi, Y.Y.; Lee, S.J.; Lee, S.S.; Chung, C.D.; Lee, S.S. Exploration of metabolite profiles in the biofluids of dairy cows by proton nuclear magnetic resonance analysis. PLoS ONE 2021, 16, e0246290. [Google Scholar]
Figure 1. Representative 1H NMR spectrum of a dairy cow serum sample. The signals corresponding to allantoine (1), α-glucose (2), β-glucose (3), BHB (4), lactate (5), myo-inositol (6), TMAO (7), betaine (8), phosphocholine (9), glycerolphosphocholine (10), choline (11), creatinine (12), creatine (13), TMA (14), citrate (15), acetone (16), O-acetylglycoprotein (17), N-acetylglycoprotein (18), acetate (19), citrulline (20), lysine (21), alanine (22), valine (23), isobutyrate (24), isoleucine (25), leucine (26), and L1 lipoprotein (27) are annotated.
Dairy 02 00028 g001
Figure 2. PCA score plot obtained from 1H NMR spectral data for all serum samples. The plot was colored based on breed (a), parity (b), or using a continuous coloring scheme which varies as a function of the transition period day relative to calving (c).
Dairy 02 00028 g002
Figure 3. Score and loading factor plots obtained from the OPLS-DA between prepartum (C − 4) and first (C + 1) (a), second (C + 4) (b), and third (C + 8) (c) postpartum groups. The metabolites that differentiate the prepartum from each postpartum group are annotated in the loading factor plots. The R2Y and Q2Y coefficients for each model were 0.80 and 0.72, 0.89, and 0.37, and 0.94 and 0.87, respectively, and their ROC curves had AUC values of 1.00, 0.85, and 0.99 (see Figures S4–S9).
Dairy 02 00028 g003
Figure 4. PCA score plot obtained from 1H NMR spectral data for prepartum (C − 4) serum samples colored according to animal parity (a), and score and loading factor plots obtained from the OPLS-DA between primiparous and multiparous dairy cows within this group (b,c). The metabolites that differentiate the two groups are annotated in the loading factor plots. The R2Y and Q2Y coefficients for the model were 0.82 and 0.56, and its ROC curve had an AUC value of 0.93 (see Figures S16 and S17).
Dairy 02 00028 g004
Table 1. Animal and blood biochemistry data for cows within each stage identified through multivariate analysis of 1H NMR data.
Animal DataStage
C − 4C + 1C + 4C + 8
Days in stage−36 to −223 to 1123 to 3439 to 68
N (H, J, H × J) a23 (19, 2, 2)20 (18, 0, 2)24 (20, 2, 2)20 (17, 1, 2)
Parity (PP, MP) b15, 812, 815, 913, 7
Disease (SCK, MCM) c0, 92, 66, 102, 11
Milk production (L/day)-23 ± 728 ± 625 ± 7
Biochemistry
Albumin (g/L)31.00 ± 2.1929.64 ± 2.9129.44 ± 5.6731.42 ± 2.78
Urea (mM)2.40 ± 1.312.82 ± 1.102.65 ± 1.113.43 ± 1.46
Cholesterol (mM)2.71 ± 0.432.29 ± 0.503.81 ± 0.755.09 ± 0.93
Total protein (g/L)79.61 ± 7.0074.23 ± 7.1978.13 ± 7.7280.52 ± 6.64
Globuline (g/L)48.90 ± 6.5044.59 ± 5.1748.69 ± 5.1249.10 ± 4.60
BHB (mM)0.38 ± 0.210.56 ± 0.320.78 ± 0.630.65 ± 0.35
NEFA (mM)0.29 ± 0.180.63 ± 0.220.68 ± 0.360.47 ± 0.20
a H, J, and H × J represent Holstein, Jersey, and Holstein × Jersey crosses, respectively. b PP and MP indicate primiparous and multiparous, respectively. c SCK and MCM indicate subclinical ketosis and mild clinical mastitis (i.e., grade 1), respectively.
Table 2. Average metabolite concentrations during peripartum determined by 1H NMR (mean ± std. dev.) and fold changes with respect to prepartum levels.
MetaboliteConcentration (mM)Fold Change
C − 4C + 1C + 4C + 8C + 1/C − 4pC + 4/C − 4pC + 8/C − 4p
Acetate0.83 ± 0.801.36 ± 1.221.99 ± 2.171.86 ± 1.131.630.04942.400.00912.250.0002
Acetone0.11 ± 0.150.12 ± 0.080.17 ± 0.160.12 ± 0.091.140.35191.620.07241.100.3734
Alanine0.18 ± 0.170.26 ± 0.220.43 ± 0.460.51 ± 0.391.500.07882.480.00712.880.0002
Allantoin0.07 ± 0.070.16 ± 0.160.24 ± 0.270.20 ± 0.122.160.01673.410.00212.81<0.0001
Asparagine0.61 ± 0.421.71 ± 2.202.36 ± 2.901.92 ± 1.272.820.01163.880.00743.16<0.0001
Betaine0.18 ± 0.150.34 ± 0.380.56 ± 0.630.43 ± 0.261.920.03293.150.00352.440.0001
BHB0.38 ± 0.200.56 ± 0.320.78 ± 0.620.65 ± 0.351.460.01752.040.00281.710.0009
Citrate0.10 ± 0.090.26 ± 0.250.39 ± 0.500.22 ± 0.182.590.00974.010.00852.290.0035
Citrulline0.13 ± 0.120.26 ± 0.310.48 ± 0.650.28 ± 0.232.010.04423.750.00692.180.0039
Creatine0.04 ± 0.040.10 ± 0.140.15 ± 0.220.10 ± 0.092.510.02013.700.01052.330.0029
TMA0.06 ± 0.040.23 ± 0.670.13 ± 0.190.10 ± 0.091.540.03252.130.04841.680.0229
α-Glucose1.00 ± 0.882.27 ± 2.543.50 ± 4.152.91 ± 2.042.280.01453.510.00332.29<0.0001
β-Glucose0.92 ± 0.812.19 ± 2.613.49 ± 4.742.81 ± 2.082.380.04153.770.00683.04<0.0001
Lactate3.60 ± 3.101.16 ± 0.631.67 ± 1.131.60 ± 0.77−2.230.0038−2.160.0015−2.260.0006
Leucine0.12 ± 0.100.06 ± 0.030.06 ± 0.030.03 ± 0.03−1.830.0166−1.930.0036−3.80< 0.0001
Lysine0.08 ± 0.070.23 ± 0.310.37 ± 0.480.26 ± 0.202.630.01694.160.00372.970.0001
Valine0.23 ± 0.170.22 ± 0.070.24 ± 0.080.26 ± 0.09−1.020.45831.040.39381.140.1901
Publisher’s Note: MDPI stays neutral with regard to jurisdictional claims in published maps and institutional affiliations.

