Next Article in Journal
Probiotic Fermented Milk with Collagen
Previous Article in Journal
Bacterial Endotoxins and Their Role in Periparturient Diseases of Dairy Cows: Mucosal Vaccine Perspectives
 
 
Comment published on 16 October 2020, see Dairy 2020, 1(3), 187-188.
Article

Maize and Grass Silage Feeding to Dairy Cows Combined with Different Concentrate Feed Proportions with a Special Focus on Mycotoxins, Shiga Toxin (stx)-Forming Escherichia coli and Clostridium botulinum Neurotoxin (BoNT) Genes: Implications for Animal Health and Food Safety

1
Institute of Animal Nutrition, Friedrich-Loeffler-Institut (FLI), Federal Research Institute for Animal Health, 38116 Braunschweig, Germany
2
Institute of Bacterial Infections and Zoonoses, Friedrich-Loeffler-Institut (FLI), Federal Research Institute for Animal Health, 07743 Jena, Germany
3
Chair of Animal Hygiene, TUM School of Life Sciences Weihenstephan, Technical University of Munich, 85354 Freising, Germany
4
LKS mbH, 09577 Lichtenwalde, Germany
5
Physiological Institute, University of Veterinary Medicine Hanover, 30173 Hannover, Germany
6
Institute for Animal Science Physiology & Hygiene, University of Bonn, 53115 Bonn, Germany
7
Institute of Bioanalytics and Agro-Metabolomics, Department of Agrobiotechnology, IFA-Tulln, University of Natural Resources and Life Sciences, Vienna (BOKU), Konrad-Lorenz-Str. 20, 3430 Tulln, Austria
8
Institute of Molecular Pathogenesis, Friedrich-Loeffler-Institut (FLI), Federal Research Institute for Animal Health, 07743 Jena, Germany
*
Author to whom correspondence should be addressed.
In memoriam.
Dairy 2020, 1(2), 91-125; https://doi.org/10.3390/dairy1020007
Submission received: 5 April 2020 / Revised: 24 May 2020 / Accepted: 22 June 2020 / Published: 6 July 2020

Abstract

:
A feeding experiment was carried out with late-lactating cows over 12 weeks to evaluate the feeding value of a basic diet with maize and grass silage (MS, GS) when combined with varying portions of concentrate in the ration (20% and 60% on a dry matter basis) and to test the effects on health and performance, the transfer of important Fusarium toxins to blood and milk, the total and Shiga toxin (stx)-forming E. coli counts, and the presence of Clostridium botulinum neurotoxin (BoNT) genes in rectal fecal samples. MS was contaminated by a broader spectrum of fungal and other metabolites compared to GS. MS contained higher concentrations of the important Fusarium toxins deoxynivalenol (DON) and zearalenone (ZEN). Blood and milk levels of DON and ZEN residues generally reflected the differences in exposure at a low level. Feeding of MS with 60% concentrate feed induced subacute ruminal acidosis (SARA) associated with a marked drop in dry matter intake, fat corrected milk yield and a fat to protein ratio in milk of lower than 1. The SARA-associated higher ruminal LPS concentration did not affect the circulating concentrations of haptoglobin as an indicator of systemic inflammation. Lower rumen pH values in both MS-fed groups were associated with lower pH values, higher absolute E. coli counts and increased proportions of stx-positive E. coli in rectal feces. BoNT genes A, B, C, D, E and F remained undetectable in any of the fecal samples suggesting that feedstuffs were virtually free of the corresponding C. botulinum strains. In conclusion, maize feedstuff (silage, grains, starch-containing byproducts)-dominated rations for dairy cows should be avoided to reduce adverse effects on health and food safety.

1. Introduction

Maize and grass silage (MS, GS) are the most commonly used roughages for feeding dairy cows in many countries [1]. Among others, MS provides energy in the form of starch while GS serves as an important structural diet component. Meeting the energy requirements of the high-yielding dairy cow and fulfilling rumination needs are key components of successful dairy cow nutrition.
From a feed and food hygiene perspective, MS is at a particularly high risk of contamination by mycotoxins [2,3,4] and provides high proportions of rumen-resistant starch [5,6,7], possibly giving rise to hindgut acidosis and E. coli overgrowth. GS might be a vehicle for Clostridia, most notably for C. botulinum, which is potentially capable of forming C. botulinum neurotoxins (BoNT) [8,9,10]. Furthermore, GS can be particularly characterized by a higher degree of proteolysis giving rise to the formation of biogenic amines which might be pharmacologically active when absorbed in larger quantities [11,12].
Varying the portion of concentrate feed is necessary in dairy cow diets to adapt to changing energy and nutrient requirements in the course of the lactation period. Due to these changes associated with the stages of lactation, the proportion of silage to concentrate feed in the daily ration also varies over time with possible implications for ruminal and hindgut conditions critical for development of acidosis and dysbiosis of microbiota [13]. Such conditions might not only induce E. coli overgrowth in the hindgut with possible triggering of Shiga toxin (stx)-forming E. coli [14,15,16], but might also influence the mycotoxin metabolizing capability of an altered microbial community. Moreover, ruminal and hindgut acidosis-associated epithelial lesions might facilitate the transfer of non-metabolized mycotoxins and microbial constituents such as lipopolysaccharides (LPS) with the potential of inducing systemic inflammation [17,18,19,20].
Thus, the aim of the present experiment was to evaluate important feed safety features of feeding MS and GS in combination with low or high concentrate feed proportions. Amongst food hygienic and health aspects as key components of feed safety, we particularly addressed mycotoxin residues in milk, stx-positive E. coli and the presence of BoNT genes in rectal feces, as well as indicators of rumen and the general health of the cows.

2. Materials and Methods

2.1. Experimental Design

Four treatment groups were designed to test the interactions between silage types and concentrate feed portion. For this purpose, both GS and MS were combined with either a low (20% of dry matter, DM, grass-20, maize-20) or a high portion (60% of DM, grass-60, maize-60) of concentrate feed (Table 1). Based on these combinations the silage proportions amounted to 80% and 40% on a DM basis, respectively. In order to meet the energy and nutrient requirements of the complete ration two different concentrate feeds were created differing both in components and in nutrient concentrations (Table 2). In general, the concentrate feed “A” contained lower energy and nutrient concentration than concentrate feed “B” due to the higher concentration of mineral feed and urea in order to balance the concentrations of major minerals and crude protein in rations containing higher proportions of silages. The total concentrate feed proportion of the TMRs resulted from the combinations of concentrate feeds “A” and “B”.

2.2. Feeding Experiment and Sampling

The experiment was conducted at the experimental station of the Friedrich-Loeffler-Institut Braunschweig in compliance with the European Community regulations concerning the protection of experimental animals and was approved by the Lower Saxony State Office for Consumer Protection and Food Safety (LAVES), Germany (File Number 33.9-42502-04-11/0444).
A total of 64 mid-lactating cows of the Holstein breed were randomly assigned to the 4 treatment groups stratified for comparable initial milk yields (31.3 ± 6.0), days in milk (DIM, 158 ± 28) and number of lactations (2.6 ± 1.4). The experiment started in April and comprised 12 weeks of feeding the experimental diets and a post-treatment period of 3 weeks (weeks 13–15 of the experiment) during which all cows were fed the same diet. This period served as a post-treatment control period for the evaluation of E. coli in rectal feces as these measurements started only in week 9 due to the temporal availability of microbiological investigations.
The milk yield of the cows was recorded twice daily when the cows were milked at 05.30 and 15.30 h. Cows were weighed when leaving the milking parlor. The body condition score (BCS) of the animals was estimated according to a 5-point scale [22].
Milk samples were collected twice a week and analyzed for fat, protein, lactose and urea concentrations as well as somatic cell count (SCC) using an infrared milk analyzer (Milkoscan FT 6000) in combination with a flow cytometric analyzer (Fossomatic 5000; Foss Electric, Hillerød, Denmark).
During the entire experiment, the cows were kept in group pens according to their feeding group. The pens were equipped with slatted floors and cubicles equipped with rubber mattresses covered with wood litter. Pens were equipped with self-feeding stations (Type RIC, Insentec B.V., Marknesse, The Netherlands) and cows with ear transponders for the individual recording of feed intake.
Rumen fluid samples for the determination of pH values, short-chain fatty acids (SCFA) and ammonia were collected by using an oro-ruminal probe described by Geishauser [23] from 6 to 8 cows of each treatment group in the morning of weeks 0 (before introducing the experimental diets), 3, 6 and 12 of experiment. The procedure required discarding approximately 200–300 mL of rumen fluid after initial suction before the sample of interest was collected in order to minimize saliva contamination. From the same cows and at the same time points rectal feces samples for the determination of pH and DM content were collected. Blood samples were drawn from a vena jugularis externa at the same time intervals.
The collection of rectal fecal samples for E. coli determination started at week 9 and was continued in weekly intervals until week 12 of the experiment (end of treatment period). A last fecal sample was collected at week 15 after 3 weeks feeding a similar diet (post-treatment period).

2.3. Analyses

2.3.1. Nutrients and Biogenic Amines in Feed

GS and MS were sampled twice weekly, pooled over periods of 4 weeks for analysis, dried at 60 °C for 72 h and ground to pass a 1 mm screen using a Retsch mill (SM 1, Retsch, Haan, Germany). Concentrates were sampled once weekly and prepared for analyses as described for silages.
The crude nutrients, true protein content (tP) according to Barnstein, and cell wall components of the feedstuffs were analyzed according to the methods of the VDLUFA (Verband Deutscher Landwirtschaftlicher Untersuchungs- und Forschungsanstalten) [24]. The latter were determined as acid detergent fiber, corrected for crude ash (ADFom), and neutral detergent fiber, corrected for crude ash, whereby the detergent contained amylase und sodium sulfate (aNDFom). Feedstuffs were additionally analyzed for crude protein (CP) fractions according to Licitra et al. [25] and for biogenic amines with High Performance Liquid Chromatography with Fluorescence Detection (HPLC-FLD) and pre-column derivatization with ortho-phthalaldehyde (OPA) [26].

2.3.2. Mycotoxins

Multi-Toxin/Metabolite Analyses of Grass and Maize Silage

Mycotoxins and further metabolites were extracted from MS and GS using acetonitrile/water/acetic acid (79:20:1, v/v/v) as extraction solvent. Five g of each ground sample were extracted with 20 mL of solvent in a 50 mL polypropylene tube (Sarstedt, Nümbrecht, Germany) for 90 min at 180 rpm shaking speed using a GFL 3017 rotary shaker (GFL 3017, Burgwedel, Germany).
Extracts were analyzed for a total of 650 metabolites using a 1290 Series HPLC system (Agilent, Waldbronn, Germany) coupled to a QTrap 5500 HPLC-mass spectrometry(MS)/MS system (Applied Biosystems SCIEX, Foster City, CA) equipped with Turbo Ion Spray electrospray ionization source as described earlier [27]. Chromatographic separation was performed at 25 °C on a Gemini® C18 column, 150 × 4.6 mm i.d., 5 μm particle size, equipped with a C18 4 × 3 mm i.d. security guard cartridge (Phenomenex, Torrance, CA, USA).
Confirmation of positive metabolite identification was carried out by the acquisition of two time- scheduled multiple reaction monitoring (MRM) transitions which yielded 4.0 identification points according to European Commission decision 2002/657. In addition, retention time and ion ratio had to agree to the related values of authentic standards within 0.03 min and 30% relatively, respectively. The results were corrected using apparent recoveries that were determined for each of the investigated matrices by spiking experiments. The accuracy of the method was verified on a continuous basis by participation in a proficiency testing scheme organized by BIPEA (Gennevilliers, France) with a current rate of z-score between −2% and 2% of 94% (>900 results submitted).
To determine secondary metabolites of the molds Aspergillus fumigatus, Monascus ruber, and Penicillium roqueforti, which occur frequently in silages [28,29], samples (10 g) were extracted with acetonitrile/water (30 mL, 84/16, v/v). Subsequent to simple clean-up by a syringe filter, the extracts were analyzed by HPLC-MS/MS using a Series 200 HPLC system (Perkin-Elmer, Shelton, CT, USA) coupled to a API 3200 ESI-MS/MS (Applied Biosystems, Foster City, USA). The details of the method are given in [30]. The limits of detection (LODs) were 1 μg/kg (verruculogen, gliotoxin, trypacidin, roquefortin C, fumitremorgen, mycophenolic acid) and 5 μg/kg (monacolin KA, monacolin KL, fumagillin), respectively. Furthermore, due to the lack of quantifiable standard substances, cyclotyprostatin, festuclavin, fumitremorgen A and B, fumigatin, fumigaclavin A, B and C, fumiquinazolin A, B, C, D, F and G, PR-toxin, pseurotin A, pyripyropen A, sphingofungin A and D, synerazol, and tryprostatin A and B were analyzed qualitatively.

Analyses of Feedstuffs for Deoxynivalenol (DON) and Zearalenone (ZEN)

ZEN in GS, MS and concentrate feedstuffs was analyzed using HPLC with fluorescence detection after clean-up with immune-affinity columns (IACs) (ZearalaTest WB, Vicam, Milford, MA, USA) according to a slightly modified method as described in [31]. DON was determined by HPLC with a diode array detector after clean-up with IACs (DONprep, r-Biopharm AG, Darmstadt, Germany) [32].

Blood and Milk

The analytics of ZEN, DON and their metabolites in blood plasma and milk samples have been described by Brezina et al. [33] and Winkler et al. [34,35]. Briefly, plasma or milk samples were treated overnight with β-glucuronidase (Type H-2 from Helix pomatia, Sigma-Aldrich, Steinheim, Germany) to record the sum of free and conjugated toxins. Afterwards, the samples were purified by solid phase extraction on Oasis HLB (Waters, USA). The analytes were determined by LC-MS/MS which was performed using an Agilent 1200 series (Agilent Technologies, Böblingen, Germany) liquid chromatograph coupled with a 4000 QTrap system (Applied Biosystems, Darmstadt, Germany), which was equipped with an electrospray ionization source.
The LODs in milk [34] and plasma [36] and, the latter in brackets, were as follows: ZEN 0.02 (0.09) ng/mL; α-zearalenol (ZEL) 0.13 (0.26) ng/mL; β-ZEL 0.18 (0.33) ng/mL; zearalenone (ZAN) 0.09 (0.44) ng/mL; α-zearalanol (ZAL) 0.08 (0.10) ng/mL; β-ZAL 0.06 (0.08) ng/mL; DON 0.22 (0.31) ng/mL; de-epoxy-DON 0.16 (0.17) ng/mL.

2.3.3. Microbiological Evaluation of Silages

The assessment of the microbial status of the silages followed the procedure of the VDLUFA. This procedure is based on microbial culture methods and guidance values for “normal” microbial feedstuff-specific microbial infestation [37]. For this purpose, the feedstuff is examined for the colony-forming units (CFU) of 19 indicator germs grouped into aerobic mesophilic bacteria, molds and Dematiaceae (dark pigmented conidia-forming fungi such as Alternaria, Cladosporium, Stachybotrys and others) and yeasts. The first two groups are further sub-grouped into product-specific and spoilage-indicating microbes while all yeasts are generally considered as spoilage-indicating. Based on this sub-grouping, a total of seven germ groups are formed. The determined CFU concentration for each of these seven germ groups of a particular feedstuff is then compared to the guidance values for microbial infestation for that feedstuff and classified into a total of four germ count levels. The more the guidance value is exceeded, the poorer the germ count level, i.e., level 4 indicates the poorest quality, or in other words, the highest deviation from the “normal” infestation of a particular germ group. Finally, the germ count levels of all seven germ groups are assigned to one unique quality level depending on how many germ groups fall into particular germ count levels whereby quality level 4 indicates the poorest quality.

2.3.4. pH Values, SCFA, Ammonia and Lipopolysaccharides (LPS) in Rumen Fluid

The pH value in rumen fluid and feces was measured immediately after collection using a portable pH meter (pH 538, WTW, Weilheim Germany). Thereafter, the samples were further processed for the analysis of SCFA as outlined in Geissler et al. [38] by using a gas chromatograph equipped with a flame ionization detector. Ammonia-N (NH3-N) was determined as described in Anonymous [39].
Rumen fluid was collected in pyrogen-free tubes for LPS determination. Samples were centrifuged at 10,000× g for 30 min and supernatants were heated at 100 °C for 30 min after passing through a 0.22 µm filter. Samples were kept at −20 °C until analysis. Further sample preparation included dilution with LPS-free water at approximately 1:32,000 v/v before analysis. LPS concentrations were determined using the Limulus Amebocyte Lysate (LAL) Kinetic-QCL™ (Lonza, Walkersville, MD, USA) following the manufacturer’s instructions. A microplate reader with an incubation chamber (Infinite M200, Tecan Group Ltd., Männedorf, Switzerland) was used and the data were evaluated using the Magellan™ data analysis software (Tecan Group Ltd., Männedorf, Switzerland).

2.3.5. E. coli and Shigatoxigenic E. coli (STEC) in Rectal Feces

Total E. coli in fresh fecal samples were determined after 18 h incubation on MacConkey agar directly plated with the samples in a dilution series (from undiluted to a dilution of 1:1,000,000). Counted colonies are reported as colony-forming units (CFU) per g fresh feces. stx genes were detected using PCR. For doing so, direct platings were incubated on Gassner agar overnight, followed by DNA liberation by cooking lysis of the eluent mixed bacterial cultures [40]. PCR-positive samples were quantified for STEC through the hybridization of colonies after detaching from the MacConkey agar using stx1 and 2 probes [41]. Results are expressed as percentage stx-positive E. coli CFU.

2.3.6. Detection of BoNT Genes in Rectal Feces

The samples were stored at −20 °C until examination. For enrichment, approximately 1 g sample material was inoculated in 10 mL modified cooked meat medium (MCM). Subsequently, the samples were incubated at 30 °C for 5 to 8 days under anaerobic conditions. The DNA preparation was performed with a QIAmp DNA stool kit (Qiagen, Hilden, Germany) according to the manufacturer’s specifications. Conventional PCR for the detection of botulinum neurotoxin genes (BoNT) A, B, C, D, E and F [42] was done in single reactions with additional inhibition control as described in Fohler et al. [43].

2.3.7. Clinical-Chemical Blood Traits and Hematology

Beta-hydroxy butyrate (BHB), non-esterified fatty acids (NEFA), glucose, albumin, total protein, triglycerides, cholesterol, urea, aspartate aminotransferase (ASAT), gamma-glutamyltransferase (GGT) and glutamate dehydrogenase (GLDH) were analyzed in serum samples by using an automatic clinical chemistry analyzer (Eurolyser CCA180, Eurolab, Hallein, Austria). Serum haptoglobin was analyzed by ELISA as described earlier [44].
Differential blood counts were performed by an automatic system (Celltac α MEK-6450, Nihon Kohden Corporation, Tokyo, Japan) or quantified by manual counting using a Neubauer chamber and air-dried blood smears stained according to Pappenheim as described in Moritz [45] for the microscopic differentiation of leukocytes. For doing so, 200 cells were microscopically differentiated per slide (Carl Zeiss Microscopy GmbH, Jena, Germany) at a magnification of ×100. For hematocrit determination, heparinized capillaries with blood were centrifuged for 6–8 min using a micro-hematocrit centrifuge (Heamatokrit 210, Hettich GmbH & Co.KG, Tuttlingen, Germany) and the hematocrit was recorded.

2.4. Calculations and Statistics

Fat-corrected milk yield and energy balance were calculated according to Keese et al. [46] and condensed to weekly arithmetic means prior to statistical evaluation. Data were analyzed using PROC MIXED from the SAS software [47] with silage type (GS, MS), concentrate feed proportion (20 and 60% of DM), time and all possible interactions as fixed factors according to a complete 3 factorial design. Zero-samples were treated as covariates to account for possible initial differences not accountable for treatment effects.
The effects of frequent measurements on the same cow were considered by a REPEATED statement. Treatment effects were considered as significant at probabilities (p-values) ≤ 0.05 while a trend was assumed for p-values ranging between 0.05 and 0.1. Results are presented as least square means (LSmeans) and pooled standard errors of means (PSEM) together with the corresponding p-values for the fixed effects.
Results that were not normally distributed were evaluated by the non-parametric Mann–Whitney U test.
Furthermore, a principal component analysis (PCA) based on correlations was performed to examine the contributions of 47 recorded parameters to the case patterns using the software package Statistica 13.0 [48]. The same software package was used for the estimation of correlation coefficients between various variables, and for the evaluation of non-normally distributed variables by using the non-parametric Mann–Whitney U test.

3. Results

3.1. Feedstuff Characteristics

3.1.1. Nutrients

MS contained 59% less crude ash, 38% less crude protein and 19% less neutral detergent fiber compared to GS (Table 2). On the other hand, the concentration of nitrogen-free extractives (NfE), which are composed mainly of starch, sugars and soluble cell wall components, was approximately 43% higher in maize compared to GS. Crude protein was further analytically fractionated to enable the assessment of solubility. While non-protein nitrogen (NPN) fractions (A) and the fraction B1 were comparable for both silages, fraction B2 was approximately 6% lower in GS, while the less soluble fractions B3 and C were approximately 5% and 1.4% higher than in MS, respectively. As a result of differently directed changes in the fractions B1, B2, B3 and C, the true protein content was comparable for both silages. The higher absolute true protein content of GS resulted from its higher crude protein content.
Due to the different proportions of individual feedstuffs in the concentrate feed mixtures, the crude protein concentration of concentrate feed “A” was approximately 100 g/kg higher than in concentrate feed “B”.

3.1.2. Biogenic Amines and Gamma-Amino Butyric Acid

Out of the generally detectable biogenic amines, histamine and tryptamine concentrations were not detectable in either silage type (Table 2). In addition, cadaverine and putrescine were not detected in MS. Phenylethylamine and tyramine were present in both silage types whereby the concentration of the latter was slightly higher in MS. However, the concentrations of all detected biogenic amines and of gamma-aminobutyric acid (GABA) were approximately 34% and 46% higher in GS compared to MS. Compared to the silages, the concentrate feeds contained only trace amounts of biogenic amines and GABA, and in some cases they were entirely undetectable.

3.1.3. Microbiological Evaluation of Silages

Generally, the microbial assessment of both silages revealed quality levels of 1 (Table 3), indicating microbial infestation typical for GS and MS, with the exception of yeast levels of MS in May and June where the orientation values were exceeded resulting in germ count levels of 3 and 2, respectively. Taking the germ count levels of the remaining 6 germ count groups into account, overall microbial quality levels of 3 and 2 were assigned to these findings.

3.1.4. Fungal and Other Metabolites in Grass and Maize Silage

Out of the 76 detectable metabolites only 26 and 16 were quantifiable in MS and GS, respectively (Figure 1). From the 11 metabolites which were exclusively detected in MS, five belonged to Fusarium metabolites (equisetin, zearalenone, beauvericin, aurofusarin, nivalenol), two to Penicillium metabolites (marcfortine A, andrastin A), two to Trichoderma metabolites (alamethicin, harzianopyridine) and two to other fungal or unspecified metabolites (bassianolide, monocerin).
The remaining 15 metabolites detected in MS were also present in GS. Six of them can be assigned to Fusarium metabolites (enniatin B1, enniatin B, enniatin A, enniatin A1, deoxynivalenol, culmorin), one to Aspergillus metabolite (phenopyrrozin), 1 to pyrrolizidin alkaloid (lasiocarpin), one to Alternaria metabolite (tenuazonic acid) and six to unspecified metabolites (brevianamid F, emodin, rugulusovin, tryptophol, cyclo(l-Pro-l-Tyr), cyclo(l-Pro-l-Val)). Kojic acid as an Aspergillus metabolite was exclusively detected in GS.
The following fungal and other metabolites were lower than the LOD in both silages: nivalenol, ochratoxin A, monacolin K, verruculogen, gliotoxin, trypacidin, roquefortin, fumagillin, fumitremorgen, mycophenolic acid, cyclotyprostatin, festuclavin, fumitremorgin a and b, fumigatin, fumigaclavin A, B and C, fumiquinazolin A, B, C, D, F and G, PR-toxin, pseurotin A, pyripyropen A, sphingofungin A and D, synerazol, tryprostatin A and B, deoxynivalenol-3-glucoside, 15-acetyldeoxynivalenol, 3-acetyldeoxynivalenol, α-zearalenol, β-zearalenol, moniliformin, 15-hydroxyculmorin, 5-hydroxyculmorin, butenolid, chrysogin, antibiotic y, griseofulvin, dechlorogriseofulvin, quinolactacin A, fallacinol, flavoglaucin, secalonic acid D, alternariol, alternariolmethylether, infectopyron, destruxin A, destruxin B, asperglaucide, asperphenamate, citreorosein, endocrocin, n-benzoyl-phenylalanine and neoechinulin A.

3.2. Feeding Experiment

3.2.1. Dry Matter and Energy Intake

Dry matter intake (DMI) was markedly influenced by silage type, concentrate feed portion and time in an interactive manner (Table 4). Shortly after the start of feeding, the experimental groups that received the higher concentrate feed portions responded with an initial increase in DMI for up to two weeks to the level maintained for the rest of the experiment (pC × W = 0.002). While grass-60-fed cows even consumed more DM than cows of the maize-60 group, such a silage type-related effect was not observed at the lower concentrate feed portion (pS × C, pS × W < 0.001). The energy intake and the associated statistics closely mirrored the treatment relationships described for DMI.

3.2.2. Milk Yield and Composition

The milk yield was increased by higher concentrate feed portions without a modifying effect from the silage type (pC, pW < 0.001) (Table 5). The time effect resulted from a continuous decrease in the progression of the experiment which was observed in all treatment groups. Milk fat percentage in the maize-60 group was characterized by an initial immediate drop down to approximately 2% reached in week 4 of the experiment, maintained at this level for the rest of the treatment period (pS × W = 0.014, pS × C < 0.001). Such marked time-related effects were not observed in the other treatment groups, which separated from each other shortly after the beginning of the study giving rise to interactions between silage type and concentrate feed proportion as well as silage type and experiment week.
Fat-corrected milk (FCM) yield was highest for the grass-60 group while MS-fed cows in particular showed an approximately 25% reduced FCM. Even the grass-20 group yielded more FCM than both MS-fed groups, resulting in interactions between silage type and concentrate feed portion (pS × C < 0.001).
The fat to protein ratio dropped markedly below 1 in the maize-60 group while at the lower concentrate feed portion the mean ratio was nearly doubled in the maize-20 group. For GS-fed cows a higher ratio was calculated in general whereby the concentrate feed effects still remained. These treatment effects explained the corresponding interactions between silage type and concentrate feed portion while the interaction between time and concentrate feed portion resulted from the continuous decrease in the maize-60 group compared to the more or less stable course in the other groups (pS × W = 0.002, pS × C < 0.001). Somatic cell count (SCC) generally increased with time (pW < 0.001) whereby the feeding of GSs decreased SCC compared to their MS-fed counterparts (pS < 0.001). This effect occurred at a lower level when higher concentrate feed proportions were fed, irrespective of silage type (pC < 0.001).
Based on the treatment differences in milk yield and milk fat percentage, the total milk fat yield was significantly increased in cows fed with grass-60 compared to their low concentrate-supplied counterparts, while the opposite was observed in MS-fed cow groups (pS × C < 0.001). Milk protein content was higher in GS-fed cows (pC < 0.001) and was additionally enhanced due to feeding the higher concentrate feed portions (pC < 0.001). The time effect resulted from a slight and continuous increase in the course of the experiment (pW = 0.002). Treatment-related differences in milk yield and milk protein percentage resulted in a time-dependent decrease of total milk protein secretion which appeared to be more pronounced in groups fed the low concentrate feed portion resulting in the interaction between time and concentrate feed portion (pC × W = 0.001). Moreover, while no differences were observed between GS- and MS-fed cows at the lower concentrate feed portion, milk protein secretion was lower in MS-fed cows in combination with the high concentrate feed portion giving rise to interactions between silage type and concentrate feed portion (pS × C = 0.008).
Milk urea concentration was more than twofold higher in GS-fed cows whereby the lower concentrate feed portion increased milk urea even further. This concentrate feed portion effect was less pronounced in MS-fed cows at a markedly lower level. The described treatment effects were characterized by an initial decrease in maize-fed cows whereas an increase in urea concentration was observed in GS-fed cows and explained the significance of the diverse interaction effects (pS × C, pS × W, pC × W < 0.001).

3.2.3. Body Weight and Body Condition Score

The feeding of GS-based rations resulted in significantly higher body weights (BW) compared to their MS-fed counterparts (pS = 0.004). A higher concentrate feed proportion significantly increased BW irrespective of silage type (pC < 0.001) (Table 4). Body condition score (BCS) did not mirror the treatment effects observed for BW. In particular, only cows fed the grass-60 ration had an increase in BCS compared to the other treatment groups, resulting in interactions between silage type and concentrate feed portion (pS × C = 0.001).

3.2.4. Energy Balance and Ruminal Nitrogen Balance

The overall energy balance was negative in the grass-20 group and differed from the maize-20 group, where it was slightly positive, and from the groups fed the high concentrate feed portions (Table 4). Although the overall energy balance was higher in the maize-60 group compared to the grass-60 group, it was noticed that a time-dependent adaptation process occurred which was characterized by an initially more pronounced increase in energy balance at the beginning and a later slight decrease to the lower level of the grass-60 group (pS × C = 0.099, pS × W, pC × W < 0.001).
Ruminal nitrogen balance (RNB) related to metabolizable energy (ME) was generally positive in the GS-fed groups and negative in their MS-fed counterparts (Table 4). Feeding of the grass-20 ration caused a greater RNB compared to grass-60 while the opposite was observed for the maize-based diets. Here, the difference between maize-60 and maize-20 was much larger compared to the GS-fed groups. The maize-20 group responded with an immediate drop in RNB, while only a slight time-dependent decrease in RNB was observed for the maize-60 group. All these changes caused a three-way interaction (pS × C × W < 0.001).

3.2.5. Ruminal Fluid and Fecal Characteristics

The rumen pH of the maize-60 group was characterized by a continuous decline down to nearly 6.0 while the pH of rumen fluid of the other three groups remained at an almost constant level until the end of the experiment explaining the interactions between time and concentrate feed portion (pC × W = 0.001) and between silage type and concentrate feed supply (pS × C = 0.001) (Table 6). The total SCFA concentration in rumen fluid declined continuously over time except for the maize-60 group where an increase until the end of the experiment was noticed after an initial drop in week 3 common to the other groups (pS × C × W = 0.006). The molar proportions of acetate and propionate were lowest and highest for the maize-60 group, respectively, whereby a decrease in acetate and an increase in propionate gave rise to the corresponding interactions between silage type, concentrate feed proportion and time (acetate: pS × C × W = 0.067; propionate: pS × C × W = 0.011). The resulting C2:C3 ratio showed a decrease due to feeding the higher concentrate feed portions although this effect was more pronounced and occurred at a lower level in MS-fed cows (pS × C = 0.024) (Figure 2). The ratio dropped by approximately 50% in the maize-60 group in the course of the experiment, while constant levels or slight increases were found for the other groups (pS × W < 0.001; pC × W = 0.001). The butyrate content in rumen fluid decreased markedly over time in the maize-60 group while an increase was noticed for the other groups although this increase was even more pronounced in the maize-20 group (pS × C < 0.001; pS × W = 0.025). Low concentrate feed portions were associated with low portions of valerate in rumen fluid irrespective of silage type while a higher concentrate feed supply of 60% stimulated a pronounced increase in the maize-60 group and the valerate portion in the grass-60 group remained constant over time explaining the various interactions (pS × C = 0.021, pS × W = 0.005, pC × W = 0.013). The ruminal iso-valerate portion varied slightly at a generally low level and was not influenced by the treatments.
The concentration of free LPS in rumen fluid was higher in the MS-fed groups and decreased over time, but was more pronounced in the GS-fed groups (pS × W = 0.004) (Figure 2).
Ruminal ammonia concentration was higher in cows fed the GS-based rations whereby the higher concentrate feed portion reduced the ammonia concentration (Figure 2). In MS-fed cows, such a concentrate feed effect was not observed. In addition to these treatment effects, the ammonia concentration remained nearly constant at a low level in MS-fed cows over time while an increase was noticed in GS-fed groups (pS × C × W < 0.001).
Fecal pH values (Table 6) started to increase immediately after feeding the GS-based rations while a decrease was noticed in MS-fed groups (pS × W = 0.003). Higher concentrate feed portions decreased the pH values in the GS-fed groups to a higher degree compared to their MS-fed counterparts (pS × C < 0.001), whereby the concentrate effect became more obvious in later stages of the experiment (pC × W < 0.001). There was a moderate linear relationship between the rumen and fecal pH values suggesting a mean decrease in the fecal pH value of 0.35 with each decrease of the ruminal pH value by 1.0 (Figure 3).
Starting from 131 g/kg, the DM content of feces (Table 6) declined in the GS-fed groups to a mean level of 115 g/kg in the period from weeks 3 to 12 of the experiment, while in the MS-fed groups an increase was noticed at the same time to a stable level of approximately 144 g/kg (pS × W < 0.001) (Figure 3).

3.2.6. Escherichia coli Colony-Forming Units in Rectal Fecal Samples

The total number of colony-forming units (CFU) of E. coli in rectal feces was higher in MS-fed groups and increased differently for the two silage types during the observation period from weeks 9 to 12 of the experiment (pS × W < 0.001) (Figure 4, Table 7). The concentrate feed portion did not consistently influence E. coli shedding in the course of the experiment (pC × W = 0.048). After the termination of the dietary treatments, the E. coli concentrations were comparable for all four treatment groups at the end of the three-week post-treatment period when all groups were fed the same ration type. The proportion of stx-positive E. coli was generally characterized by large variation ranging from 0 to 60% of the total E. coli CFU counts. Treatment effects were observed in weeks 10 and 12; MS-fed groups showed increased proportions of stx-positive E. coli whereby the effect of the concentrate feed proportion was not consistent. In general, low portions of less than 10% of stx-positive E. coli were detected in all experimental groups after the post-treatment period.

3.2.7. BoNT Genes in Rectal Feces

The BoNT genes A, B, C, D, E and F remained undetectable in any of the fecal samples.

3.2.8. Clinical-Chemical Blood Traits

Blood glucose concentration decreased over time although this effect was more pronounced in the GS-fed groups at a generally lower level compared to their MS-fed counterparts (pS × W = 0.013) (Table 8, Figure 2). BHB concentrations in blood were higher in GS-fed groups compared with their MS-fed counterparts and were additionally decreased at the higher concentrate feed supply. Moreover, the lower concentrate feed supply increased the BHB levels over time whereas relatively stable levels were observed at the higher concentrate feed portion (pC × W = 0.001). NEFA concentration in blood increased slightly over time (pW = 0.011) but was not modified by the other treatments. The cholesterol concentration was higher in the maize-60 group compared to all other groups, which showed similar cholesterol concentrations (pS × C = 0.023). Higher concentrate supply decreased blood triglyceride levels. This effect occurred at a higher level in the GS-fed groups, additionally showing a time-related increase which was not observable in the maize-fed groups (pS × W = 0.004) (Table 8, Figure 2). Both the total protein and albumin blood concentrations varied inconsistently but significantly over time with a peak concentration at week 3, and higher total protein but lower albumin levels at the end of the experiment. ASAT, GGT and GLDH were all higher when rations with the high concentrate feed portions were fed. Moreover, this concentrate feed effect was more pronounced in the GS-fed groups in the cases of ASAT (pS × C = 0.008) and GGT (pS × C = 0.044) which additionally decreased as the experiment progressed. Blood urea concentrations were generally higher in the GS-fed groups whereby interactions between silage type and concentrate feed proportion and silage type and time modified this general statement (Figure 2, Table 8). The initial peak in blood urea concentration was more pronounced in the GS- than in the MS-fed groups and was nearly absent in the maize-20 group.
Non-parametric evaluation of the haptoglobin concentration in blood revealed that blood levels were not influenced by time but by dietary treatments (Figure 5). The haptoglobin concentration in blood of the grass-20 group was lower compared to the maize-20 group while all other comparisons failed to reach significance. Haptoglobin concentrations did not correlate with ruminal LPS concentration (r = 0.06, p > 0.05) but were moderately positively correlated to total granulocyte counts whereby a dependency on dietary treatment was not obvious (Figure 5).

3.2.9. Hematology

Feeding the high concentrate feed portion resulted in a higher concentration of white blood cells in the grass-60 group compared to the grass-20 group, while in the MS-fed groups no effect of the concentrate feed supply was detected (pS × C = 0.007) (Table 9). The total lymphocyte count in the grass-60 group was higher compared to the other groups and increased markedly in week 12 of the experiment resulting in time, concentrate feed proportion and interaction effects (pS × C = 0.039). Total granulocyte concentration was elevated in cows of the grass-60 group compared to the grass-20 group while no concentrate feed proportion effect was noticed in the MS-fed groups (pS × C = 0.027). Monocyte counts generally decreased over time without being influenced by other treatment factors. Eosinophil counts were not influenced by either treatment. Hematocrit was significantly higher in groups supplied with more concentrate feed and decreased over time whereby this decrease occurred at a later stage of the experiment when high concentrate feed-containing rations were fed.

3.2.10. Mycotoxin Residues in Blood and Milk

De-DON was detectable in the blood of all treatment groups while ZEN, α-ZEL, β-ZEL, ZAN, α-ZAL and β-ZAL contents were lower than the LOD. DON was detected in only five out of 121 total analyzed blood samples which belonged exclusively to the maize-60 group (2.35–4.11 ng/mL). Hence, only de-DON levels in blood were further evaluated statistically. Here, each main and interaction effect was significant, suggesting that the de-DON levels in blood changed over time differently depending on silage type and concentrate feed portion. Starting from similar levels before the experimental diets were introduced, the de-DON concentrations declined in the grass-20 group at a more pronounced rate than in the grass-60 and maize-60 groups. In contrast, de-DON levels slightly increased in the maize-20 group (pS × C × W = 0.002) (Table 7, Figure 6). Plotting the individual DON exposures against the de-DON concentrations in blood revealed weak but significant linear relationships which depended on concentrate feed portion irrespective of silage type. Thus, linear regressions were performed separately for data pairs belonging to the grass-20 and maize-20 groups, and the grass-60 and maize-60 groups, respectively. Results showed that de-DON concentrations in blood increased more steeply in groups fed rations with the low concentrate feed proportions compared to their counterparts fed the rations with the higher concentrate feed proportions (Figure 6).
In milk, only DON, de-DON and ZEN were detectable while α-ZEL, β-ZEL, ZAN, α-ZAL and β-ZAL concentrations were lower than the indicated LOD. DON was exclusively detected in the MS-fed groups with only two and four out of 14 samples being positive in the maize-20 and maize-60 groups, respectively. De-DON was only detected in one sample from the maize-20 group. For ZEN, 67%, 14%, 57% and 64% of the milk samples tested positive in groups grass-20, grass-60, maize-20 and maize-60, respectively, with concentrations ranging between LOD and limit of quantification (LOQ). Non-parametric statistical evaluation of the residue concentrations in milk revealed that the DON concentration was increased in the maize-60 group compared to both GS-fed groups while the ZEN concentration in the grass-60 group was lower compared to the other three treatment groups. Carry-over rates (COR, Figure 6) were calculated on the basis of the reported toxin residue concentrations in milk, milk yield and toxin exposures in week 12 of the experiment. The mean DON/ZEN exposures in week 12 amounted to 1.7/0.9, 5.0/2.3, 11.4/0.9 and 9.6/2.0 µ/kg BW/d for groups grass-20, grass-60, maize-20 and maize-60, respectively. CORs correlated more strongly with toxin residue concentration in milk (DON: r = 0.981; ZEN: r = 0.923, Figure 6) than with the corresponding exposures (DON: r = 0.223; ZEN: r = −0.430). Thus, the significance relationships for CORs amongst the treatment groups were similar to those reported for toxin residue concentrations in milk (Figure 6).

3.2.11. Principal Component Analysis (PCA)

Further attempts were made to examine the associations between the various parameters previously evaluated individually in order to develop a more comprehensive insight into the overall effects of the treatments on individual animals. For this purpose, a principal component analysis (PCA) based on correlations was employed. The results showed that the first two components (PC 1 and PC 2) extracted approximately 43% of the total variance.
The scree plot as a visualization of the sequentially extracted components and their respective eigenvalues suggested a break point after the extraction of four principal components corresponding to 59% of the total variance. This break point is accepted to indicate the transition from the most important components to those not contributing significantly to the total variance. The eigenvalue of 1.0 as the mean value of all 47 eigenvalues corresponded to a total of 12 principal components which described approximately 89% of the total variance.
Loadings of all 47 variables on PC 1, i.e., the contribution of variables, suggested that the fat to protein ratio in milk, milk fat content, ruminal molar proportion of acetate, milk urea content, acetate to propionate ratio in rumen fluid and ruminal molar proportion of propionate were highly correlated to PC 1 (r < −0.8 and r > 0.8, respectively) (Figure 7). Variables with moderate loadings on PC 1 which correlated negatively (r < −0.6 and ≥ −0.8) were fecal pH, BHB concentration in blood, ADFOM intake, pH values in rumen chyme, molar ruminal butyrate proportion and aNDFOM intake, while those with positive correlations (r > 0.8 and r ≤ 0.8, respectively) were the DM of feces, NEL (net energy lactation) balance and molar ruminal valerate proportion.
Plotting the cases, i.e., individual cows, into the space spanned between PC 1 and PC 2 resulted in distinct clusters for each treatment (Figure 7). The effects of silage type and concentrate feed proportion on PC 1 and PC 2 were proven to be significant (pS and pC < 0.001, pS × C = 0.007) according to a multivariate evaluation suggesting that PCA significantly assigned cows to treatments (silage type and concentrate feed proportion). The more distant cluster of the maize-60 group compared to the other groups might explain the significant interaction effect.

4. Discussion

The feeding value of a feedstuff is generally determined by its energy and nutrient content but also by the presence of substances potentially capable of compromising the health and performance of animals. Feedstuffs with different energy and nutrient concentrations are combined to form a daily ration which meets the energy and nutrient requirements of the animal. Thus, deficits of individual feedstuffs are balanced in diet formulation. Maize silage (MS) is characterized by a higher energy concentration while grass silage (GS) contains more crude protein, making both silages complementary in the formulation of dairy cow rations. While these aspects are commonly considered in practical dairy feeding, less attention is paid to the possible feed and food hygienic consequences of feeding these distinctly different silage types. These consequences result from the presence of silage-specific contaminants, such as mycotoxins, biogenic amines and Clostridia. Besides, varying physico-chemical properties need to be considered, such as starch resistance and protein solubility, giving rise to gastro-intestinal conditions favorable to the forced fecal shedding of harmful micro-organisms potentially contaminating milk and beef, such as Shiga toxin (stx)-forming E. coli.

4.1. Microbiological Evaluation of Silages and Contamination by Fungal and Other Metabolites

Contrary to feedstuffs stored under dry air conditions (moisture content ≤14%) such as cereal grains, silage is a high-moisture forage preserved by fermentation [49]. While mycotoxin formation in stored feedstuffs is usually terminated or drastically reduced when the moisture content is ≤14%, it might continue under ensiling conditions whereby the pattern of mycotoxins differs from those “harvested” from the field due to different molds colonizing the ensiled crops [49,50]. Penicillium, Fusarium, Aspergillus, Mucor, Byssochlamys, Absidia, Arthrinium, Geotrichum, Monascus, Scopulariopsis, and Trichoderma belong to the most frequently detected fungal genera while species of Fusarium, Alternaria, Cladosporium, Claviceps, and endophytic fungi are predominantly isolated prior to storage and ensiling [49].
In the present study the silages were characterized microbiologically by an evaluation schema proposed by the Association of German Agricultural Analytic and Research Institutes (VDLUFA), which enables the condensation of the microbial condition of feedstuffs to a single quality class. Both product-specific and spoilage-indicating germs were in the range typically observed for MS and GS. The higher yeast content observed in MS might be due to higher temperatures in May and June in combination with the higher starch and sugar content of MS in comparison to GS. These higher yeast contents confirm the expectations that MS is at higher risk for yeast proliferation which is also reflected by the generally higher orientation value for this germ group. However, as the DMI of the cows fed MS-based diets was not compromised, an intake-depressing effect due to higher yeast contamination cannot be stated. Except for yeasts in MS, all other fungus-related germ groups were in the range normally observed for MS and GS. This might explain the non-detectability and the low levels of detectable mycotoxins typically formed in spoiled silage. Thus, common silage-born Aspergillus toxins such as gliotoxin, fumitremorgins and fumigaclavines, Penicillium toxins such as roquefortins and mycophenolic acid or Monascus toxins such as monacolins remained undetectable in both silage types. This situation also agrees with the observation that MS and GS samples which were visibly molded also contained higher levels of roquefortins, monacolins, mycophenolic acid and further mycotoxins compared to normal-appearing silage samples characterized by a lower incidence of fungus infection and mycotoxin contamination [2,51,52].
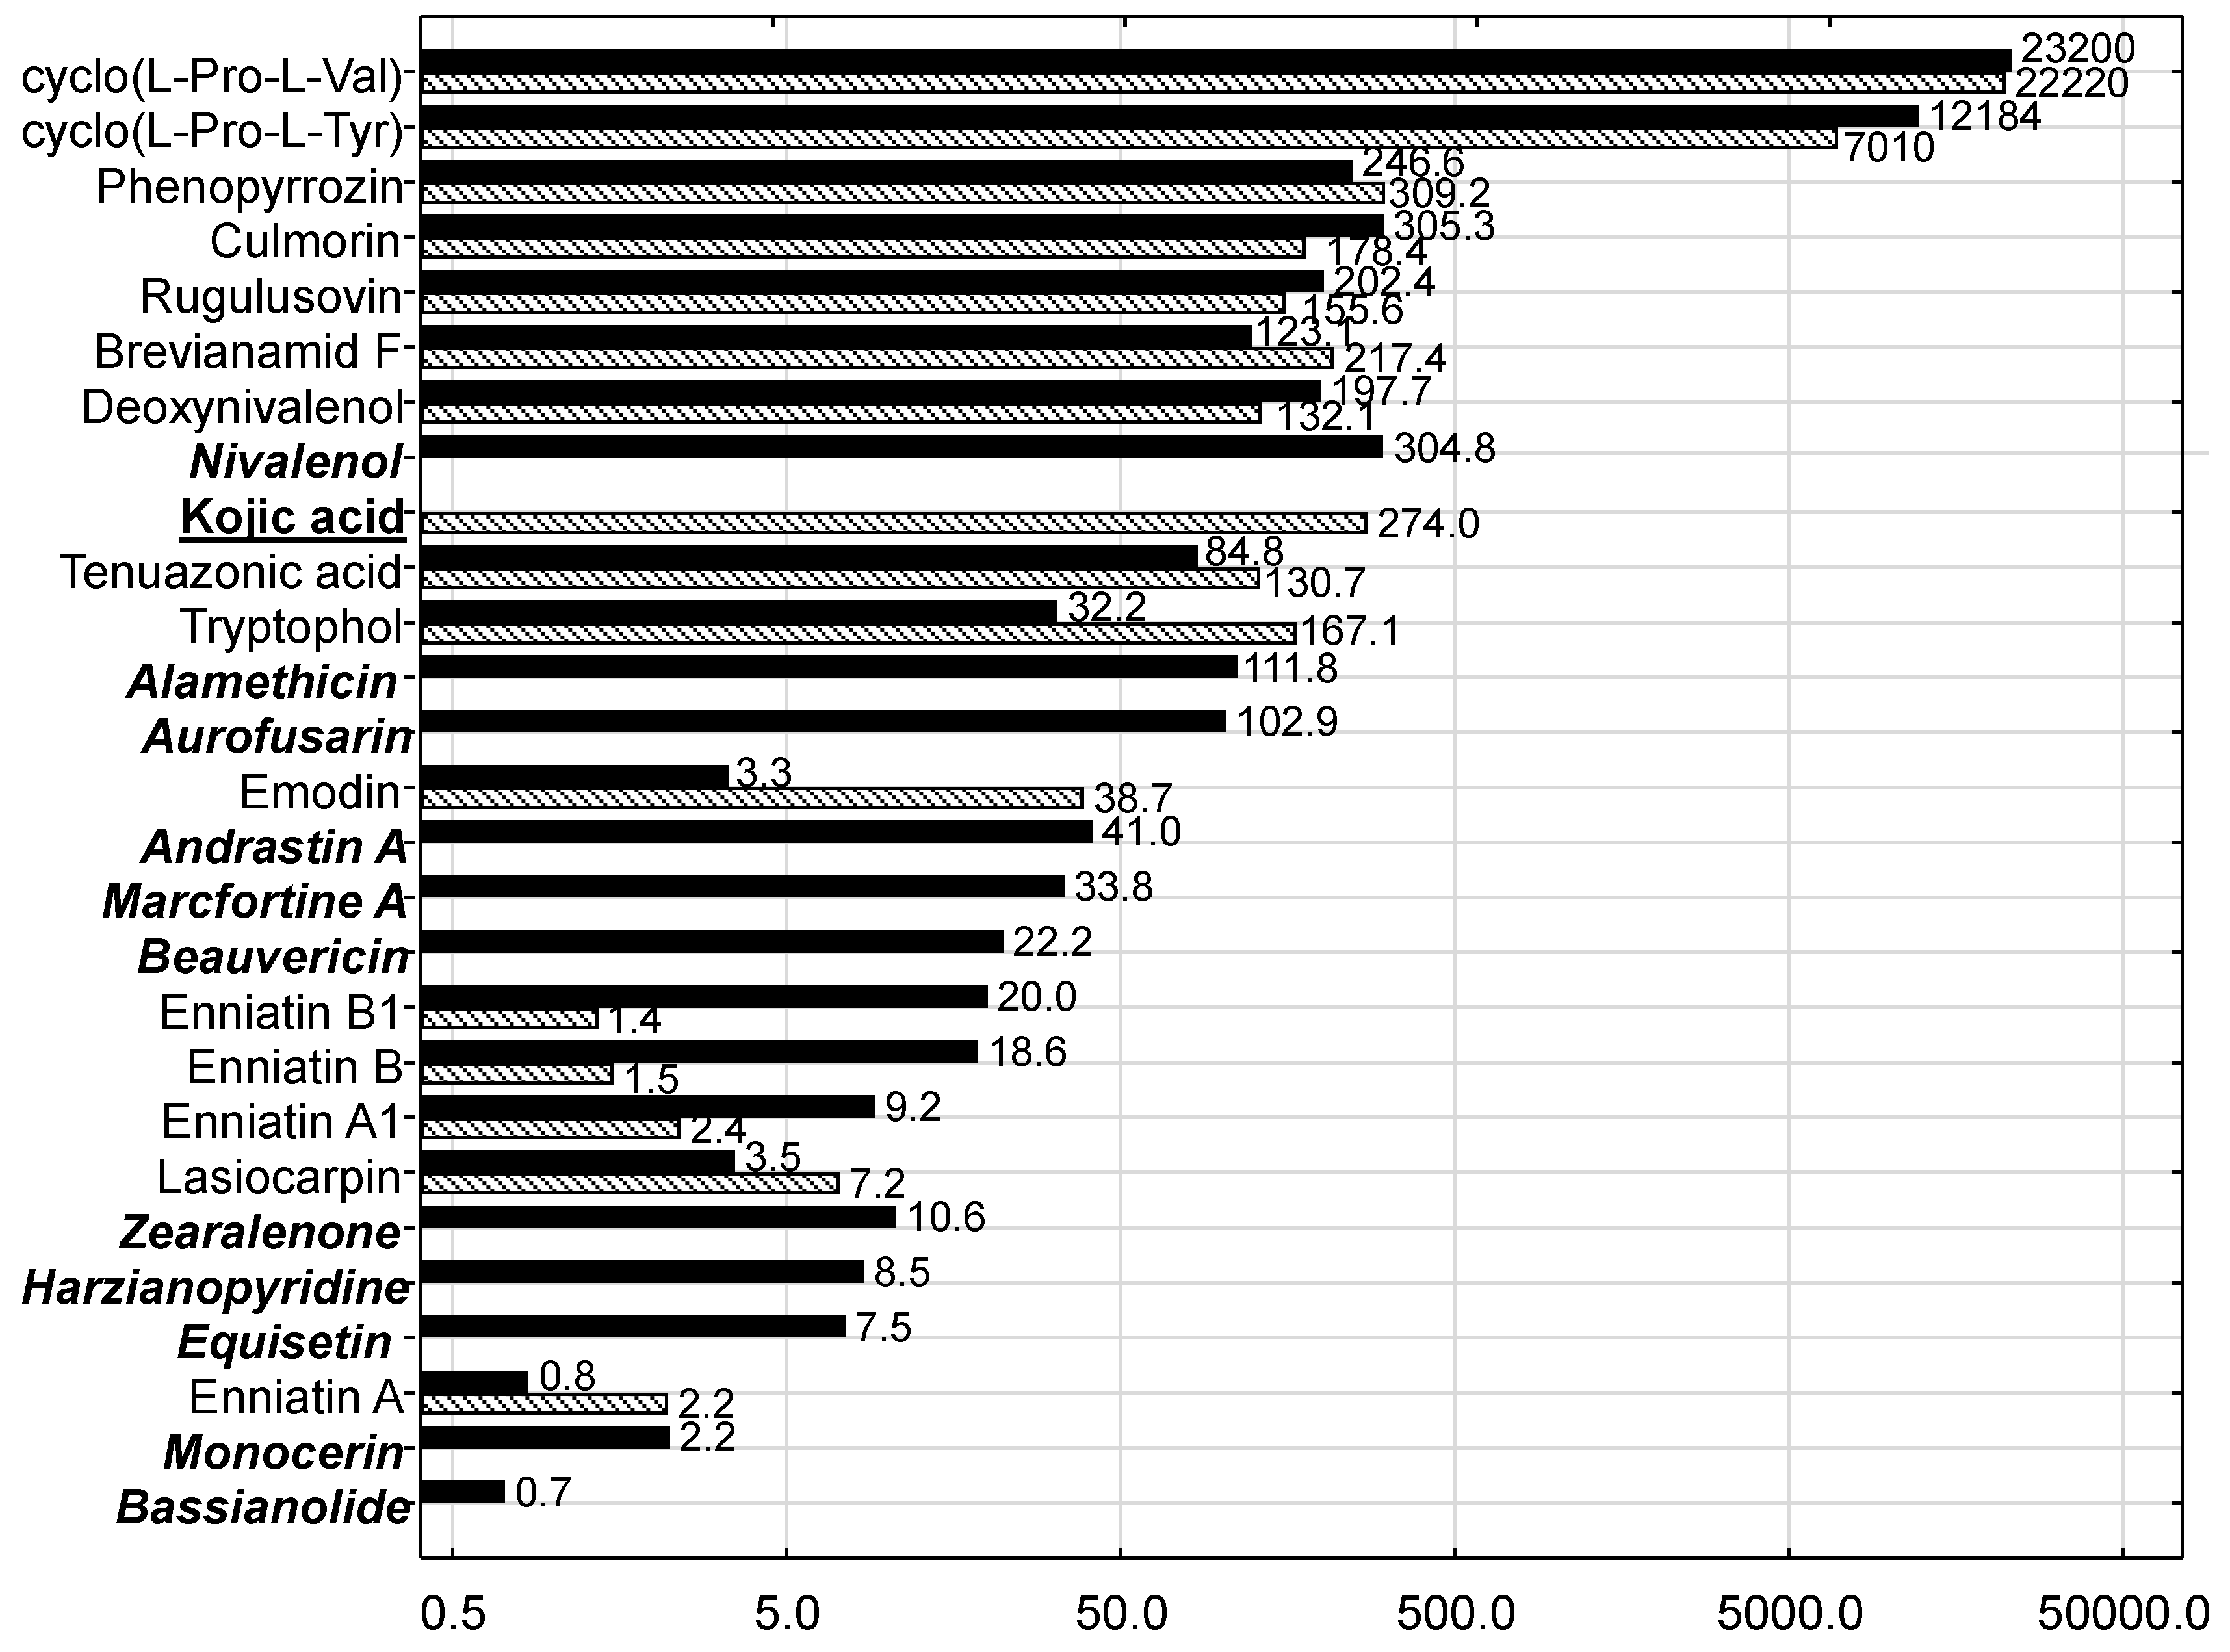
However, the signature of mycotoxins and other fungal metabolites was clearly different between MS and GS and points to different fungal infection patterns and timings of infection. The most prominent difference was attributable to Fusarium toxins in that MS was contaminated with more of these toxins compared to GS and in most cases at higher concentrations. These results suggest that the differences in mycotoxin patterns between MS and GS were due to pre-harvest contamination while post-harvest mycotoxin formation was of lower importance owing to good silaging conditions not favoring mold growth and consequently mycotoxin formation.
As well as DON, the Fusarium toxin nivalenol also belongs to the group of trichothecene toxins and therefore shares some of the toxicological features of DON, such as immuno-toxicity. Lower and upper bound mean and maximum concentrations of 80, 174 and 1022 µg/kg fresh weight have been reported [53] for MS. Recalculating the nivalenol concentration measured for MS to the same reference basis revealed a concentration of approximately 127 µg/kg fresh weight suggesting that the MS used in the present experiment was contaminated by nivalenol at background level. As no studies on the toxic effects of nivalenol on ruminants have been identified [53], an interactive effect with DON cannot be excluded although ruminal de-epoxidation similar to DON might be assumed.
Beauvericin and enniatins are characterized by a low acute toxicity; no studies have been reported examining adverse effects of these mycotoxins on ruminants and European Food Safety Authority (EFSA) precluded an evaluation of the health risk from chronic exposure to beauvericin and enniatins [54]. The mechanisms by which these compounds exert their cytotoxic effects appears to be related to their ionophoric activity that increases ion permeability in biological membranes [55]. The in vitro proliferation of bovine granulosa cells was shown to be inhibited at 3 µM [56]. As well as beauvericin and enniatins, bassianolides are cyclooligomer depsipeptides; the latter was shown to be produced by the fungus Beauveria bassiana which also forms beauvericin. Bassianolides exert insecticidial activity [57,58]. The in vivo relevance of bassianolides with regard to effects on ruminal microbiota, ruminal metabolism and systemic effects needs to be elucidated.
Equisetin was isolated from Fusarium equiseti and was described as one of the most potent Fusarium metabolites exerting antibiotic properties, particularly against some Gram-positive bacteria including mycobacteria and some Staphylococcus aureus strains [59]. The relevance for the ruminant is unclear so far, although equisetin has been isolated in large amounts from cottonseed cake contaminated by multiple mycotoxins and associated with cattle mortality and feed refusal [60].
Culmorin is considered as an “emerging mycotoxin”; it often co-occurs with DON [61] which was also confirmed in the present experiment where its concentration was slightly higher than that of DON in both silage types, although in MS at a higher level than in GS. Comparative toxicity studies with pigs revealed that culmorin alone did not affect pigs [62]. When combined with DON, the adverse effects were dominated by DON without any hint of interactive effects, thus supporting the notion of low toxicity of culmorin for pigs under the test conditions [62]. Nothing is known about the effects of culmorin on cattle.
The toxic effects of aurofusarin have not yet been investigated for cattle, but for quails it adversely affects the antioxidative system, including that of the developing embryo [63,64].
The cyclic dipeptides cyclo(l-pro-l-tyr) and cyclo(l-pro-l-val) were the most prominent metabolites out of the 26 and 16 metabolites quantified in MS and GS, respectively, and accounted for approximately 95% in both silage types. Cyclic dipeptides are referred as to diketopiperazines (DKPs) and are formed by a broad spectrum of organisms including not only bacteria, fungi and porifera but also mammals. As a large substance group they are described to exert antibacterial, antifungal, antiviral, phytotoxic and cytotoxic effects. Amongst others, they are degraded compound-specifically by microbial and mammalian enzymes [65,66]. To the authors’ knowledge no information is available about the outcome, particularly on the ruminal metabolism, and the effects in cattle. As well as cyclo(l-pro-l-tyr) and cyclo(l-pro-l-val), a further DKP, cyclo-(l-Trp-l-Pro), also known as brevianamide F, was detected in both silages but at comparatively low concentrations.
In the present experiment, andrastin A and marcfortine A as Penicillium metabolites were exclusively detected in MS. Their toxicological relevance for higher animals has not yet been examined [2,67]. Regarding their mode of action, andrastins were shown to act as protein farnesyltransferase inhibitors [68,69], a feature making them interesting for anticancer and antimalarial therapy [70,71] and supporting their biological activity. Cytotoxicity testing revealed that the 50% inhibitory concentration (IC50) of andrastin A was not determinable in Caco-2 cells and therefore exceeded the maximum tested concentration of 50 µg/mL [72]. Marcfortines belong to oxindole alkaloids and as nicotinic cholinergic antagonists they exert anthelmintic activities; they are also active at mammalian receptors in vitro [73]. The relevance of these biological features for cattle remains to be clarified.
Only 2 Aspergillus toxins were quantifiable in the present study. While phenopyrrozin was detectable both in MS and GS, kojic acid, which is also formed by other fungus genera, was solely found in GS. Phenopyrrozin was described as a radical scavenger and its IC50 against lipid peroxidation induced by Cr2K2O7 amounted to 73 µg/mL. The significance of this effect for ruminants needs to be examined.
Kojic acid is used in cosmetic products for skin whitening or depigmenting [74]. Owing to its use in cosmetics, the toxicological properties of kojic acid are better characterized than those of phenopyrrozin. The no-observed-adverse-effect level (NOAEL) of 6 mg kojic acid/kg BW/day is based on histopathological findings and altered iodine uptake after oral administration in rats [74]. Assuming a DM intake of 20 kg/cow/d, a BW of 600 kg and a (maximum) GS proportion of 80% of the TMR, the daily exposure of this cow would amount to approximately 0.008 mg/kg BW/d based on the measured kojic acid concentration of 274 µg/kg GS. The comparison of this exposure with the mentioned NOAEL suggests that the kojic acid level measured in GS was probably toxicologically not relevant.
Tryptophol and emodin were detectable in native grass [75] and were also present in both silage types in the present study. Emodin, which is produced both by fungi and by plants, exerts immunosuppressive, anticancer, anti-inflammatory, anti-atherosclerotic and vasorelaxant effects, but hepatotoxicity, kidney toxicity and reproductive toxicity have also been reported particularly under chronical exposure scenarios [76]. Tryptophol (3-indole-ethanol) is found in many microorganisms and plants and is also a secondary metabolite produced by Candida albicans. It possesses a quorum-sensing ability and is cytotoxic, cytostatic, and genotoxic in lymphocytes [77]. The relevance of the presence of emodin and tryptophol in feed for cattle remains to be clarified.
The fungus Exserohilum turcicum, causing the northern corn leaf blight, has been described as a producer of monocerin which exerts phytotoxic effects [78]. Interestingly, this metabolite was exclusively detected in MS in the present study. As well as E. turcicum, Alternaria spp. are known as monocerin producers [79]. Monocerin effectively inhibited Plasmodium falciparum with an IC50 of 0.68 µM, but was not cytotoxic against various tumor cell lines [80]. In contrast to monocerin, the Alternaria toxin tenuazonic acid was quantified both in MS and GS suggesting that another fungus species was responsible. The viability of Caco-2 cells was significantly reduced after exposure to Alternaria tenuissima extracts containing several Alternaria toxins besides tenuaconic acid as a dominant toxin [72].
The Trichoderma metabolites alamethicin and harzianopyridine were exclusively detected in MS. T. harzianum was described to synthesize harzianopyridine, a non-volatile antibiotic which has been demonstrated to inhibit a number of pathogens [81]. Moreover, a crude methanolic extract from T. harzianum was shown to depress the motility of boar sperm and cause plasma membrane lesions [82]. Alamethicin produced by T. viride was shown to inhibit DNA synthesis and the mitogen stimulation of bovine lymphocytes isolated from lymph nodes at 2 and 1 µM, respectively. These effects were ascribed to the pore-forming properties of this antibiotic. Whether this substance affects ruminal microbiota or if it is metabolized by rumen microbiota itself before being absorbed and potentially influences lymphocytes is not known to the authors’ knowledge.
Compared to all the other mycotoxins and metabolites detected in the silages, only for DON and ZEN were sufficient data available for a risk evaluation for cattle by EFSA. Based on this EFSA evaluation the European Commission established guidance values for critical DON and ZEN concentrations in feed. For ruminating cattle 5 mg DON and 0.5 mg ZEN must not be exceeded per kg of the daily ration at a reference DM content of 88% in order to protect the animals from the adverse effects of these toxins [
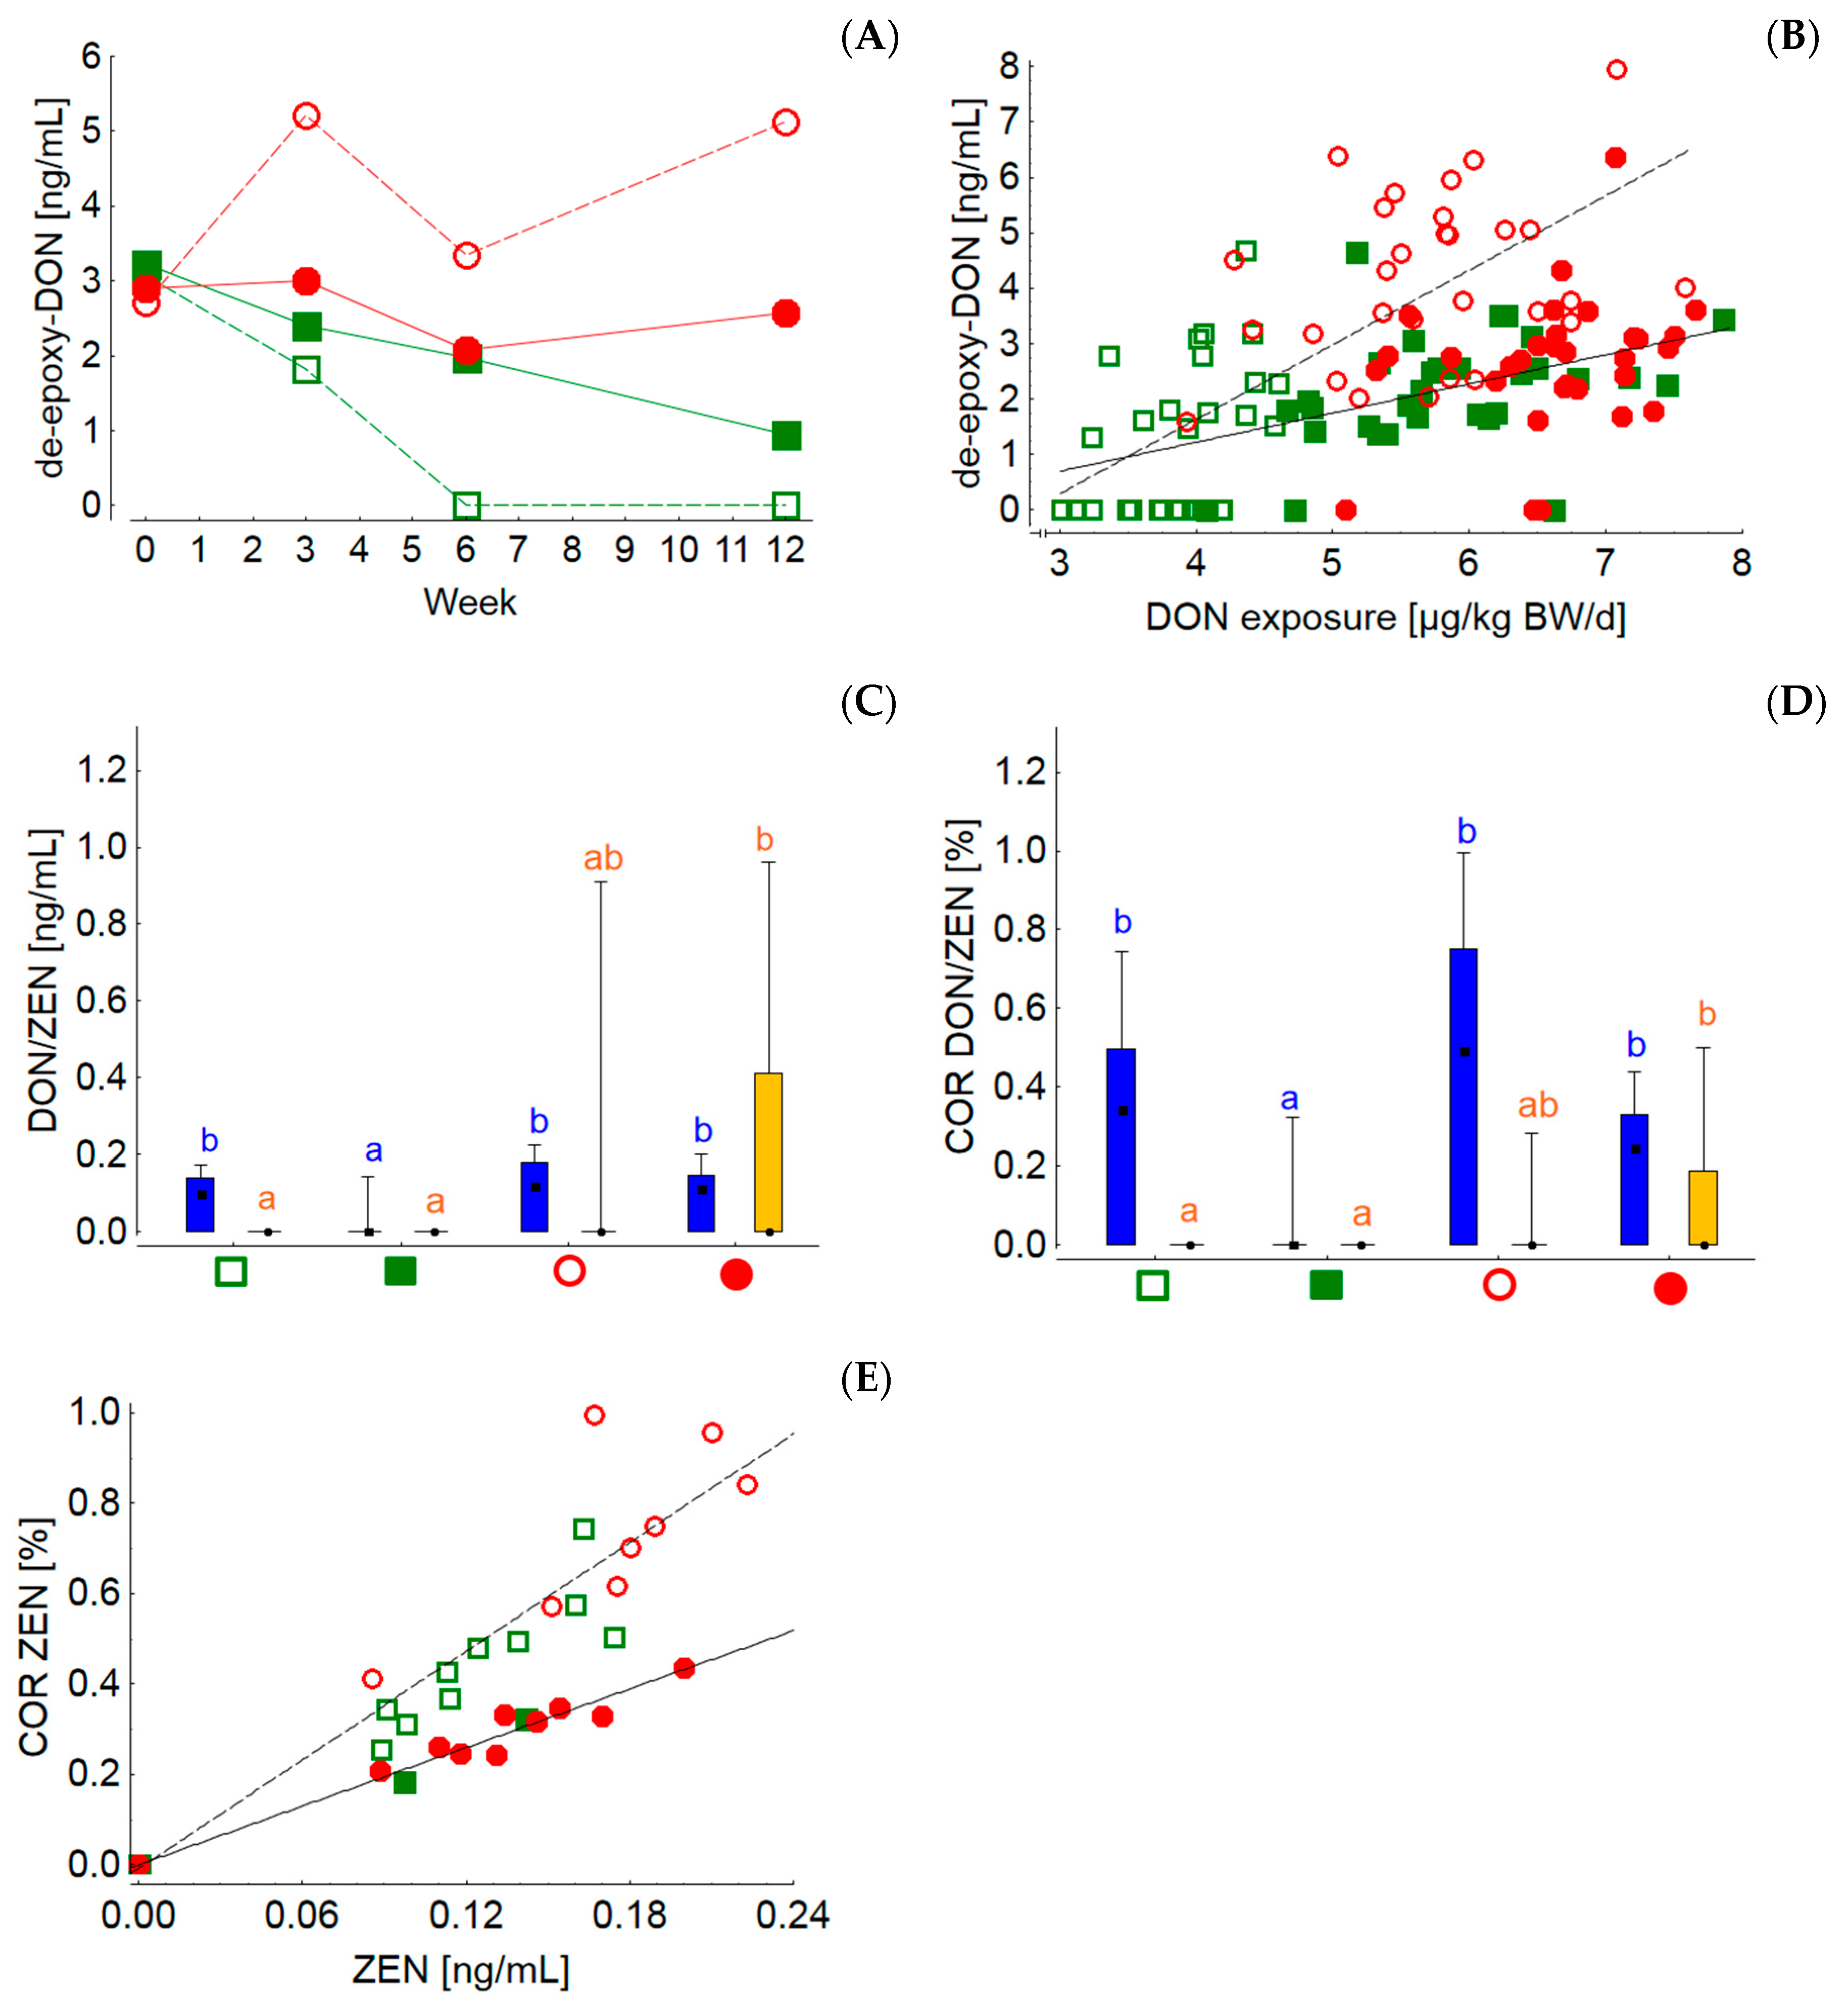
83]. Based on the analyzed mycotoxin concentrations of silages and concentrate feeds and their proportions in the whole ration, the DON/ZEN concentrations of the rations grass-20, grass-60, maize-20 and maize-60 amounted to 144/1, 160/4, 196/10 and 187/8 µg/kg at 88% DM, respectively. Compared to the guidance values these contamination levels can be regarded as a low background contamination. Nevertheless, the concentrations of both toxins were higher both in MS and in the resulting MS-containing rations. Even at these low dietary DON concentrations, the differences between both silages could be followed in blood where the time-dependent group LSmeans of the de-DON concentrations clearly mirrored the differences in dietary DON concentration. Interestingly, when de-DON concentrations were plotted against individual DON exposures it became obvious that at similar DON exposures the de-DON levels in blood were higher when cows were fed rations with lower concentrate feed proportions (grass-20 and maize-20). These results indicate differences in the bioavailability of DON originating from either silages or concentrate feed. Although much higher DON exposures between approximately 90 and 200 µg/kg BW/d yielded no differences in the serum de-DON levels between cows fed rations with low or high concentrate feed portions, it also appeared that cows fed the diet with the lower concentrate feed portion transferred DON more efficiently to blood as de-DON [84]. The observed differences in DON availability measured as de-DON concentrations in blood might be due to differences in the rumino-intestinal efficiency of liberating DON from silages and concentrate feed, to differences in absorption rates driven by diet-induced variable physico-chemical chyme conditions or to variable ruminal turnover rates. It has been shown that ZEN was degraded to beta-ZEL less efficiently when the DMI of cows increased, which is equivalent to a reduced ruminal retention time of ingesta (i.e., higher turnover rate) or, in other words, a reduced time not only for the fermentation of nutrients but also for metabolism for mycotoxins. However, as ruminal pH is largely influenced by the concentrate feed proportion and also by the level of DMI, pH effects on toxin metabolism have to be considered in the interpretation. Zearalenones are probably subject to pH-dependent reduction–oxidation steady states [85]. Such effects might also be responsible for the more efficient transfer of ZEN to the milk of cows fed rations with low concentrate feed proportions irrespective of silage type. The total ZEN residue concentrations in milk were shown to increase in a dose-dependent manner, with maximum concentrations of 1.08 ng/mL corresponding to a dietary ZEN concentration of 581 µg/kg at 88% DM [34]. In contrast, the dietary ZEN contamination level of the rations fed in the present experiment varied between 1–10 µg/kg at a DM content of 88% and reflected a typical practical situation. Under these conditions the ZEN residue levels in milk reached maximum concentrations of 0.2 ng/mL. Thus, the relative transfer from feed to milk (carry-over rate) appeared to be higher at low dietary background contamination and reached levels up to 1.0% compared to 0.75% at artificially fortified dietary ZEN levels. Model calculations revealed that the consumption of 1500 g milk/d by humans would contribute to 4% of the tolerable ZEN intake of 0.25 µg/kg BW per day when a median background ZEN concentration of 58 µg/kg feed was assumed [86]. These calculations demonstrate that the milk contamination levels detected in the present experiment are of no concern with regard to food safety.
The presence of lasiocarpin in both silage types is considered to result from weed contamination as this substance is a secondary plant metabolite and belongs to the group of pyrrolizidine alkaloids (PA) mainly formed by plant families other than Poaceae [87,88] although it has been recently shown that other types of PA are also synthesized by cool-season grasses [89]. Lasiocarpin levels were not reported for 252 evaluated/analyzed forage and roughage samples although this PA is considered as one of the most toxic ones [88].

4.2. Dietary Effects on Rumen, Hindgut and General Health and Performance

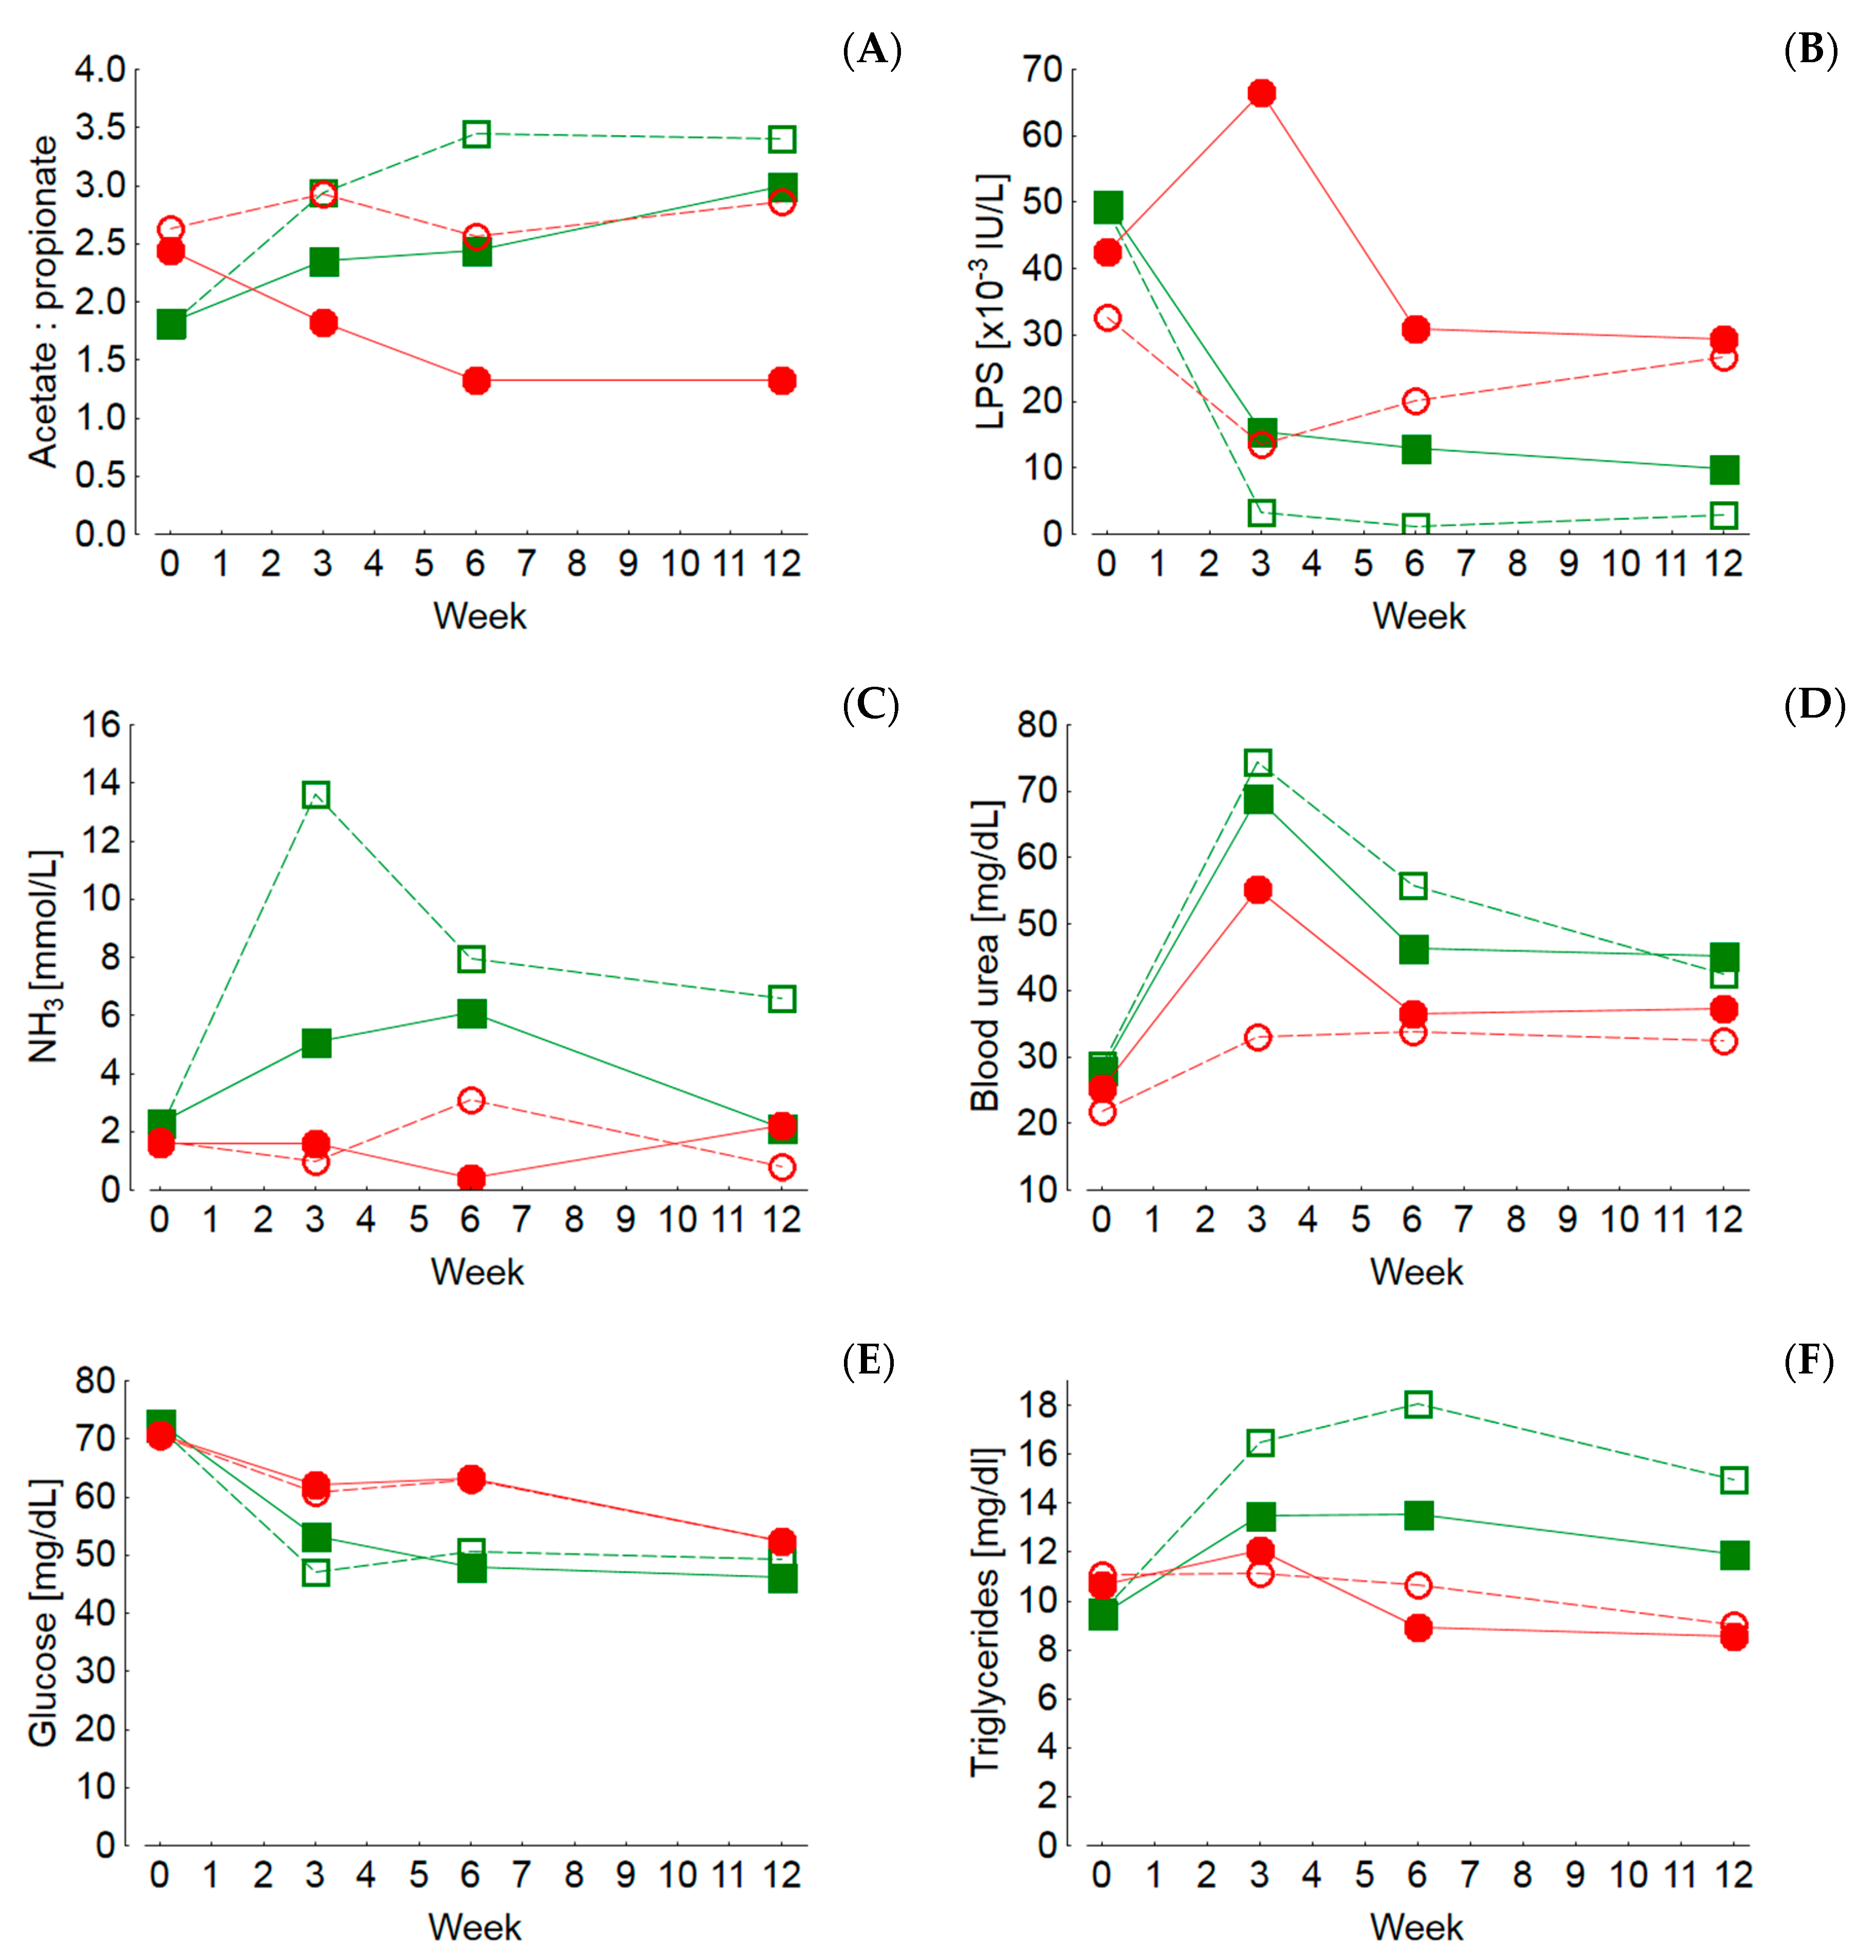
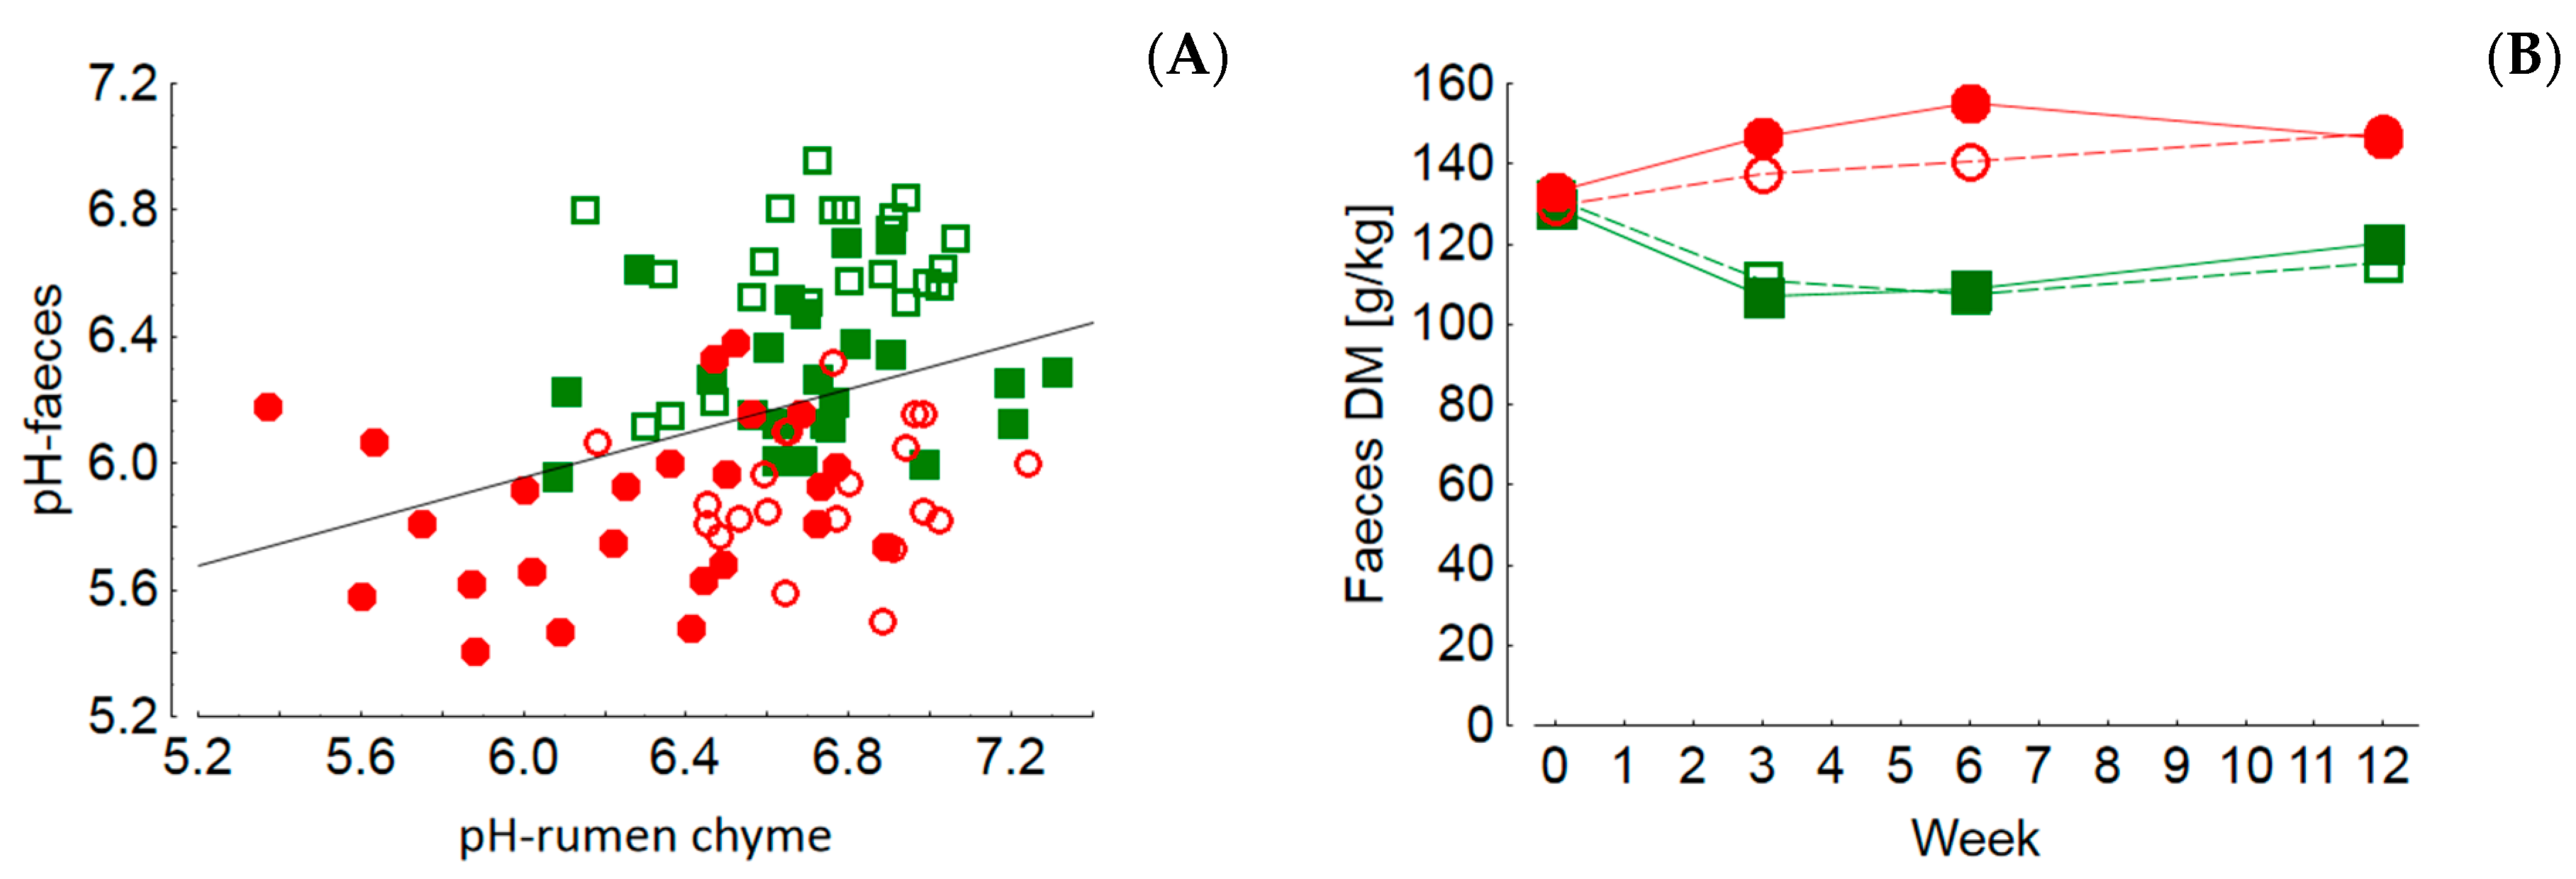
The pH values of rumen chyme and also of rectal feces were higher in cows fed diets with lower concentrate feed portions which also reflects differences in fermentation pattern and microbial communities. Low pH values of rumen chyme and rectal feces, as detected in cows fed rations with high concentrate feed portions, are indicators of rumen and hindgut acidosis, respectively [90,91,92,93], and suggest a significant ruminal bypass of starch reaching the hindgut [90]. While for rumen pH various threshold values were defined to indicate subacute ruminal acidosis (SARA), e.g., lower than 5.6 on an average basis, the associations between pH decline and hindgut acidosis (HGA) are currently poorly defined [93]. We used an oral rumen probe to collect rumen chyme, a procedure which is critically discussed due to possible saliva contamination and uncertainties with regard to a standardized collection site [90,91,94]. Therefore, we can only assume that the pH values which were measured in the present study represented a mean value systematically adulterated by the method used. However, comparing the pH values between the experimental groups within the present study, we found clear associations with diet features, resulting in the lowest pH values in groups fed MS, particularly in combination with the high concentrate feed proportion. Looking at the individual data pairs relating rumen to rectal pH values, this conclusion is substantiated by a distinct cluster characterized by both low ruminal and fecal pH values in the maize-60 group. Although the mean ruminal pH value of 6.2 is not indicative in SARA, further parameters recorded in the experiment support the notion that cows of this group most probably suffered from SARA. A severe milk fat depression characterized by a milk fat content of 2.15% and a milk fat to milk protein ratio (FPR) of 0.66 was found in this group. An FPR of <1.0 is regarded as a reliable indicator for SARA, particularly in late-lactating cows [90,95]. Also, the lower urea concentration in milk and blood and the higher molar proportion of ruminal propionate along with the higher blood glucose level and the distinctly higher ruminal propionate proportion and LPS concentration support the conclusion that SARA was present in the maize-60 group. Further blood biochemical and hematological traits have been described to be unresponsive to the presence of SARA, which was also the case in the present experiment. For example, the liver lesion-indicating enzymes GLDH, GGT and ASAT were not only increased in the maize-60 group but also in the grass-60 group, compared to the groups fed the diets with the low concentrate feed proportion. Therefore, the treatment-related effects on the liver were most probably not related to SARA but rather to concentrate feed portion-induced effects such as DMI which was generally stimulated due to higher dietary energy contents. The increased nutrient flow needed finally to be processed by the liver. Thus, the increased peripheral activities of hepatocellular lesion-indicating enzymes might just reflect a generally increased quantitative hepatic metabolic load.
Based on the discussed parameters it might be concluded that marked differences in the energy supply induce more pronounced physiological adaptations than the presence of SARA, as detected in the maize-60 group. Acute ruminal acidosis but also SARA and hindgut acidosis have been associated with compromised epithelial barriers, facilitating LPS transfer to the liver and eventually to the systemic circulation, thus giving rise to the induction of an acute phase reaction and systemic inflammation in ruminants [17,18,19,20]. Haptoglobin is regarded as one of the main bovine acute phase proteins [96]; consequently, it is a possible indicator molecule for the presence and severity of SARA [97]. However, in the present experiment the distinctly higher ruminal LPS concentration and the presence of SARA in the maize-60 group did not result in distinctly higher peripheral haptoglobin levels compared to all other groups. Total blood granulocytes increased (weakly) linearly with haptoglobin levels, which can be interpreted as indicative of the progression of a pro-inflammatory situation.
Lower hindgut pH values as observed in the MS-fed groups are probably based on an increased flow of starch to the large intestine due to resistance to ruminal degradation and/or to limitations on small intestinal starch digestion and glucose absorption [5,6,7]. Therefore, the lowered pH values result from forced hindgut starch fermentation and from the associated microbial adaptations. It has been shown that the fecal microbial phyla Firmicutes and Bacteriodetes decrease and increase with the fecal starch content of cattle, respectively, while Proteobacteria remain unrelated to starch content [13]. Enterobacteriaceae are a large family within the phylum Proteobacteria and comprise members relevant to human health such as E. coli which were shown to be increased in the colonic region with increasing grain and consequently starch content in feed [15,16]. Shiga toxin-producing E. coli (STEC), which are also referred as to verocytotoxigenic E. coli (VTEC), are a pathotype of enteric E. coli that also include the enterohaemorrhagic E. coli (EHEC) category [98]. Shiga toxins (Stx), and more specifically Stx1 and Stx2, are virulence factors of the EHEC subgroup associated with human infections eventually resulting in severe clinical outcomes such as hemorrhagic colitis (HC) and hemolytic uremic syndrome (HUS). Cattle are regarded as the most important animal EHEC reservoir and human infection source since 65 out of 373 STEC serotypes isolated from cattle feces or hides were detected in human HUS patients [99]. Control measures are required to assure the safety of beef and dairy products [98,99,
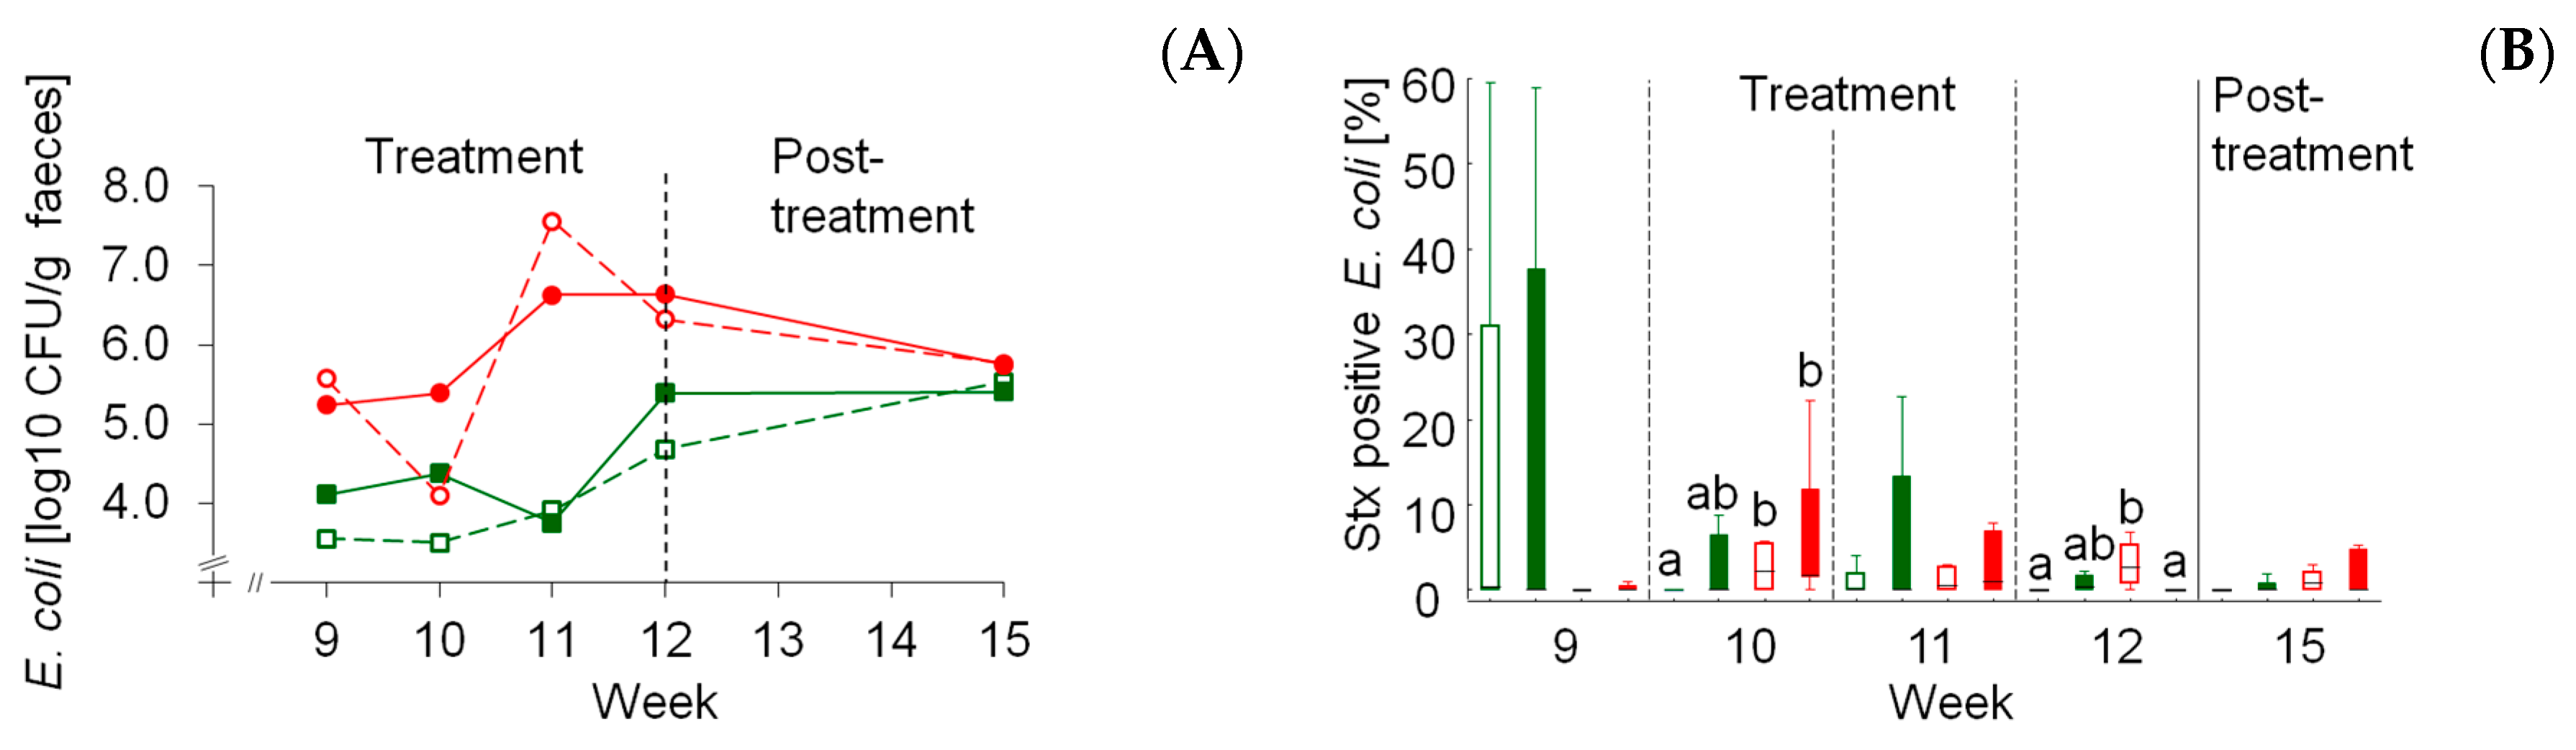
100]. The present results clearly demonstrate the effects of diet composition on total fecal E. coli counts and that the starch source was the dominating factor rather than the dietary concentrate feed proportion. Both MS-based rations increased E. coli counts similarly irrespective of concentrate feed portion. The main influence of diet composition on total fecal E. coli became obvious by comparable counts after switching all four experimental groups to a similar post-treatment diet consisting of a moderate portion of MS. The prevalence of stx-positive E. coli dependent on maize starch was less clear but also suggested a trend for higher proportions of total E. coli. The risk for human infections is further increased by the fact that E. coli resistant to low pH, and thereby capable of escaping the low pH of the human stomach, are triggered by low colonic pH in cows which in turn is due to an enhanced inflow of undigested starch [15].
Besides these food safety aspects, the MS-driven rise in hindgut E. coli counts might also correlate with higher LPS concentrations, increasing the probability of transepithelial transfer and the discussed consequences for systemic inflammation and the health of the cow. Although the relative abundance of Firmicutes decreased with fecal starch content in cattle [13], individual genera of this phylum, such as Clostridium sensu stricto 1, were shown to be increased after feeding rations with high grain portions in the colon of sheep [17]. Moreover, besides Clostridium sensu stricto 1, Prevotella, unclassified Erysipelotrichaceae and Roseburia were also high positively correlated with the ovine colonic mRNA expression of the pro-inflammatory cytokines tumor necrosis factor alpha (TNFα) and interleukin 1 beta (IL-1β), suggesting a role in the pathogenesis of hindgut epithelial inflammation and damage with consequences for LPS translocation. This conclusion is underpinned by the strong negative correlation between colonic pH and the TNFα and IL-1β mRNA expression [17]. Besides the fact that undigested starch-triggered hindgut proliferation of Clostridium spp. is generally seen as critical with regard to the epithelial integrity and possible development of enteric diseases [17], C. botulinum especially gained particular attention as putatively causative for the development of so-called visceral botulism [101], a poorly defined designation for a chronically ill cow. In view of the diet-triggered starch flow to the large intestine that might stimulate passaging C. botulinum to proliferate and to produce toxins causative for botulism, we were interested in whether high concentrate feed portions would increase the presence of BoNT genes in rectal feces, particularly when combined with GS which was repeatedly reported as a carrier for C. botulinum [8,9] gained from soil particles attached to the silage. Furthermore, it was shown that proteolytic strains of C. botulinum types A and B were capable of toxin production with grass as a substrate [102]. Further in vitro studies by these authors employing varying water activities and pH values suggested that C. botulinum might proliferate and synthesize toxins in wilted GS. However, in the present experiment none of the tested toxin genes could be detected in either fecal sample, making it clear that both feed materials and gut content were putatively free of C. botulinum carrying the investigated toxin genes. Chronic illness of cows has also been observed after feeding GS with tP contents of less than 40% [103,104] when the method according to Barnstein is used. Lower tP contents mainly result from a higher extent of proteolysis and are accompanied by increasing proportions of products of proteolysis such as biogenic amines, GABA and ammonia, which are collectively termed as non-protein nitrogen (NPN) compounds. In the present experiment the tP content was determined by two methods which yielded distinctly different results, although the negligible differences between MS and GS remained comparable. Taking the tP results according to Barnstein, the requested tP content of more than 50% [104] was clearly met in the present experiment. However, it needs to be stressed that tP contents are highly variable and additionally also dependent on sample preparation, such as the drying method (oven vs. freeze-drying) and oven drying temperature [105]. Although tP determination is easy to perform, the results provide only an indirect measure of the degree of proteolysis. Moreover, the composition of the proteolysis products remains unknown, which hampers the interpretation of the biological effects. In view of biogenic amines and GABA being low molecular weight substances (covered by crude protein fraction A: NPN) with potent biological activity, it should not be neglected that variations in dietary intake might disturb the steady state between their synthesis and exogenous supply, degradation and elimination with consequences for local and effective concentrations [106]. Given their pharmacological potential, excessive intake of these substances might result in many toxicological effects mainly concerning the nervous and blood circulatory systems [11,106,107]. Variations in exogenous supply might result from the excessive proteolysis of silages with poor quality [12] but also from ruminal synthesis driven by high concentrate feed portions [108]. It was shown that the SARA challenge does not only increase the ruminal formation of histamine but also its concentration in the circulation. Increased histamine concentration in the microcirculation of the claw region has been discussed as pathogenetically relevant for the development of bovine laminitis [109]. Although we did not monitor lameness systematically in the present experiment, possible subclinical effects, particularly in the maize-60 group, which was clearly affected by SARA, cannot be excluded. Moreover, recently it has been demonstrated in vitro that histamine is capable of inducing an inflammatory response of rumen epithelium mediated by the NF-κB pathway [110]. Hence, histamine could be a contributing factor for SARA-associated rumen epithelial lesions, LPS transfer and systemic inflammation as discussed above. Besides, at higher concentrations up to 40 g amines/kg DM, a depression in DM intake has been concluded from a literature survey [12]. On the other hand, increasing doses of rumen-protected GABA stimulated DMI at doses between 0.3 and 0.91 g/d to the same extent. These doses corresponded to the estimated effective doses available at the duodenum. When related to DMI these doses corresponded to concentrations between 0.01 and 0.04 g duodenal available GABA/kg DM. Compared to the calculated GABA concentrations of grass-20 (3.1 g/kg DM), grass-60 (1.5 g/kg DM), maize-20 (2.1 g/kg DM) and maize-60 (1.1 g/kg DM) rations fed in the present experiment, these levels appear to be small but might suggest that most of the GABA present in feed in an unprotected form might be effectively degraded by rumen microbiota. On the other hand, it could also be concluded that even small amounts of GABA escaping rumen degradation might effectively influence DMI regulation and other metabolic processes. For the current study, treatment effects on DMI in combination with the calculated GABA contents of the rations did not suggest any effect of GABA.
Besides the potential adverse effects of biogenic amines, the generally higher nitrogen turnover of cows fed GS-based rations might have an impact on health and production traits. Ingested nitrogenous compounds are utilized to produce ammonia and microbial protein by rumen microbiota when the energy supply is sufficient for the energy-consuming process of protein synthesis. In cases of an energy deficit, excess ammonia is either absorbed and metabolized to urea by the liver or delivered to the small and large intestines when the rumen ammonia absorption capacity is exceeded. The nitrogen excess in GS-fed cows relative to MS-fed ones is reflected in the higher RNB, higher blood and milk urea levels and the lower DM content of the feces. The latter was discussed to be the result of an increased ammonia flow to the hindgut giving rise to epithelial irritation and consecutive stimulated motility, ultimately leading to less dewatered feces [8]. Higher concentrate feed portions decreased the urea content in milk and concomitantly increased the protein content which underlines the dependency of microbial and finally milk protein synthesis from the energy supply. This effect occurred at a much lower level in the MS-fed groups, and the absolute milk urea contents in these groups indicated a nitrogen deficiency. It needs to be stressed that the discussed aspects on nitrogen turnover are rather comparative; in absolute terms only the milk composition of the grass-20 group indicated an optimum nitrogen and energy supply.

5. Conclusions

In the present experiment we investigated the effects of feeding GS and MS combined with a low or high concentrate feed portion to late-lactating dairy cows on some aspects related to animal health (rumen and hindgut, mycotoxins, biogenic amines, C. botulinum) and performance and to food safety (DON and ZEN residues in milk, stx-positive E. coli in feces):
  • Feeding of MS with 60% concentrate feed induced SARA without clear effects on blood haptoglobin as an indicator of systemic inflammation.
  • MS was contaminated by a broader spectrum of pre-harvest mycotoxins and other metabolites compared to GS. Due to a lack of information on the relevance of most of these compounds, a risk evaluation could only be performed for DON and ZEN. Their residues in physiological specimens (blood, milk) mirrored the variations in the experimental diets at a low background level. ZEN and DON residue levels in milk were not of concern for food safety.
  • The concentrations of biogenic amines and of GABA were higher in GS compared to MS. Based on their different contents in the experimental diets no effects on DMI could be detected.
  • The lack of BoNT genes A, B, C, D, E and F in rectal feces might reflect the absence of the corresponding C. botulinum strains in feedstuffs.
  • The obvious positive association between maize feedstuffs, total and stx-positive E. coli counts in feces should be considered as a potential risk of contamination of dairy products whereby food safety could be compromised.
An integrative assessment of the recorded parameters using PCA showed that the fat to protein ratio, fat percentage and urea content in milk, acetate and propionate proportion in rumen chyme were more important in the newly extracted variable PC 1 than all other traits. Based on the clear treatment effects on each of these parameters, their loadings on PC 1 resulted in a clear separation of experimental groups into distinct clusters with the maize-60 group forming a cluster more distant from the clusters built by the other groups. Other parameters were of less relevance for the clustering of the groups.
Taken collectively, the higher content of rumen-resistant starch in MS and other maize-derived feedstuffs was the main driving force for the observed adverse effects on hindgut suggesting an increased risk for acidosis and E. coli proliferation and toxin formation. Consequently, maize feedstuff (silage, grains, starch-containing byproducts)-dominated rations for dairy cows should be avoided to reduce adverse effects on health and food safety.

Author Contributions

The experiment was designed by S.D., U.M.; Analyses of the samples and validation of data were done by S.K., J.F., J.S., C.S., H.N., L.G., K.M., W.R., G.B., H.S., M.S.; Experiment and sample collection were performed by J.K., S.K., J.F., L.G.; Resources were looked up by S.D.; Curation, preparation and visualization of data was done by S.D.; Writing (original draft preparation) was performed by S.D.; Editing was done by S.D. All authors have read and agreed to the published version of the manuscript.

Funding

This research received no external funding.

Acknowledgments

The authors thank co-workers from all involved institutions for their support in taking care of the animals, sample and data collection and analyses.

Conflicts of Interest

The authors declare no conflict of interest.

References

  1. Wilkinson, J.M.; Rinne, M. Highlights of progress in silage conservation and future perspectives. Grass Forage Sci. 2018, 73, 40–52. [Google Scholar] [CrossRef]
  2. Storm, I.M.L.D.; Sørensen, J.L.; Rasmussen, R.R.; Nielsen, K.F.; Thrane, U. Mycotoxins in silage. Stewart Postharvest Rev. 2008, 4. [Google Scholar] [CrossRef]
  3. Driehuis, F. Silage and the safety and quality of dairy foods: A review. Agric. Food Sci. 2013, 22, 16–34. [Google Scholar] [CrossRef]
  4. Ogunade, I.M.; Martinez-Tuppia, C.; Queiroz, O.C.M.; Jiang, Y.; Drouin, P.; Wu, F.; Vyas, D.; Adesogan, A.T. Silage review: Mycotoxins in silage: Occurrence, effects, prevention, and mitigation. J. Dairy Sci. 2018, 101, 4034–4059. [Google Scholar] [CrossRef]
  5. Khan, N.A.; Yu, P.; Ali, M.; Cone, J.W.; Hendriks, W.H. Nutritive value of maize silage in relation to dairy cow performance and milk quality. J. Sci. Food Agric. 2015, 95, 238–252. [Google Scholar] [CrossRef]
  6. Matthé, A.; Lebzien, P.; Hric, I.; Flachowsky, G. Influence of prolonged adaptation periods on starch degradation in the digestive tract of dairy cows. Anim. Feed Sci. Technol. 2003, 103, 15–27. [Google Scholar] [CrossRef]
  7. Matthé, A.; Lebzien, P.; Hric, I.; Flachowsky, G.; Sommer, A. Effect of starch application into the proximal duodenum of ruminants on starch digestibility in the small and total intestine. Arch. Tierernähr. 2001, 55, 351–369. [Google Scholar] [CrossRef]
  8. Wilkinson, J.M. Silage and animal health. Nat. Toxins 1999, 7, 221–232. [Google Scholar] [CrossRef]
  9. Lindström, M.; Myllykoski, J.; Sivela, S.; Korkeala, H. Clostridium botulinum in cattle and dairy products. Crit. Rev. Food Sci. Nutr. 2010, 50, 281–304. [Google Scholar] [CrossRef]
  10. Driehuis, F.; Wilkinson, J.M.; Jiang, Y.; Ogunade, I.; Adesogan, A.T. Silage review: Animal and human health risks from silage. J. Dairy Sci. 2018, 101, 4093–4110. [Google Scholar] [CrossRef]
  11. Ladero, V.; Calles-Enriquez, M.; Fernandez, M.; Alvarez, M.A. Toxicological effects of dietary biogenic amines. Curr. Nutr. Food Sci. 2010, 6, 145–156. [Google Scholar] [CrossRef]
  12. Scherer, R.; Gerlach, K.; Südekum, K.H. Biogenic amines and gamma-amino butyric acid in silages: Formation, occurrence and influence on dry matter intake and ruminant production. Anim. Feed Sci. Technol. 2015, 210, 1–16. [Google Scholar] [CrossRef]
  13. Shanks, O.C.; Kelty, C.A.; Archibeque, S.; Jenkins, M.; Newton, R.J.; McLellan, S.L.; Huse, S.M.; Sogin, M.L. Community structures of fecal bacteria in cattle from different animal feeding operations. Appl. Environ. Microbiol. 2011, 77, 2992–3001. [Google Scholar] [CrossRef] [PubMed] [Green Version]
  14. Callaway, T.R.; Elder, R.O.; Keen, J.E.; Anderson, R.C.; Nisbet, D.J. Forage feeding to reduce preharvest Escherichia coli populations in cattle, a review. J. Dairy Sci. 2003, 86, 852–860. [Google Scholar] [CrossRef] [Green Version]
  15. Diez-Gonzalez, F.; Callaway, T.R.; Kizoulis, M.G.; Russell, J.B. Grain feeding and the dissemination of acid-resistant Escherichia coli from cattle. Science 1998, 281, 1666–1668. [Google Scholar] [CrossRef] [Green Version]
  16. Dänicke, S.; Meyer, U.; Geue, L. Dynamics of total and Shiga-toxin (Stx) forming Escherichia coli shedding with faeces of dairy cows experiencing a change from a low to a high caloric diet. J. Verbrauch. Lebensm. 2015, 10, 23–28. [Google Scholar] [CrossRef]
  17. Wang, Y.; Xu, L.; Liu, J.H.; Zhu, W.Y.; Mao, S.Y. A High Grain Diet Dynamically Shifted the Composition of Mucosa-Associated Microbiota and Induced Mucosal Injuries in the Colon of Sheep. Front. Microbiol. 2017, 8, 2080. [Google Scholar] [CrossRef] [Green Version]
  18. Liu, J.; Xu, T.; Zhu, W.; Mao, S. High-grain feeding alters caecal bacterial microbiota composition and fermentation and results in caecal mucosal injury in goats. Br. J. Nutr. 2014, 112, 416–427. [Google Scholar] [CrossRef] [Green Version]
  19. Li, S.; Khafipour, E.; Krause, D.O.; Kroeker, A.; Rodriguez-Lecompte, J.C.; Gozho, G.N.; Plaizier, J.C. Effects of subacute ruminal acidosis challenges on fermentation and endotoxins in the rumen and hindgut of dairy cows. J. Dairy Sci. 2012, 95, 294–303. [Google Scholar] [CrossRef]
  20. Ye, H.; Liu, J.; Feng, P.; Zhu, W.; Mao, S. Grain-rich diets altered the colonic fermentation and mucosa-associated bacterial communities and induced mucosal injuries in goats. Sci. Rep. 2016, 6, 20329. [Google Scholar] [CrossRef] [Green Version]
  21. Universität Hohenheim. DLG-Futterwerttabellen Wiederkäuer; DLG-Verlag: Frankfurt am Main, Germany, 1997. [Google Scholar]
  22. Edmonson, A.J.; Lean, I.J.; Weaver, L.D.; Farver, T.; Webster, G. A Body Condition Scoring Chart for Holstein Dairy-Cows. J. Dairy Sci. 1989, 72, 68–78. [Google Scholar] [CrossRef]
  23. Geishauser, T. An instrument for collection and transfer of ruminal fluid and for administration of water soluble drugs in adult cattle. Bov. Pract. 1993, 27, 38–42. [Google Scholar]
  24. Naumann, C.; Bassler, R. Die Chemische Untersuchung von Futtermitteln; Darmstadt VDLUFA-Verlag: Darmstadt, Germany, 1993. [Google Scholar]
  25. Licitra, G.; Hernandez, T.M.; Van Soest, P.J. Standardization of procedures for nitrogen fractionation of ruminant feeds. Anim. Feed Sci. Technol. 1996, 57, 347–358. [Google Scholar] [CrossRef]
  26. Salazar, M.T.; Smith, T.K.; Harris, A. High-performance liquid chromatographic method for determination of biogenic amines in feedstuffs, complete feeds, and animal tissues. J. Agric. Food Chem. 2000, 48, 1708–1712. [Google Scholar] [CrossRef] [PubMed]
  27. Sulyok, M.; Stadler, D.; Steiner, D.; Krska, R. Validation of an LC-MS/MS-based dilute-and-shoot approach for the quantification of >500 mycotoxins and other secondary metabolites in food crops: Challenges and solutions. Anal. Bioanal. Chem. 2020, 412, 2607–2620. [Google Scholar] [CrossRef] [PubMed] [Green Version]
  28. Schneweis, I.; Meyer, K.; Hormansdorfer, S.; Bauer, J. Metabolites of Monascus ruber in silages. J. Anim. Physiol. Anim. Nutr. 2001, 85, 38–44. [Google Scholar] [CrossRef] [PubMed]
  29. Schneweis, I.; Meyer, K.; Hörmansdorfer, S.; Bauer, J. Mycophenolic acid in silage. Appl. Environ. Microbiol. 2000, 66, 3639–3641. [Google Scholar] [CrossRef] [Green Version]
  30. Ostertag, J. Nachweis und Vorkommen von Aspergillus fumigatus-Toxinen in Gras- und Maissilagen; Technische Universität München: Munich, Germany, 2010; p. 141. [Google Scholar]
  31. Verband Deutscher Landwirtschaftlicher Untersuchungs- und Forschungsanstalten. Bestimmung von Zearalenon nach Immunaffinitätssäulenreinigung—HPLC-Verfahren; VDLUFA-Verlag: Darmstadt, Germany, 2006. [Google Scholar]
  32. Oldenburg, E.; Bramm, A.; Valenta, H. Influence of nitrogen fertilization on deoxynivalenol contamination of winter wheat—Experimental field trials and evaluation of analytical methods. Mycotox. Res. 2007, 23, 7–12. [Google Scholar] [CrossRef]
  33. Brezina, U.; Valenta, H.; Rempe, I.; Kersten, S.; Humpf, H.U.; Dänicke, S. Development of a liquid chromatography tandem mass spectrometry method for the simultaneous determination of zearalenone, deoxynivalenol and their metabolites in pig serum. Mycotox. Res. 2014, 30, 171–186. [Google Scholar] [CrossRef]
  34. Winkler, J.; Kersten, S.; Valenta, H.; Meyer, U.; Engelhardt, G.; Dänicke, S. Development of a multi-toxin method for investigating the carry-over of zearalenone, deoxynivalenol and their metabolites into milk of dairy cows. Food Addit. Contam. 2015, 32, 371–380. [Google Scholar]
  35. Winkler, J.; Kersten, S.; Meyer, U.; Engelhardt, U.; Dänicke, S. Residues of zearalenone (ZEN), deoxynivalenol (DON) and their metabolites in plasma of dairy cows fed Fusarium contaminated maize and their relationships to performance parameters. Food Chem. Toxicol. 2014, 65, 196–204. [Google Scholar] [CrossRef] [PubMed]
  36. Winkler, J.; Gödde, J.; Meyer, U.; Frahm, J.; Westendarp, H.; Dänicke, S. Fusarium toxin-contaminated maize in diets of growing bulls: Effects on performance, slaughtering characteristics, and transfer into physiological liquids. Mycotoxin Res. 2016, 32, 127–135. [Google Scholar] [CrossRef] [PubMed]
  37. Verband Deutscher Landwirtschaftlicher Untersuchungs- und Forschungsanstalten. Methode 28.1.4 Verfahrensanweisung zur mikrobiologischen Qualitätsbeurteilung. In Handbuch der Landwirtschaftlichen Versuchs- und Untersuchungsmethodik (VDLUFA-Methodenbuch), Band III, Die Untersuchung von Futtermitteln, 3. Auflage; VDLUFA-Verlag: Darmstadt, Germany, 2012. [Google Scholar]
  38. Geissler, C.; Hoffmann, M.; Hickel, B. Ein Beitrag zur gaschromatographischen Bestimmung flüchtiger Fettsäuren. Arch. Tierernähr. 1976, 76, 123–129. [Google Scholar] [CrossRef]
  39. Anonymous. DIN 38406-E5-2. In Deutsche Einheitsverfahren zur Wasser-, Abwasser-und Schlammuntersuchung. 40. Lieferung; Wiley-VCH Weinheim: Weinheim, Germany, 1998. [Google Scholar]
  40. Schmidt, N.; Barth, S.A.; Frahm, J.; Meyer, U.; Dänicke, S.; Geue, L.; Menge, C. Decreased STEC shedding by cattle following passive and active vaccination based on recombinant Escherichia coli Shiga toxoids. Vet. Res. 2018, 49, 28. [Google Scholar] [CrossRef] [Green Version]
  41. Geue, L.; Segura-Alvarez, M.; Conraths, F.J.; Kuczius, T.; Bockemühl, J.; Karch, H.; Gallien, P. A long-term study on the prevalence of shiga toxin-producing Escherichia coli (STEC) on four German cattle farms. Epidemiol. Infect. 2002, 129, 173–185. [Google Scholar] [CrossRef] [PubMed]
  42. Takeshi, K.; Fujinaga, Y.; Inoue, K.; Nakajima, H.; Oguma, K.; Ueno, T.; Sunagawa, H.; Ohyama, T. Simple method for detection of Clostridium botulinum type A to F neurotoxin genes by ploymerase chain reaction. Microbiol. Immunol. 1996, 40, 5–11. [Google Scholar] [CrossRef]
  43. Fohler, S.; Discher, S.; Jordan, E.; Seyboldt, C.; Klein, G.; Neubauer, H.; Hoedemaker, M.; Scheu, T.; Campe, A.; Jensen, K.C.; et al. Detection of Clostridium botulinum neurotoxin genes (A–F) in dairy farms from Northern Germany using PCR: A case-control study. Anaerobe 2016, 39, 97–104. [Google Scholar] [CrossRef]
  44. Hiss, S.; Weinkauf, C.; Hachenberg, S.; Sauerwein, H. Relationship between metabolic status and the milk concentrations of haptoglobin and lactoferrin in dairy cows during early lactation. J. Dairy Sci. 2009, 92, 4439–4443. [Google Scholar] [CrossRef] [Green Version]
  45. Moritz, A. Klinische Labordiagnostik in der Tiermedizin. 7. Auflage; Schattauer: Stuttgart, Germany, 2013. [Google Scholar]
  46. Keese, C.; Meyer, U.; Rehage, J.; Spilke, J.; Boguhn, J.; Breves, G.; Dänicke, S. On the effects of the concentrate proportion of dairy cow rations in the presence and absence of a Fusarium toxin-contaminated triticale on cow performance. Arch. Anim. Nutr. 2008, 62, 241–262. [Google Scholar] [CrossRef]
  47. SAS Enterprise Guide (2006–2012) Version 9.4 TS level 1M0; SAS-Institute-Inc.: Cary, NC, USA, 2013.
  48. TIBCO Software Inc. Statistica (Data Analysis Software System), Version 13. Available online: http://statistica.io (accessed on 1 January 2017).
  49. Driehuis, F.; Elferink, S.J.W.H. The impact of the quality of silage on animal health and food safety: A review. Vet. Q. 2000, 22, 212–216. [Google Scholar] [CrossRef]
  50. Tangni, E.K.; Pussemier, L.; Van Hove, F. Mycotoxin Contaminating Maize and Grass Silages for Dairy Cattle Feeding: Current State and Challenges. J. Anim. Sci. Adv. 2013, 3, 492–511. [Google Scholar]
  51. Richter, W.; Zimmermann, M.; Abriel, M.; Schuster, M.; Kölln-Höllrigl, K.; Ostertag, J.; Spiekers, H. Hygiene bayerischer Silagen—Controling am Silo. Schriftenreihe 2009, 9, 1–131. [Google Scholar]
  52. Auerbach, H.; Oldenburg, E.; Weissbach, F. Incidence of Penicillium roqueforti and roquefortine C in silages. J. Sci. Food Agric. 1998, 76, 565–572. [Google Scholar] [CrossRef]
  53. European Food Safety Authority. Scientific Opinion on risks for animal and public health related to the presence of nivalenol in food and feed. EFSA J. 2013, 11, 1–119. [Google Scholar]
  54. European Food Safety Authority. Scientific Opinion on the risks to human and animal health related to the presence of beauvericin and enniatins in food and feed. EFSA J. 2014, 12, 1–174. [Google Scholar]
  55. Mallebrera, B.; Prosperini, A.; Font, G.; Ruiz, M.J. In vitro mechanisms of Beauvericin toxicity: A review. Food Chem. Toxicol. 2018, 111, 537–545. [Google Scholar] [CrossRef] [PubMed]
  56. Albonico, M.; Schutz, L.F.; Caloni, F.; Cortinovis, C.; Spicer, L.J. In vitro effects of the Fusarium mycotoxins fumonisin B1 and beauvericin on bovine granulosa cell proliferation and steroid production. Toxicon 2017, 128, 38–45. [Google Scholar] [CrossRef]
  57. Suzuki, A.; Kanaoka, M.; Isogai, A.; Tamura, S.; Murakoshi, S.; Ichinoe, M. Bassianolide, a new insecticidal cyclodepsipeptide from Beauveria bassiana and Verticillium lecanii. Tetrahedron Lett. 1977, 18, 2167–2170. [Google Scholar] [CrossRef]
  58. Xu, Y.Q.; Rozco, R.; Wijeratne, E.M.K.; Espinosa-Artiles, P.; Gunatilaka, A.A.L.; Stock, S.P.; Molnar, I. Biosynthesis of the cyclooligomer depsipeptide bassianolide, an insecticidal virulence factor of Beauveria bassiana. Fungal Genet. Biol. 2009, 46, 353–364. [Google Scholar] [CrossRef]
  59. Burmeister, H.R.; Bennett, G.A.; Vesonder, R.F.; Hesseltine, C.W. Antibiotic Produced by Fusarium-Equiseti Nrrl-5537. Antimicrob. Agents Chemother. 1974, 5, 634–639. [Google Scholar] [CrossRef] [Green Version]
  60. Yunus, A.W.; Sulyok, M.; Bohm, J. Mycotoxin Cocktail in the Samples of Oilseed Cake from Early Maturing Cotton Varieties Associated with Cattle Feeding Problems. Toxins 2015, 7, 2188–2197. [Google Scholar] [CrossRef] [PubMed] [Green Version]
  61. Weber, J.; Vaclavikova, M.; Wiesenberger, G.; Haider, M.; Hametner, C.; Frohlich, J.; Berthiller, F.; Adam, G.; Mikula, H.; Fruhmann, P. Chemical synthesis of culmorin metabolites and their biologic role in culmorin and acetyl-culmorin treated wheat cells. Org. Biomol. Chem. 2018, 16, 2043–2048. [Google Scholar] [CrossRef] [PubMed] [Green Version]
  62. Rotter, R.G.; Thompson, B.K.; Trenholm, H.L.; Prelusky, D.B.; Hartin, K.E.; Miller, J.D. A preliminary examination of potential Interactions between deoxynivalenol (DON) and other selected Fusarium metabolites in growing pigs. Can. J. Anim. Sci. 1992, 72, 107–116. [Google Scholar] [CrossRef]
  63. Dvorska, J.E.; Surai, P.F.; Speake, B.K.; Sparks, N.H. Effect of the mycotoxin aurofusarin on the antioxidant composition and fatty acid profile of quail eggs. Br. Poult. Sci. 2001, 42, 643–649. [Google Scholar] [CrossRef] [PubMed]
  64. Dvorska, J.E.; Surai, P.F.; Speake, B.K.; Sparks, N.H.C. Antioxidant systems of the developing quail embryo are compromised by mycotoxin aurofusarin. Comp. Biochem. Physiol. C Toxicol. Pharmacol. 2002, 131, 197–205. [Google Scholar] [CrossRef]
  65. Perzborn, M. Mikrobielle und Enzymatische Hydrolyse von Cyclischen Dipeptiden (Diketopiperazine) Sowie Etablierung von Analysemethoden zum Nachweis der Edukte und Produkte. Ph.D. Thesis, Karlsruher Institut für Technologie (KIT), Karlsruhe, Germany, 2012. [Google Scholar]
  66. Borthwick, A.D. 2,5-Diketopiperazines: Synthesis, Reactions, Medicinal Chemistry, and Bioactive Natural Products. Chem. Rev. 2012, 112, 3641–3716. [Google Scholar] [CrossRef]
  67. O’Brien, M.; Nielsen, K.F.; O’Kiely, P.; Forristal, P.D.; Fuller, H.T.; Frisvad, J.C. Mycotoxins and other secondary metabolites produced in vitro by Penicillium paneum Frisvad and Penicillium roqueforti Thom isolated from baled grass silage in Ireland. J. Agric. Food Chem. 2006, 54, 9268–9276. [Google Scholar] [CrossRef] [Green Version]
  68. Uchida, R.; Shiomi, K.; Inokoshi, J.; Tanaka, H.; Iwai, Y.; Omura, S. Andrastin D, novel protein farnesyltransferase inhibitor produced by Penicillium sp FO-3929. J. Antibiot. 1996, 49, 1278–1280. [Google Scholar] [CrossRef]
  69. Shiomi, K.; Uchida, R.; Inokoshi, J.; Tanaka, H.; Iwai, Y.; Omura, S. Andrastins A similar to C, new protein farnesyltransferase inhibitors, produced by Penicillium sp FO-3929. Tetrahedron Lett. 1996, 37, 1265–1268. [Google Scholar] [CrossRef]
  70. Nallan, L.; Bauer, K.D.; Bendale, P.; Rivas, K.; Yokoyama, K.; Horney, C.P.; Pendyala, P.R.; Floyd, D.; Lombardo, L.J.; Williams, D.K.; et al. Protein farnesyltransferase inhibitors exhibit potent antimalarial activity. J. Med. Chem. 2005, 48, 3704–3713. [Google Scholar] [CrossRef]
  71. Head, J.E.; Johnston, S.R. Protein farnesyltransferase inhibitors. Expert Opin. Emerg. Drugs 2003, 8, 163–178. [Google Scholar] [CrossRef] [PubMed]
  72. Rasmussen, R.R.; Rasmussen, P.H.; Larsen, T.O.; Bladt, T.T.; Binderup, M.L. In vitro cytotoxicity of fungi spoiling maize silage. Food Chem. Toxicol. 2011, 49, 31–44. [Google Scholar] [CrossRef] [PubMed]
  73. Zinser, E.W.; Wolf, M.L.; Alexander-Bowman, S.J.; Thomas, E.M.; Davis, J.P.; Groppi, V.E.; Lee, B.H.; Thompson, D.P.; Geary, T.G. Anthelmintic paraherquamides are cholinergic antagonists in gastrointestinal nematodes and mammals. J. Vet. Pharmacol. Ther. 2002, 25, 241–250. [Google Scholar] [CrossRef]
  74. SCCP (Scientific Comitee on Consumer Products). Opinion on Kojic Acid; European Commission, Health & Consumer Protection DG, Directorate C: Public Health and Risk Assessment: Brussels, Belgium, 2008. [Google Scholar]
  75. Nichea, M.J.; Palacios, S.A.; Chiacchiera, S.M.; Sulyok, M.; Krska, R.; Chulze, S.N.; Torres, A.M.; Ramirez, M.L. Presence of Multiple Mycotoxins and Other Fungal Metabolites in Native Grasses from a Wetland Ecosystem in Argentina Intended for Grazing Cattle. Toxins 2015, 7, 3309–3329. [Google Scholar] [CrossRef] [Green Version]
  76. Dong, X.X.; Fu, J.; Yin, X.B.; Cao, S.L.; Li, X.C.; Lin, L.F.; Huyiligeqi; Ni, J. Emodin: A Review of its Pharmacology, Toxicity and Pharmacokinetics. Phytother. Res. 2016, 30, 1207–1218. [Google Scholar] [CrossRef]
  77. Kosalec, I.; Ramic, S.; Jelic, D.; Antolovic, R.; Pepeljnjak, S.; Kopjar, N. Assessment of tryptophol genotoxicity in four cell lines in vitro: A pilot study with alkaline comet assay. Arh. Hig. Rada Toksikol. 2011, 62, 41–49. [Google Scholar] [CrossRef] [PubMed]
  78. Cuq, F.; Herrmanngorline, S.; Klaebe, A.; Rossignol, M.; Petitprez, M. Monocerin in Exserohilum-Turcicum Isolates from Maize and a Study of Its Phytotoxicity. Phytochemistry 1993, 34, 1265–1270. [Google Scholar] [CrossRef]
  79. Escriva, L.; Oueslati, S.; Font, G.; Manyes, L. Alternaria Mycotoxins in Food and Feed: An Overview. J. Food Qual. 2017, 2017, 20. [Google Scholar] [CrossRef] [Green Version]
  80. Sappapan, R.; Sommit, D.; Ngamrojanavanich, N.; Pengpreecha, S.; Wiyakrutta, S.; Sriubolmas, N.; Pudhom, K. 11-Hydroxymonocerin from the Plant Endophytic Fungus Exserohilum rostratum. J. Nat. Prod. 2008, 71, 1657–1659. [Google Scholar] [CrossRef]
  81. Thangavelu, R. Characterization of fusarium oxysporum Schlecht.f.sp. cubense (E.F.Smith) Snyd. & Hans. and Molecular Approaches for the Management of Fusarium Wilt of Banana. Ph.D. Thesis, Tamil Nadu Agricultural University, Coimbatore, India, 2001. [Google Scholar]
  82. Peltola, J.; Ritieni, A.; Mikkola, R.; Grigoriev, P.A.; Pocsfalvi, G.; Andersson, M.A.; Salkinoja-Salonen, M.S. Biological effects of Trichoderma harzianum peptaibols on mammalian cells. Appl. Environ. Microbiol. 2004, 70, 4996–5004. [Google Scholar] [CrossRef] [Green Version]
  83. European Commission. Commission recommendation of 17 August 2006 on the presence of deoxynivalenol, zearalenone, ochratoxin A, T-2 and HT-2 and fumonisins in products intended for animal feeding. Off. J. Eur. Union 2006, 229, 7–9. [Google Scholar]
  84. Keese, C.; Meyer, U.; Valenta, H.; Schollenberger, M.; Starke, A.; Weber, I.A.; Rehage, J.; Breves, G.; Dänicke, S. No carry over of unmetabolised deoxynivalenol in milk of dairy cows fed high concentrate proportions. Mol. Nutr. Food Res. 2008, 52, 1514–1529. [Google Scholar] [CrossRef] [PubMed]
  85. Valenta, H.; Vemmer, H. In vitro-Untersuchungen zum Metabolismus von Zearalenon bei Inkubation mit Pansensaft. In Proceedings of the 18th Mykotoxin Workshop, Kulmbach, Germany, 10–12 June 1996; pp. 185–191. [Google Scholar]
  86. Dänicke, S.; Winkler, J. Invited review: Diagnosis of zearalenone (ZEN) exposure of farm animals and transfer of its residues into edible tissues (carry over). Food Chem. Toxicol. 2015, 84, 225–249. [Google Scholar] [CrossRef] [PubMed]
  87. European Food Safety Authority. Opinion of the Scientific Panel on Contaminants in the Food Chain on a request from the European Commission related to pyrrolizidine alkaloids as undesirable substances in animal feed. EFSA J. 2007, 447, 1–51. [Google Scholar]
  88. European Food Safety Authority. Scientific Opinion on Pyrrolizidine alkaloids in food and feed. EFSA J. 2011, 9, 1–134. [Google Scholar]
  89. Wesseling, A.M.; Demetrowitsch, T.J.; Schwarz, K.; Ober, D. Variability of Pyrrolizidine Alkaloid Occurrence in Species of the Grass Subfamily Pooideae (Poaceae). Front. Plant Sci. 2017, 8, 2046. [Google Scholar] [CrossRef] [Green Version]
  90. Enemark, J.M. The monitoring, prevention and treatment of sub-acute ruminal acidosis (SARA): A review. Vet. J. 2008, 176, 32–43. [Google Scholar] [CrossRef]
  91. Tajik, J.; Nazifi, S. Diagnosis of Subacute Ruminal Acidosis: A Review. Asian J. Anim. Sci. 2011, 5, 80–90. [Google Scholar] [CrossRef] [Green Version]
  92. Abdela, N. Sub-acute Ruminal Acidosis (SARA) and its Consequence in Dairy Cattle: A Review of Past and Recent Research at Global Prospective. Achiev. Life Sci. 2016, 10, 187–196. [Google Scholar] [CrossRef] [Green Version]
  93. Gressley, T.F.; Hall, M.B.; Armentano, L.E. Ruminant Nutrition Symposium: Productivity, digestion, and health responses to hindgut acidosis in ruminants. J. Anim. Sci. 2011, 89, 1120–1130. [Google Scholar] [CrossRef] [Green Version]
  94. Larsen, M.; Hansen, N.P.; Weisbjerg, M.R.; Lund, P. Technical note: Evaluation of the ororuminal FLORA sampling device for rumen fluid sampling in intact cattle. J. Dairy Sci. 2020, 103, 447–450. [Google Scholar] [CrossRef] [PubMed] [Green Version]
  95. Kleen, J.L.; Hooijer, G.A.; Rehage, J.; Noordhuizen, J.P.T.M. Subacute ruminal acidosis (SARA): A review. J. Vet. Med. Ser. A Physiol. Pathol. Clin. Med. 2003, 50, 406–414. [Google Scholar] [CrossRef] [PubMed]
  96. Petersen, H.H.; Nielsen, J.P.; Heegaard, P.M. Application of acute phase protein measurements in veterinary clinical chemistry. Vet. Res. 2004, 35, 163–187. [Google Scholar] [CrossRef] [PubMed] [Green Version]
  97. Zebeli, Q.; Metzler-Zebeli, B.U. Interplay between rumen digestive disorders and diet-induced inflammation in dairy cattle. Res. Vet. Sci. 2012, 93, 1099–1108. [Google Scholar] [CrossRef]
  98. European Food Safety Authority. Scientific Opinion on VTEC-seropathotype and scientific criteria regarding pathogenicity assessment. EFSA J. 2013, 11, 3138. [Google Scholar] [CrossRef]
  99. Hussein, H.S. Prevalence and pathogenicity of Shiga toxin-producing Escherichia coli in beef cattle and their products. J. Anim. Sci. 2007, 85, E63–E72. [Google Scholar] [CrossRef] [Green Version]
  100. Weiss, A.; Schmidt, H.; Stöber, H. Mechanisms of enterohemorrhagic Escherichia coli spread along the food-chain and precautionary measures. J. Verbrauch. Lebensm. 2011, 6, 503–510. [Google Scholar] [CrossRef]
  101. Böhnel, H.; Schwagerick, B.; Gessler, F. Visceral botulism—A new form of bovine Clostridium botulinum toxication. J. Vet. Med. Ser. A Physiol. Pathol. Clin. Med. 2001, 48, 373–383. [Google Scholar] [CrossRef]
  102. Notermans, S.; Kozaki, S.; van Schothorst, M. Toxin production by Clostridium botulinum in grass. Appl. Environ. Microbiol. 1979, 38, 767–771. [Google Scholar] [CrossRef] [Green Version]
  103. Eicken, K.; Höltershinken, M.; Scholz, H. Gesundheitsprobleme beim Einsatz von Grassilagen in Milchviehbeständen—Bedingungen vor Ort und klinische Erscheinungen. In Gesundheitsprobleme beim Einsatz von Grassilagen in Milchviehbeständen—Clostridium botulinum; Ministerium für Landwirtschaft, Umwelt und ländliche Räume des Landes Schleswig-Holstein und Tierärztekammer Schleswig-Holstein, Körperschaft des öffentlichen Rechts (Hrsg.): Husum, Germany, 2010; pp. 24–30. [Google Scholar]
  104. Scholz, H.; Eicken, K.; Höltershinken, M. Versuche zur ätiologischen Klärung der Multifaktorenerkrankung beim Milchvieh. In Gesundheitsprobleme beim Einsatz von Grassilagen in Milchviehbeständen–Clostridium botulinum; Ministerium für Landwirtschaft, Umwelt und ländliche Räume des Landes Schleswig-Holstein und Tierärztekammer Schleswig-Holstein, Körperschaft des öffentlichen Rechts (Hrsg.): Husum, Germany, 2010; pp. 31–33. [Google Scholar]
  105. Meyer, U. Untersuchungen zum Reineiweißgehalt von Grassilagen verschiedener Erntejahre. 123. VDLUFA-KONGRESS. Kurzfassung der Referate; Verband Deutscher Landwirtschaftlicher Untersuchungs-und Forschungsanstalten (VDLUFA): Darmstadt, Germany, 2011; p. 60. [Google Scholar]
  106. Sánchez-Jiménez, F.; Ruiz-Pérez, M.V.; Urdiales, J.L.; Medina, M.A. Pharmacological potential of biogenic amine-polyamine interactions beyond neurotransmission. Br. J. Pharmacol. 2013, 170, 4–16. [Google Scholar] [CrossRef] [Green Version]
  107. Roth, F.C.; Draguhn, A. GABA metabolism and transport: Effects on synaptic efficacy. Neural Plast. 2012, 2012. [Google Scholar] [CrossRef] [PubMed] [Green Version]
  108. Wang, D.S.; Zhang, R.Y.; Zhu, W.Y.; Mao, S.Y. Effects of subacute ruminal acidosis challenges on fermentation and biogenic amines in the rumen of dairy cows. Livest. Sci. 2013, 155, 262–272. [Google Scholar] [CrossRef]
  109. Nocek, J.E. Bovine acidosis: Implications on laminitis. J. Dairy Sci. 1997, 80, 1005–1028. [Google Scholar] [CrossRef]
  110. Sun, X.; Yuan, X.; Chen, L.; Wang, T.; Wang, Z.; Sun, G.; Li, X.; Li, X.; Liu, G. Histamine induces bovine rumen epithelial cell inflammatory response via NF-κB pathway. Cell. Physiol. Biochem. 2017, 42, 1109–1119. [Google Scholar] [CrossRef] [PubMed]
Figure 1. Fungal and other metabolites quantifiable in either maize (black bars) or grass (shaded bars) silage, or in both (µg/kg at 88% DM). Metabolites detected exclusively in maize silage (n = 11) are printed in bold italics, while only kojic acid was solely detected in grass silage.
Dairy 01 00007 g001
Figure 2. Progression of ruminal acetate to propionate ratio (A), lipopolysaccharides (LPS) (B), ammonia (NH3) (C), blood urea (D), glucose (E) and triglycerides (F) depending on silage type and concentrate feed proportion (red circles, maize silage-based rations with 20% (open circles) and 60% (filled circles) concentrate feed; green squares, grass silage-based rations with 20% (open squares) and 60% (filled squares)). Values represent least square means; for statistics see Table 6 and Table 8.
Dairy 01 00007 g002
Figure 3. Associations between individual pH values of feces and chyme (A) (pH feces = 3.86 + 0.35·pH rumen chyme; r2 = 0.122; p < 0.001; n = 121) and feces dry matter (DM) content (B) (least square means; for statistics see Table 6) dependent on silage type and concentrate feed proportion (red circles, maize silage-based rations with 20% (open circles) and 60% (filled circles) concentrate feed; green squares, grass silage-based rations with 20% (open squares) and 60% (filled squares) concentrate feed).
Dairy 01 00007 g003
Figure 4. Total E. coli colony-forming units (for statistics see Table 7) (A) and percentage of stx-positive E. coli colonies (B) (values represent medians, boxes the 25th and 75th percentiles and whiskers minimum and maximum concentrations; ab, distributions which do not share the same superscripts are significantly different within weeks) in rectal feces of cows dependent on silage type and concentrate feed proportion (red circles/bars, maize silage-based rations with 20% (open circles/bars) and 60% (filled circles/bars) concentrate feed; green squares/bars, grass silage-based rations with 20% (open squares/bars) and 60% (filled squares/bars) concentrate feed).
Dairy 01 00007 g004
Figure 5. Haptoglobin concentration in blood (A) (red squares represent medians, boxes the 25th and 75th percentiles and whiskers minimum and maximum concentrations, individual values are depicted; ab, distributions which do not share similar superscripts are different, p < 0.05) and associations between individual blood haptoglobin levels and total granulocytes (B) (r = 0.35, p < 0.01) dependent on silage type and concentrate feed proportion (red circles, maize silage-based rations with 20% (open circles) and 60% (filled circles) concentrate feed; green squares, grass silage-based rations with 20% (open squares) and 60% (filled squares)).
Dairy 01 00007 g005
Figure 6. Blood de-epoxy-deoxynivalenol concentrations related to experiment week (for statistics see Table 7) (A) and to individual deoxynivalenol (DON) exposure (de-epoxy-DON (20% concentrate feed) = −3.75 + 1.35 DON exposure; r2 = 0.531; p < 0.001; n = 58; de-epoxy-DON (60% concentrate feed) = −0.88 + 0.53 DON exposure; r2 = 0.152; p < 0.001; n = 63; slopes are different from zero, p < 0.001, and difference between slopes is significant, p < 0.001) (B), detectable residues of DON and zearalenone (ZEN) in milk (week 12) (C), carry-over rate (COR) (blue bars, ZEN; ochre bars, DON; values represent medians, boxes the 25th and 75th percentiles and whiskers minimum and maximum concentrations; ab, distributions which do not share similar superscripts are different, p < 0.05) (D) and relationship between ZEN concentration in milk and the corresponding CORs (COR ZEN [20% concentrate feed] = 4.00 ZEN; r2 = 0.931; p < 0.001; n = 29; COR ZEN [60% concentrate feed] = 2.16·ZEN; r2 = 0.989; p < 0.001; n = 28; slopes are different from zero, p < 0.001, and difference between slopes is significant, p < 0.001) (E) dependent on silage type and concentrate feed proportion (red circles, maize silage-based rations with 20% (open circles) and 60% (filled circles) concentrate feed; green squares, grass silage-based rations with 20% (open squares) and 60% (filled squares)).
Dairy 01 00007 g006
Figure 7. Principal component (PC) analysis for week 12 of the experiment based on correlations; projection of cases (individual cows) into the two-dimensional space spanned by PC 1 and PC 2 (left) and loadings of individual variables on PC 1 (right) (red circles, maize silage-based rations with 20% (open circles) and 60% (filled circles) concentrate feed; green squares, grass silage-based rations with 20% (open squares) and 60% (filled squares)). Abbreviations: F:p, fat to protein ratio in milk; Fat%, milk fat (%); C2%, acetate (% of total ruminal SCFA); Urea_milk, urea in milk (mg/kg); C2:C3, acetate to propionate ratio in rumen; ph_feces, pH of feces; BHB, beta hydroxy-butyrate in blood; ADF, acid detergent fiber intake (kg/cow/d); pH_rumen, pH of rumen fluid; C4%, butyrate (% of total ruminal SCFA); NDF, neutral detergent fiber intake (kg/cow/d); Alb, albumin in blood (g/L); FCM, fat-corrected milk (kg/cow/d); NEFA, non-esterified fatty acids in blood (mMol/L); Triglyc, triglycerides in blood (mg/dL); RNB, ruminal nitrogen balance (g/d); RNB_ME, RNB to metabolizable energy (g/MJ ME); NH3_rumen, ruminal ammonia (mMol/L); Urea_blood, urea in blood (mg/dL); Lym%, lymphocyte proportion (%); Mo%, monocyte proportion (%); H2O, water intake (kg/d); BW, body weight (kg/d); Prot, protein in blood (g/L); HCT, hematocrit (%); Cholest, cholesterol in blood (mg/dL); iC5%, ruminal isovalerate proportion (%); Prot%, protein in milk (%); AST, aspartate aminotransferase (U/L); WBC, white blood cell count (G/L); Gluc, glucose in blood (mg/dL); Gr%, total granulocyte proportion (%); CP, crude protein intake (kg/cow/d); TMR, total mixed ration intake (kg dry matter/cow/d); Hpt, haptoglobin (µg/mL); SCC, somatic cell count in milk; GGT, gamma glutamyl transferase (U/L); De-DON, de-epoxy-deoxynivalenol in blood (ng/mL); NEL_I, energy intake (MJ net energy lactation/cow/d); Lac%, lactose in milk (%); LPS_rumen, ruminal lipopolysaccharides (IU/L × 10−3); SCFA, ruminal total short-chain fatty acids (mMol/L); GLDH, glutamate dehydrogenase (U/L); DM_feces, dry matter content of feces (%); NEL_bal, energy balance (MJ net energy lactation/cow/d); C5%, ruminal valerate proportion (%); C3%, ruminal propionate proportion (%).
Dairy 01 00007 g007
Table 1. Components of the total mixed ration (TMR; %, based on dry matter (DM)) during treatment (experiment weeks 1–12) and post-treatment period (experiment weeks 13–15).
Experimental Feeding GroupGrass SilageMaize SilageConcentrate Feed AConcentrate Feed BTotal Concentrate Feed
Treatment period
Grass-2080020020
Grass-60400204060
Maize-2008020020
Maize-60040204060
Post-treatment period3030202040
Treatment designations: “Grass” and “Maize” denote grass and maize silage, respectively; “20” and “60” represent the total concentrate feed proportion as %.
Table 2. Ingredients and chemical composition of concentrate feeds and roughages (mean ± standard deviation, n = 3–4).
Concentrate FeedRoughage
ABGrass SilageMaize Silage
Ingredients [g/kg as fed]
Rapeseed meal350105
Wheat195290
Barley100146
Maize200290
Dried sugar beet pulp100146
Calcium carbonate156
Mineral feed *2512
Urea155
Dry matter (DM) [g/kg]881 ± 11876 ± 10317 ± 53355 ± 30
Nutrients [g/kg DM]
Crude ash75 ± 1.045 ± 0.891 ± 12.437 ± 2.5
Crude protein (CP)252 ± 2.7156 ± 5.6130 ± 13.180 ± 4.9
CP-fractions [% of CP] #
A32.7 ± 2.925.6 ± 3.159.9 ± 2.158.7 ± 3.6
B13.0 ± 0.74.3 ± 0.51.5 ± 0.51.9 ± 1.3
B249.9 ± 1.555.7 ± 1.623.9 ± 1.231.0 ± 4.2
B310.8 ± 1.611.4 ± 1.210.4 ± 1.35.5 ± 0.8
C3.6 ± 0.32.9 ± 0.34.2 ± 0.32.8 ± 0.3
True protein (B1+B2+B3+C, tP)67.3 ± 2.974.4 ± 3.140.1 ± 2.141.3 ± 3.7
tP (according to Barnstein)71.1 ± 4.387.3 ± 5.260.8 ± 1.762.9 ± 7.2
tP [g/kg DM]169.7 ± 7.4115.9 ± 9.252.4 ± 7.732.9 ± 4.2
Crude fat33 ± 2.230 ± 4.534 ± 1.131 ± 0.9
Crude fiber82 ± 2.564 ± 2.1285 ± 4.0196 ± 9.5
Acid detergent fiber (ADFom)120 ± 0.689 ± 1.8314 ± 4.0225 ± 10.5
Neutral detergent fiber (aNDFom)261 ± 16.6222 ± 21.5534 ± 21.9432 ± 6.9
MJ net energy lactation (NEL)/kg DM °7.47.96.06.5
Biogenic amines
Putrescine0.06 ± 0.10.09 ± 0.160.35 ± 0.250.00
Cadaverine0.000.000.35 ± 0.490.00
Histamine0.000.000.000.00
Phenylethylamine0.04 ± 0.010.03 ± 0.020.38 ± 0.070.32 ± 0.03
Tryptamine0.000.000.000.00
Tyramine0.000.000.95 ± 0.481.2 ± 0.13
Total biogenic amines0.1 ± 0.090.13 ± 0.152.03 ± 0.781.52 ± 0.16
Gamma-aminobutyric acid (GABA)0.04 ± 0.060.003.85 ± 1.22.63 ± 0.54
Deoxynivalenol [µg/kg at 88% DM]191173132198
Zearalenone [µg/kg at 88% DM]5.67.30.010.6
* Ingredients per kg mineral feed: 140 g Ca, 120 g Na, 70 g P, 40 g Mg, 6 g Zn, 5.4 g Mn, 1 g Cu, 100 mg I, 40 mg Se, 5 mg Co, 1.000.000 international units (IU) vitamin A, 100.000 IU vitamin D3, 1500 mg vitamin E; ° Calculation based on table values [21]; # crude protein (CP)-fractions: A = NPN, non-protein nitrogen, B1 = buffer-soluble protein, B2 = neutral detergent-soluble protein, B3 = acid detergent-soluble protein, C = acid detergent-insoluble protein; Total biogenic amines = putrescine + cadaverine + histamine + phenyletylamine + tryptamine + tyramine.
Table 3. Microbiological evaluation of silages according to the Association of German Agricultural Analytic and Research Institutes [37].
Group (Germ Group (GG), Number)Guidance Values for GG (Colony-Forming Units, CFU/g)MonthCFU/gGerm Count Levels
Product-specific aerobic mesophilic bacteria (1)
Grass silage≤200,000May44,0001
June18,0001
July12,5001
Maize silage≤400,000May56,0001
June45,0001
July40,0001
Spoilage-indicating aerobic mesophilic bacteria (2)
Grass silage≤200,000May18,0001
June19,0001
July14,0001
Maize silage≤200,000May20001
June<5001
July<5001
Spoilage-indicating Sporoactinomyceta (3)
Grass silage≤10,000May<5001
June<5001
July<5001
Maize silage≤30,000May<5001
June<5001
July<5001
Product-specific molds and Dematiaceae (4)
Grass silage≤5000May<5001
June<5001
July<5001
Maize silage≤5000May<5001
June<5001
July<5001
Spoilage-indicating molds and Dematiaceae (5)
Grass silage≤5000May<5001
June<5001
July<5001
Maize silage≤5000May<5001
June<5001
July<5001
Spoilage-indicating Mucorales (6)
Grass silage≤5000May<5001
June<5001
July<5001
Maize silage≤5000May<5001
June<5001
July<5001
Yeasts (7)
Grass silage≤200,000May85,0001
June12001
July<5001
Maize silage≤1,000,000May5,300,0003
June4,700,0002
July28,0001
Table 4. Effect of feeding low or high proportions of concentrate in combination with grass or maize silage on performance parameters and ruminal nitrogen balance during experiment weeks 1 to 12 (least square means, n = 14–15).
Silage Type (S)Concentrate Feed (C, %)BW ° [kg]BCS §DMI [kg/d]Energy Intake [MJ NEL/d]Energy Balance [MJ NEL/d]RNB [g/MJ ME]
Grass206343.1 a17.7 a111.0 a−6.2 a0.13 d
Grass606633.4 b25.0 c179.8 d38.0 c0.10 c
Maize206193.2 a,b17.6 a117.8 b5.1 b−0.43 a
Maize606463.2 a,b22.1 b162.6 c45.1 d−0.13 b
p-values
S 0.0040.666<0.001<0.001<0.001<0.001
C <0.0010.001<0.001<0.001<0.001<0.001
Week (W) 0.9980.212<0.001<0.001<0.001<0.001
S × C 0.861<0.001<0.001<0.0010.099<0.001
S × W 1.0000.917<0.001<0.001<0.001<0.001
C × W 0.9300.2520.0020.001<0.001<0.001
S × C × W 1.0000.8960.6490.7640.931<0.001
PSEM 60.10.21.51.30.003
° BW, Body weight; § BCS, Body condition score; ⱡ DMI, dry matter intake; RNB, ruminal nitrogenbalance; PSEM, pooled standard errors of means; a–d Least square means without common superscripts differ within columns (p < 0.05).
Table 5. Effect of feeding low or high proportions of concentrate in combination with grass or maize silage on milk yield and milk composition during experiment weeks 1 to 12 (least square means, n = 14–15).
Silage Type (S)Concentrate Feed (C, %)Milk Yield [kg/d]Milk Fat [%]Milk Fat [kg/d]Milk Protein [%]Milk Protein [kg/d]Milk Urea [mg/kg]FCM § [kg/d]FPR *SCC [log10/mL]
Grass2024.74.34 c1.07 c3.200.79 a280 d26.1 b1.36 d5.13
Grass6033.13.80 b1.26 d3.451.14 c212 c32.2 c1.10 b5.01
Maize2025.13.87 b0.97 b3.070.77 a95 b24.5 a1.26 c5.21
Maize6032.72.15 a0.71 a3.301.07 b67 a23.6 a0.66 a5.11
p-values
S 0.957<0.001<0.001<0.001<0.001<0.001<0.001<0.0010.007
C <0.001<0.0010.033<0.001<0.001<0.001<0.001<0.0010.001
Week (W) <0.0010.201<0.0010.002<0.001<0.001<0.0010.011<0.001
S × C 0.233<0.001<0.0010.4700.008<0.001<0.001<0.0010.812
S × W 0.9870.0140.4450.8370.596<0.0010.7850.0020.851
C × W 0.1610.9940.3370.5490.001<0.0010.7950.9590.997
S × C × W 0.9820.9740.7960.9920.9550.0730.8860.9710.893
PSEM 0.40.050.020.020.012.50.380.010.03
§ FCM, milk yield corrected for a fat content of 4%; * FPR, Fat to protein ratio of the milk; SCC, somatic cell count, a–d Least square means without common superscripts differ within columns (p < 0.05).
Table 6. Effect of feeding low or high proportions of concentrate in combination with grass or maize silage on ruminal parameters and pH value of the feces during experiment weeks 1 to 12 (least square means, n = 6–8).
Silage Type (S)Concentrate Feed (C, %)pH (Rumen Fluid)NH3 [mMol/L]LPS * [IU/L × 10−3]Total SCFA µ [mMol/L]Acetate (C2) [Mol%]Propionate (C3) [Mol%]C2:C3 Ratio Butyrate [Mol%]Valerate [Mol%]Iso-Valerate [Mol%]pH (Feces)DM (Feces) [g/kg]
Grass206.7 b7.5 c12.776.6 a,b63.1 c23.2 a2.9 c12.0 b0.8 a1.06.6 c116.9
Grass606.8 b3.9 b21.574.5 a,b60.0 b26.5 b2.4 b11.1 b1.4 b1.06.2 b116.7
Maize206.7 b1.6 a25.466.6 a61.6 b,c23.2 a2.8 c13.4 b0.8 a1.06.0 a139.1
Maize606.2 a1.4 a41.481.6 b53.8 a34.0 c1.8 a9.5 a2.1 c0.75.9 a145.7
p-values
S <0.001<0.001<0.0010.595<0.001<0.001<0.0010.8230.0220.265<0.001<0.001
C 0.046<0.0010.0020.019<0.001<0.001<0.001<0.001<0.0010.286<0.0010.230
Week (W) 0.243<0.001<0.0010.0020.0170.0760.0140.3800.0510.0970.0010.234
S × C 0.001<0.0010.3660.0020.002<0.0010.024<0.0010.0210.113<0.0010.145
S × W 0.563<0.0010.0040.109<0.001<0.001<0.0010.0250.0050.9700.003<0.001
C × W 0.0120.0280.0720.0180.0010.0010.0010.0720.0130.596<0.0010.964
S × C × W 0.393<0.0010.1670.0060.0670.0110.0940.1070.0800.0550.3640.463
PSEM 0.10.54.02.70.70.90.10.40.10.10.12.8
* LPS, concentration of free lipopolysaccharides in rumen fluid; µ Total short chained fatty acids (SCFA) in rumen fluid; C2:C3 ratio, acetic acid to propionic acid ratio; a–c Least square means without common superscripts differ within columns (p < 0.05).
Table 7. Effect of feeding low or high proportions of concentrate in combination with grass or maize silage on Escherichia coli colony-forming units (CFU) in rectal feces and on de-epoxy-deoxynivalenol (DON) in blood (least square means, n = 6–8).
Silage Type (S)Concentrate Feed (C, %)E. coli [log10 CFU/g]de-Epoxy-don
wk 9–12wk 15[ng/mL]
Grass203.915.531.78 a
Grass604.415.412.25 a
Maize205.895.764.11 c
Maize605.975.752.93 b
p-values
S <0.0010.542<0.001
C 0.1570.8790.038
Week (W) <0.001 0.007
S × C 0.3230.903<0.001
S × W <0.001 <0.001
C × W 0.048 0.028
S × C × W 0.694 0.002
PSEM 0.200.450.13
a–c Least square means without common superscripts differ within columns (p < 0.05).
Table 8. Effect of feeding low or high proportions of concentrate in combination with grass or maize silage on clinical chemical blood parameters during experiment weeks 1 to 12 (least square means, n = 6–8).
Silage Type (S)Concentrate Feed (C, %)Glucose [mg/dL]BHB ° [mMoL/L]NEFA § [mMoL/L]Cholesterol [mg/dL]Triglycerides [mg/dL]Total Protein [g/L]Albumin [g/L]ASAT [U/L]GGT & [U/L]GLDH ∆ [U/L]Urea [mg/dL]
Grass2054.40.770.22212.7 a14.775.937.471.2 a34.9 a31.850.8 b
Grass6056.00.520.21210.3 a12.077.235.8118.0 b49.0 b57.947.1 b
Maize2061.60.560.20201.9 a10.177.735.389.1 a39.5 a,b24.430.7 a
Maize6062.00.440.21245.0 b9.975.835.097.2 a,b42.1 a,b53.137.9 a
p-values
S <0.001<0.0010.3330.226<0.0010.9090.0810.8410.6690.519<0.001
C 0.579<0.0010.8830.0420.0390.8700.255<0.0010.0040.0040.360
Week (W) <0.0010.0070.0110.0680.0010.0430.0190.0010.0470.143<0.001
S × C 0.7360.0730.5060.0230.0640.4140.4470.0080.0440.8910.006
S × W 0.0130.1740.5650.6910.0040.5870.2950.4840.3370.657<0.001
C × W 0.7470.0010.8050.6880.4820.9560.9980.7910.9960.6130.381
S × C × W 0.8760.1880.6590.9970.8340.9980.9840.9920.9930.9650.127
PSEM 1.80.040.029.80.72.00.97.22.99.52.0
ASAT, aspartate aminotransferase; & GGT, gamma-glutamyltransferase; ∆ GLDH, glutamate dehydrogenase; ° BHB, beta hydroxy-butyrate; § NEFA, non-esterified fatty acids; a–c Least square means without common superscripts differ within columns (p < 0.05).
Table 9. Effect of feeding low or high proportions of concentrate in combination with grass or maize silage on hematological parameters during experiment weeks 1 to 12 (least square means, n = 6–8).
Silage Type (S)Concentrate Feed (C, %)Hematocrit [%]WBC § [G/l]Lymphocytes [G/l]Monocytes [G/l]Granulocytes [G/l]Eosinophils [G/l]
Grass2030.096.35 a2.77 a0.153.25 a1.33
Grass6031.647.48 b3.30 b0.163.85 b0.31
Maize2030.357.07 a,b2.80 a0.133.90 b0.34
Maize6031.486.65 a,b2.84 a0.123.52 a,b0.24
p-values
S 0.9230.8560.0690.2380.4540.246
C 0.0140.2120.0180.9870.6240.224
Week (W) <0.0010.1560.026<0.0010.2810.242
S × C 0.6940.0070.0390.6490.0270.320
S × W 0.8250.4340.3030.8900.3170.248
C × W 0.0020.7560.1770.4980.5160.343
S × C × W 0.1570.1930.3620.3640.2080.312
PSEM 0.540.290.120.020.220.46
§ WBC, White blood cells; a,b Least square means without common superscripts differ within columns (p < 0.05).

